

The ubiquitin-proteasome system is essential for cell cycle progression. Cyclin F is a cell cycle-regulated substrate adapter F-box protein for the Skp1, CUL1, and F-box protein (SCF) family of E3 ubiquitin ligases.
KEYWORDS: cyclin F (CCNF), sirtuin 5 (SIRT5), cell cycle, ubiquitin, metabolism, SCF
ABSTRACT
The ubiquitin-proteasome system is essential for cell cycle progression. Cyclin F is a cell cycle-regulated substrate adapter F-box protein for the Skp1, CUL1, and F-box protein (SCF) family of E3 ubiquitin ligases. Despite its importance in cell cycle progression, identifying cyclin F-bound SCF complex (SCFCyclin F) substrates has remained challenging. Since cyclin F overexpression rescues a yeast mutant in the cdc4 gene, we considered the possibility that other genes that genetically modify cdc4 mutant lethality could also encode cyclin F substrates. We identified the mitochondrial and cytosolic deacylating enzyme sirtuin 5 (SIRT5) as a novel cyclin F substrate. SIRT5 has been implicated in metabolic processes, but its connection to the cell cycle is not known. We show that cyclin F interacts with and controls the ubiquitination, abundance, and stability of SIRT5. We show SIRT5 knockout results in a diminished G1 population and a subsequent increase in both S and G2/M. Global proteomic analyses reveal cyclin-dependent kinase (CDK) signaling changes congruent with the cell cycle changes in SIRT5 knockout cells. Together, these data demonstrate that SIRT5 is regulated by cyclin F and suggest a connection between SIRT5, cell cycle regulation, and metabolism.
INTRODUCTION
Proliferation in eukaryotes is determined by the highly ordered processes of the cell cycle. This is essential for cell and organismal development, wound repair, and cell fate specification. Imprecise execution of signaling events during the cell cycle leads to a loss of genomic integrity in dividing cells. Cell cycle is regulated by various posttranslational signaling pathways, including phosphorylation and ubiquitination. Temporal dynamics in the proteolysis of specific proteins is determined by ubiquitination and the ubiquitin-proteasome system (UPS). The UPS targets proteins for degradation via a three-step enzymatic cascade that culminates in the attachment of ubiquitin and polyubiquitin chains onto specific substrates, targeting them to the proteasome for degradation.
The modular cullin RING family of E3 ubiquitin ligases (CRLs) play a vital role in cell cycle control (1). Among the CRLs, the Skp1, CUL1, and F-box protein (SCF) subfamily members play particularly important roles in the cell cycle due to their ability to mediate the ubiquitination and degradation of several key cell cycle regulatory proteins (2, 3), including regulators of cyclin-dependent kinases (CDKs), DNA replication, cell cycle transcription, and the cytoskeleton (4). F-box proteins are essential components of SCF complexes because of their ability to bind substrates and recruit them to the E3 for ubiquitination. The substrate adapter F-box protein cyclin F is an important cell cycle regulator (5, 6). Recently, cyclin F has been recognized as having an important role in the G1-S transition via a feedback with the anaphase-promoting complex/cyclosome and its substrate adapter Cdh1 (APC/CCdh1) during late G1 and S phase (5, 6). In addition, cyclin F-bound SCF complexes (SCFCyclin F) control the degradation of several related proteins belonging to the E2F family which are involved in cell cycle transcriptional control (7–11).
Cyclin F is the founding member of the F-box family of proteins, which act as the substrate adapters for the SCF E3 ubiquitin ligase (2, 12, 13). As a substrate adapter, cyclin F recruits substrates to the SCF E3 ubiquitin ligase so that they may be ubiquitinated, typically targeting substrates for proteasomal degradation (2, 13). Cyclin F contains a cyclin homology domain and, at the RNA level, is the most highly cell cycle regulated protein of the 70 human F-box proteins, with expression peaking during S and G2. It is the only F-box protein to have been identified in five high-quality cell cycle transcriptomic profiling analyses (2, 12, 14–19). Despite its name, and the presence of a cyclin homology domain, cyclin F is not a traditional cyclin and does not bind or activate a cyclin-dependent kinase (CDK) (12, 20).
While a number of cyclin F substrates have been characterized, traditional protein-protein interaction mass spectrometry (MS)-based approaches to identify substrates for E3 ubiquitin ligases, including SCF-type E3s, have proven challenging. This is, in part, due to the transient nature of F-box-substrate interactions, a feature common to most E3-substrate interactions. Substrates are often low-abundance proteins, by virtue of their turnover by the ubiquitin system. Furthermore, at the point when substrate-E3 interactions are strongest, the substrate is typically being targeted for degradation, making it difficult to capture and identify these interactions. Finally, identifying substrates by examining protein-protein interactions is also made challenging by the fact that cyclin F, and many of its substrates, are cell cycle regulated, making it difficult to detect these short-lived interactions in asynchronous cell extracts.
Using an orthogonal approach, we identified sirtuin 5 (SIRT5) as a novel SCFCyclin F target. Sirtuins are a class of deacylating enzymes involved in regulating a variety of processes, including epigenetic state, DNA damage response, and metabolism (21, 22). SIRT5 has specific deacylating activity toward succinyl, malonyl, and glutaryl posttranslational modifications (PTMs) (23–26). SIRT5 is one of three mitochondrial sirtuins (sirtuins 3 to 5) which are classified by their ability to be imported into mitochondria, but whose localization is not exclusively restricted to mitochondria. Uniquely, SIRT5 also localizes to the cytoplasm and nucleus (27–29); however, its roles and regulation outside mitochondria are incompletely understood. While SIRT5 has been implicated in a number of metabolic processes, here, we describe a role for SIRT5 in cell cycle control. These data provide an unexpected link between the cell cycle ubiquitin machinery and metabolic regulation, a connection about which little has been described.
RESULTS
Cyclin F was originally identified in a gain-of-function cDNA screen searching for human genes that could suppress the lethality of budding yeast cdc4 temperature-sensitive mutants, which G1 arrest when grown at their restrictive temperature (12). The yeast cdc4 gene product is itself an F-box protein that promotes the degradation of Sic1, a CDK inhibitor which prevents cells from beginning S phase. In normally dividing yeast, SCFCdc4 triggers the ubiquitination and degradation of Sic1 at the G1/S boundary, allowing the start of DNA replication (30). In cdc4 mutant yeast grown at the restrictive temperature, SCFCdc4 activity is reduced and Sic1 levels remain high since it cannot be degraded, preventing cell cycle progression. The cdc4 mutant phenotype can be suppressed by the overexpression of Skp1, which reactivates the residual activity of SCFCdc4, promoting the destruction of Sic1, the subsequent activation of CDKs, and cell cycle progression (2). Alternatively, cdc4 mutants can be rescued by overexpression of the yeast cyclin Clb4, which bypasses the need to degrade Sic1 by activating CDK despite persistently high levels of the CDK inhibitor (2). Finally, human cyclin F overexpression suppresses the cdc4 mutant phenotype (12). However, cyclin F is unable to bind or activate CDK directly, implying that it does not suppress cdc4 mutants in a manner analogous to Clb4 overexpression. Still, cyclin F overexpression does not reduce Sic1 levels, implying that it does not suppress cdc4 mutants in a manner analogous to Skp1 overexpression either.
We hypothesized that cyclin F suppresses the G1 arrest phenotype in the cdc4 mutants grown at the restrictive temperature by targeting some unknown protein for degradation, most likely a protein which prevents S-phase entry.
We previously identified the APC/C substrate receptor Cdh1 as a cyclin F substrate. Moreover, we found that yeast Cdh1 could also be degraded following overexpression of cyclin F in yeast cells (5). Cdh1 plays an evolutionarily conserved role in restraining S-phase entry (31–34). Since APC/CCdh1 promotes the degradation of cyclins, which activate CDKs, among other proteins that promote S-phase entry, we reasoned that cyclin F might suppress cdc4 mutant yeast by triggering the degradation of yeast Cdh1. We therefore asked if cdh1 null yeast could suppress cdc4 mutants grown at the restrictive temperature. Despite an exhaustive analysis, we were unable to identify a single condition where Cdh1 loss suppressed the cdc4 mutant (see Fig. S1 in the supplemental material).
This finding suggested that cyclin F overexpression in yeast causes the degradation of an unknown protein that restrains cell cycle progression in G1 phase. Accordingly, degradation of the unknown protein should permit proliferation in cdc4 mutants grown at the restrictive temperature. Furthermore, we predicted that nonphysiologic cyclin F targets in yeast might also be conserved and represent relevant physiologic substrates for the human SCFCyclin F ubiquitin ligase since both yeast and human Cdh1 could be regulated by forced cyclin F expression (5). We therefore searched for other yeast genes whose deletion suppressed a mutation in cdc4.
Based on this hypothesis, we interrogated the Data Repository of Yeast Genetic Interactions (DRYGIN), a database of synthetic genetic interactions in yeast, for gene mutants or deletions that also suppress the cdc4 mutant phenotype as a tool to identify potential cyclin F targets (35). To prioritize our list, we also considered gene deletions that also suppress the cdc53 mutant, which like the cdc4 mutant, causes a G1 arrest phenotype (Fig. 1). Cdc53 is a yeast cullin which complexes with Skp1 and Cdc4 to form the E3 ubiquitin ligase that degrades Sic1, among other substrates.
FIG 1.

DRYGIN search results. (A) Schematic showing results of DRYGIN search for mutations/deletions that rescue both the cdc4 temperature-sensitive mutant, as well as the cdc53 mutant. Genes in gray were filtered out because their protein levels do not cycle through the cell cycle. Those in white were filtered out due to involvement in large protein complexes with little turnover, being yeast-specific genes with no human homologs, or being primarily active in cell cycle states outside G1. hst3 (blue) was chosen as a candidate cyclin F substrate.
We identified 36 genes that rescue the lethality of both the cdc4 and cdc53 mutants grown at the restrictive temperature (Fig. 1). We further narrowed this list by eliminating all genes that had no connection to the cell cycle, either directly or through genetic interactions. We then eliminated apc5, orc3, and mcm3 due to their incorporation into large protein complexes with low turnover rates. The yeast-specific transcription factor swi5 was eliminated because no human homologue has been identified. Finally, because we were interested in the G1-S transition, we chose not to interrogate sli15 because it is a component of the aurora B complex, which is primarily active in mitosis. This eliminated all but one gene, namely, hst3, a yeast sirtuin family deacetylase gene. When we looked at genes with similar genetic interactions to hst3, we identified a set of genes important for DNA replication and the DNA damage response, indicating a potential role in S-phase entry and progression, consistent with a role for hst3 in cell cycle (see Table S1 in the supplemental material). Because Hst3 is ubiquitinated by the yeast SCFCdc4 ligase, we hypothesized a human sirtuin could be a candidate for SCFCyclin F-targeted degradation (36, 37).
Sirtuin 5 stability is increased in the absence of cyclin F.
Since our screen identified a yeast sirtuin as a potential cyclin F target, we analyzed human sirtuin protein levels in a HeLa cell lines where cyclin F has been knocked out using CRISPR (cyclin F CRISPR wild type [crWT] and CRISPER knockout [crKO]). Immunoblotting for human sirtuins (SIRT1, SIRT2, SIRT3, SIRT5, and SIRT7) in cyclin F crKO cells revealed a consistent increase in sirtuin 5 (SIRT5) as well as a slight increase in sirtuin 7 (SIRT7) (Fig. 2A). Consistently, SIRT5 protein levels, along with the known cyclin F targets Cdh1 and CP110, were elevated in both U2OS and 293T cells treated with multiple cyclin F-targeted small interfering RNAs (siRNAs) compared with controls treated with siRNA targeting firefly luciferase (siFF; siRNA sequences in Table 1) (Fig. 2B and C). Together, these data show that cyclin F regulates SIRT5 protein levels.
FIG 2.
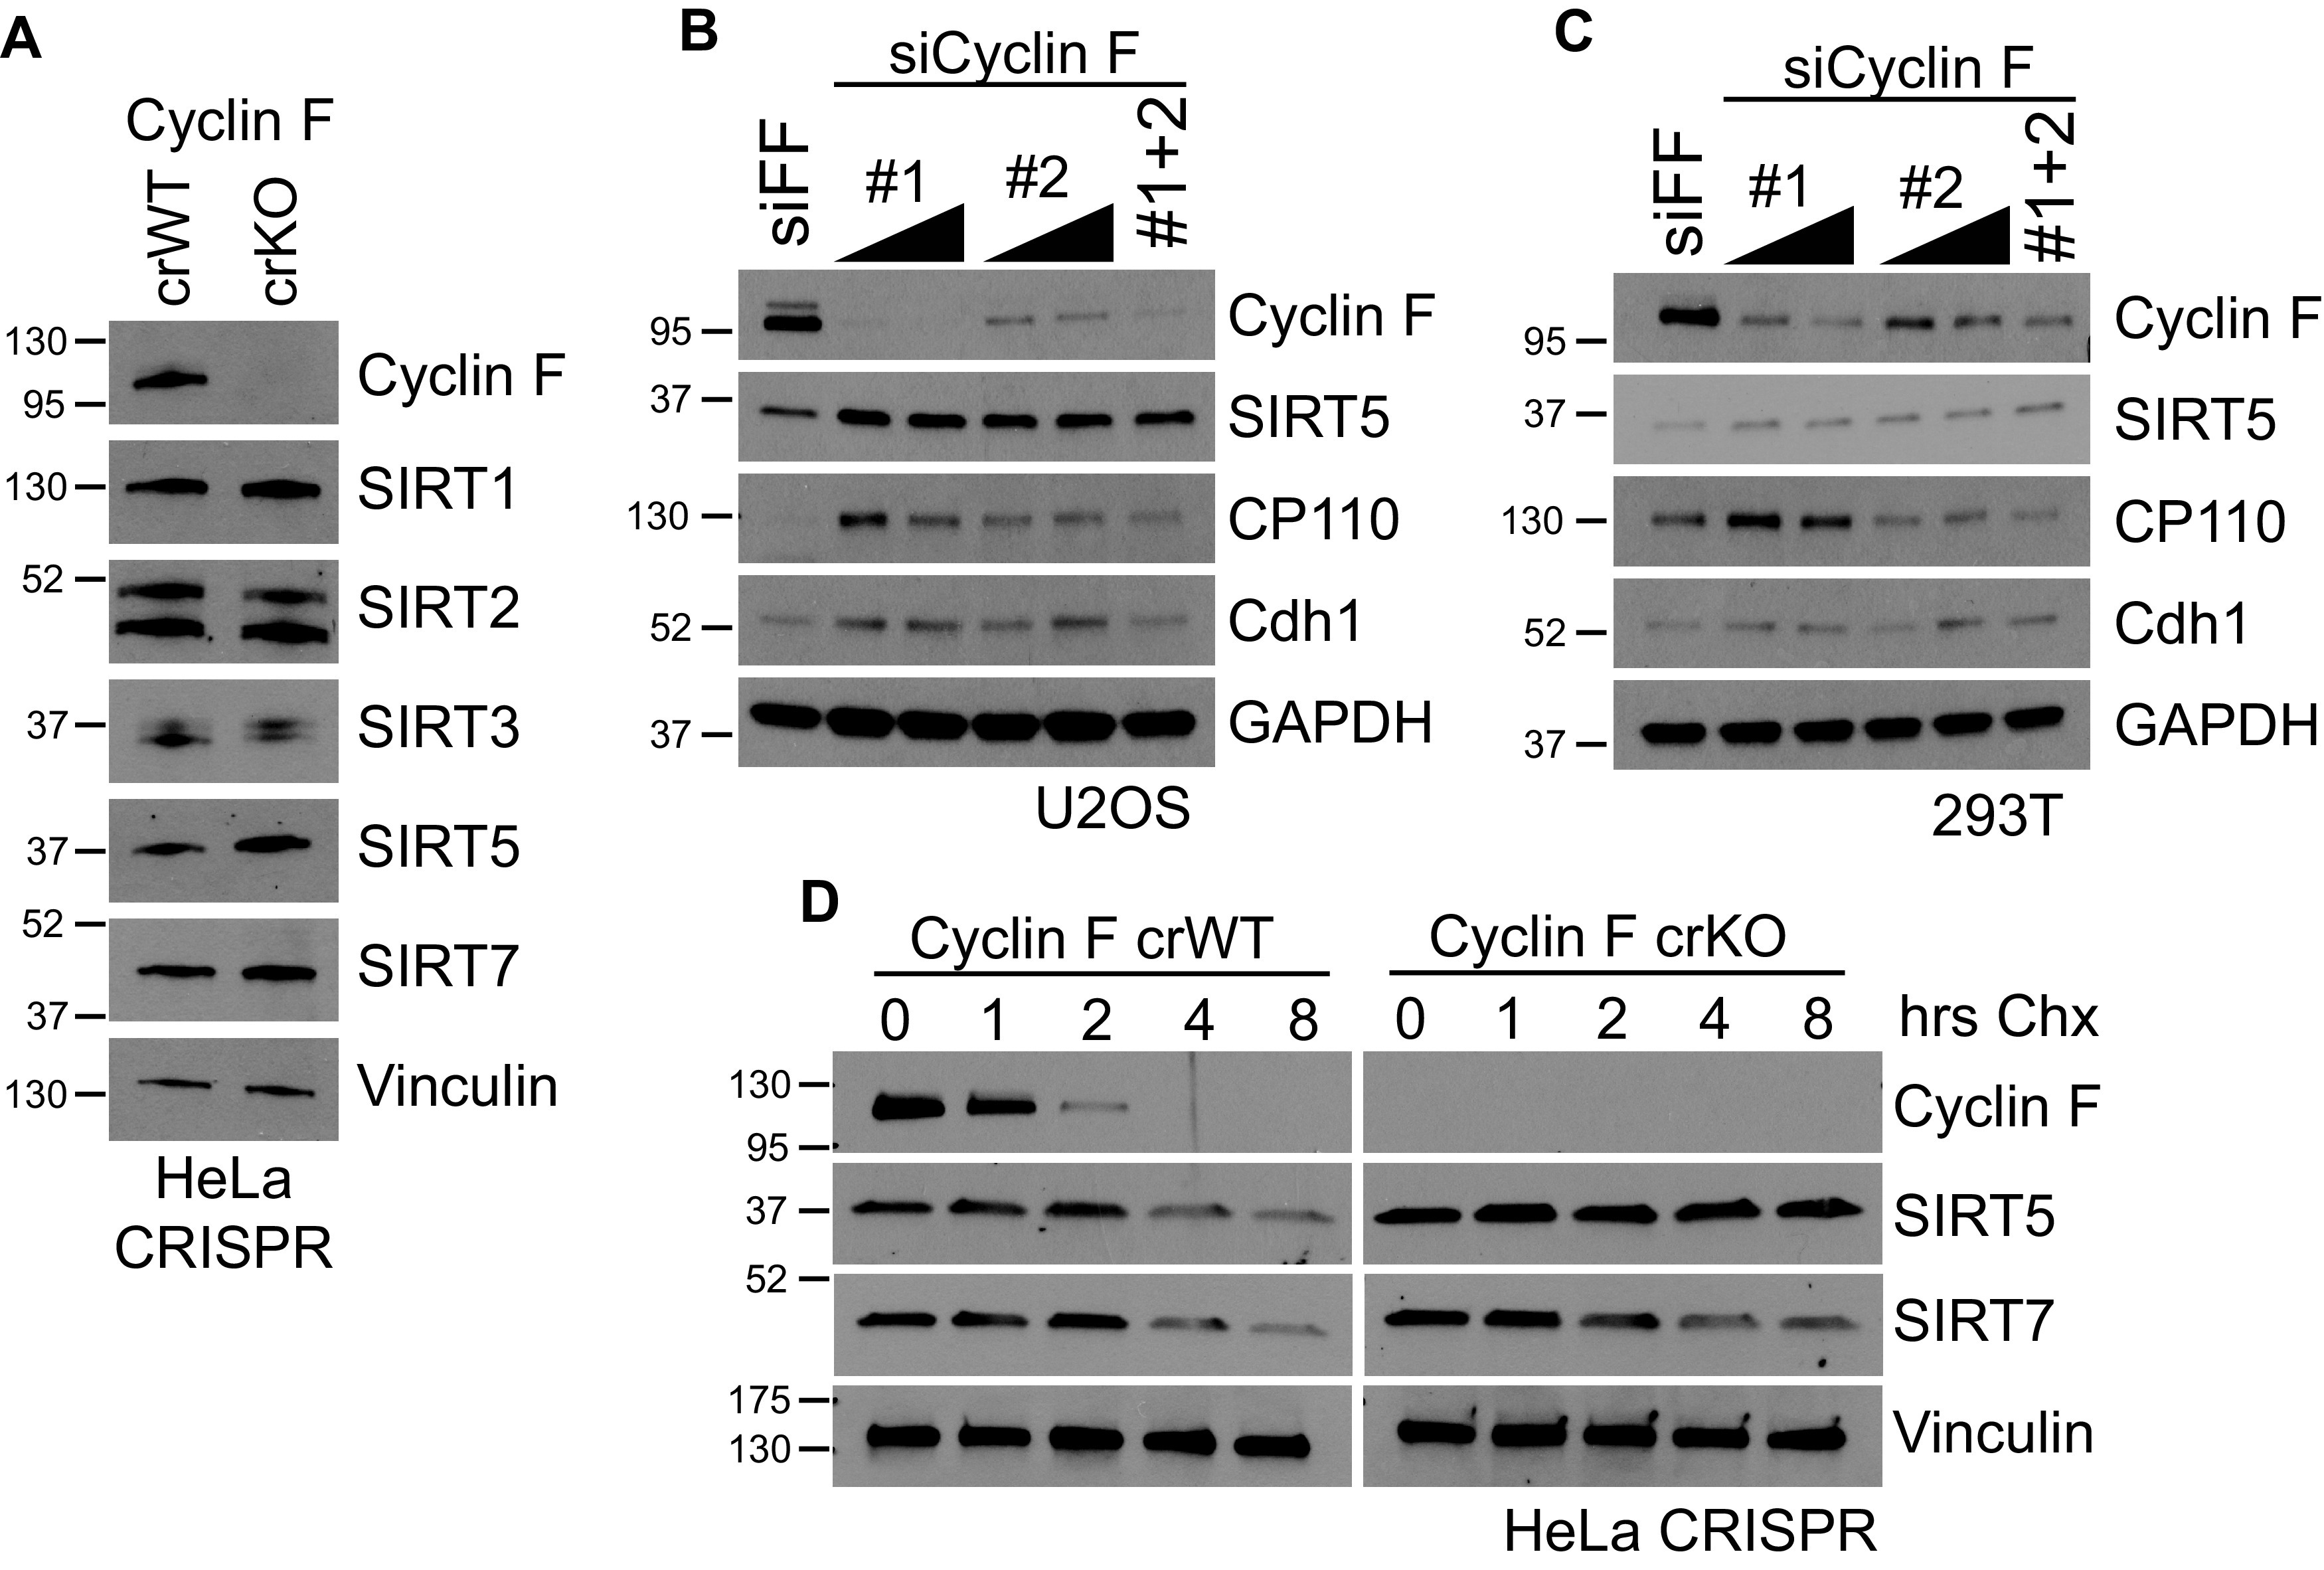
SIRT5 protein levels are increased/stabilized in the absence of cyclin F. (A) Immunoblot for sirtuin proteins in cyclin F crWT and crKO HeLa cells shows modest increases in SIRT5 and SIRT7 protein levels. (B and C) Cyclin F siRNA-mediated knockdown using 2 independent siRNAs in U2OS (B) and 293T (C) show increased SIRT5 protein levels, as well as other reported cyclin F substrates CP110 and Cdh1. (D) SIRT5 protein half-life in cyclin F crWT and crKO HeLa cells was measured using a cycloheximide (CHX) assay. Cells were treated with CHX, and samples were taken at the indicated time points.
TABLE 1.
siRNA sequences
| Target | siRNA sequence (5′–3′) |
|---|---|
| Firefly luciferase | CGUACGCGGAAUACUUCGA |
| Cyclin F 1 | UAGCCUACCUCUACAAUGA |
| Cyclin F 2 | GCACCCGGUUUAUCAGUAA |
| Sirtuin 5 1 | GGAGAUCCAUGGUAGCUUA |
| Sirtuin 5 2 | GAGUCCAAUUUGUCCAGCU |
| Sirtuin 5 3 | CCAGCGUCCACACGAAACCAGAUUU |
| Sirtuin 5 4 | CCAAGUCGAUUGAUUUCCCAGCUAU |
We performed cycloheximide chase in both the control crWT and cyclin F crKO cells to establish whether the elevation in SIRT5 protein abundance was due to an increase in protein stability (Fig. 2D). Cycloheximide prevents the translation of new protein from mRNA, allowing us to measure the half-life of the proteins present at the time of treatment. Cells were treated with cycloheximide, and samples were collected every 2 hours, for a total of 8 hours, and analyzed via immunoblot. Cycloheximide treatment of control cells showed that both SIRT5 and SIRT7 have a half-life between 3 and 6 hours, consistent with previously published data for both (Fig. 2D) (27, 38). No difference in SIRT7 half-life was observed in cyclin F crKO cells; however, a marked increase in the half-life of the SIRT5 protein was observed, with the protein becoming so stable that the half-life was largely unchanged in an 8-hour time point in cyclin F crKO cells (Fig. 2D). Together, these data show that the SIRT5 protein is strongly stabilized in the absence of cyclin F. Thus, cyclin F controls both the abundance and stability of SIRT5.
Sirtuin 5 interacts with cyclin F.
To determine if cyclin F and SIRT5 interact, we performed Myc and FLAG immunoprecipitations (IPs) from HEK-293T cells coexpressing a SIRT5-FLAG together with Myc-cyclin F, in the presence or absence of the proteasome inhibitor bortezomib. We used a C-terminally tagged Sirt5 (SIRT5-FLAG) to ensure our exogenous protein could still undergo mitochondrial import, which requires N-terminal processing. In the Myc-cyclin F IPs, a SIRT5-FLAG signal was detected in the bortezomib-treated sample, indicating an interaction (Fig. 3A). This finding was confirmed by the reverse SIRT5-FLAG IP, using the same samples, showing Myc-cyclin F coprecipitating in both of the coexpressed samples (Fig. 3A). Furthermore, increased amounts of Myc-cyclin F protein were pulled down by SIRT5-FLAG in the bortezomib-treated sample compared to coexpression alone, indicating the interaction is more stable in the absence of proteasomal activity (Fig. 3A).
FIG 3.
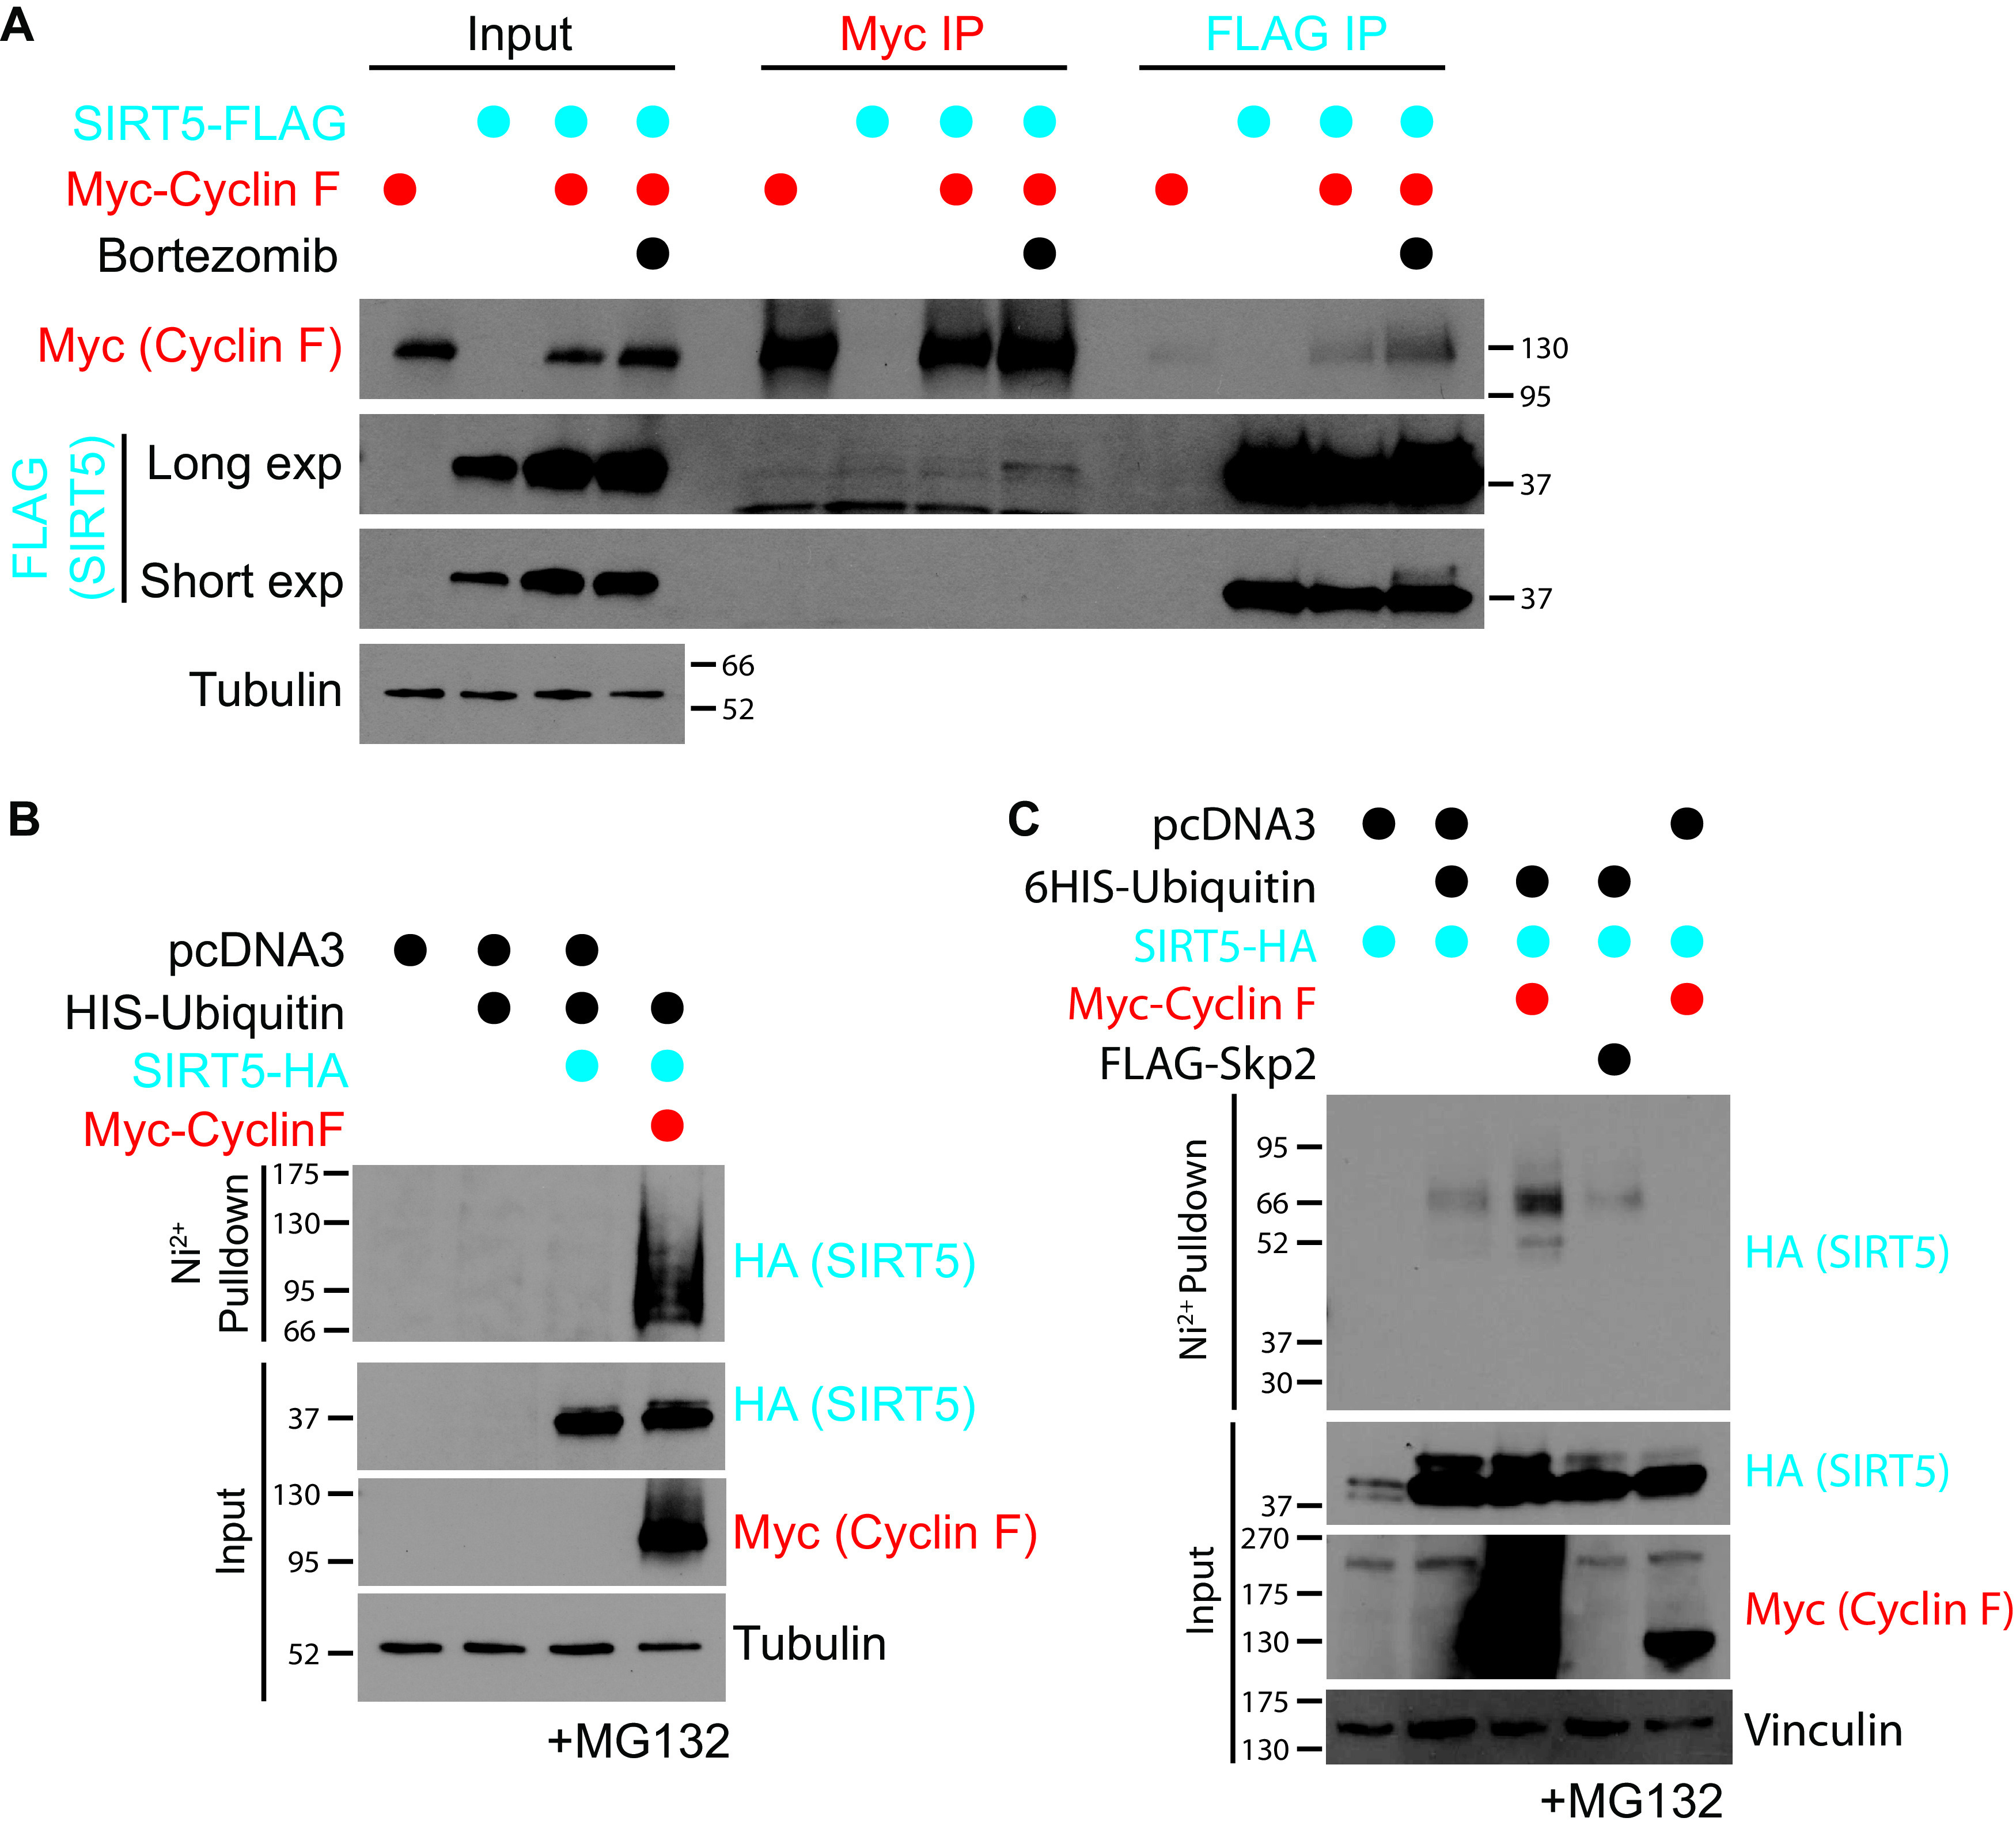
Cyclin F interacts with and ubiquitinates SIRT5. (A) SIRT5-FLAG and Myc-cyclin F were coexpressed or expressed with control vector (pcDNA) in 293T cells for a total 48 h. Before collection, samples were treated with DMSO or 150 nM bortezomib for overnight. Reciprocal IPs using anti-FLAG or anti-Myc were performed using the same input samples. The band on the long-exposure SIRT5 blot Myc IP samples is nonspecific. (B) Ubiquitination assays were performed in cells pretreated with 20 nM MG132 for 4 hours. 293T cells expressing 6His-ubiquitin and SIRT5-HA with either control or Myc-cyclin F were lysed under denaturing conditions. Ni2+ pulldowns were performed under denaturing conditions and used to pull down ubiquitinated proteins but not ubiquitin-interacting proteins. (C) Ubiquitination assays were performed in cells pretreated with 20 nM MG132 for 4 hours. 293T cells expressing SIRT5-HA and either control, 6His-ubiquitin, Myc-cyclin F, or FLAG-SKP2 were lysed under denaturing conditions. Ni2+ pulldowns were performed under denaturing conditions and used to pull down ubiquitinated proteins but not ubiquitin-interacting proteins.
To further confirm this interaction, we transiently expressed a FLAG-cyclin F and SIRT5-hemagglutinin (HA) in U2OS cells for 48 h. The cells were fixed and analyzed by proximity ligation assay (PLA), using primary antibodies against FLAG and HA epitopes. PLA allows for the fluorescent detection of each site of interaction. No strong PLA signal (red) was detected in negative controls transfected with empty FLAG or HA vectors or in empty vector with either FLAG-cyclin F or HA-SIRT5 alone (see Fig. S2 in the supplemental material). In cells coexpressing both FLAG-cyclin F and SIRT5-HA, PLA signal was detectable throughout the cell. These data confirm an interaction between cyclin F and SIRT5 and suggest that it occurs in the cytoplasm (Fig. S2).
SCFCyclin F promotes the ubiquitination of sirtuin 5.
Next, we performed in vivo ubiquitination assays to establish whether cyclin F regulates the ubiquitination of SIRT5. For this assay, we expressed a hexa-His–ubiquitin (6His-ubiquitin) construct in cells, together with our potential substrate and substrate adapter in the presence of a proteasome inhibitor (MG132). Ubiquitin is covalently linked to substrates, so the use of 6His-ubiquitin allows for cell lysis and subsequent pulldown of ubiquitin and ubiquitin-conjugated proteins under denaturing conditions, allowing for the distinction between ubiquitinated and ubiquitin-interacting proteins. If a protein is ubiquitinated, a higher molecular weight species will appear in the His pulldown sample when immunoblotted. The expression of SIRT5-HA with 6His-ubiquitin alone did not produce any signal in the His pulldown. However, the addition of Myc-cyclin F resulted in a higher molecular weight HA signal in the His pulldown, indicating that SIRT5 is ubiquitinated in the presence of cyclin F (Fig. 3B). To validate the specificity of cyclin F for SIRT5, we repeated the assay using either Myc-cyclin F or FLAG–S-phase kinase-associated protein 2 (FLAG-SKP2), another F-box-containing substrate adapter protein involved in cell cycle control (Fig. 3C). An increase in SIRT5 ubiquitination was observed in the presence of cyclin F but not SKP2 (Fig. 3C), indicating that SCFCyclin F specifically regulates SIRT5 ubiquitination.
SIRT5 protein levels influence G1 timing.
To date, identified cyclin F targets have been shown to play key roles in cell cycle progression (39). However, while SIRT5 has been implicated in a number of metabolic processes, it has no obvious connection to the cell cycle. To determine whether SIRT5 affects cell cycle progression, we performed flow cytometry analysis of propidium iodide (PI)-stained HEK-293T cells in which SIRT5 was knocked out by CRISPR/Cas9 gene editing (SIRT5 crWT and crKO). SIRT5 crKO cells exhibited a notable decrease in the G1 population (∼10% to 20%) compared with the control, which was compensated for by an overall increase in S/G2/M-phase cells (Fig. 4A and C). Compared with control SIRT5 crWT, the SIRT5 crKO cells also had elevated cyclin A protein levels, which is expressed during S/G2/M (Fig. 4B). Together, these data show the 293T cell cycle is altered in the absence of SIRT5, with a smaller portion of the population in G1.
FIG 4.
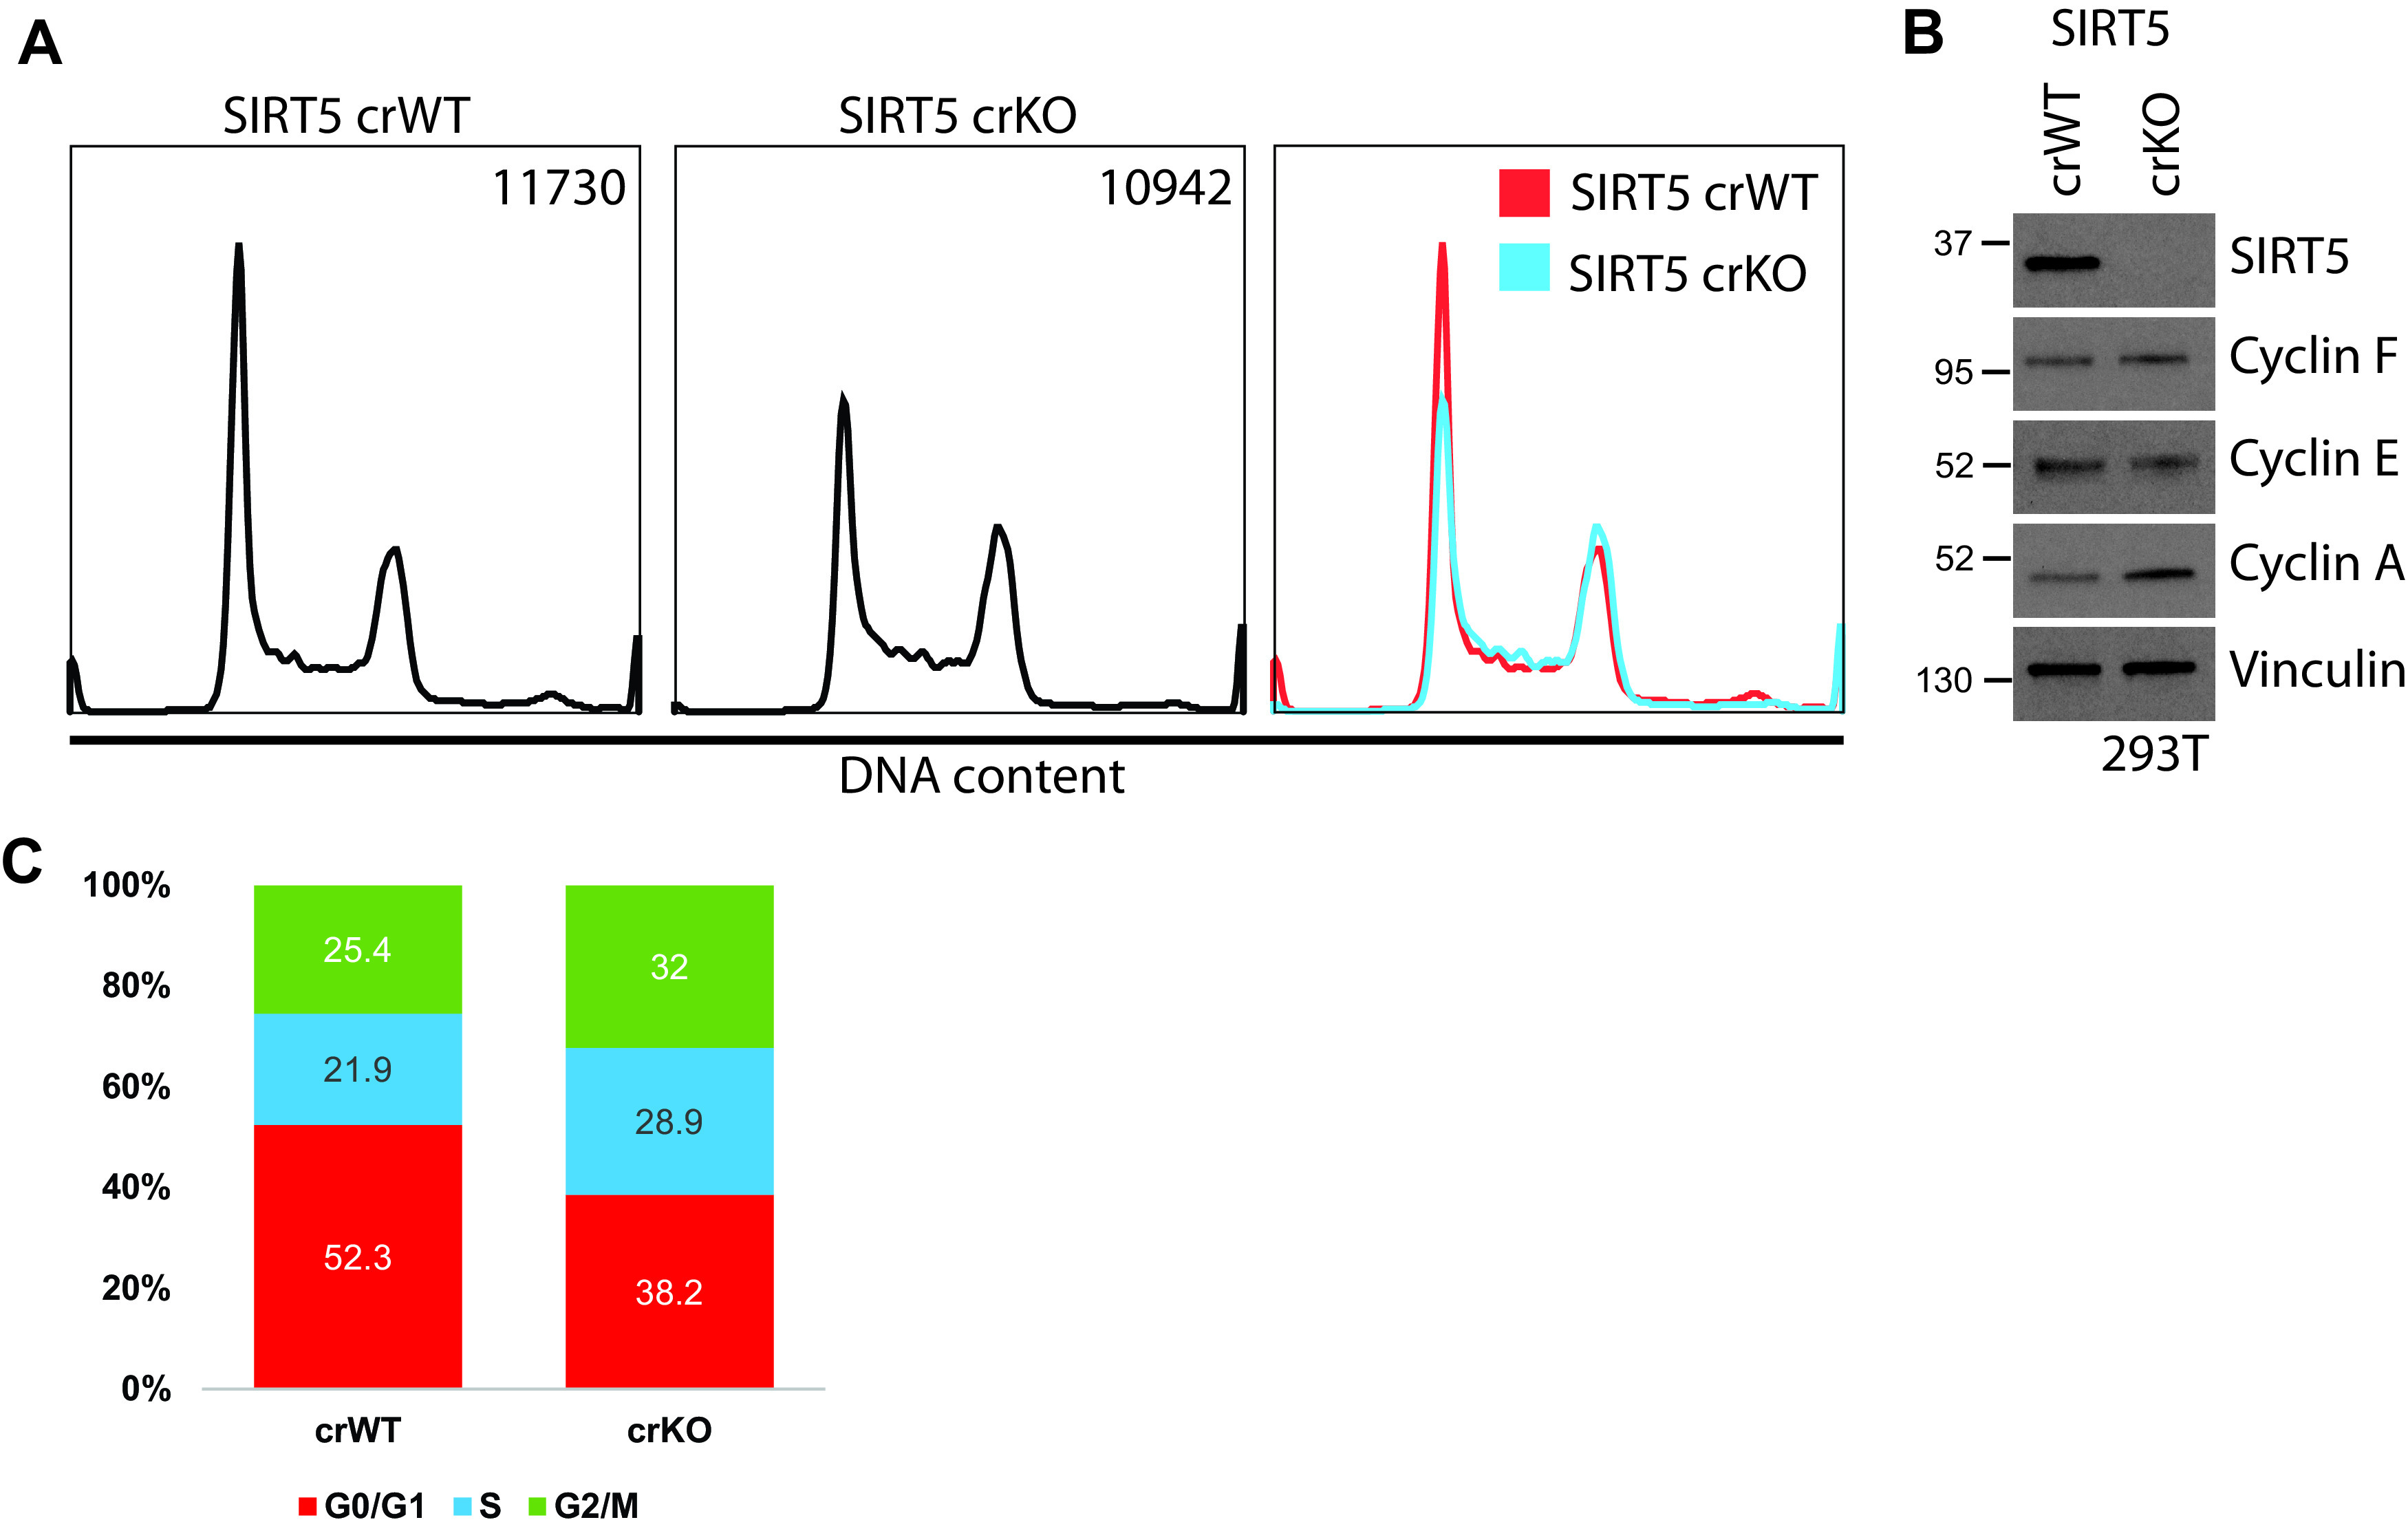
SIRT5 knockout alters cell cycle distribution. (A) Representative cell cycle distribution of propidium iodide-stained 293T SIRT5 CRISPR cells reveals altered cell cycle distribution in crKO. Cell counts are represented in the top right corner of each panel. Experiment n = 3. (B) Immunoblot of cells used in panel A reveals increased cyclin A and decreased cyclin E abundance in SIRT5 crKO, further supporting cell cycle differences observed in panel A. (C) Percentage of cells in each cell cycle phase as observed in panel A.
To confirm that this cell cycle alteration was due to SIRT5 loss, we reexpressed wild-type SIRT5-FLAG and the catalytic mutant SIRT5HY-FLAG and performed PI staining and flow analysis. Reexpression of SIRT5WT-FLAG for either 48 h or 72 h rescued the cell cycle phenotype (Fig. 5A), while reexpression of SIRT5HY-FLAG only partially rescued it (Fig. 5A and B). At the 72-h time point, on average, SIRT5 crWT cells had 50.9% of cells in G1, while crKO expressing the empty vector pcDNA averaged 43.9% of cells in G1 (Fig. 5C). Reexpression of SIRT5WT-FLAG in SIRT5 crKO increased the average percentage of cells in G1 to 52.2%, while SIRT5HY-FLAG expressing crKO cells averaged 44.4% of cells in G1 (Fig. 5C).
FIG 5.
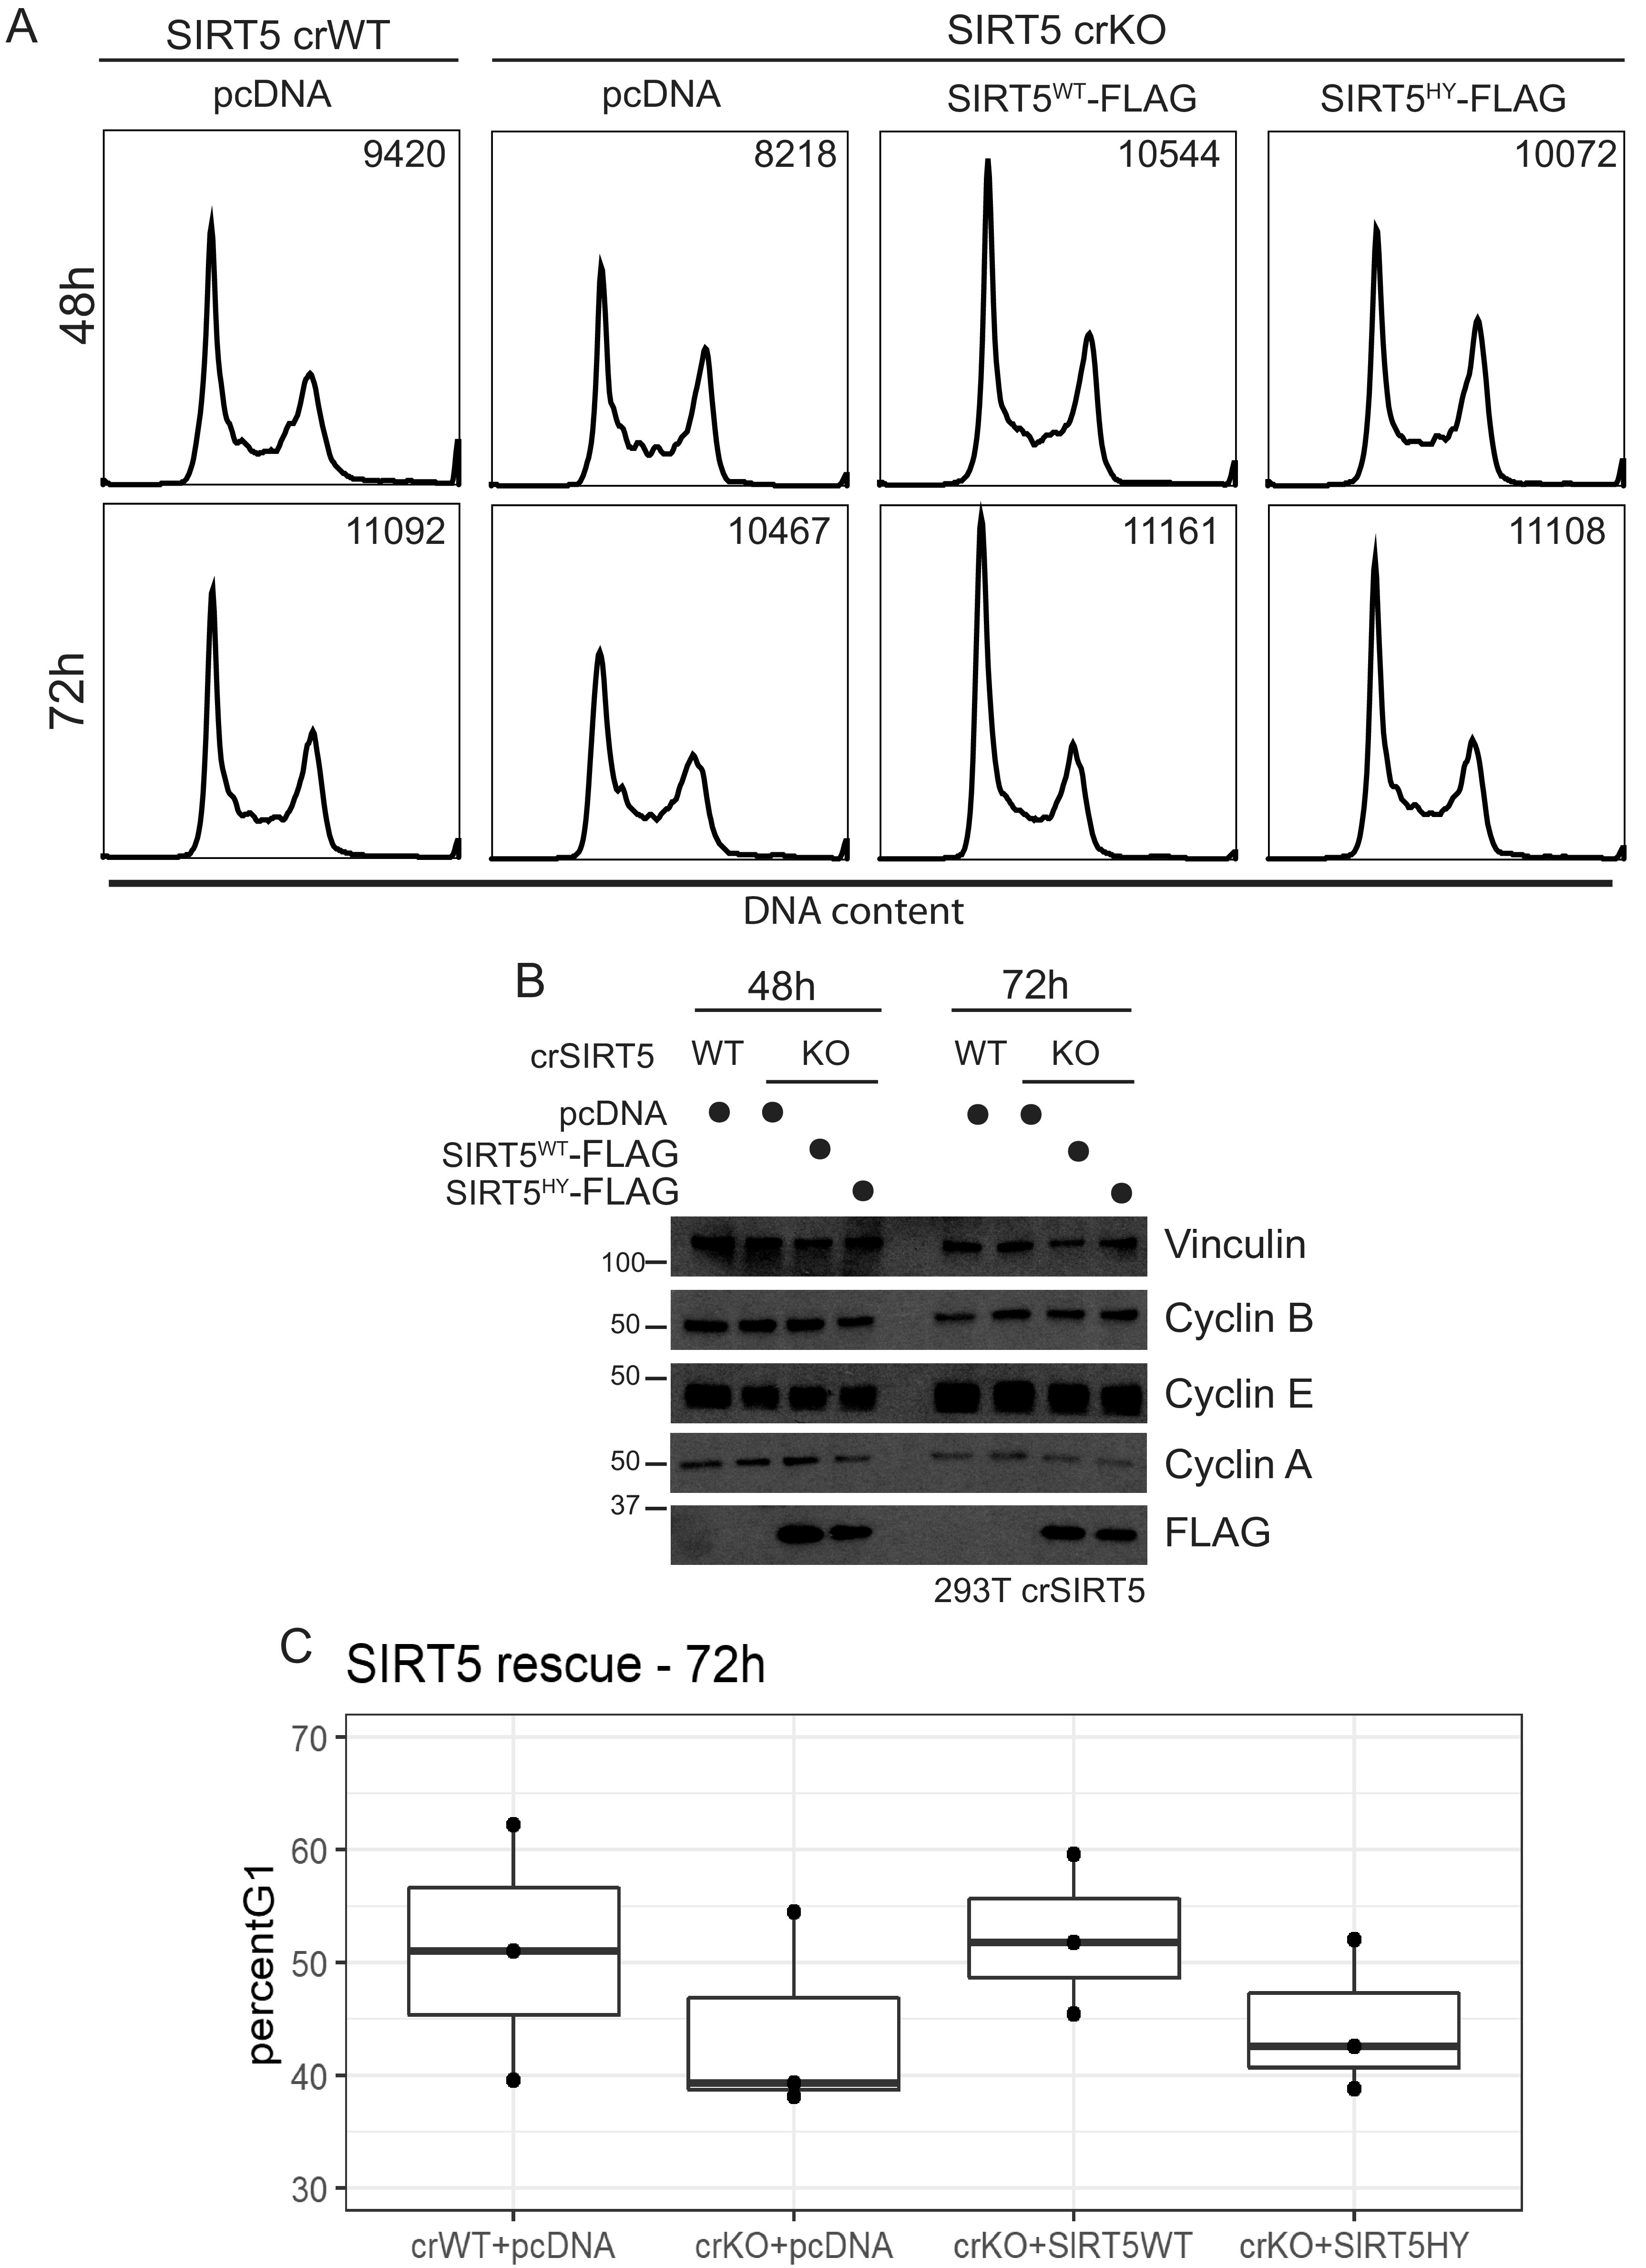
Reexpression of SIRT5 rescues the cell cycle phenotype. (A) SIRT5 crWT and crKO cells were transfected with control vector (pcDNA), SIRT5WT-FLAG, or the catalytic mutant SIRT5HY-FLAG. Cell cycle analysis (via propidium iodide staining) performed 48 h or 72 h posttransfection reveals the ability of SIRT5WT-FLAG to rescue the cell cycle phenotype after only 48 h of expression, while the catalytic mutant was able to only partially rescue the phenotype (representative data from n = 3). (B) Immunoblots of cells used in panel A. (C) Plot showing the percentage of cells in G1 for n = 3 biological replicates of SIRT5 reexpression for 72 h.
While a clear redistribution of cell cycle phases occurs in the absence of SIRT5, SIRT5 crKO cells appear to have the same doubling time as control cells in cell culture (data not shown). This result suggests that SIRT5 crKO cells spend less time in G1 but more time in S/G2/M. During G1, one of the ways cells prepare for DNA replication is by licensing origins. If cells were to exit G1 prematurely, or before origins are fully licensed, we could expect these cells to experience replication stress, leading to an accumulation of DNA damage (40, 41), which could slow S-phase progression. To determine whether SIRT5 crKO cells were completely licensing origins before entering S phase, we measured the ability of these cells to load the DNA replicative helicase mini-chromosome maintenance complex (MCM) during G1, using a previously published and validated flow cytometry method (40, 42) (see Fig. S3 in the supplemental material). These data show that while fewer SIRT5 crKO cells are in G1, consistent with our previous data, they were able to efficiently, and completely, load MCMs during G1. Interestingly, the SIRT5 crKO cells load MCM onto DNA at a higher rate than WT, with most KO cells in G1 having a large amount of loaded MCM in a shorter G1, while WT cells in G1 have a broader distribution with less loaded MCM in a longer G1, indicating a lower MCM loading rate (Fig. S3C). These data suggest that SIRT5 crKO cells are not exiting G1 before successful loading of the replicative helicase needed for DNA unwinding and S-phase progression. Instead, these data support the notion that cells are completing G1 faster in the absence of SIRT5.
SIRT5 protein levels increase with G0 arrest.
Since Sirt5 expression is correlated with the percentage of cells in G1 and potentially links metabolic signaling to cell cycle progression, we set out to determine if SIRT5 is regulated during quiescence. To do so, we analyzed SIRT5 protein levels in proliferating and quiescent cells. We arrested normal human fibroblast (NHF) cells in G0, using either serum depletion or contact inhibition. G0 arrest resulted in an increase in the SIRT5 protein, as well as a decrease in cyclin F protein levels, compared with cycling cells (see Fig. S4 in the supplemental material). Furthermore, RPE1 cells grown in various amounts of serum show a clear correlation between the SIRT5 protein level and serum concentration, with more SIRT5 accumulation in cells grown in lower concentrations of serum (Fig. S4). These data indicate that SIRT5 levels increase in quiescence and are consistent with a role for SIRT5 in restraining entry into S phase.
Proteomic analyses reveal altered cell cycle signaling.
To further examine the role of SIRT5 in cell cycle dynamics, we chose to investigate the levels of widespread protein phosphorylation. Phosphorylation is a kinase-mediated PTM that serves a plethora of roles in cell signaling by controlling the functions of target proteins and plays an important role in cell cycle regulation. Major cell cycle transitions are controlled by CDK/cyclin pairs that phosphorylate downstream targets to regulate cell cycle progression. To better understand the mechanisms by which cell cycle timing was altered in SIRT5 crKO cells, we performed global phosphoproteomics. We labeled peptides from SIRT5 crWT and crKO cells with isobaric tags (TMT10plex) followed by phosphopeptide enrichment via immobilized metal affinity chromatography (IMAC) and nanoscale liquid chromatography-tandem mass spectrometry (NanoLC-MS/MS). This approach allowed us to survey site-specific signaling differences between the SIRT5 crWT and crKO cells from an unbiased, large-scale perspective but also measure protein abundances from a NanoLC-MS/MS analysis of unmodified peptides in the nonenriched “input” material. Considering phosphopeptides for which the target protein was also quantified, we measured relative phosphorylation occupancy levels (protein-normalized phosphopeptide change) for 8,917 phosphopeptide isoforms in both SIRT5 crWT and crKO cells (see Table S2 in the supplemental material). Due to the inability to arrest 293Ts synchronously in G1, we analyzed asynchronous cell populations.
To evaluate phosphorylation changes between SIRT5 crWT and crKO cells that may be coordinated by common kinases, we performed kinase set enrichment analysis (KSEA) (43, 44). KSEA results predict a significant increase in CDK2 activity (S/G2 regulator) in SIRT5 crKO compared with crWT (Fig. 6B), as well as a significant decrease in mammalian target of rapamycin (mTOR) and mitogen-activated protein kinase 1 (MAPK1) activity. Based on KSEA results, we interrogated CDK2 phosphorylation targets and found significantly (P value of <0.05) increased phosphorylation of CDC6 S54 and ORC6 T195 and multiple peptides corresponding to RB1 T373 phosphorylation in SIRT5 crKO (see Fig. S5 in the supplemental material). These phosphorylation sites are important in late G1 to early S phase. Hyperphosphorylation of RB1 is mediated by multiple CDK/cyclin pairs to promote S phase entry (45). Phosphorylated S54 in CDC6 prevents ubiquitination and promotes chromatin interaction during G1 (46–49). Both CDC6 and ORC6 promote prereplication complex formation during G1 (46, 50–53). During S phase, phosphorylated CDC6 promoted replication and prevents DNA rereplication (47).
FIG 6.
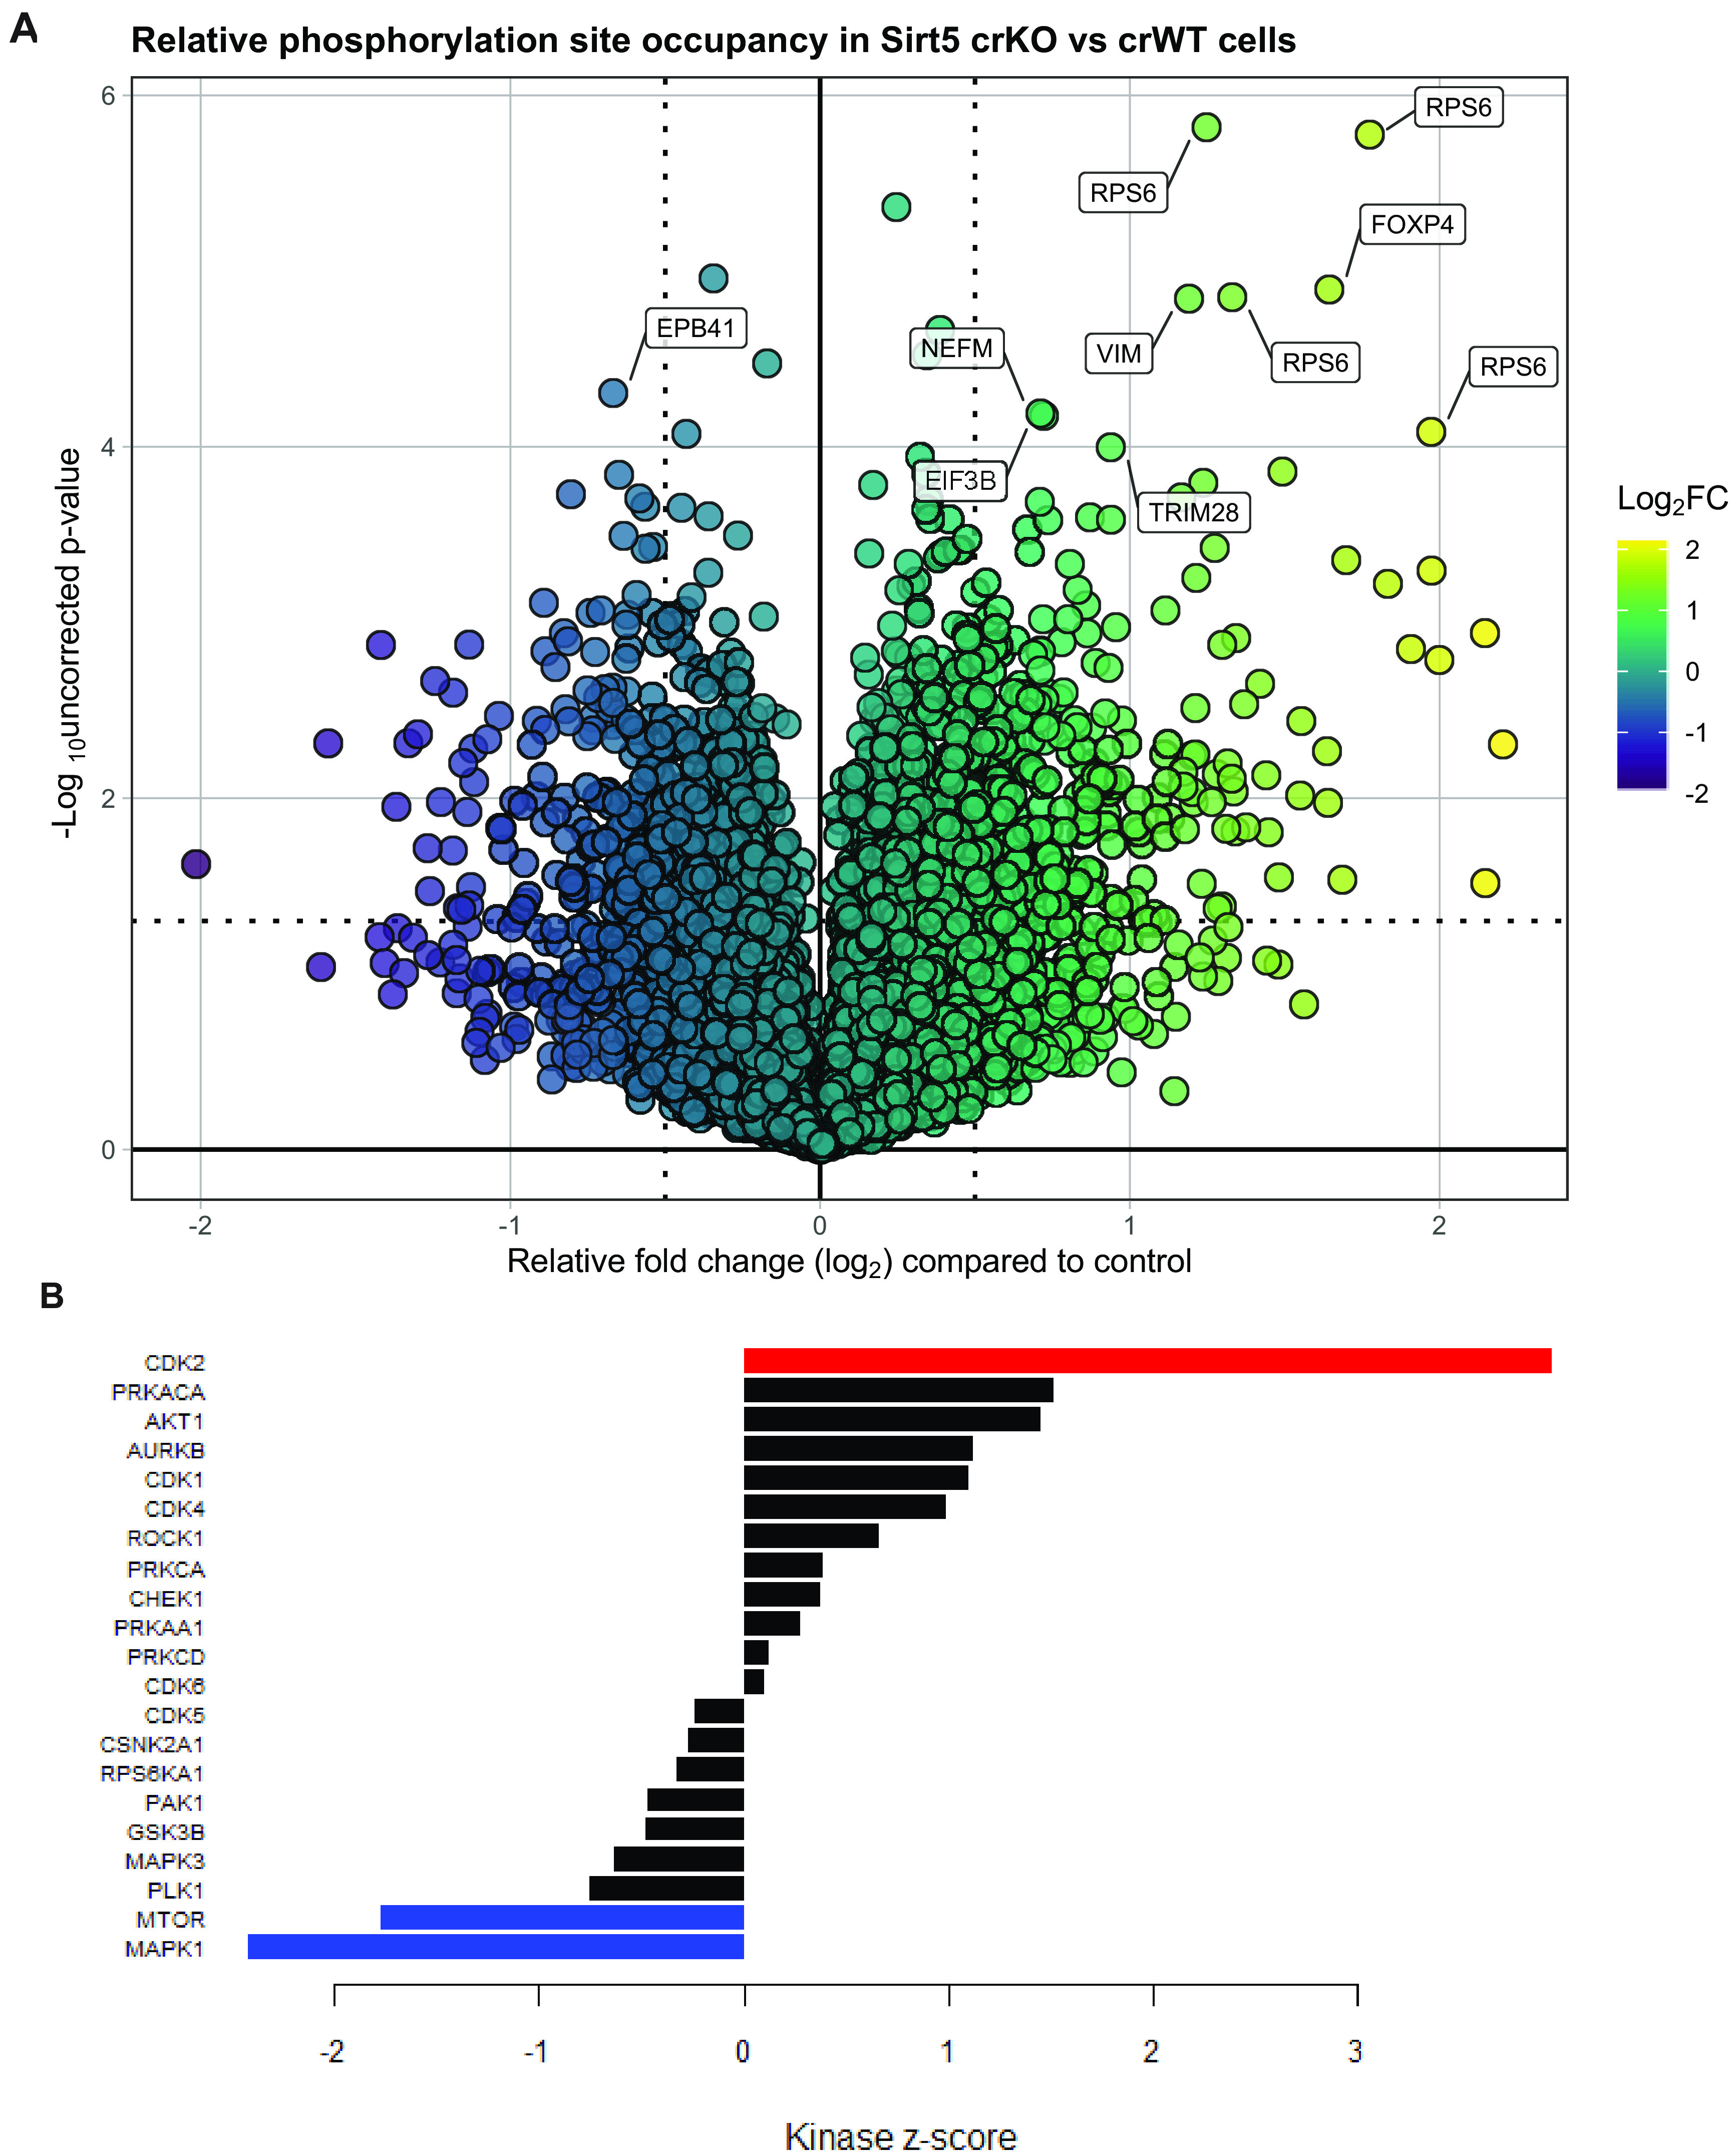
Phosphoproteomics of SIRT5 crWT and crKO cells reveals cell cycle signaling alterations. (A) Volcano plot of relative phosphopeptide isoform occupancy in SIRT5 crKO versus crWT cells. The most significantly different phosphopeptide isoforms (based on P value) are labeled. (B) Kinase set enrichment analysis (KSEA) of all phosphorylation sites (crKO versus crWT) reveals global signaling changes congruent with our cell cycle phenotype. A P value of <0.05 is indicated by red or blue.
Interestingly, despite KSEA indicating that mTOR signaling is decreased, three of the most upregulated phosphorylation sites (based on relative occupancy) were in ribosomal protein S6 (RPS6) (Fig. 6A). RPS6 is downstream of mTOR signaling and is important for cell cycle progression and proliferation (54). These discrepancies could be due to the fact that mTOR regulates a variety of signaling pathways which may be differentially altered in the absence of SIRT5. Furthermore, phosphorylation sites are often targeted by multiple kinases and could confound results.
Overall, these phosphosignaling changes support the data showing differences in cell cycle phase distribution between the SIRT5 crKO and crWT cells. However, it remains a possibility that SIRT5 could influence mTOR or MAPK signaling to a degree, especially considering the role of SIRT5 in a controlling a number of metabolic pathways. These metabolic pathways may act as signals for either the mTOR or MAPK pathways, but further experiments are needed to determine whether SIRT5 activity impacts these pathways.
DISCUSSION
We leveraged the DRYGIN database of yeast genetic interactors to identify potential E3 ubiquitin substrates based on conservation of the ubiquitin system between yeast and humans. This was based on the prior observation that overexpression of the SCF substrate receptor cyclin F can trigger the degradation of endogenous human Cdh1, one of its substrates, when overexpressed in human cells. Although there is no yeast cyclin F gene, overexpression of human cyclin F similarly triggered the degradation of endogenous Cdh1 in budding yeast (5). We therefore postulated that there could be other conserved proteins that are targets for ubiquitination in both yeast and human cells and which play conserved roles in regulating cell cycle progression. While the regulation of these substrates would be irrelevant in yeast, which lack cyclin F, that could have enabled cyclin F overexpression to suppress to the lethality of yeast mutants in F-box protein Cdc4, when cdc4 mutants are grown at the restrictive temperature.
Ultimately, we identified human SIRT5, a mitochondrial and cytosolic localized deacylating enzyme, as a potential cyclin F substrate. SIRT5 has been linked in numerous ways to metabolic regulation; however, it has not been previously linked to cell cycle regulation. We show that SIRT5 levels decrease as cells exit quiescence. In addition, loss-of-function studies revealed a role for SIRT5 in controlling cell cycle progression. Based on these observations, we hypothesize that SIRT5 influences the G1-S transition, with SIRT5 depletion resulting in faster entry into S phase and subsequently promoting an extended S/G2/M. This phenotype is common to other key G1-S transition regulators, including Cdh1 depletion or cyclin E overexpression (55, 56). Importantly, using 5-ethynyl-2'-deoxyuridine (EdU) incorporation assays, it has previously been shown that when the cyclin F protein is depleted, cells spend longer in G1 than control cells (5). In addition, cyclin F null mouse embryonic fibroblasts (MEFs) are slow to enter S after release from serum withdrawal (13). We hypothesize that along with Cdh1 and possibly other unrealized substrates, SIRT5 is an important SCFCyclin F target for controlling cell cycle entry and that SIRT5 levels must dip below a certain threshold for cells to enter S phase (Fig. 7).
FIG 7.

Model of SIRT5 cell cycle regulation. (A) Model depicting SIRT5 regulation by SCFCyclin F during G1. We propose a model in which SIRT5 protein levels must decrease below a threshold for cells to exit G1 into S phase based on our findings. Furthermore, we propose that high levels of SIRT5 may help establish and/or maintain quiescent or G0 phase.
Overall, the data support a model where SIRT5 levels are regulated by cyclin F as part of the global cell cycle control system and are potentially important for cells entering and exiting G0/G1 arrest. Cyclin F has proven to be a key regulator of cell cycle progression. Many cyclin F substrates are controlled during G2 phase (E2F1-3, E2F7/8, and SLBP) cyclin F regulation of Cdh1 is important for G1-S transition, while its regulation of CP110 and NUSAP1 is important for G2/M progression. Cyclin F levels and activity are regulated by the E3 ligases APC/CCdh1 and SCFβTRCP and kinases AKT and casein kinase 2 (5, 6, 57). Determining how the regulation of cyclin F is connected to the degradation of its substrates represents an important area of future study.
Interestingly, cyclin F been previously reported to be induced upon glucose starvation conditions via the transcription factor FOXO1 in glioblastoma cells (58). Furthermore, cyclin F was shown to target recombination signal binding protein for immunoglobulin kappa J region (RBPJ) for degradation in the absence of glucose (58). Ultimately, RBPJ degradation leads to isocitrate dehydrogenase 1 (IDH1) downregulation (58).
Furthermore, maintaining higher SIRT5 levels may be important for maintaining a G0 arrest. This could be linked to metabolic reprogramming that occurs in G0 cells. For instance, the urea cycle, which SIRT5 has been shown to influence, is increased in quiescent cells (59). While the data within this report support a cell cycle phenotype associated with SIRT5 depletion, further research is required to determine the specific pathways under the control of SIRT5 during cell cycle timing. Since SIRT5 has been implicated in a number of metabolic processes, including nucleotide biosynthesis, it is possible that SIRT5 plays a role in relaying nutrient/metabolite availability to cell cycle machinery. Cells often enter quiescence as a response to insufficient nutrients to complete a full cell cycle. However, quiescence is reversible, and cells can reenter the cell cycle once sufficient nutrients are available. Furthermore, SIRT5 could also be a sensor during G1 to ensure cells have adequate metabolites to enter S phase. As it is possible that SIRT5-regulated metabolites involved in G1-S transition are different from those involved in G0 regulation, future studies should focus on G0 establishment and maintenance.
Surprisingly, SIRT5 protein levels are increased in some cancer types, including breast cancer and non-small-cell lung cancers (NSLCs) (60, 61). Increased SIRT5 protein levels in NSLCs may promote resistance to nucleoside analogs, such as 5-fluorouracil. 5-Fluorouracil is metabolized into an analog of uracil and can be incorporated into mRNA during transcription, which prevents RNA from being read correctly by ribosomes. Furthermore, it inhibits the production of dTTP, which is needed for DNA synthesis. Cells with increased SIRT5 protein levels may be more resistant because they are spending more time in G1 or possibly even G0. However, SIRT5 has been implicated in de novo DNA synthesis, and it is possible that with increased SIRT5, there is increased nucleotide synthesis, preventing the 5-fluorouracil from being incorporated as much as it would be in low-SIRT5 cells. Future experiments are needed to better understand the role of SIRT5 in cancer survival and cell cycle.
Together, our data describe a new cyclin F target, SIRT5, and support a novel role for SIRT5 in cell cycle progression. This provides a novel link between metabolism and cell cycle progression. Future research is required to better understand which metabolites are influenced by SIRT5 degradation and how they promote or inhibit cell cycle.
MATERIALS AND METHODS
Mammalian cell culture.
HEK-293T, U2OS, RPE-1, NHF and HeLa cells were grown in Dulbecco’s modified Eagle’s medium (DMEM; Gibco) supplemented with 10% fetal bovine serum (FBS; Seradigm, VWR) and penicillin-streptomycin (pen/strep; Gibco).
HEK-293T cells were used to generate the HEK293T crSIRT5KO cell line with Dharmacon’s Edit-R gene engineering system that uses plasmid-driven Cas9 nuclease expression, synthetic trans-activating CRISPR RNA (tracrRNA), and CRISPR RNA (crRNA) for the gene of interest. As per the manufacturer’s protocol, HEK-293T cells at passage 17 were plated in 6-well plates at a density of 300,000 cells per well and were cotransfected with Edit-R hCMV-Puro-Cas9 (Dharmacon number U-005100-120), Edit-R tracrRNA (Dharmacon number U-002000-120), and Edit-R crRNA’s for SIRT5 using the DharmaFECT Duo (Dharmacon number T-2010-03) transfection reagent prepared in serum-free DMEM. After 48 h of transfection, cells were transferred to new 6-well plates and incubated in complete media containing 2 µg/ml puromycin for 3 days to positively select for transfected cells. Single-cell monoclonal populations were generated from puromycin-selected cells using the 96-well serial dilution technique. Guide crRNA sequences (Table 2) targeting all known 5 transcripts of SIRT5 (NM_012241_Exon5, 310 amino acids [aa]; NM_031244_Exon5, 299 aa; NM_001193267_Exon5, 292 aa; and NM_001242827_Exon4, 202 aa) in the sense/anti-sense strands of human SIRT5 were selected from Dharmacon’s online CRISPR RNA configurator tool (https://dharmacon.horizondiscovery.com/gene-editing/crispr-cas9/crispr-design-tool/). Control cells underwent the same procedure as the SIRT5KO cells, except they did not receive the gene-specific crRNA. Each clonal population was cultured and screened for loss of the SIRT5 protein by Western blotting. Ultimately, the confirmed SIRT5 crKO cell line was made using the crRNA ID “E” (sequence in Table 2). Sirtuin 5 CRISPR crKO and control 293T (crWT) cells were grown in DMEM.
TABLE 2.
CRISPR RNA guide sequences and target chromosomal locationa
| crRNA ID | Chromosomal location | crRNA sequence (5′–3′) |
|---|---|---|
| A | Chr6: 13591759 antisense strand | ATG GCG CGG TGC CCG GCG TT |
| B | Chr6: 13591766 antisense strand | CTC GGC TAT GGC GCG GTG C |
| C | Chr6: 13591806 sense strand | CAA GCA GGG CCG GCG AGT CG |
| D | Chr6: 13591815 antisense strand | GGG TGA TGA CCA CGA CTC G |
| E | Chr6: 13591846 sense strand | GAT GAG CTG CAC CGC AAG GC |
ID, identifier; Chr6, chromosome 6.
All siRNA transfections were performed using Lipofectamine RNAiMax (Thermo Fisher Scientific) following the manufacturer’s protocol. Control, nonspecific siRNA targeted firefly luciferase (siFF). Two different siRNAs against cyclin F were used, each at a concentration of 30 nM. The siRNA oligonucleotide sequences used in this study are detailed in Table 1. All plasmid transfections were performed using Lipofectamine 2000 (Thermo Fisher Scientific) or Lipofectamine 3000 (Thermo Fisher Scientific) according to manufacturer protocols. For cycloheximide experiments, cells were treated with 100 μg/ml cycloheximide (sigma), and samples were collected at 0-h, 1-h, 2-h, 4-h, and 8-h time points. For bortezomib treatments, 293T cells were treated overnight with 150 nM bortezomib (SelleckChem) or a corresponding dimethyl sulfoxide (DMSO) volume as the control. For MG132 treatments, cells were treated with a 20 μM amount of MG132 (UBPBio) for 4 hours prior to collection.
Immunoblotting and immunoprecipitations.
Samples analyzed by immunoblot were lysed in NETN (20 mM Tris-Cl [pH 8.0], 100 mM NaCl, 0.5 mM EDTA, and 0.5% Nonidet P-40 [NP-40]) supplemented with 1 μg/ml apoprotinin, 1 μg/ml pepstatin, 10 μg/ml leupeptin, 1 mM Na3VO4, 1 mM NaF, and 1 mM 4-(2-aminoethyl)benzenesulfonyl fluoride hydrochloride (AEBSF). Protein concentration was estimated using the Bradford assay (Bio-Rad). Laemmli buffer was added to samples, which were then separated by SDS-PAGE using homemade or commercially available gels (Bio-Rad). Gels were transferred to nitrocellulose membranes and blotted using standard immunoblotting procedures.
For the co-IP experiments in Fig. 3, cells were lysed in NETN, supplemented with 1 μg/ml apoprotinin, 1 μg/ml pepstatin, 10 μg/ml leupeptin, 1 mM Na3VO4, 1 mM NaF, and 1 mM 4-(2-aminoethyl)benzenesulfonyl fluoride hydrochloride (AEBSF). Protein A/G DynaBeads (Thermo Fisher Scientific) were bound to control rabbit IgG (Santa Cruz Biotechnology), FLAG (Sigma F3165), or Myc (Santa Cruz Biotechnology, sc-40) antibodies overnight at 4°C. Samples were incubated with beads for 4 hours at 4°C, which were subsequently washed three times in lysis buffer and eluted with 2× Laemmli sample buffer at 95°C for 10 minutes.
For the in vivo ubiquitination assay in Fig. 3, cells were transfected with a combination of empty pcDNA3.1,6×His-ubiquitin, pcDNA-SIRT5-HA, and Myc-cyclin F (see figure for combinations) for a total of 5 μg DNA/transfection using Lipofectamine 2000 (Thermo Fisher Scientific). Cells were treated with 10 μM MG132 4 h before harvesting. His pulldowns were performed as previously described in Choudhury et al. (5); an 80% cell suspension was lysed under denaturing conditions in buffer 1 (6 M guanidine-HCl, 0.1 M Na2HPO4-NaH2PO4, 0.01 M Tris-HCl [pH 8.0], 15 mM imidizole, and 10 mM β-mercaptoethanol [βME]). Lysates were sonicated and loaded onto prewashed Ni2+-nitrilotriacetic acid (NTA) resin (Thermo Fisher Scientific) and incubated for 4 h, rotating, at room temperature. Samples were then washed three times, first using buffer 1, followed by buffer 2 (8 M urea, 0.1 M Na2HPO4-NaH2PO4, and 0.01 M Tris-HCl [pH 8.0]), then buffer 3 (8 M urea, 0.1 M Na2HPO4-NaH2PO4, and 0.01 M Tris-HCl [pH 6.3]) plus 0.2% Triton X-100, and finally with buffer 3 plus 0.1% Triton X-100. Samples were then eluted by incubating for 20 min in buffer 4 (200 mM imidazole, 0.15 M Tris-HCl [pH 6.7], 30% glycerol and 0.72 M βME, and 5% SDS). The remaining 20% of the cell suspension was lysed in NETN supplemented with 1 μg/ml apoprotinin, 1 μg/ml pepstatin, 10 μg/ml leupeptin, 1 mM Na3VO4, 1 mM NaF, and 1 mM AEBSF, and the protein content was measured using the Bradford assay. Samples were analyzed by immunoblot.
Immunological reagents.
Commercially available antibodies used in this study, including their use (e.g., immunoblotting and immunofluorescence), catalog numbers, and specific dilutions, are provided in Table 3.
TABLE 3.
Antibodies used in this studya
| Target | Company | Catalog no. | Dilution |
|---|---|---|---|
| Cyclin F | Santa Cruz Biotechnology | sc-952 | 1:2,000 |
| Sirtuin 5 | CST | 8782 | 1:2,000 |
| Cdh1 (Fzr1) | abcam | ab3242 | 1:1,000 |
| Tubulin | Santa Cruz Biotechnology | sc32293 | IB, 1:1,000; IF, 1:200 |
| GAPDH | Santa Cruz Biotechnology | sc25778 | 1:10,000 |
| Cyclin E | CST | 4129 | 1:5,000 |
| Cyclin A | Santa Cruz Biotechnology | sc751 | 1:5,000 |
| Cyclin B1 | abcam | ab32053 | 1:10,000 |
| Vinculin | Santa Cruz Biotechnology | sc-25336 | 1:5,000 |
| Sirtuin 1 | CST | 9487 | 1:1,000 |
| Sirtuin 2 | CST | 12650 | 1:2,000 |
| Sirtuin 3 | CST | 5490 | 1:2,000 |
| Sirtuin 7 | CST | 5360 | 1:1,000 |
| CP110 | Bethyl | A301-343A | 1:1,000 |
| Myc tag | Santa Cruz Biotechnology | sc-40 | 1:2,000 |
| FLAG-HRP | Sigma | A8592 | 1:5,000 |
| FLAG | Sigma | F3165 | IP, 1:1,000 |
| HA | Covance | MMS-101P | 1:1,000 |
CST, Cell Signaling Technology; IB, immunoblot; IF, immunofluorescence; IP, immunoprecipitation.
For immunoblotting, antibodies were diluted in a solution of 5% nonfat dry milk in phosphate-buffered saline with 0.05% Tween 20 (PBST). Antibodies were either incubated at room temperature for 2 hours or overnight at 4°C. Detection was performed using horseradish peroxidase (HRP)-conjugated secondary antibodies (1:10,000; Jackson ImmunoResearch Laboratories, Inc.), ECL reagent (Pierce), and exposure to film.
Immunofluorescence.
The proximity ligation assay (PLA) was performed using the Duolink in situ red starter kit mouse/rabbit (DUO92101; Sigma). Cells were plated on poly-l-lysine-coated coverslips approximately 1 day before fixation. Cells were fixed in prewarmed PHEM buffer [60 mM piperazine-N,N′-bis(2-ethanesulfonic acid) (PIPES), 25 mM N-2-hydroxyethylpiperazine-N′-2-ethanesulfonic acid (HEPES), 10 mM ethylene glycol-bis(β-aminoethyl ether)-N,N,N′,N′-tetraacetic acid (EGTA), and 2 mM MgCl2, adjusted to pH 7.0 using KOH] plus 3% PFA for 13 minutes at 37°C. Cells were washed with PHEM buffer and permeabilized using PHEM plus 0.5% NP-40 for 15 minutes at room temperature. Staining was performed following the DuoLink kit protocol, with primary antibodies mouse anti-FLAG (1:500; Sigma-Aldrich) and rabbit anti-HA (1:100). For negative controls, one or the other primary antibodies were omitted (performed with HA only or FLAG only). Counterstaining was performed using Alexa Fluor 488-conjugated α-tubulin at a dilution of 1:100 for 40 min at 37°C. Samples were mounted onto glass slides in Prolong Diamond mounting medium with 4′,6-diamidino-2-phenylindole (DAPI; Thermo Fisher Scientific).
Images were obtained using an Olympus XI-81 inverted widefield microscope, equipped with ORCA-Flash4 scientific complementary metal oxide semiconductor (sCMOS) camera (2,048 by 2,048 pixels, 6.5-µm pixel size, 13.3-mm by 13.3-mm chip area; 30 frames/sec). Metamorph was used to capture 8-bit images. Imaging was performed using a 20× lens objective (20×/0.5 UPLFLN WD 2.1 mm). Filter cubes included fluorescein isothiocyanate (FITC), tetramethyl rhodamine isocyanate (TRITC), and DAPI, with filter wheels (sedat filter set to speed multicolor acquisition) including FITC-GFP and Texas Red. All image analysis/processing was performed in Fiji (v1.51).
Yeast experiments.
The following yeast strains were used: for wild type, BY4741 MATa his3Δ1 leu2Δ0 met15Δ0 ura3Δ0; for cdc4-1, H4C1B1 MATα his7 ura1 can1 cdc4-1 (A364a from Lee Hartwell); for cdh1, cdh1::kanMX MATa his3Δ1 leu2Δ0 met15Δ0 ura3Δ0 cdh1::kanMX4 (BY4741 from deletion collection); and for cdh1cdc4-1, 4160-5-1 MATa leu2Δ0 can1 cdc4-1 cdh1::kanMX4 (from tetrad dissection).
Yeast propagation and genetic analysis were done as described previously (62). Cells were grown to saturation in yeast extract-peptone-dextrose (YPD) at 23°C in liquid YPD medium; and serial 10-fold dilutions were spotted (5 µl) onto YPD plates, which were sealed and submerged in water baths and incubated at 23°C, 26°C, and 28°C for 3 days, with cells at all other temperature conditions incubating for 2 days.
Flow cytometry.
For standard cell cycle analyses, cells were collected and fixed in 70% ethanol. Cells were then washed in 1 ml PBS twice and then resuspended in a solution of PBS containing a final concentration of 25 μg/ml propidium iodide (Sigma-Aldrich) and 100 μg/ml RNase A. At least 10,000 cells per sample were counted using a ThermoFisher Attune Nxt using yellow (591 nm) excitation laser and the YL2 emission channel. Data were analyzed using FlowJo software.
For MCM loading measurements, flow cytometry cell cycle analysis and gating schemes were done as described previously (40, 42). Briefly, cells were incubated with 10 μM EdU (Santa Cruz Biotechnology) 30 minutes before collection. After incubation, cells were collected with trypsin (Sigma-Aldrich), washed with PBS, and resuspended on ice in CSK buffer (300 mM sucrose, 100 mM NaCl, 3 mM MgCl2, and 10 mM PIPES [pH 7.0] with 0.5% Triton X-100) for 5 minutes to permeabilize and isolate chromatin-associated proteins. Cells were fixed in 4% paraformaldehyde (Electron Microscopy Sciences, Hatfield, PA) in PBS for 15 minutes at room temperature. Fixed cells were washed with 1% bovine serum albumin (BSA) in PBS. EdU staining was done by adding 1 mM CuSO4, 1 μM 647-azide (Life Technologies), and 100 mM ascorbic acid for 30 min at room temperature. Next, cells were washed with 1% BSA, PBS, and 0.1% NP-40 and stained with primary antibody MCM2 of 1:200 (mouse; catalog number 610700; BD Biosciences) in 100% PBS with 1% BSA and 0.1% NP-40 for 1 hour at 37°C. Afterward, cells were washed and stained with donkey anti-mouse secondary antibody–Alexa Fluor 488 (1:1,000; for Mcm2 715-545-150; Jackson ImmunoResearch Laboratories) in 1% BSA, PBS, and 0.1% NP-40 at 37°C for 1 hour. Last, cells were washed and resuspended in 1 μg/ml DAPI in PBS and 1% BSA overnight at 4°C. Samples were run on a Beckman Coulter CyAn ADP flow cytometer, collecting at least 10,000 single cells per sample. Data analysis was done with FCS Express six software (De Novo, Glendale, CA).
Mass spectrometry.
To prepare MS samples, cells were scraped and washed in PBS and pellets were frozen at –80°C. Cell pellets were resuspended in 500 μl of ice-cold 8 M urea lysis buffer (8 M urea in 50 mM Tris [pH 8.0], 40 mM NaCl, 2 mM MgCl2, 1× Roche complete Ultra EDTA-free protease inhibitor mini tablet, 1× PhosStop phosphatase inhibitor tablet [Roche], 50 mM NaF, and 10 mM Na pyrophosphate). The cells were disrupted by a combination of pipetting, vortexing, and subsequent sonication with a probe sonicator in three 5-second bursts (power setting of 3), incubating on ice between each burst. Samples were centrifuged at 10,000 × g for 10 min at 4°C, and the supernatant was retained. Protein concentration was determined by bicinchoninic acid (BCA); and an equal amount of protein (500 μg, adjusted to 2.5 mg/ml with urea lysis buffer) from each sample was reduced with 5 mM dithiothreitol (DTT) at 32°C for 30 min, cooled to room temperature (RT), alkylated with 15 mM iodoacetamide for 30 min in the dark, and unreacted iodoacetamide quenched by the addition of DTT up to 15 mM. Each sample was digested with 5 μg LysC (100:1 wt/wt, protein to enzyme; Wako Chemicals) at 32°C for 4 h. Following dilution to 1.5 M urea with 50 mM Tris (pH 8.0) and 5 mM CaCl2, the samples were digested with 10 μg trypsin (50:1 wt/wt, protein/enzyme; Promega sequencing grade trypsin) overnight at 32°C. The samples were acidified to 0.5% trifluoroacetic acid (TFA) and centrifuged at 4,000 × g for 10 min at 4°C to pellet insoluble material. The supernatant containing soluble peptides was desalted by solid-phase extraction (SPE) with a Waters 50-mg tC18 SEP-PAK SPE column and eluted once with 500 μl 25% acetonitrile–0.1% TFA and twice with 500 μl 50% acetonitrile–0.1% TFA. The 1.5-ml eluate was frozen and dried in a speed vac. Each sample was resuspended in 100 μl of 200 mM triethylammonium bicarbonate (TEAB), mixed with a unique 10-plex tandem mass tag (TMT; Thermo Fisher Scientific) reagent (0.8 mg resuspended in 50 μl 100% acetonitrile), and shaken for 6 hours at room temperature. Two TMT 10-plex kits were used, one for the nine “WT” samples (kit number 1) and one for the nine “KO” samples (kit number 2)—including a study pool comprised of equal amounts of all 18 samples as a common reference on the 10th channel in both TMT kits. After samples were quenched with 0.8 μl 50% hydroxylamine and shaken for 15 additional minutes at room temperature, all 10 samples were combined for each kit separately, frozen, and dried in a speed vac. The mixtures were resuspended in 1 ml 0.5% TFA and subjected to SPE again with a Waters 100 mg tC18 SEP-PAK SPE column as described above. The eluates were vortexed and split into two aliquots for each TMT kit—one containing ∼5% of the total peptide mixture (250 μg) and a second aliquot containing ∼95% (4.5 mg). All aliquots were frozen and dried in a speed vac. The 250-μg aliquots of input material were separated into 8 fractions each, using a high pH reversed phase (HPRP) peptide fractionation kit (number 84868; Pierce). After column conditioning, 100 mg of the peptide resuspended in 300 ml 0.1% TFA was loaded onto a fractionation column and centrifuged at 3,000 × g for 2 min at RT. The sample was washed with 300 ml water followed by 300 ml of 5% acetonitrile (ACN) and 0.1% TFA. The sample was eluted in 8 fractions containing increasing amount of ACN, frozen, and dried in a speed vac. Peptide fractions were resuspended in 10 ml of 0.1% formic acid (FA) and quantified using the quantitative colorimetric peptide assay (23275; Pierce). The 4.75-mg aliquots were subjected to phosphopeptide enrichment via immobilized metal affinity chromatography (IMAC) using Ni-NTA magnetic agarose beads (Qiagen) as described previously. Briefly, the beads were washed three times with water, incubated in 40 mM EDTA (pH 8.0) for 30 minutes while shaking, and subsequently washed with water three times. The beads were then incubated with 100 mM FeCl3 for 30 minutes while shaking, and were washed four times with 80% acetonitrile–0.15% TFA. Samples were resuspended in 1 ml 80% acetonitrile–0.15% TFA, added to the beads, and incubated for 30 minutes at room temperature while shaking. Samples were subsequently washed three times with 1 ml 80% acetonitrile–0.15% TFA and eluted for 1 minute by vortexing in 100 μl of 50% acetonitrile and 0.7% NH4OH. Eluted phosphopeptides were acidified immediately with 50 μl 4% formic acid, frozen, and dried in a speed vac.
All samples were subjected to NanoLC-MS/MS analysis using an EASY-nLC ultraperformance liquid chromatography system (Thermo Fisher Scientific) coupled to a Q Exactive Plus hybrid quadrupole-Orbitrap mass spectrometer (Thermo Fisher Scientific) via an EASY-Spray nanoelectrospray ionization source (Thermo Fisher Scientific). Prior to injection, the phosphopeptide samples were resuspended in 22.5 ml 1% FA, and each of the HPRP fractions of the input material was resuspended in enough 0.1% FA to achieve a peptide concentration of approximately 0.1 mg/ml (which was determined precisely using the peptide quantitation assay described above). The phosphopeptides were analyzed with technical triplicate runs, with 6.5 ml of the sample injected for each. The 8 input HPRP fractions were analyzed in singlicate, with 10-μl injections (roughly 1 μg for each based on the precise concentration). For each injection, the sample was first trapped on an Acclaim PepMap 100 C18 trapping column (3-µg particle size, 75 µm by 20 mm) with 15 µl (phosphopeptide) or 22 µl (input) of solvent A (0.1% FA) at a variable flow rate dictated by a maximum pressure of 500 bar, after which the analytical separation was performed over a 105-min (input) or 210-min (phosphopeptide) gradient (flow rate of 300 nl/min) of 5% to 40% solvent B (90% ACN, 0.1% FA) using an Acclaim Pep-Map RSLC C18 analytical column (2-µg particle size, 75-µm by 500-mm column; Thermo Fisher Scientific) with a column temperature of 55°C. MS1 (precursor ions) was performed at 70,000 resolution with an AGC target of 3 × 10⁶ ions and a maximum injection time of 60 ms. MS2 spectra (product ions) were collected by data-dependent acquisition of the top 10 most abundant precursor ions with a charge greater than 1 per MS1 scan, with dynamic exclusion enabled for a window of 30 s. Precursor ions were filtered with a 0.7 m/z isolation window and fragmented with a normalized collision energy of 30. MS2 scans were performed at 35,000 resolution, with an AGC target of 1 × 10⁵ ions and a maximum injection time of 60 ms.
Data were searched against the UniProt human complete proteome database of reviewed (Swiss-Prot) and unreviewed (TrEMBL) proteins, which consisted of 54,185 sequences on the date of download (19 March 2019). Data analysis was performed using Proteome Discoverer 2.2, searching with both Sequest HT and MS Amanda 2.0 with the following default parameters: oxidation (15.995 Da on M) as a variable modification and carbamidomethyl (57.021 Da on C) and TMT10plex (229.163 Da on peptide N-term and K) as fixed modifications, and 2 missed cleavages (full trypsin specificity). TMT labeling efficiency was assessed as a quality-control measure by searching the input fraction for N-terminal TMT as a variable modification—confirming the labeling efficiency was at least 93% for both TMT kits. All phosphopeptide runs included phosphorylation (79.966 Da on S, T, or Y) as a variable modification. PSMs from each search algorithm were filtered to a 1% false discovery rate (FDR) using Percolator (63), and PTM site localization probabilities were determined using ptmRS (64). PSMs were grouped to unique peptides while maintaining a 1% FDR for peptides and a 90% localization threshold for PTMs—with quantitation for different phosphopeptide positional isoforms separated via the peptide isoform grouper node. Peptides from phosphopeptide and input fractions were grouped to proteins using the rules of strict parsimony, and proteins were filtered to 1% FDR using the protein FDR validator node. Reporter ion intensities for all PSMs with a coisolation interference below 0.5 (50% of the ion current in the isolation window) and an average signal intensity divided by noise (S/N) of >5 for reporter ions were summed at the peptide and protein level, but quantification for each data type (phospho and input) were kept separate. Peptides shared between protein groups were excluded from protein quantitation calculations. Protein and peptide isoform tabs from the PD2.2 results were exported as tab-delimited .txt files and analyzed with an in-house Python module based on a workflow previously described (65). Briefly, peptide group reporter intensities for each peptide group in the input material were summed for each TMT channel and each channel’s sum was divided by the average of all channels’ sums, resulting in channel-specific loading control normalization factors to correct for any deviation from equal protein/peptide input into the 10-sample comparison. Reporter intensities for peptide isoforms from the phosphopeptide runs and proteins from the input fraction runs were divided by the loading control normalization factors for each TMT channel, respectively. All loading control-normalized quantitation values were converted to log2 space. Protein-level quantitation was performed exclusively on master proteins—the most statistically significant protein representing a group of parsimonious proteins containing common peptides identified at 1% FDR. Phosphopeptide isoform measurements were calculated alone (abundance) and with normalization to any change in the corresponding master protein (relative occupancy) by subtracting log2 master protein values from PTM-containing quantitation values on a sample-specific basis. Comparisons across TMT kits were made by normalizing to the study pool channel on each kit.
Kinase set enrichment analysis was performed using a Web-based app (https://casecpb.shinyapps.io/ksea/) (43, 44, 66, 67). The kinase-substrate data set used for our analysis was PhosphoSitePlus only. For the KSEA plot in Fig. 6, default values were applied (P value cutoff of 0.05; substrate count cutoff of 5).
Data availability.
All raw data for the proteomics experiments are available online using accession number PXD019396 for ProteomeXchange (68) and accession number JPST000855 for jPOST Repository (69).
Supplementary Material
ACKNOWLEDGMENTS
We acknowledge members of the Hirschey and Emanuele laboratories for discussion and comments.
Conceptualization, C.A.M., M.J.E., and M.D.H.; Investigation, C.A.M., X.W., J.P.M., P.A.G., D.P.B., and D.L.; Writing - Original Draft, C.A.M., M.D.H., and M.J.E.; Writing - Review & Editing, all authors; Supervision, J.G.C., D.J.B., M.J.E., and M.D.H.; Project Administration, M.D.H. and M.J.E.; Funding Acquisition, M.D.H. and M.J.E.
The Emanuele lab is supported by the UNC University Cancer Research Fund (UCRF), the National Institutes of Health (R01GM120309 and R01GM134231), and the America Cancer Society (research scholar grant RSG-18-220-01-TBG). We also acknowledge the UNC Flow Cytometry Core Facility (supported in part by P30 CA016086 Cancer Center Core support grant to the UNC Lineberger Comprehensive Cancer Center). J.P.M. is supported by the National Science Foundation (graduate student research fellowship DGE1144081). C.A.M. was supported by the Duke training grant in nephrology (T32 DK007731). The Hirschey lab acknowledges funding support from The Ellison Medical Foundation, the Glenn Foundation, the National Institutes of Health, and NIA grant R01AG045351.
The content is solely the responsibility of the authors and does not necessarily represent the official views of the National Institutes of Health or other funding sources.
We declare no competing interests.
Footnotes
Supplemental material is available online only.
REFERENCES
- 1.Petroski MD, Deshaies RJ. 2005. Function and regulation of cullin-RING ubiquitin ligases. Nat Rev Mol Cell Biol 6:9–20. doi: 10.1038/nrm1547. [DOI] [PubMed] [Google Scholar]
- 2.Bai C, Sen P, Hofmann K, Ma L, Goebl M, Harper JW, Elledge SJ. 1996. SKP1 connects cell cycle regulators to the ubiquitin proteolysis machinery through a novel motif, the F-box. Cell 86:263–274. doi: 10.1016/S0092-8674(00)80098-7. [DOI] [PubMed] [Google Scholar]
- 3.Skowyra D, Craig KL, Tyers M, Elledge SJ, Harper JW. 1997. F-box proteins are receptors that recruit phosphorylated substrates to the SCF ubiquitin-ligase complex. Cell 91:209–219. doi: 10.1016/S0092-8674(00)80403-1. [DOI] [PubMed] [Google Scholar]
- 4.Malumbres M. 2014. Cyclin-dependent kinases. Genome Biol 15:122. doi: 10.1186/gb4184. [DOI] [PMC free article] [PubMed] [Google Scholar]
- 5.Choudhury R, Bonacci T, Arceci A, Lahiri D, Mills CA, Kernan JL, Branigan TB, DeCaprio JA, Burke DJ, Emanuele MJ. 2016. APC/C and SCF(cyclin F) constitute a reciprocal feedback circuit controlling S-phase entry. Cell Rep 16:3359–3372. doi: 10.1016/j.celrep.2016.08.058. [DOI] [PMC free article] [PubMed] [Google Scholar]
- 6.Choudhury R, Bonacci T, Wang X, Kernan JL, Liu P, Correspondence MJE, Truong A, Arceci A, Zhang Y, Mills CA, Emanuele MJ. 2017. The E3 ubiquitin ligase SCF(cyclin F) transmits AKT signaling to the cell-cycle machinery. Cell Rep 20:3212–3222. doi: 10.1016/j.celrep.2017.08.099. [DOI] [PMC free article] [PubMed] [Google Scholar]
- 7.Clijsters L, Hoencamp C, Calis JJA, Marzio A, Handgraaf SM, Cuitino MC, Rosenberg BR, Leone G, Pagano M. 2019. Cyclin F controls cell-cycle transcriptional outputs by directing the degradation of the three activator E2Fs. Mol Cell 74:1264–1277.e7. doi: 10.1016/j.molcel.2019.04.010. [DOI] [PMC free article] [PubMed] [Google Scholar]
- 8.Burdova K, Yang H, Faedda R, Hume S, Chauhan J, Ebner D, Kessler BM, Vendrell I, Drewry DH, Wells CI, Hatch SB, Dianov GL, Buffa FM, D'Angiolella V. 2019. E2F1 proteolysis via SCF‐cyclin F underlies synthetic lethality between cyclin F loss and Chk1 inhibition. EMBO J 38:101443. doi: 10.15252/embj.2018101443. [DOI] [PMC free article] [PubMed] [Google Scholar]
- 9.Wasserman D, Nachum S, Cohen M, Enrico TP, Noach-Hirsh M, Parasol J, Zomer-Polak S, Auerbach N, Sheinberger-Chorni E, Nevenzal H, Levi-Dadon N, Wang X, Lahmi R, Michaely E, Gerber D, Emanuele MJ, Tzur A. 2020. Cell cycle oscillators underlying orderly proteolysis of E2F8. Mol Biol Cell 31:725–857. doi: 10.1091/mbc.E19-12-0725. [DOI] [PMC free article] [PubMed] [Google Scholar]
- 10.Yuan R, Liu Q, Segeren HA, Yuniati L, Guardavaccaro D, Lebbink RJ, Westendorp B, de Bruin A. 2019. Cyclin F‐dependent degradation of E2F7 is critical for DNA repair and G2‐phase progression. EMBO J 38:101430. doi: 10.15252/embj.2018101430. [DOI] [PMC free article] [PubMed] [Google Scholar]
- 11.Emanuele MJ, Enrico TP, Mouery RD, Wasserman D, Nachum S, Tzur A. 2020. Complex cartography: regulation of E2F transcription factors by cyclin F and ubiquitin. Trends Cell Biol 30:640–652. doi: 10.1016/j.tcb.2020.05.002. [DOI] [PMC free article] [PubMed] [Google Scholar]
- 12.Bai C, Richman R, Elledge SJ. 1994. Human cyclin F. EMBO J 13:6087–6098. doi: 10.1002/j.1460-2075.1994.tb06955.x. [DOI] [PMC free article] [PubMed] [Google Scholar]
- 13.Tetzlaff MT, Bai C, Finegold M, Wilson J, Harper JW, Mahon KA, Elledge SJ. 2004. Cyclin F disruption compromises placental development and affects normal cell cycle execution. Mol Cell Biol 24:2487–2498. doi: 10.1128/mcb.24.6.2487-2498.2004. [DOI] [PMC free article] [PubMed] [Google Scholar]
- 14.Fischer M, Grossmann P, Padi M, DeCaprio JA. 2016. Integration of TP53, DREAM, MMB-FOXM1 and RB-E2F target gene analyses identifies cell cycle gene regulatory networks. Nucleic Acids Res 44:6070–6086. doi: 10.1093/nar/gkw523. [DOI] [PMC free article] [PubMed] [Google Scholar]
- 15.Bar-Joseph Z, Siegfried Z, Brandeis M, Brors B, Lu Y, Eils R, Dynlacht BD, Simon I. 2008. Genome-wide transcriptional analysis of the human cell cycle identifies genes differentially regulated in normal and cancer cells. Proc Natl Acad Sci U S A 105:955–960. doi: 10.1073/pnas.0704723105. [DOI] [PMC free article] [PubMed] [Google Scholar]
- 16.Grant GD, Brooks L, III, Zhang X, Mahoney JM, Martyanov V, Wood TA, Sherlock G, Cheng C, Whitfield ML. 2013. Identification of cell cycle-regulated genes periodically expressed in U2OS cells and their regulation by FOXM1 and E2F transcription factors. Mol Biol Cell 24:3634–3650. doi: 10.1091/mbc.E13-05-0264. [DOI] [PMC free article] [PubMed] [Google Scholar]
- 17.Sadasivam S, Duan S, DeCaprio JA. 2012. The MuvB complex sequentially recruits B-Myb and FoxM1 to promote mitotic gene expression. Genes Dev 26:474–489. doi: 10.1101/gad.181933.111. [DOI] [PMC free article] [PubMed] [Google Scholar]
- 18.Whitfield ML, Sherlock G, Saldanha AJ, Murray JI, Ball CA, Alexander KE, Matese JC, Perou CM, Hurt MM, Brown PO, Botstein D, Carolina N. 2002. Identification of genes periodically expressed in the human cell cycle and their expression in tumors. Mol Biol Cell 13:1977–2000. doi: 10.1091/mbc.02-02-0030. [DOI] [PMC free article] [PubMed] [Google Scholar]
- 19.Peña-Diaz J, Hegre S.a, Anderssen E, Aas P.a, Mjelle R, Gilfillan GD, Lyle R, Drabløs F, Krokan HE, Sætrom P. 2013. Transcription profiling during the cell cycle shows that a subset of Polycomb-targeted genes is upregulated during DNA replication. Nucleic Acids Res 41:2846–2856. doi: 10.1093/nar/gks1336. [DOI] [PMC free article] [PubMed] [Google Scholar]
- 20.D'Angiolella V, Esencay M, Pagano M. 2013. A cyclin without cyclin-dependent kinases: cyclin F controls genome stability through ubiquitin-mediated proteolysis. Trends Cell Biol 23:135–140. doi: 10.1016/j.tcb.2012.10.011. [DOI] [PMC free article] [PubMed] [Google Scholar]
- 21.Wątroba M, Dudek I, Skoda M, Stangret A, Rzodkiewicz P, Szukiewicz D. 2017. Sirtuins, epigenetics and longevity. Ageing Res Rev 40:11–19. doi: 10.1016/j.arr.2017.08.001. [DOI] [PubMed] [Google Scholar]
- 22.Osborne B, Bentley NL, Montgomery MK, Turner N. 2016. The role of mitochondrial sirtuins in health and disease. Free Radic Biol Med 100:164–174. doi: 10.1016/j.freeradbiomed.2016.04.197. [DOI] [PubMed] [Google Scholar]
- 23.Frye RA. 1999. Characterization of five human cDNAs with homology to the yeast SIR2 gene: Sir2-like proteins (Sirtuins) metabolize NAD and may have protein ADP-ribosyltransferase activity. Biochem Biophys Res Commun 260:273–279. doi: 10.1006/bbrc.1999.0897. [DOI] [PubMed] [Google Scholar]
- 24.Du J, Zhou Y, Su X, Yu JJ, Khan S, Jiang H, Kim JH, Woo J, Kim JH, Choi BH, He B, Chen W, Zhang S, Cerione RA, Auwerx J, Hao Q, Lin H. 2011. Sirt5 is a NAD-dependent protein lysine demalonylase and desuccinylase. Science 334:806–809. doi: 10.1126/science.1207861. [DOI] [PMC free article] [PubMed] [Google Scholar]
- 25.Peng C, Lu Z, Xie Z, Cheng Z, Chen Y, Tan M, Luo H, Zhang Y, He W, Yang K, Zwaans BMMM, Tishkoff D, Ho L, Lombard D, He TC, Dai J, Verdin E, Ye Y, Zhao Y, Yangʈ K, Zwaans BMMM, Tishkoff D, Ho L, Lombard D, Heʈ T-C, Dai J, Verdin E, Ye Y, Zhao Y. 2011. The first identification of lysine malonylation substrates and its regulatory enzyme. Mol Cell Proteomics 10:M111.012658. doi: 10.1074/mcp.M111.012658. [DOI] [PMC free article] [PubMed] [Google Scholar]
- 26.Tan M, Peng C, Anderson KA, Chhoy P, Xie Z, Dai L, Park J, Chen Y, Huang H, Zhang Y, Ro J, Wagner GR, Green MF, Madsen AS, Schmiesing J, Peterson BS, Xu G, Ilkayeva OR, Muehlbauer MJ, Braulke T, Mühlhausen C, Backos DS, Olsen CA, McGuire PJ, Pletcher SD, Lombard DB, Hirschey MD, Zhao Y. 2014. Lysine glutarylation is a protein posttranslational modification regulated by SIRT5. Cell Metab 19:605–617. doi: 10.1016/j.cmet.2014.03.014. [DOI] [PMC free article] [PubMed] [Google Scholar]
- 27.Matsushita N, Yonashiro R, Ogata Y, Sugiura A, Nagashima S, Fukuda T, Inatome R, Yanagi S. 2011. Distinct regulation of mitochondrial localization and stability of two human Sirt5 isoforms. Genes Cells 16:190–202. doi: 10.1111/j.1365-2443.2010.01475.x. [DOI] [PubMed] [Google Scholar]
- 28.Park J, Chen Y, Tishkoff DX, Peng C, Tan M, Dai L, Xie Z, Zhang Y, Zwaans BMM, Skinner ME, Lombard DB, Zhao Y. 2013. SIRT5-mediated lysine desuccinylation impacts diverse metabolic pathways. Mol Cell 50:919–930. doi: 10.1016/j.molcel.2013.06.001. [DOI] [PMC free article] [PubMed] [Google Scholar]
- 29.Nishida Y, Rardin MJ, Carrico C, He W, Sahu AK, Gut P, Najjar R, Fitch M, Hellerstein M, Gibson BW, Verdin E. 2015. SIRT5 regulates both cytosolic and mitochondrial protein malonylation with glycolysis as a major target. Mol Cell 59:321–332. doi: 10.1016/j.molcel.2015.05.022. [DOI] [PMC free article] [PubMed] [Google Scholar]
- 30.Schwob E, Böhm T, Mendenhall MD, Nasmyth K. 1994. The B-type cyclin kinase inhibitor p40SIC1 controls the G1 to S transition in S. cerevisiae. Cell 79:233–244. doi: 10.1016/0092-8674(94)90193-7. [DOI] [PubMed] [Google Scholar]
- 31.Kernan J, Bonacci T, Emanuele MJ. 2018. Who guards the guardian? Mechanisms that restrain APC/C during the cell cycle. Biochim Biophys Acta Mol Cell Res 1865:1924–1933. doi: 10.1016/j.bbamcr.2018.09.011. [DOI] [PMC free article] [PubMed] [Google Scholar]
- 32.Sigl R, Wandke C, Rauch V, Kirk J, Hunt T, Geley S. 2009. Loss of the mammalian APC/C activator FZR1 shortens G1 and lengthens S phase but has little effect on exit from mitosis. J Cell Sci 122:4208–4217. doi: 10.1242/jcs.054197. [DOI] [PubMed] [Google Scholar]
- 33.Yuan X, Srividhya J, De Luca T, Lee J-HE, Pomerening JR. 2014. Uncovering the role of APC-Cdh1 in generating the dynamics of S-phase onset. Mol Biol Cell 25:441–456. doi: 10.1091/mbc.E13-08-0480. [DOI] [PMC free article] [PubMed] [Google Scholar]
- 34.Ferreira MF, Santocanale C, Drury LS, Diffley JF. 2000. Dbf4p, an essential S phase-promoting factor, is targeted for degradation by the anaphase-promoting complex. Mol Cell Biol 20:242–248. doi: 10.1128/mcb.20.1.242-248.2000. [DOI] [PMC free article] [PubMed] [Google Scholar]
- 35.Koh JLY, Ding H, Costanzo M, Baryshnikova A, Toufighi K, Bader GD, Myers CL, Andrews BJ, Boone C. 2010. DRYGIN: a database of quantitative genetic interaction networks in yeast. Nucleic Acids Res 38:D502–D507. doi: 10.1093/nar/gkp820. [DOI] [PMC free article] [PubMed] [Google Scholar]
- 36.Delgoshaie N, Tang X, Kanshin ED, Williams EC, Rudner AD, Thibault P, Tyers M, Verreault A. 2014. Regulation of the histone deacetylase Hst3 by cyclin-dependent kinases and the ubiquitin ligase SCFCdc4. J Biol Chem 289:13186–13196. doi: 10.1074/jbc.M113.523530. [DOI] [PMC free article] [PubMed] [Google Scholar]
- 37.Edenberg ER, Vashisht AA, Topacio BR, Wohlschlegel JA, Toczyski DP. 2014. Hst3 is turned over by a replication stress-responsive SCFCdc4 phospho-degron. Proc Natl Acad Sci U S A 111:5962–5967. doi: 10.1073/pnas.1315325111. [DOI] [PMC free article] [PubMed] [Google Scholar]
- 38.Jiang L, Xiong J, Zhan J, Yuan F, Tang M, Zhang C, Cao Z, Chen Y, Lu X, Li Y, Wang H, Wang L, Wang J, Zhu W-G, Wang H. 2017. Ubiquitin-specific peptidase 7 (USP7)-mediated deubiquitination of the histone deacetylase SIRT7 regulates gluconeogenesis. J Biol Chem 292:13296–13311. doi: 10.1074/jbc.M117.780130. [DOI] [PMC free article] [PubMed] [Google Scholar]
- 39.Emanuele MJ, Enrico T, Mouery R, Wasserman D, Nachum S, Tzur A. 2020. Complex cartography: E2F transcriptional control by Cyclin F and ubiquitin. Trends Cell Biol 30:640–652. doi: 10.1016/j.tcb.2020.05.002. [DOI] [PMC free article] [PubMed] [Google Scholar]
- 40.Matson JP, House AM, Grant GD, Wu H, Perez J, Cook JG. 2019. Intrinsic checkpoint deficiency during cell cycle re-entry from quiescence. J Cell Biol 218:2169–2184. doi: 10.1083/jcb.201902143. [DOI] [PMC free article] [PubMed] [Google Scholar]
- 41.Grant GD, Cook JG. The temporal regulation of S phase proteins during G1. Adv Exp Med Biol 1042:335–369. doi: 10.1007/978-981-10-6955-0_16. [DOI] [PMC free article] [PubMed] [Google Scholar]
- 42.Matson JP, Dumitru R, Coryell P, Baxley RM, Chen W, Twaroski K, Webber BR, Tolar J, Bielinsky AK, Purvis JE, Cook JG. 2017. Rapid DNA replication origin licensing protects stem cell pluripotency. Elife 6:e30473. doi: 10.7554/eLife.30473. [DOI] [PMC free article] [PubMed] [Google Scholar]
- 43.Wiredja DD, Koyutü Rk M, Chance MR. 2017. The KSEA App: a web-based tool for kinase activity inference from quantitative phosphoproteomics. Bioinformatics 33:3489–3491. doi: 10.1093/bioinformatics/btx415. [DOI] [PMC free article] [PubMed] [Google Scholar]
- 44.Casado P, Rodriguez-Prados JC, Cosulich SC, Guichard S, Vanhaesebroeck B, Joel S, Cutillas PR. 2013. Kinase-substrate enrichment analysis provides insights into the heterogeneity of signaling pathway activation in leukemia cells. Sci Signal 6:rs6. doi: 10.1126/scisignal.2003573. [DOI] [PubMed] [Google Scholar]
- 45.Chung M, Liu C, Yang HW, Köberlin MS, Cappell SD, Meyer T. 2019. Transient hysteresis in CDK4/6 activity underlies passage of the restriction point in G1. Mol Cell 76:562–573.e4. doi: 10.1016/j.molcel.2019.08.020. [DOI] [PMC free article] [PubMed] [Google Scholar]
- 46.Mailand N, Diffley JFX. 2005. CDKs promote DNA replication origin licensing in human cells by protecting Cdc6 from APC/C-dependent proteolysis. Cell 122:915–926. doi: 10.1016/j.cell.2005.08.013. [DOI] [PubMed] [Google Scholar]
- 47.Alexandrow MG, Hamlin JL. 2004. Cdc6 chromatin affinity is unaffected by serine-54 phosphorylation, S-phase progression, and overexpression of cyclin A. Mol Cell Biol 24:1614–1627. doi: 10.1128/mcb.24.4.1614-1627.2004. [DOI] [PMC free article] [PubMed] [Google Scholar]
- 48.Ayad NG. 2005. CDKs give Cdc6 a license to drive into S phase. Cell 122:825–827. doi: 10.1016/j.cell.2005.09.001. [DOI] [PubMed] [Google Scholar]
- 49.Ndez JM, Stillman B. 2000. Chromatin association of human origin recognition complex, Cdc6, and minichromosome maintenance proteins during the cell cycle: assembly of prereplication complexes in late mitosis. Mol Cell Biol 20:8602–8612. doi: 10.1128/mcb.20.22.8602-8612.2000. [DOI] [PMC free article] [PubMed] [Google Scholar]
- 50.Yan Z, DeGregori J, Shohet R, Leone G, Stillman B, Nevins JR, Williams RS. 1998. Cdc6 is regulated by E2F and is essential for DNA replication in mammalian cells. Proc Natl Acad Sci U S A 95:3603–3608. doi: 10.1073/pnas.95.7.3603. [DOI] [PMC free article] [PubMed] [Google Scholar]
- 51.Thomae AW, Baltin J, Pich D, Deutsch MJ, Ravasz M, Zeller K, Gossen M, Hammerschmidt W, Schepers A. 2011. Different roles of the human Orc6 protein in the replication initiation process. Cell Mol Life Sci 68:3741–3756. doi: 10.1007/s00018-011-0675-9. [DOI] [PMC free article] [PubMed] [Google Scholar]
- 52.Ghosh S, Vassilev AP, Zhang J, Zhao Y, DePamphilis ML. 2011. Assembly of the human origin recognition complex occurs through independent nuclear localization of its components. J Biol Chem 286:23831–23841. doi: 10.1074/jbc.M110.215988. [DOI] [PMC free article] [PubMed] [Google Scholar]
- 53.Depamphilis ML. 2005. Cell cycle dependent regulation of the origin recognition complex. Cell Cycle 4:70–79. doi: 10.4161/cc.4.1.1333. [DOI] [PubMed] [Google Scholar]
- 54.Ruvinsky I, Meyuhas O. 2006. Ribosomal protein S6 phosphorylation: from protein synthesis to cell size. Trends Biochem Sci 31:342–348. doi: 10.1016/j.tibs.2006.04.003. [DOI] [PubMed] [Google Scholar]
- 55.Gao D, Inuzuka H, Korenjak M, Tseng A, Wu T, Wan L, Kirschner M, Dyson N, Wei W. 2009. Cdh1 regulates cell cycle through modulating the claspin/Chk1 and the Rb/E2F1 pathways. Mol Biol Cell 20:3305–3316. doi: 10.1091/mbc.e09-01-0092. [DOI] [PMC free article] [PubMed] [Google Scholar]
- 56.Ohtsubo M, Theodoras AM, Schumacher J, Roberts JM, Pagano M. 1995. Human cyclin E, a nuclear protein essential for the G1-to-S phase transition. Mol Cell Biol 15:2612–2624. doi: 10.1128/mcb.15.5.2612. [DOI] [PMC free article] [PubMed] [Google Scholar]
- 57.Mavrommati I, Faedda R, Galasso G, Li J, Burdova K, Fischer R, Kessler BM, Carrero ZI, Guardavaccaro D, Pagano M, D'Angiolella V. 2018. β-TrCP- and casein kinase II-mediated degradation of cyclin F controls timely mitotic progression. Cell Rep 24:3404–3412. doi: 10.1016/j.celrep.2018.08.076. [DOI] [PMC free article] [PubMed] [Google Scholar]
- 58.Deshmukh RS, Sharma S, Das S. 2018. Cyclin F-dependent degradation of RBPJ inhibits IDH1R132H-mediated tumorigenesis. Cancer Res 78:6386–6398. doi: 10.1158/0008-5472.CAN-18-1772. [DOI] [PubMed] [Google Scholar]
- 59.Lee H-J, Jedrychowski MP, Vinayagam A, Wu N, Shyh-Chang N, Hu Y, Min-Wen C, Moore JK, Asara JM, Lyssiotis CA, Perrimon N, Gygi SP, Cantley LC, Kirschner MW. 2017. Proteomic and metabolomic characterization of a mammalian cellular transition from quiescence to proliferation. Cell Rep 20:721–736. doi: 10.1016/j.celrep.2017.06.074. [DOI] [PMC free article] [PubMed] [Google Scholar]
- 60.Igci M, Kalender ME, Borazan E, Bozgeyik I, Bayraktar R, Bozgeyik E, Camci C, Arslan A. 2016. High-throughput screening of Sirtuin family of genes in breast cancer. Gene 586:123–128. doi: 10.1016/j.gene.2016.04.023. [DOI] [PubMed] [Google Scholar]
- 61.Lu W, Zuo Y, Feng Y, Zhang M. 2014. SIRT5 facilitates cancer cell growth and drug resistance in non-small cell lung cancer. Tumour Biol 35:10699–10705. doi: 10.1007/s13277-014-2372-4. [DOI] [PubMed] [Google Scholar]
- 62.Amberg DC, Burke DJ. 2016. Classical genetics with Saccharomyces cerevisiae. Cold Spring Harb Protoc 2016:413–421. [DOI] [PubMed] [Google Scholar]
- 63.Käll L, Canterbury JD, Weston J, Noble WS, MacCoss MJ. 2007. Semi-supervised learning for peptide identification from shotgun proteomics datasets. Nat Methods 4:923–925. doi: 10.1038/nmeth1113. [DOI] [PubMed] [Google Scholar]
- 64.Taus T, Köcher T, Pichler P, Paschke C, Schmidt A, Henrich C, Mechtler K. 2011. Universal and confident phosphorylation site localization using phosphoRS. J Proteome Res 10:5354–5362. doi: 10.1021/pr200611n. [DOI] [PubMed] [Google Scholar]
- 65.Fisher-Wellman KH, Draper JA, Davidson MT, Williams AS, Narowski TM, Slentz DH, Ilkayeva OR, Stevens RD, Wagner GR, Najjar R, Hirschey MD, Thompson JW, Olson DP, Kelly DP, Koves TR, Grimsrud PA, Muoio DM. 2019. Respiratory phenomics across multiple models of protein hyperacylation in cardiac mitochondria reveals a marginal impact on bioenergetics. Cell Rep 26:1557–1572.e8. doi: 10.1016/j.celrep.2019.01.057. [DOI] [PMC free article] [PubMed] [Google Scholar]
- 66.Hornbeck PV, Zhang B, Murray B, Kornhauser JM, Latham V, Skrzypek E. 2015. PhosphoSitePlus, 2014: mutations, PTMs and recalibrations. Nucleic Acids Res 43:D512–D520. doi: 10.1093/nar/gku1267. [DOI] [PMC free article] [PubMed] [Google Scholar]
- 67.Horn H, Schoof EM, Kim J, Robin X, Miller ML, Diella F, Palma A, Cesareni G, Jensen LJ, Linding R. 2014. KinomeXplorer: an integrated platform for kinome biology studies. Nat Methods 11:603–604. doi: 10.1038/nmeth.2968. [DOI] [PubMed] [Google Scholar]
- 68.Deutsch EW, Csordas A, Sun Z, Jarnuczak A, Perez-Riverol Y, Ternent T, Campbell DS, Bernal-Llinares M, Okuda S, Kawano S, Moritz RL, Carver JJ, Wang M, Ishihama Y, Bandeira N, Hermjakob H, Vizcaíno JA. 2017. The ProteomeXchange consortium in 2017: supporting the cultural change in proteomics public data deposition. Nucleic Acids Res 45:D1100–D1106. doi: 10.1093/nar/gkw936. [DOI] [PMC free article] [PubMed] [Google Scholar]
- 69.Okuda S, Watanabe Y, Moriya Y, Kawano S, Yamamoto T, Matsumoto M, Takami T, Kobayashi D, Araki N, Yoshizawa AC, Tabata T, Sugiyama N, Goto S, Ishihama Y. 2016. jPOSTrepo: an international standard data repository for proteomes. Nucleic Acids Res 45:D1107–D1111. doi: 10.1093/nar/gkw1080. [DOI] [PMC free article] [PubMed] [Google Scholar]
Associated Data
This section collects any data citations, data availability statements, or supplementary materials included in this article.
Supplementary Materials
Data Availability Statement
All raw data for the proteomics experiments are available online using accession number PXD019396 for ProteomeXchange (68) and accession number JPST000855 for jPOST Repository (69).