

Abstract
In multipredator systems, group sizes of social carnivores are shaped by the asymmetric intraguild interactions. Subordinate social carnivores experience low recruitment rates as an outcome of predation pressure. In South and Southeast Asia, the Tiger (Panthera tigris), Dhole (Cuon alpinus), and Leopard (Panthera pardus) form a widely distributed sympatric guild of large carnivores, wherein tigers are the apex predators followed by dhole and leopard. In this study, we attempted to understand the variation in pack size of a social carnivore, the dhole, at two neighboring sites in the Central Indian landscape. We further evaluated local‐scale patterns of variation in pack size at a larger scale by doing a distribution‐wide assessment across the dhole ranging countries. At the local scale, we found an inverse relationship between the density of tiger and pack size of dhole while accounting for variability in resources and habitat heterogeneity. Larger dhole packs (16.8 ± 3.1) were observed at the site where the tiger density was low (0.46/100 km2), whereas a smaller pack size (6.4 ± 1.3) was observed in the site with high tiger density (5.36/100 km2). Our results for the distribution‐wide assessment were concordant with local‐scale results, showing a negative association of pack size with the tiger densities (effect size −0.77) and a positive association with the prey abundance (effect size 0.64). The study advances our understanding to answer the age‐old question of “what drives the pack size of social predators in a multipredator system?” This study also highlights the importance of understanding demographic responses of subordinate predator for varying competitor densities, often helpful in making informed decisions for conservation and management strategies such as population recovery and translocation of species.
Keywords: Apex predator, Cuon alpinus, dhole, intraguild interactions, pack size
This study focuses on understanding responses of a subordinate but endangered canid, the dhole, to varying densities of tigers. We found an inverse pattern between the apex predator density and group size of a subordinate predator while accounting for variability in resources and habitat heterogeneity. Our study highlights the importance of understanding species responses to each other, crucial for effective conservation and management implications.

1. INTRODUCTION
In the past few decades, the focus of wildlife biology studies has shifted from single species targeted approach to an ecosystem conservation approach (Linnell & Strand, 2000). This holistic approach unveils how interspecific interactions can alter community structures and ecosystem functioning (Ford & Goheen, 2015). Often considered as keystone species, large carnivores regulate the ecosystem functioning through top‐down mechanisms (Caro & O'Doherty, 1999; Ritchie & Johnson, 2009). One such mechanism is intraguild competition that shapes the predatory guild (Palomares & Caro, 1999). However, in a multipredator system, the strength and direction of competition are complex. Therefore, it is imperative to understand behavioral and demographic responses of carnivores to each other, for safeguarding their viable populations and for maintaining ecosystem equilibrium.
One such multipredator system found in South and Southeast Asian forests is of the tiger, dhole, and leopard. Wherein, the two big cats are solitary and the dhole is a social canid. Based on their physiological demands and competitive abilities, tigers (180–245 kg) are considered to be top predators followed by leopards (46–65 kg) and dholes (10–21 kg) (Steinmetz et al., 2013). In the Indian subcontinent, dholes have been widely studied along with tigers and leopards under various ecological settings to understand the dynamics of intraguild competition. The findings suggest that the coexistence among these carnivores is facilitated by abundant prey resources (Acharya, 2007; Johnsingh, 1992; Karanth & Sunquist, 1995, 2000; Wang & Macdonald, 2009; Wegge et al., 2009). However, when resources are scarce, species might show fine‐scale adjustments in spatiotemporal activity patterns to allocate resources and to avoid competition from the dominant carnivore (Karanth et al., 2017; Rayan & Linkie, 2016). For example, a study conducted in Kuiburi National Park, Thailand; found tiger presence to be solely correlated with prey rich sites, whereas, presence probability of dhole and leopard was a trade‐off between prey availability and active spatial avoidance of tigers (Steinmetz et al., 2013). Whereas, tiger depleted system of Northern Laos has shown a significant increase in site occupancy of dholes, (Rasphone et al., 2019).
However, a crucial aspect that requires further understanding is that of the social structure dholes live in. In social carnivores, group size is a vital survival strategy and has definite fitness consequences (Courchamp & Macdonald, 2001; Stephens & Sutherland, 1999). For example, the pack size of African wild dog (Lycon pictus), may vary from 3 to 20 individuals (Creel & Creel, 1995); however, the optimum pack size of at least 4–5 individuals is crucial for foraging, breeding, and survival (Courchamp et al., 2000). Similarly, in African lions (Panthera leo leo), social group size may vary between 2–35, depending on social factors like social stress, kinship, alloparental care, and site‐specific environmental factors like resource distribution and availability (Loveridge et al., 2009; Macdonald, 1983; Orsdol et al., 1985).
Multiple ecological correlations can explain the rate at which conspecifics interact with each other and form social units. Prey abundance, composition, and distribution are known to influence social structuring in carnivores (Périquet et al., 2015). For instance, under scarce prey conditions in the African savanna, lions either become solitary or form large groups (to kill large‐bodied prey) to maximize their food intake (Mbizah et al., 2020). Carnivore group sizes might also vary in response to landscape fragmentation, Atwood (2006) recorded coyote (Canis latrans) group sizes to be large in aggregated forest patches in comparison with fragmented and corridor patches. Similarly, intraspecific group size variation in carnivores can potentially be an outcome of seasonality, disease prevalence, and anthropogenic disturbances (Gusset & Macdonald, 2010).
Asymmetric intraguild interactions are also known to shape group sizes in social carnivores. Maintaining larger groups would be advantageous for foraging, breeding, and coexisting with larger predators (Courchamp & Macdonald, 2001). However, in the African savanna ecosystem, the group sizes of subordinate predators such as African wild dogs, and spotted hyenas (Crocuta crocuta) (Creel & Creel, 1996, 1998; M'soka et al., 2016; Périquet et al., 2015) have been recorded to be inversely related to lion densities. The reduced group sizes in subordinate competitors are an outcome of predation pressure, low recruitment rates, and reduced energy gains due to the inability to guard kills against apex predators (Courchamp & Macdonald, 2001).
According to the International Union for Conservation of Nature, India has the largest dhole population across the dhole‐ranging countries (Kamler, 2015). Interestingly, within India there is an apparent variation in dhole pack sizes; the smallest dhole packs of 2–3 individuals are reported from the evergreen forest and rugged terrain of northeast, whereas, the average pack size of around 12 to 14 individuals is reported from the dry deciduous forest of Central and Southern India (Bashir et al., 2014; Majumder et al., 2011; Ramesh et al., 2012; Selvan et al., 2014). In comparison with India, the dhole population in Southeast Asia is much more fragmented, and reported pack sizes are also small (~ 4 to 5) (Kamler et al., 2020). The smaller pack sizes in Southeast Asia are hypothesized to be an adaptation to stalk and coordinate hunt through the thick rainforests (Kawanishi & Sunquist, 2008). Kawanishi and Sunquist (2008) also suggested smaller packs to be energetically beneficial due to the scarcity of large‐bodied prey. However, multiple diet studies show site‐specific prey preference by dholes, ranging from small to large body‐sized prey (Grassman et al., 2005, Slangsingha et al., 2007, Charaspet et al. 2015; Khoewsree et al., 2020). Additionally, a few studies suggest, rather than prey size class, it is the prey availability and its spatial distribution that potentially impacts prey choice and pack size (Hayward et al., 2014; Kamler et al. 2020). So far, most of the competing hypotheses for dhole pack size variation are only based on diet studies. However, crucial ecological correlates such as varying competitor density (Green et al., 2019), prey availability (Macdonald, 1983), habitat contiguity (Atwood, 2006), and terrain complexity (Kamler et al. 2020), have been missing from the previous studies.
We observed a significant variation in pack size of dholes at the two neighboring protected areas having similar ecological settings, Tadoba Andhari Tiger Reserve and Navegaon Nagzira Tiger Reserve in the Central Indian Landscape, Maharashtra, India. To understand this intraspecific variation, we investigated underlying factors that potentially govern group size variation in social carnivores. We further elucidate our site‐specific patterns at a larger scale by doing a distribution‐wide assessment of pack size across dhole range countries. Based on previous knowledge we attempted to answer: 1) How does intraguild competition with tiger's effect dhole pack size? Asymmetric intraguild competition is a crucial aspect that shapes carnivore group size (Macdonald, 1983), high intraguild competition from larger predators is known to result in reduced group sizes and low recruitment rates in subordinate social carnivores (Groom et al., 2017). Therefore, we hypothesize that dhole packs would be smaller in high tiger density areas. 2) How prey availability correlates to dhole pack size? Variation in carnivore group size is a demographic adaptation to varying prey availability (Périquet et al., 2015). Therefore, we hypothesize that dhole pack size would be positively correlated to higher prey density, whereas it would be physiologically beneficial to be in small groups when prey resources are scarce. 3) Intraspecific group size variation is also known to be a function of habitat contiguity (Atwood, 2006), therefore, we hypothesize that larger dhole packs would positively correlate to contiguous undisturbed habitat patches, whereas small packs would be associated with small and disturbed habitat patches. 4) Dhole packs have been observed to be smaller in hilly terrain in comparison with flat terrains as an adaptation to the spatial distribution of prey and its availability (Kamler et al. 2020), therefore, we also investigated if pack size is influenced by terrain type.
2. METHODS AND MATERIALS
2.1. Study area
The study was primarily conducted at two neighboring sites in the Eastern Vidarbha Tiger Landscape within the greater Central Indian Tiger Landscape. The Two sites were; the Tadoba Andhari Tiger Reserve (TATR) and Navegaon Nagzira Tiger Reserve (NNTR) (Figure 1). TATR (19.95428 E to 20.51695 E and 79.12749 N to 79.73494 N) has an area of 625 km2 core and 1,127.17 km2 buffer, and NNTR (20.86209 E to 21.44738 E and 79.69802 N to 80.39064 N) has 656 km2 of core and 1,241.24 km2 of buffer. According to the biogeographic classification of India, both the study sites are in the Deccan Plateau zone (Rodgers & Panwar, 1988) and are located at a distance of ~ 85 km from each other. The study sites experience subtropical climate with three distinct seasons‐ summer, monsoon, and winter. The Reserves receive southwest monsoons with rainfall (1100–1500 mm) persisting from June to September. The Forest type is Southern tropical dry deciduous (Champion & Seth, 1968). Tectona grandis is the dominant species followed by Terminalia tomentosa and Lagerstroemia parviflora in the study sites. The terrain type is mostly plain with shallow valleys and rounded hills. Tiger, leopard, and dhole form the major predatory guild in the study sites and chital (Axis axis), sambar (Rusa unicolor), nilgai (Boselaphus tragocamelus), wild pig (Sus scrofa), gaur (Bos gaurus), barking deer (Muntiacus muntjac) are the major prey species (Dhanwatey et al., 2013).
FIGURE 1.

Map showing Tadoba Andhari Tiger Reserve and Navegaon Nagzira Tiger Reserve in the Eastern Vidarbha Landscape. Inset showing study area location in the map of India
2.2. Field and analytical method: Dhole pack size variation across study sites
In field studies, individual identification of dhole packs and their members is a challenge owing to their uniform pelage pattern (Modi et al., 2019). To overcome this challenge, we generated information on the spatial distribution of dhole packs in the study sites using a systematic camera trapping design optimized for large carnivores (Karanth & Nichols, 1998). The effective study area of 1,103.767 km2 and 1,273.116 km2 in TATR and NNTR, respectively, was divided into sampling grids of 2 km2. 381 grids in TATR and 596 grids in NNTR were covered for this exercise and pair of camera traps were active in each grid for 25–30 days. Camera trap locations were chosen based on the presence of indirect signs like tracks and dhole scats to maximize dhole‐captures. This resulted in the identification of intensive use areas by dholes in the study sites based on number of captures at each camera location. Being territorial and social species these intensive use areas are mutually exclusive for each pack and the probability of capture decreases as you move away from the core area (Roffler Waite et al., 2019). After identification of dhole intensive use areas across the study sites, an effort was made to actively track dholes on foot and using a vehicle. We located dholes while resting, on kills, and while moving across their intensive use areas and video‐graphed (Canon Powershot SX 50) them for estimating number of individuals in each dhole pack. This was done on weekly basis for each identified pack for the duration of 5 months.
2.3. a) Field and Analytical method: Variation in prey composition and density across study sites
Line transect‐based distance sampling (Buckland et al., 2001) was used to estimate prey densities at the two sites. Line transects were laid in a stratified random framework to ensure spatial coverage of all vegetation types. All transects were 2 km in length. The survey effort of 950 km and 984 km was put in TATR and NNTR, respectively. Data for species, group size, and composition, GPS (global positioning system) location of every observation, bearing of the animal using a compass and angular sighting distance using laser range finders, were recorded whenever sightings were made online transects.
2.4. b) Estimation of ungulate species across study sites
The individual density of all the species was calculated using Distance program version 6.2 (Thomas et al., 2010). We first examined the data from both sites for each species separately. Following this, the species observations at distances beyond which sightings were almost none were dropped or observations were binned to achieve model fit. Akaike information criterion and goodness‐of‐fit (GOF‐p) tests were used to judge and the fit of the model. Based on the selected model, individual density () and estimates of group density () were derived for each species.
2.5. a) Field and Analytical method: Variation in tiger density across study sites
Capture–recapture‐based camera trapping was done to estimate densities of carnivores following standard protocols (Karanth & Nichols, 1998). A grid size of 2 km2 was used for camera trap placement. Based on the sign survey, camera traps were stationed on both sides of the trails, at junctions and water sources to maximize photo captures (Karanth & Nichols, 1998). Distance between the camera stations was between 1 km to 1.5 km to ensure spatial coverage in the sampling area and capture probability of the study population (Pollock et al., 1990). A closing period of 30 days was kept to ensure demographic closure.
2.6. b) Density estimation of Tiger across study sites
To estimate tiger densities at the two sites, maximum likelihood SECR (Borchers & Efford, 2008) approach was applied using secr 4.3.0 R package (Efford, 2020). We obtained capture probability at the activity center (g0) and spatial scale of detection (σ) that elucidates how the capture rate decreases with the increasing distance from activity center. SECR model prediction is based on the habitat mask that denotes habitat of the study area and possible locations that can act as activity centers for the individuals of the study population (Efford, 2011; Young et al., 2019). We created habitat suitability mask for both the tiger reserves and areas not suitable for activity centers (Villages and water bodies near around villages) were removed for the analysis (Grey et al., 2013). Further, based on movement parameter, we analyzed models at buffers of 15 km and 20 km for NNTR; and 12 km, 15 km, and 20 km for TATR, to account for individuals staying outside the buffer region of the tiger reserves and to get stable density estimates and accuracy (Devens et al.,2018, 2020; Kalle et al., 2011). We compared four models (null model, g0, σ, and g0 + σ) and the best fit model was chosen based on the lowest Akaike Information Criterion.
2.7. a) Data sources for distribution‐wide assessment of dhole pack size
Through Google scholar, we searched for scientific literature on pack size of dholes, using the keywords “Cuon alpinus”, “Dhole”, “Average”, “Mean”, and “Pack size”. Our search resulted in 34 scientific assessments from 1973 to 2018 that had reported average pack size of dholes. These 34 assessments belonged to 24 unique protected areas across dhole ranging countries in South and Southeast Asia. 18 of these unique sites were also a part of the recently published dhole diet review (Srivathsa et al., 2020). Subsequently, following a snowball sampling approach (Handcock & Gile, 2011), we referred to the aforementioned 34 assessments to collate data on tiger density along with prey density (of the closest or same assessment year). To investigate the effect of patch contiguity, we considered size of the protected area and to address terrain type of the protected areas, we considered elevational heterogeneity and terrain ruggedness index of the respective sites. The digital elevation model (DEM) available for global coverage was obtained from NASA’s Shuttle Radar Topography Mission 90m (SRTM 90m). Using DEM, we derived the range of elevation and terrain ruggedness index using terrain function in raster package in R 3.5, for each protected area. For further analysis, we used the interquartile range (IQR) of elevation and terrain ruggedness for respective protected areas.
2.8. b) Analytical methods
We used generalized linear models to examine correlation of dhole pack size reported from 24 unique sites across the dhole distribution range. We used only those studies (n = 29) for which data on all the predictor variables were available, that is, tiger density and ungulate density, size of the protected area (PA), elevational heterogeneity, and terrain ruggedness of the PA. We scaled predictor variables (Size of PA, elevational heterogeneity and terrain ruggedness), further, we checked for correlation among all predictor variables and dropped the correlated ones (r > 0.6), prior to analysis. We dropped elevational heterogeneity as the predictor variables because of its high correlation with terrain ruggedness. After screening for normal distribution of response variable, we used "Gaussian" family for the analysis. We used average dhole pack size as the response variable and tiger density, ungulate density, area of PA, terrain ruggedness as predictor variables. We analyzed a total of ten additive and interactive models (Table 2, Figure 3). We compared models with predictor variables based on our hypothesis and compared them to the null model (Intercept only). Model fits were compared using Akaike's Information Criterion corrected (AICC), and the effect of parameters was gauged based on the direction and statistical significance of corresponding β‐coefficients. We used "MuMIn" package for model selection and averaging. Model selection was based on the difference between AIC models, (ΔAIC < 2) and 95% cumulative weight criteria. Model averaging was carried out for parameters based on top model selection. All analyses were performed in program R (R Development Core Team, 2014).
TABLE 2.
Model comparison and selection following AICC, and 95% cumulative weight criteria
| Intercept | Prey.density | Reserve.size | Terrain.ruggedness | Tiger.density | Prey.density:Tiger.density | Terrain.rug | df | logLik | AICc | delta | weight | r2 | ||
|---|---|---|---|---|---|---|---|---|---|---|---|---|---|---|
| 1 | Tiger density + Prey density | 8.43 | 0.11 | NA | NA | −0.72 | NA | NA | 4 | −71.40 | 152.48 | 0 | 0.562 | 0.44 |
| 2 | Tiger density * Prey density | 9.47 | 0.07 | NA | NA | −1.15 | 0.01 | NA | 5 | −70.36 | 153.32 | 0.85 | 0.368 | 0.48 |
| 3 | Tiger density + Prey density + PA size + Terrain ruggedness | 11.26 | 0.10 | −0.14 | −1.449 | −0.73 | NA | NA | 6 | −70.67 | 157.16 | 4.69 | 0.054 | 0.47 |
| 4 | Tiger density | 10.24 | NA | NA | −0.38 | NA | NA | 3 | −77.27 | 161.50 | 9.03 | 0.006 | 0.16 | |
| 5 | Tiger density + Terrain ruggedness | 13.18 | NA | NA | −1.8474 | −0.40 | NA | NA | 4 | −76.45 | 162.57 | 10.10 | 0.004 | 0.21 |
| 6 | Tiger density + PA size | 16.09 | NA | −1.91 | NA | −0.46 | NA | NA | 4 | −76.64 | 162.96 | 10.48 | 0.003 | 0.20 |
| 7 | Null model | 8.30 | NA | NA | NA | NA | NA | NA | 2 | −79.93 | 164.32 | 11.84 | 0.002 | 0.00 |
| 8 | Prey density | 7.18 | 0.03 | NA | NA | NA | NA | NA | 3 | −79.32 | 165.59 | 13.11 | 0.001 | 0.04 |
| 9 | Prey density + Terrain ruggedness | 9.43 | 0.03 | NA | −1.3801 | NA | NA | NA | 4 | −78.93 | 167.52 | 15.05 | 0.000 | 0.06 |
| 10 | Prey density + PA size | 3.60 | 0.04 | 1.13 | NA | NA | NA | NA | 4 | −79.15 | 167.97 | 15.49 | 0.000 | 0.05 |
| 11 | PA size + Terrain ruggedness | 11.44 | NA | −0.24 | NA | NA | NA | −1.5847 | 4 | −79.43 | 168.53 | 16.05 | 0.000 | 0.03 |
FIGURE 3.

Showing the maximal model with all the significant and non‐significant predictor variables with β coefficient values at 95% confidence value
3. RESULTS
3.1. Pack size variation
We identified seven packs from TATR and five packs form NNTR. The number of individuals in a pack ranged from 7 to 12 for TATR Packs and 10 to 28 for NNTR Packs. The reported average pack size was 6.4 (1.3) and 16.8 (3.1) for TATR and NNTR, respectively. A significant difference was found between the pack size of TATR and NNTR (t = −3.05, p‐value = 0.02) as depicted through box plots (Figure 2, TATR pack size: median = 7, IQR = 4; NNTR pack size: median = 16, IQR = 6).
FIGURE 2.
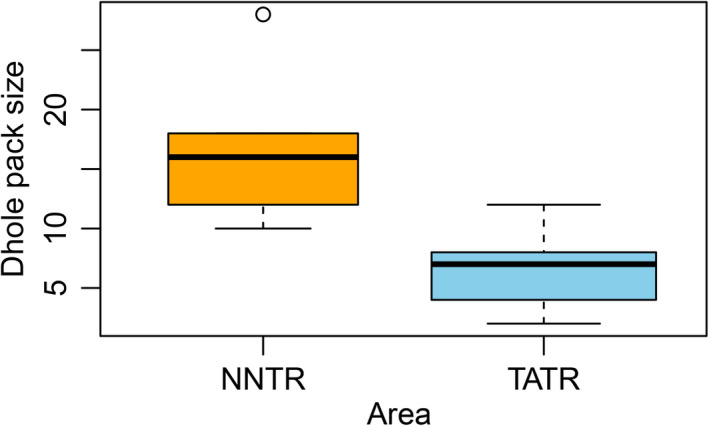
Comparison of dhole pack size from NNTR and TATR
3.2. Prey composition and density across study sites
Total prey density per km2 was estimated to be 16.94 in NNTR and 19.28 in TATR. Major prey species in both the study sites were chital, sambar, nilgai, wild pig, gaur, and barking deer (Table 1). Gaur density was 5.21 (SE 1.41) the highest followed by chital 4.61(SE 1.2) in NNTR. In TATR, the density of chital was the highest 5.10 (SE 1.22) followed by sambar 4.68 (SE 0.76).
TABLE 1.
Individual density of various prey species from NNTR and TATR, Maharashtra, India
| Prey Species | NNTR (Individual density and SE) | Group size | TATR (Individual density and SE) | Group size |
|---|---|---|---|---|
| Chital | 4.61 ± 1.2 | 5.02 | 5.10 ± 1.22 | 5.13 |
| Sambar | 1.41 ± 0.32 | 1.88 | 4.68 ± 0.76 | 2.25 |
| Nilgai | 1.99 ± 0.35 | 1.81 | 1.09 ± 0.36 | 2.50 |
| Wild pig | 3.12 ± 1.11 | 6.32 | 5.42 ± 2.08 | 7.22 |
| Gaur | 5.21 ± 1.41 | 5.98 | 2.03 ± 1.15 | 2.35 |
| Barking deer | 0.6 ± 0.2 | 1 | 0.96 ± 0.23 | 1.37 |
3.3. Large predator density across study sites
With the total sampling effort of 9,144 trap nights in TATR and 13,440 trap nights in NNTR, we obtained 452 and 211 photo captures on tigers in TATR and NNTR, respectively. A total of 58 tigers (Males = 32 and Female = 26) in TATR and 8 tigers (Males = 4 and Females = 4) in NNTR were identified through camera trap images. Based on Akaike information criterion, heterogeneity model (including baseline detection and movement parameter) (AICc 2,720.648) for TATR and null model for NNTR (AICc 739.167) and was chosen to be the best fit model. Tiger density estimate for TATR stabilized between 5.36 (SE 0.62) and 5.53 (SE 0.67) individuals per 100 km2 at 15 km and 20 km buffer. For NNTR estimated tiger density stabilized at 0.46 (SE 0.16) individuals per 100 km2 at 15 km buffer.
3.4. Distribution‐wide assessment of dhole pack size
We used average dhole pack size as the response variable and tiger density, ungulate density, area of PA, terrain ruggedness as predictor variables (Figure 3). Out of the 10 additive and interactive models, top two models achieved the model selection criterion of ΔAICc < 2 and 95% cumulative weight criteria. Upon model selection we found, an additive effect of tiger density (effect size −0.77) and prey density (effect size 0.64) and interactive effect of tiger density (effect size −0.83) and prey density (effect size 0.73), tiger density* prey density (0.27), to be the top two best models (Table 2, Figures 4&5). Here, effect size values (On a scale of 0 to 1) show relation between dependent and independent variables, larger the value of effect size stronger is the influence of independent variable on the dependent variable. The Negative sign shows the direction of relation between the independent variable and dependent variable. On averaging the two top models (Table 3, Figure 6), we found a negative association of tiger density (−0.89 ± 0.33, p =.01) and a positive association of prey density (0.09 ± 0.03, p =.03) with the pack size and prey*tiger density (0.01 ± 0.0, p =.18) was not significant but still explained the relation with the response variable.
FIGURE 4.

Dhole pack size in response to tiger density (per 100 km2) based on distribution‐wide assessment
FIGURE 5.

Dhole pack size in response to prey density (per km2) based on distribution‐wide assessment
TABLE 3.
Model averaging output for all variables present in the top model selection
| Estimate | Std. Error | Adjusted SE | z value | Pr(>|z|) | CI (2.5% ‐ 97.5%) | |
|---|---|---|---|---|---|---|
| Intercept | 8.839 | 1.229 | 1.280 | 6.906 | <2e−16 *** | 6.33 – 11.34 |
| Tiger.density | −0.891 | 0.330 | 0.340 | 2.618 | 0.008* | −1.55 to −0.22 |
| Prey.density | 0.089 | 0.039 | 0.040 | 2.197 | 0.028 * | 0.02 to 0.17 |
| Prey.density*Tiger density | 0.011 | 0.008 | 0.008 | 1.303 | 0.192 | −0.01 to 0.028 |
Signif. codes: 0 ‘***’ 0.001 ‘**’ 0.01 ‘*’ 0.05 ‘.’ 0.1 ‘ ’ 1
FIGURE 6.

Average model parameters with β coefficient values at 95% confidence value
4. DISCUSSION
Across a wide range of taxa from oceanic (Baum & Worm, 2009) to terrestrial ecosystems, competitively inferior predators differ in abundance, distribution, and behavior as a response to apex predator density and distribution (Newsome et.al., 2017; Newsome & Ripple, 2015). Similarly, from the sympatric guild of tiger, leopard, and dhole, various scientific studies depict a significant decline in leopard populations along with the shift in their diet and spatial displacement to fringe areas, after the population recovery of tigers (Harihar et al., 2011; Kafley et al., 2019; Mondal et al., 2012; Steinmetz et al., 2013). Our study also revealed an inverse relationship between the density of tiger and group size of dhole while accounting for variability in resources and habitat heterogeneity.
Dhole pack size in NNTR was ~ 2.62 times bigger than the pack size in TATR. The smaller pack size of dholes in high tiger density scenario could be because of two reasons. Firstly, intense intraguild competition and associated risk of fatal injuries negatively affect dholes in TATR. For instance, loss of experienced breeders due to predation can result in decreased reproductive rate and destabilization in the pack; mortalities of helpers in the pack can result in diminished hunting efficiency and reduced food provisioning for pups; litter loss due to predation events from tiger can result in lower recruitment rates in the pack (Borg et al., 2015; Courchamp & Macdonald, 2001). All these mechanisms would synergistically act to reduce pack size, beyond which a small pack would experience inherent challenges of breeding and survival. Secondly, larger groups can successfully defend their kills and also consume the prey quickly, leaving minimal chances to attract other competitors (Carbone et al., 2005). However, the fact that per capita intake is compromised in larger groups because of sharing carcass with a greater number of individuals, might act as a counteractive selective pressure. Therefore, we predicted that the decision to be in smaller groups is to maximize energy gain while coexisting with dominant predator by showing differential prey selection in prey size class and to avoid detection over kills. Although interference competition events are difficult to observe in the wild in such a landscape, we collected opportunistic data via direct predation events, that is, tigers killing dholes (n = 5) and occasions when dholes lost their kills to tigers (n = 23), which support our predictions on the relation between the two competing species. Long‐term studies on the demography and behavioral ecology of the two species would further our understanding of such intraguild interactions in the landscape.
Conversely, low apex predator density in NNTR seems to be operating in a complex two‐way mechanism. We predicted that the larger pack size of dholes in NNTR might be an outcome of reduced predation pressure and easy availability of resources. It is observed in multipredator systems that availability of prey resources is key to the coexistence among carnivores. However, external factors like human‐mediated disturbances can alter trophic interactions. Declining apex predator population often results in the reduced threat of predation and wider niche availability in terms of food and space for subordinate predators (Green et al., 2019). Such competitive release scenarios lead to higher survival rates of juveniles and subadults which correspond to larger group sizes in subordinate carnivores (Groom et al., 2017). Additionally, larger packs of subordinate predator are also known to be competitively advantageous to suppress the recovery of dominant predator in the system (Periquet et al., 2015).
Patterns at local scale were also in concurrence with results of distribution‐wide assessment of dhole pack size. We found pack size to be negatively associated with tiger density and positively associated with prey density. However, the effect size of tiger density was stronger than that of prey density. A similar pattern has been observed in the African ecosystem, where lion populations crashed due to human‐induced environmental changes while facilitating the spotted hyena population. Spotted hyenas exhibit more behavioral plasticity than lions and have adapted to human subsidies in disturbed habitats. The reduced lion abundance and decreased risk of predator encounter resulted in increased foraging group size, larger clan size, an overall increase in time spent on kill sites, and easy availability of human subsidies for spotted hyenas (Green et al., 2019). Another such trend has been observed between African wild dog pack size and lion densities across temporal scale in Savé Valley Conservancy (SVC), Zimbabwe (Groom et al., 2017). Before lion population recovery, wild dog pack sizes were observed to be large. However, after the population recovery of the dominant predator, the wild dogs suffered a significant decline in survival rates of pups and adults.
Previous studies reported a positive correlation between group size and patch contiguity (Atwood, 2006) although, the current study failed to find this relationship. However, we suggest such factors can be tested at a fine‐scale to infer the effect of anthropogenic disturbances, protection level at reserve level, and connectivity in the landscape (Greenville et al., 2014; Newsome & Ripple, 2015). Interestingly, we did not find pack size to be correlated to terrain type; however, previously small pack size of dholes has been reported from areas with rugged terrain in Northeast India and Loas (Selvan et al., 2014; Kamler et al. 2020). This could be due to two reasons, small representation of areas with rugged terrain in comparison with flatter terrains and small pack size in rugged terrain might be a local adaptation and would not reflect at the global level.
Lastly, we suggest that a detailed understanding of the guild warrants serious consideration rather than species centric conservation approach. India is among the 13 countries that envision the goal of TX2 by 2022 for global recovery of wild tiger populations. According to the recent All India Tiger Estimation project, India harbors an estimated tiger population of 2,967 (Jhala et al., 2020). Despairingly, the global population of Asiatic wild dog/ dhole is roughly around 949–2215 mature individuals (Kamler, 2015). Within India, the persistence of dholes is mostly confined to protected areas with infrequent presence records from secondary forests and agro‐forest plantations (Srivathsa et al., 2019). These remnant habitat patches are also shared by other large carnivores, thereby limiting the dhole population by lethal intraguild interactions (Steinmetz et al., 2013). The small size of PAs and lopsided conservation efforts can further result in over‐inflated apex carnivore densities and detrimental for subordinate predators like dholes (Karanth et al., 2010; Kumar et al., 2019; Rayan & Linkie, 2016).
Competition from dominant carnivores remains one of the major factors that drive densities of other sympatric carnivores in a system. Therefore, to conserve the endangered dhole, it is crucial to understand its response to tigers, another endangered and flagship species. Our study fills some glaring lacunae in the previous understanding of how intraguild competition can potentially limit a subordinate social predator. NNTR and TATR were comparable natural experiment setup that allowed us to understand demographic responses and the consequences of dominance shift between the endangered tropical carnivores. We suggest that the increased pack size of a social subordinate predator seems to be a demographic adaptation to varying competitor densities and availability of wider niche. This study contributes to the holistic understanding of guild interactions to optimize ecological triage while conserving charismatic apex predators and mid‐ranking predators.
CONFLICT OF INTERESTS
Authors declare they have no competing interests.
AUTHOR CONTRIBUTION
Aishwarya Bhandari: Conceptualization (equal); Data curation (equal); Formal analysis (lead); Methodology (equal); Validation (equal); Writing‐original draft (lead); Writing‐review & editing (equal). Pallavi Ghaskadbi: Conceptualization (equal); Data curation (equal); Formal analysis (equal); Methodology (equal); Validation (equal); Visualization (equal); Writing‐original draft (equal); Writing‐review & editing (equal). Parag Nigam: Conceptualization (equal); Data curation (equal); Supervision (equal); Validation (equal); Writing‐review & editing (equal). Bilal Habib: Conceptualization (lead); Data curation (equal); Formal analysis (equal); Funding acquisition (lead); Investigation (lead); Methodology (equal); Project administration (lead); Resources (lead); Supervision (lead); Validation (equal); Visualization (equal); Writing‐review & editing (equal).
5. ETHICS STATEMENT
This study was carried out under the research permit number D‐22(8)/WL/Research/CT‐722/(12–13)/2934/2013 from Maharashtra Forest Department. During the study, only noninvasive methods were used for the sampling purpose therefore animal handling permits were not required.
AUTHORS’ CONTRIBUTION
B.H., P.N., A.B., and P.G.: Conceiving ideas. B.H., A.B., and P.G.: study design. A.B. and P.G.: Data collection; data analysis. A.B. and B.H.: Manuscript reading and leading. B.H., P.N., A.B., and P.G.: Approval of final draft.
ACKNOWLEDGMENTS
This study was funded by Wildlife Institute India, M. Sc. program fund and Maharashtra Forest Department. We thank Director and Dean, Wildlife Institute of India for the institutional support. We thank the Chief wildlife Warden and Chief Conservator of Forest, Tadoba Andhari Tiger Reserve and Navegaon Nagzira Tiger Reserve, Maharashtra State, for granting permission and facilitation of the study. We thank Dr. Nucharin Songsassen, Head of Center for Species Survival, SCBI, for her data inputs. We thank Nilanjan Chatterjee and Nakul Markandey for their help in handling geospatial data. We thank Naman Goyal and Kumar Ankit for giving valuable inputs to improve the manuscript.
Bhandari A, Ghaskadbi P, Nigam P, Habib B. Dhole pack size variation: Assessing the effect of Prey availability and Apex predator. Ecol Evol. 2021;11:4774–4785. 10.1002/ece3.7380
DATA AVAILABILITY STATEMENT
All data are submitted along with manuscript in the form of supplementary material.
REFERENCES
- Acharya, B. B. (2007. ). The ecology of the dhole or Asiatic wild dog (Cuon alpinus) in Pench Tiger Reserve, Madhya Pradesh. Unpublished PhD Dissertation. Saurashtra University. [Google Scholar]
- Atwood, T. C. (2006). The influence of habitat patch attributes on coyote group size and interaction in a fragmented landscape. Canadian Journal of Zoology, 84(1), 80–87. 10.1139/z05-180 [DOI] [Google Scholar]
- Bashir, T. , Bhattacharya, T. , Poudyal, K. , Roy, M. , & Sathyakumar, S. (2014). Precarious status of the Endangered dhole Cuon alpinus in the high elevation Eastern Himalayan habitats of Khangchendzonga Biosphere Reserve, Sikkim, India. Oryx, 48(1), 125–132. 10.1017/S003060531200049X [DOI] [Google Scholar]
- Baum, J. K. , & Worm, B. (2009). Cascading top‐down effects of changing oceanic predator abundances. Journal of Animal Ecology, 78(4), 699–714. 10.1111/j.1365-2656.2009.01531.x [DOI] [PubMed] [Google Scholar]
- Borchers, D. L. , & Efford, M. G. (2008). Spatially explicit maximum likelihood methods for capture–recapture studies. Biometrics, 64(2), 377–385. 10.1111/j.1541-0420.2007.00927.x [DOI] [PubMed] [Google Scholar]
- Borg, B. L. , Brainerd, S. M. , Meier, T. J. , & Prugh, L. R. (2015). Impacts of breeder loss on social structure, reproduction and population growth in a social canid. Journal of Animal Ecology, 84(1), 177–187. 10.1111/1365-2656.12256. [DOI] [PubMed] [Google Scholar]
- Buckland, S. T. , Anderson, D. R. , Burnham, K. P. , Laake, J. L. , Borchers, D. L. , & Thomas, L. (2001). Introduction to distance sampling: estimating abundance of biological populations.
- Carbone, C. , Frame, L. , Frame, G. , Malcolm, J. , Fanshawe, J. , FitzGibbon, C. , Schaller, G. , Gordon, I. J. , Rowcliffe, J. M. , & du Toit, J. T. (2005). Feeding success of African wild dogs (Lycaon pictus) in the Serengeti: The effects of group size and kleptoparasitism. Journal of Zoology, 266(2), 153–161. 10.1017/S0952836905006710. [DOI] [Google Scholar]
- Caro, T. M. , & O'Doherty, G. (1999). On the use of surrogate species in conservation biology. Conservation Biology, 13(4), 805–814. 10.1046/j.1523-1739.1999.98338.x [DOI] [Google Scholar]
- Champion, H. G. , & Seth, S. K. (1968). A revised survey of the forest types of India. Manager of publications. [Google Scholar]
- Charaspet, K. , Sukmasuang, R. , & Duengkae, P. (2015). Prey species and habitat use of dhole (Cuon alpinus) in Salakpra Wildlife Sanctuary. Journal of Wildlife in Thailand, 22(1), 101–110. [Google Scholar]
- Courchamp, F. , Clutton‐Brock, T. , & Grenfell, B. (2000). Multipack dynamics and the Allee effect in the African wild dog, Lycaon pictus. Animal Conservation, 3(4), 277–285. 10.1111/j.1469-1795.2000.tb00113.x [DOI] [Google Scholar]
- Courchamp, F. , & Macdonald, D. W. (2001). Crucial importance of pack size in the African wild dog Lycaon pictus. Animal Conservation, 4(2), 169–174. 10.1017/S1367943001001196 [DOI] [Google Scholar]
- Creel, S. , & Creel, N. M. (1995). Communal hunting and pack size in African wild dogs, Lycaon pictus. Animal Behaviour, 50(5), 1325–1339. 10.1016/0003-3472(95)80048-4 [DOI] [Google Scholar]
- Creel, S. , & Creel, N. M. (1996). Limitation of African wild dogs by competition with larger carnivores. Conservation Biology, 10(2), 526–538. 10.1046/j.1523-1739.1996.10020526.x [DOI] [Google Scholar]
- Creel, S. , & Creel, N. M. (1998). Six ecological factors that may limit African wild dogs, Lycaon pictus. Animal Conservation, 1(1), 1–9. 10.1111/j.1469-1795.1998.tb00220.x [DOI] [Google Scholar]
- Devens, C. H. , Hayward, M. W. , Tshabalala, T. , Dickman, A. , McManus, J. S. , Smuts, B. , & Somers, M. J. (2020). Estimating leopard density across the highly modified human‐dominated landscape of the Western Cape, South Africa. Oryx, 1‐12. 10.1017/S003060531800147 [DOI] [Google Scholar]
- Devens, C. , Tshabalala, T. , McManus, J. , & Smuts, B. (2018). Counting the spots: The use of a spatially explicit capture–recapture technique and GPS data to estimate leopard (Panthera pardus) density in the Eastern and Western Cape, South Africa. African Journal of Ecology, 56(4), 850–859. 10.1111/aje.12512 [DOI] [Google Scholar]
- Dhanwatey, H. S. , Crawford, J. C. , Abade, L. A. , Dhanwatey, P. H. , Nielsen, C. K. , & Sillero‐Zubiri, C. (2013). Large carnivore attacks on humans in central India: A case study from the Tadoba‐Andhari Tiger Reserve. Oryx, 47(2), 221–227. 10.1017/S0030605311001803 [DOI] [Google Scholar]
- Efford, M. G. (2011). Estimation of population density by spatially explicit capture–recapture analysis of data from area searches. Ecology, 92(12), 2202–2207. 10.1890/11-0332.1 [DOI] [PubMed] [Google Scholar]
- Efford, M. (2020). secr: Spatially explicit capture‐recapture models. R package version 4.3.1, https://CRAN.R‐project.org/package=secr
- Ford, A. T. , & Goheen, J. R. (2015). Trophic cascades by large carnivores: A case for strong inference and mechanism. Trends in Ecology & Evolution, 30(12), 725–735. 10.1016/j.tree.2015.09.012 [DOI] [PubMed] [Google Scholar]
- Grassman, L. I. , Tewes, M. E. , Silvy, N. J. , & Kreetiyutanont, K. (2005). Spatial ecology and diet of the dhole Cuon alpinus (Canidae, Carnivora) in north central Thailand. Mammalia, 69(1), 11–20. 10.1515/mamm.2005.002 [DOI] [Google Scholar]
- Green, D. S. , Farr, M. T. , Holekamp, K. E. , Strauss, E. D. , & Zipkin, E. F. (2019). Can hyena behaviour provide information on population trends of sympatric carnivores? Philosophical Transactions of the Royal Society B, 374(1781), 20180052. 10.1098/rstb.2018.0052 [DOI] [PMC free article] [PubMed] [Google Scholar]
- Greenville, A. C. , Wardle, G. M. , Tamayo, B. , & Dickman, C. R. (2014). Bottom‐up and top‐down processes interact to modify intraguild interactions in resource‐pulse environments. Oecologia, 175(4), 1349–1358. 10.1007/s00442-014-2977-8 [DOI] [PubMed] [Google Scholar]
- Grey, J. N. C. , Kent, V. T. , & Hill, R. A. (2013). Evidence of a high density population of harvested leopards in a montane environment. PLoS One, 8(12), e82832. 10.1371/journal.pone.0082832 [DOI] [PMC free article] [PubMed] [Google Scholar]
- Groom, R. J. , Lannas, K. , & Jackson, C. R. (2017). The impact of lions on the demography and ecology of endangered African wild dogs. Animal Conservation, 20(4), 382–390. 10.1111/acv.12328 [DOI] [Google Scholar]
- Gusset, M. , & Macdonald, D. W. (2010). Group size effects in cooperatively breeding African wild dogs. Animal Behaviour, 79(2), 425–428. 10.1016/j.anbehav.2009.11.021 [DOI] [Google Scholar]
- Handcock, M. S. , & Gile, K. J. (2011). Comment: On the concept of snowball sampling. Sociological Methodology, 41(1), 367–371. 10.1111/j.1467-9531.2011.01243.x [DOI] [PMC free article] [PubMed] [Google Scholar]
- Harihar, A. , Pandav, B. , & Goyal, S. P. (2011). Responses of leopard Panthera pardus to the recovery of a tiger Panthera tigris population. Journal of Applied Ecology, 48(3), 806–814. 10.1111/j.1365-2664.2011.01981.x [DOI] [Google Scholar]
- Hayward, M. W. , Lyngdoh, S. , & Habib, B. (2014). Diet and prey preferences of dholes (Cuon alpinus): Dietary competition within Asia's apex predator guild. Journal of Zoology, 294(4), 255–266. 10.1111/jzo.12171 [DOI] [Google Scholar]
- Jhala, Y. V. , Qureshi, Q. , & Nayak, A. K. (Eds). (2020). Status of tigers, copredators and prey in India, 2018. National Tiger Conservation Authority, Government of India, New Delhi, and Wildlife Institute of India. [Google Scholar]
- Johnsingh, A. J. T. (1992). Prey selection in three large sympatric carnivores in Bandipur. Mammalia, 56(4), 517–526. 10.1515/mamm.1992.56.4.517 [DOI] [Google Scholar]
- Kafley, H. , Lamichhane, B. R. , Maharjan, R. , Khadka, M. , Bhattarai, N. , & Gompper, M. E. (2019). Tiger and leopard co‐occurrence: Intraguild interactions in response to human and livestock disturbance. Basic and Applied Ecology, 40, 78–89. 10.1016/j.baae.2019.07.007. [DOI] [Google Scholar]
- Kalle, R. , Ramesh, T. , Qureshi, Q. , & Sankar, K. (2011). Density of tiger and leopard in a tropical deciduous forest of Mudumalai Tiger Reserve, southern India, as estimated using photographic capture–recapture sampling. Acta Theriologica, 56(4), 335–342. 10.1007/s13364-011-0038-9 [DOI] [Google Scholar]
- Kamler, J. F. , Songsasen, N. , Jenks, K. , Srivathsa, A. , Sheng, L. , & Kunkel, K. (2015). Cuon alpinus. The IUCN Red List of Threatened Species, 2015–2024. [Google Scholar]
- Kamler, J. F. , Thatdokkham, K. , Rostro‐García, S. , Bousa, A. , Caragiulo, A. , Crouthers, R. , In, V. , Pay, C. , Pin, C. , Prum, S. , Vongkhamheng, C. , Johnson, A. , & McDonald, D. W. (2020). Diet and prey selection of dholes in evergreen and deciduous forests of Southeast Asia. The Journal of Wildlife Management, 87(7), 1396–1405. https://wildlife.onlinelibrary.wiley.com/doi/full/10.1002/jwmg.21931 [Google Scholar]
- Karanth, K. U. , & Nichols, J. D. (1998). Estimation of tiger densities in India using photographic captures and recaptures. Ecology, 79(8), 2852–2862. 10.1890/0012-9658(1998)079 [DOI] [Google Scholar]
- Karanth, K. K. , Nichols, J. D. , Karanth, K. U. , Hines, J. E. , & Christensen, N. L. Jr (2010). The shrinking ark: Patterns of large mammal extinctions in India. Proceedings of the Royal Society B: Biological Sciences, 277(1690), 1971–1979. 10.1098/rspb.2010.0171 [DOI] [PMC free article] [PubMed] [Google Scholar]
- Karanth, K. U. , Srivathsa, A. , Vasudev, D. , Puri, M. , Parameshwaran, R. , & Kumar, N. S. (2017). Spatio‐temporal interactions facilitate large carnivore sympatry across a resource gradient. Proceedings of the Royal Society B: Biological Sciences, 284(1848), 20161860. 10.1098/rspb.2016.1860 [DOI] [PMC free article] [PubMed] [Google Scholar]
- Karanth, K. U. , & Sunquist, M. E. (1995). Prey selection by tiger, leopard and dhole in tropical forests. Journal of Animal Ecology, 439–450. 10.1016/j.biocon.2016.11.009 [DOI] [Google Scholar]
- Karanth, K. U. , & Sunquist, M. E. (2000). Behavioural correlates of predation by tiger (Panthera tigris), leopard (Panthera pardus) and dhole (Cuon alpinus) in Nagarahole, India. Journal of Zoology, 250(2), 255–265. 10.1111/j.1469-7998.2000.tb01076.x [DOI] [Google Scholar]
- Kawanishi, K. , & Sunquist, M. E. (2008). Food habits and activity patterns of the Asiatic golden cat (Catopuma temminckii) and dhole (Cuon alpinus) in a primary rainforest of Peninsular Malaysia. Mammal Study, 33(4), 173–177. 10.3106/1348-6160-33.4.173 [DOI] [Google Scholar]
- Khoewsree, N. , Charaspet, K. , Songsasen, N. , Pla‐ard, M. , Thongbantum, J. , Kongchaloem, W. , & Srinopawan, K. (2020). Abundance, prey, and activity period of dholes (Cuon alpinus) in Khao Yai National Park, Thailand. Biodiversitas Journal of Biological Diversity, 21(1). 10.13057/biodiv/d210142 [DOI] [Google Scholar]
- Kumar, U. , Awasthi, N. , Qureshi, Q. , & Jhala, Y. (2019). Do conservation strategies that increase tiger populations have consequences for other wild carnivores like leopards? Scientific Reports, 9(1), 1–8. 10.1038/s41598-019-51213-w [DOI] [PMC free article] [PubMed] [Google Scholar]
- Linnell, J. D. , & Strand, O. (2000). Interference interactions, co‐existence and conservation of mammalian carnivores. Diversity and Distributions, 6(4), 169–176. 10.1046/j.1472-4642.2000.00069.x [DOI] [Google Scholar]
- Loveridge, A. J. , Valeix, M. , Davidson, Z. , Murindagomo, F. , Fritz, H. , & Macdonald, D. W. (2009). Changes in home range size of African lions in relation to pride size and prey biomass in a semi‐arid savanna. Ecography, 32(6), 953–962. 10.1111/j.1600-0587.2009.05745.x [DOI] [Google Scholar]
- M’soka, J. , Creel, S. , Becker, M. S. , & Droge, E. (2016). Spotted hyaena survival and density in a lion depleted ecosystem: The effects of prey availability, humans and competition between large carnivores in African savannahs. Biological Conservation, 201, 348–355. 10.1016/j.biocon.2016.07.011 [DOI] [Google Scholar]
- Macdonald, D. W. (1983). The ecology of carnivore social behaviour. Nature, 301(5899), 379–384. 10.1038/301379a0. [DOI] [Google Scholar]
- Majumder, A. , Qureshi, Q. , Sankar, K. , Basu, S. , & Jhala, Y. V. (2011). Occupancy and abundance of dhole (Cuon alpinus) in Pench landscape of central India. Journal of the Bombay Natural History Society, 108(3), 158. [Google Scholar]
- Mbizah, M. M. , Farine, D. R. , Valeix, M. , Hunt, J. E. , Macdonald, D. W. , & Loveridge, A. J. (2020). Effect of ecological factors on fine‐scale patterns of social structure in African lions. Journal of Animal Ecology, 89(11), 2665–2676. 10.1111/1365-2656.13334 [DOI] [PubMed] [Google Scholar]
- Modi, S. , Habib, B. , Ghaskadbi, P. , Nigam, P. , & Mondol, S. (2019). Standardization and validation of a panel of cross‐species microsatellites to individually identify the Asiatic wild dog (Cuon alpinus). PeerJ, 7, e7453. 10.7717/peerj.7453.e7453 [DOI] [PMC free article] [PubMed] [Google Scholar]
- Mondal, K. , Gupta, S. , Bhattacharjee, S. , Qureshi, Q. , & Sankar, K. (2012). Response of leopards to re‐introduced tigers in Sariska Tiger Reserve, Western India. International Journal of Biodiversity and Conservation, 4(5), 228–236. 10.5897/IJBC12.014 [DOI] [Google Scholar]
- Newsome, T. M. , Greenville, A. C. , Ćirović, D. , Dickman, C. R. , Johnson, C. N. , Krofel, M. , Letnic, M. , Ripple, W. J. , Ritchie, E. G. , Stoyanov, S. , & Wirsing, A. J. (2017). Top predators constrain mesopredator distributions. Nature Communications, 8, 15469. 10.1038/ncomms15469 [DOI] [PMC free article] [PubMed] [Google Scholar]
- Newsome, T. M. , & Ripple, W. J. (2015). A continental scale trophic cascade from wolves through coyotes to foxes. Journal of Animal Ecology, 84(1), 49–59. 10.1111/1365-2656.12258 [DOI] [PubMed] [Google Scholar]
- Newsome, T. M. , & Ripple, W. J. (2015). Carnivore coexistence: Trophic cascades. Science, 347(6220), 383. 10.1126/science.347.6220.383-a [DOI] [PubMed] [Google Scholar]
- Orsdol, K. V. , Hanby, J. P. , & Bygott, J. D. (1985). Ecological correlates of lion social organization (Panthers, leo). Journal of Zoology, 206(1), 97–112. 10.1111/j.1469-7998.1985.tb05639.x [DOI] [Google Scholar]
- Palomares, F. , & Caro, T. M. (1999). Interspecific killing among mammalian carnivores. The American Naturalist, 153(5), 492–508. 10.1086/303189 [DOI] [PubMed] [Google Scholar]
- Périquet, S. , Fritz, H. , & Revilla, E. (2015). The Lion King and the Hyaena Queen: Large carnivore interactions and coexistence. Biological Reviews, 90(4), 1197–1214. 10.1111/brv.12152 [DOI] [PubMed] [Google Scholar]
- Pollock, K. H. , Nichols, J. D. , Brownie, C. , & Hines, J. E. (1990). Statistical inference for capture‐recapture experiments. Wildlife Monographs, 3–97. [Google Scholar]
- R Core Team . (2014). R: A language and environment for statistical computing. R Foundation for Statistical Computing. http://www.R‐project.org/ [Google Scholar]
- Ramesh, T. , Kalle, R. , Sankar, K. , & Qureshi, Q. (2012). Spatio‐temporal partitioning among large carnivores in relation to major prey species in W estern G hats. Journal of Zoology, 287(4), 269–275. 10.1111/j.1469-7998.2012.00908.x [DOI] [Google Scholar]
- Rasphone, A. , Kéry, M. , Kamler, J. F. , & Macdonald, D. W. (2019). Documenting the demise of tiger and leopard, and the status of other carnivores and prey, in Lao PDR's most prized protected area: Nam Et‐Phou Louey. Global Ecology and Conservation, 20, e00766. 10.1016/j.gecco.2019.e00766 [DOI] [Google Scholar]
- Rayan, D. M. , & Linkie, M. (2016). Managing conservation flagship species in competition: Tiger, leopard and dhole in Malaysia. Biological Conservation, 204, 360–366. 10.1016/j.biocon.2016.11.009 [DOI] [Google Scholar]
- Ritchie, E. G. , & Johnson, C. N. (2009). Predator interactions, mesopredator release and biodiversity conservation. Ecology Letters, 12(9), 982–998. 10.1111/j.1461-0248.2009.01347.x [DOI] [PubMed] [Google Scholar]
- Rodgers, W. A. , & Panwar, S. H. (1988). Biogeographical classification of India New Forest. [Google Scholar]
- Roffler, G. H. , Waite, J. N. , Pilgrim, K. L. , Zarn, K. E. , & Schwartz, M. K. (2019). Estimating abundance of a cryptic social carnivore using spatially explicit capture–recapture. Wildlife Society Bulletin, 43(1), 31–41. [Google Scholar]
- Selvan, K. M. , Lyngdoh, S. , Habib, B. , & Gopi, G. V. (2014). Population density and abundance of sympatric large carnivores in the lowland tropical evergreen forest of Indian Eastern Himalayas. Mammalian Biology, 79(4), 254–258. 10.1016/j.mambio.2014.03.002 [DOI] [Google Scholar]
- Slangsingha, N. , Duengkae, P. , Kumsuk, M. , & Nittaya, K. (2007). Diet of Asian wild dog (Cuon alpinus) in Phu Khieo Wildlife Sanctuary. Chaiyaphum province. [Google Scholar]
- Srivathsa, A. , Karanth, K. U. , Kumar, N. S. , & Oli, M. K. (2019). Insights from distribution dynamics inform strategies to conserve a dhole Cuon alpinus metapopulation in India. Scientific Reports, 9(1), 1–12. 10.1038/s41598-019-39293-0 [DOI] [PMC free article] [PubMed] [Google Scholar]
- Srivathsa, A. , Sharma, S. , & Oli, M. K. (2020). Every dog has its prey: Range‐wide assessment of links between diet patterns, livestock depredation and human interactions for an endangered carnivore. Science of the Total Environment, 714, 136798. 10.1016/j.scitotenv.2020.136798 [DOI] [PubMed] [Google Scholar]
- Steinmetz, R. , Seuaturien, N. , & Chutipong, W. (2013). Tigers, leopards, and dholes in a half‐empty forest: Assessing species interactions in a guild of threatened carnivores. Biological Conservation, 163, 68–78. 10.1016/j.biocon.2012.12.016 [DOI] [Google Scholar]
- Stephens, P. A. , & Sutherland, W. J. (1999). Consequences of the Allee effect for behaviour, ecology and conservation. 356 Trends in Ecology & Evolution, 14(10), 401–405. 10.1016/S0169-5347(99)01684-5 [DOI] [PubMed] [Google Scholar]
- Thomas, L. , Buckland, S. T. , Rexstad, E. A. , Laake, J. L. , Strindberg, S. , Hedley, S. L. , Bishop, J. R. , Marques, T. A. , & Burnham, K. P. (2010). Distance software: Design and analysis of distance sampling surveys for estimating population size. Journal of Applied Ecology, 47(1), 5–14. 10.1111/j.1365-2664.2009.01737.x [DOI] [PMC free article] [PubMed] [Google Scholar]
- Wang, S. W. , & Macdonald, D. W. (2009). Feeding habits and niche partitioning in a predator guild composed of tigers, leopards and dholes in a temperate ecosystem in central Bhutan. Journal of Zoology, 277(4), 275–283. 10.1111/j.1469-7998.2008.00537.x [DOI] [Google Scholar]
- Wegge, P. , Odden, M. , Pokharel, C. P. , & Storaas, T. (2009). Predator–prey relationships and responses of ungulates and their predators to the establishment of protected areas: A case study of tigers, leopards and their prey in Bardia National Park. Nepal. Biological Conservation, 142(1), 189–202. 10.1016/j.biocon.2008.10.020 [DOI] [Google Scholar]
- Young, J. K. , Golla, J. M. , Broman, D. , Blankenship, T. , & Heilbrun, R. (2019). Estimating density of an elusive carnivore in urban areas: Use of spatially explicit capture‐recapture models for city‐dwelling bobcats. Urban Ecosystems, 22(3), 507–512. 10.1007/s11252-019-0834-6 [DOI] [Google Scholar]
Associated Data
This section collects any data citations, data availability statements, or supplementary materials included in this article.
Data Availability Statement
All data are submitted along with manuscript in the form of supplementary material.