Abstract
Considerable inter- and intra-patient variability exist in serum activity levels of PEGasparaginase, essential for pediatric acute lymphoblastic leukemia (ALL) treatment. A population pharmacokinetic (popPK) model was developed, identifying patient characteristics that explain these variabilities. Patients (n=92) were treated according to the Dutch Childhood Oncology Group (DCOG) ALL-11 protocol, using therapeutic drug monitoring to individualize PEGasparaginase doses. Non-linear mixed effects modeling (NONMEM) was used to analyze popPK evaluating several covariates. The final model was validated using an independent database (n=28). Guidelines for starting doses and dose adjustments were developed. A one-compartment model with timedependent clearance was adequately described in popPK. Normalization of clearance and volume of distribution by body surface area reduced inter-individual variability. Clearance was 0.084 L/day/m2 for 12.7 days, increasing by 0.082 L/day/m2/day thereafter. Clearance was 38% higher during an infection, and 11-19% higher during induction treatment than during intensification and maintenance (P<0.001). In order to target an asparaginase activity level of 100 IU/L, a loading dose of 800 IU/m2 (induction) and 600 IU/m2 (intensification) is advised. In conclusion, variability of PEGasparaginase activity levels can be explained by body surface area, the treatment phase and the occurrence of an infection. With this popPK model, PEGasparaginase treatment can be individualized further, taking into account the covariates and the dosing guidelines provided. (clinicaltrials gov. Identifier [CCMO register]: NL50250.078.14).
Introduction
Asparaginase plays an important role in the treatment of pediatric acute lymphoblastic leukemia (ALL). The drug converts asparagine in aspartic acid and ammonia, resulting in apoptosis of the leukemic cells, as these cells highly depend on extracellular asparagine pools for protein synthesis.1-3 An asparaginase activity level of >100 IU/L is considered to be sufficient for complete asparagine depletion.4-10 Currently, different formulations of asparaginase derived from Erwinia chrysanthemi or Escherichia coli (E. coli) are available in clinical practice, all with different pharmacokinetic (PK) properties.11,12 One of these formulations is the polyethylene glycol (PEG) conjugated form of E. coli asparaginase, also known as PEGasparaginase, which has several advantages compared to the native E.coli asparaginase. First, the risk of developing a neutralizing hypersensitivity reaction to asparaginase is reduced when using PEGasparaginase.13-15 Second, PEGasparaginase can be administered less frequently than other asparaginase formulations because of its relatively low clearance (CL).16,17 Therefore, PEGasparaginase is currently used as a first-line formulation in most developed countries. However, considerable inter- and intrapatient variability of PEGasparaginase levels has been observed and it is, therefore, difficult to determine the right dose for an individual patient.17,18 Currently, asparaginase therapy in Dutch pediatric patients with ALL, treated according to the Dutch Childhood Oncology Group (DCOG) ALL-11 protocol, is individualized with therapeutic drug monitoring (TDM). However, more insight into PEGasparaginase population (popPK) – and especially in characteristics explaining the variability – is needed to optimize individualized dosing. Recently, Hempel et al. described the body surface area (BSA) as an important factor explaining variability in CL. However, the influence of other patient factors is still unknown.17 Therefore, the aim of this study was to describe the PK of PEGasparaginase in our cohort, to gain more insight into factors influencing the CL, and to develop a dosing guideline for PEGasparaginase therapy in children.
Methods
Patients and treatment protocol
Patients (1-18 years old) with newly diagnosed ALL between November 2014 and May 2017, treated according to the ALL-11 protocol in the Sophia Children’s Hospital–Erasmus MC, Rotterdam, were included. In these patients trough, top, week and other levels were prospectively measured. In addition, asparaginase levels measured after the last dose, as part of the TDM program from patients from other Dutch pediatric oncology centers, were included. The study was approved by the Institutional Review Board (clinicaltrials gov. Identifier [CCMO register]: NL50250.078.14). Informed consent was obtained from patients ≥12 and the parents in accordance with the Declaration of Helsinki.
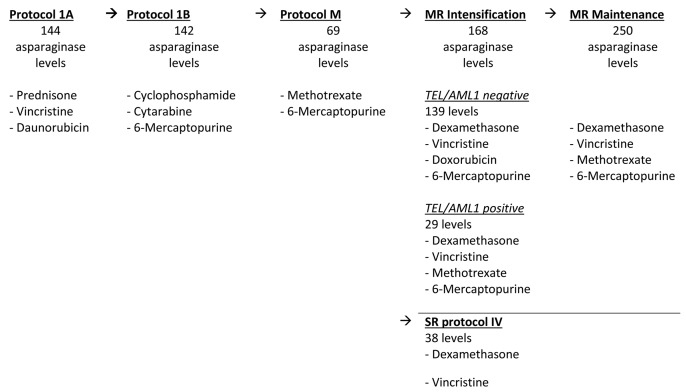
Patients were stratified as standard (SR), medium (MR) and high risk (HR) after induction. Online Supplementary Table S1 describes the complete treatment for each risk group. Figure 1 shows the concomitant chemotherapy per treatment phase. All patients were treated with three doses of PEGasparaginase (1,500 IU/m2, biweekly) during induction (protocol 1A and B). For SR and MR patients, the subsequent dose(s) were individualized based on trough asparaginase activity levels (Online Supplementary Table S3). SR patients received one individualized dose after an interval of approximately 12 weeks (protocol IV); MR patients received 14 individualized doses, either directly after the first three doses or after an interval of approximately 12 weeks during intensification and maintenance as part of a randomized study. HR patients received another two to five doses with a fixed dose of 1,500 IU/m2. Patients were switched to Erwinia asparaginase in case of a neutralizing allergy or silent inactivation. PEGasparaginase was administered intravenously over 1 hour.
Measurements
Measurements of asparaginase levels and antibodies are described in the Online Supplementary Appendix.
Population pharmacokinetic analysis
The popPK were analyzed using non-linear mixed models (see the Online Supplementary Appendix). Several structural models were evaluated using one and two compartment models with linear, nonlinear, and time-dependent elimination. Since BSA is known to highly influence the PK of PEGasparaginase, BSA (calculated with the Mosteller formula19) was included in the structural model to scale the volume of distribution (Vd) and CL.
Covariate analysis
Several demographic, clinical and therapy-related covariates were evaluated (Online Supplementary Table S2). Infections were defined as fever (>38°C) and hospital admission or prescription of antibiotics. Beside differences in the treatment phase and concomitant chemotherapy, several other supportive care drugs were evaluated. First, the covariates were explored with univariate analyses after which significant covariates (P<0.05) were evaluated using a stepwise forward inclusion, followed by backward elimination (P<0.001) in a multivariate analysis.
Model validation and development of dosing guidelines
The final model was validated using goodness of fit plots and visual predictive checks (VPC), see the Online Supplementary Appendix. An independent database, which was obtained by randomly selecting 25% of the population, was used for the external validation of the model.
In order to develop dosing guidelines, Monte Carlo simulations were performed. Starting doses were calculated targeting trough asparaginase activity levels >100 IU/L, >250 IU/L and >350 IU/L, taking into account the significant covariates.
Dosing guidelines were developed targeting a trough asparaginase activity level of 100-250 IU/L or 250-400 IU/L based on either week levels or trough levels.
Results
Patients and samples
In total, 120 patients were included in the study. Ninety-two patients were included in the index dataset and 28 patients in the validation dataset. Online Supplementary Table S2 describes the patient characteristics of the two datasets. The patients in the validation database were older (median 8.0 years, interquartile range (IQR), 3.3–12.5 years) than in the main database (median 4.8 years, IQR, 3.3–8.2 years), and had a higher weight (median 28.0 kg, IQR, 16.6–47.9 kg vs. 19.2 kg, IQR, 14.9– 29.3 kg).
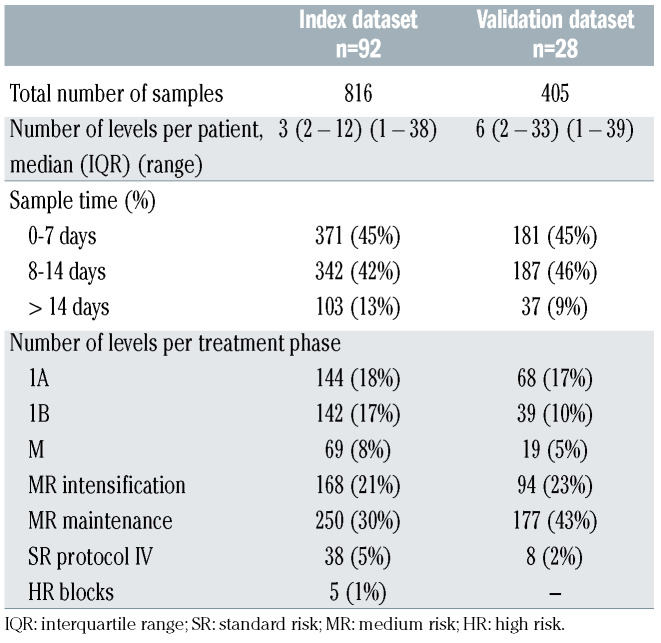
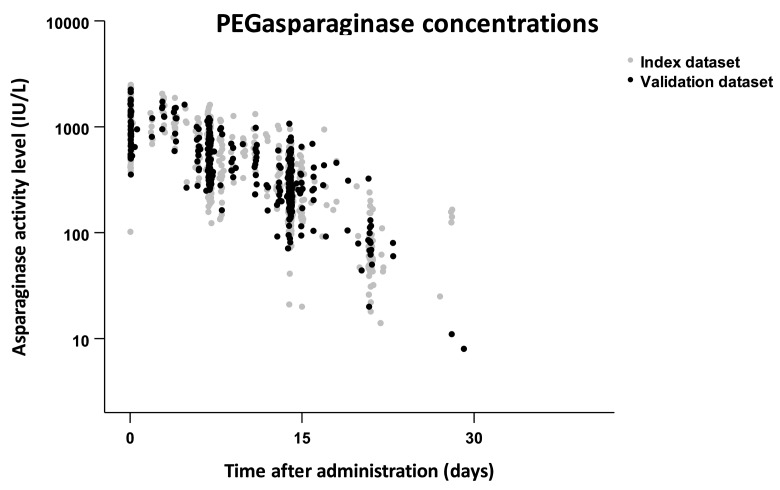
Table 1 shows the characteristics and distribution of the samples. In the index database, 816 samples were measured in 92 patients. The majority of the levels were top, week or trough levels, and were measured during the intensification and maintenance phase of the MR group. Figure 2 shows all asparaginase activity levels plotted against the time after dose.
Structural model
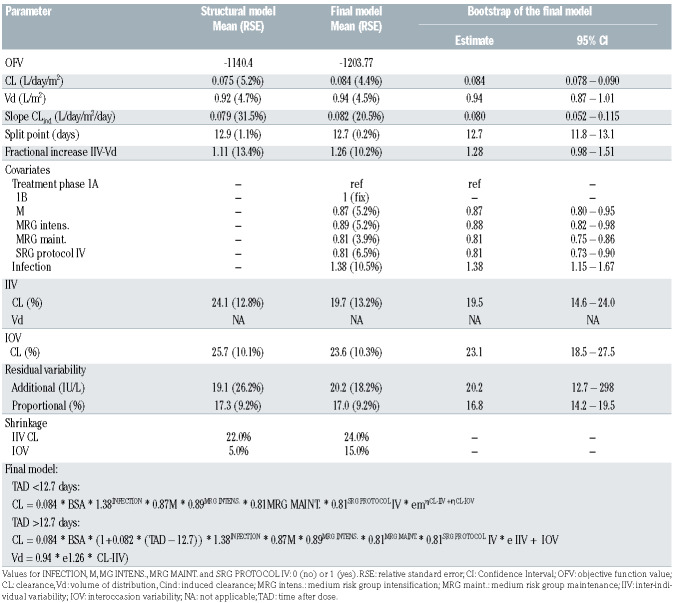
The development of the structural PK model is described in the Online Supplementary Results. The estimated popPK parameters are stated in Table 2. Concentration-time profiles were best described by a one-compartment model. Adding a second compartment did not improve the model. Normalization of the CL by BSA reduced the (unexplained) inter-individual variability (IIV) of this parameter from 29.6% to 24.1%. Intrapatient variability (IOV) was 25.7%. As demonstrated in Figure 2, the elimination of PEGasparaginase was not linear. Several models with time dependent CL were evaluated. 20 The structural model without the effect of covariates best described the data with a CL of 0.075 L/day/m2 for the first 12.9 days after a dose, increasing with 0.079 L/day/m2 per day thereafter. Thus, during the first 12.9 days, the half-life of PEGasparaginase was 8.5 days and, thereafter, decreased to 4.1 days after 1 day, and 2.7 days after 2 days.
Covariate analysis
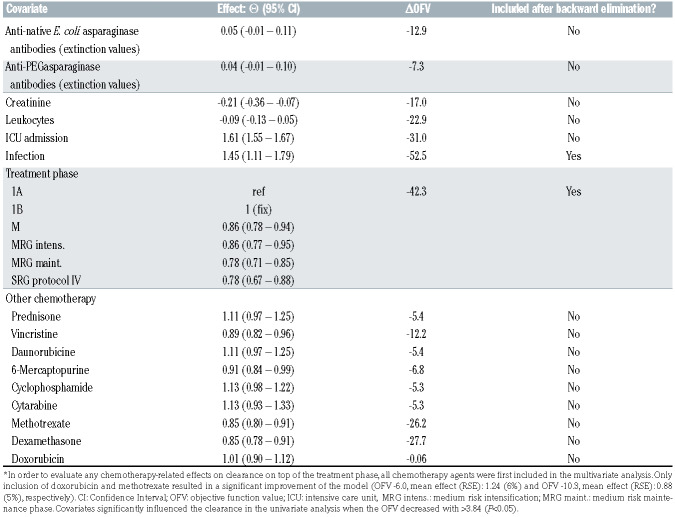
The univariate analysis resulted in 16 covariates significantly correlated with PEGasparaginase CL (Table 3). In the stepwise forward inclusion procedure, the presence of an infection was first added to the structural model, followed by the treatment phase. The CL increased by 38% when a patient had an infection. In comparison with the treatment phase 1A, which was used as a reference, CL was lower during protocol M, MR intensification and maintenance, and SR protocol IV. This association was independent of the presence of an infection. The CL in phase 1B was equal to 1A. Only two patients were treated as high risk, so the association between the HR blocks and PEGasparaginase CL could not be estimated reliably and was fixed to one. The addition of ICU admission to the model (besides the infection and treatment phase), did not improve the fit of the model to the data, neither did the addition of other covariates improve the fit.
Figure 1.
Concomitant chemotherapy. Types of chemotherapy for each treatment phase. MR: medium risk; SR: standard risk.
The evaluation of the effect of specific chemotherapeutic agents on CL was difficult because blood concentrations of those agents were not measured and many chemotherapeutics agents were administrated concomitantly. Therefore, it was assumed that a possible effect of the agent on CL was present during the entire treatment phase. As a result, the treatment phase and the administration of a chemotherapeutic agent were highly correlated.
However, as shown in Figure 1, the intensification phase of MR patients with a TEL/AML1 translocation did not contain doxorubicin but these patients were treated with methotrexate additional to dexamethasone, vincristine, 6-mercaptopurine and PEGasparaginase. The other MR patients first received four times doxorubicin in 12 weeks, followed by methotrexate. Although not significant in the univariate analysis, based on clinical grounds, both doxorubicin and methotrexate were evaluated in the multivariate analysis as the effect of these drugs could be analyzed independently of the treatment phase. In the univariate analysis, CL appeared 11% lower during MR intensification and 19% lower during MR maintenance compared to protocol 1A.
The separate addition of the agents to the model improved the fit of the model (doxorubicin higher CL, methotrexate lower CL). However, in the backward elimination, both drugs did not influence the PEGasparaginase CL significantly and were, therefore, excluded from the final model.
Table 1.
Sample characteristics.
Thus, the final popPK model included, on top of BSA, the presence of an infection and treatment phase, as covariates significantly associated with the CL of PEGasparaginase. Inclusion of these parameters reduced the IIV of CL from 24.1% to 19.7% (18% reduction), and IOV from 25.7% to 23.6% (8% reduction) (Table 2). In this final model, CL was 0.084 L/day/m2 for 12.7 days, increasing with 0.082 L/day/m2/day thereafter.
Table 2.
Pharmacokinetic models.
Goodness of fit and model validation
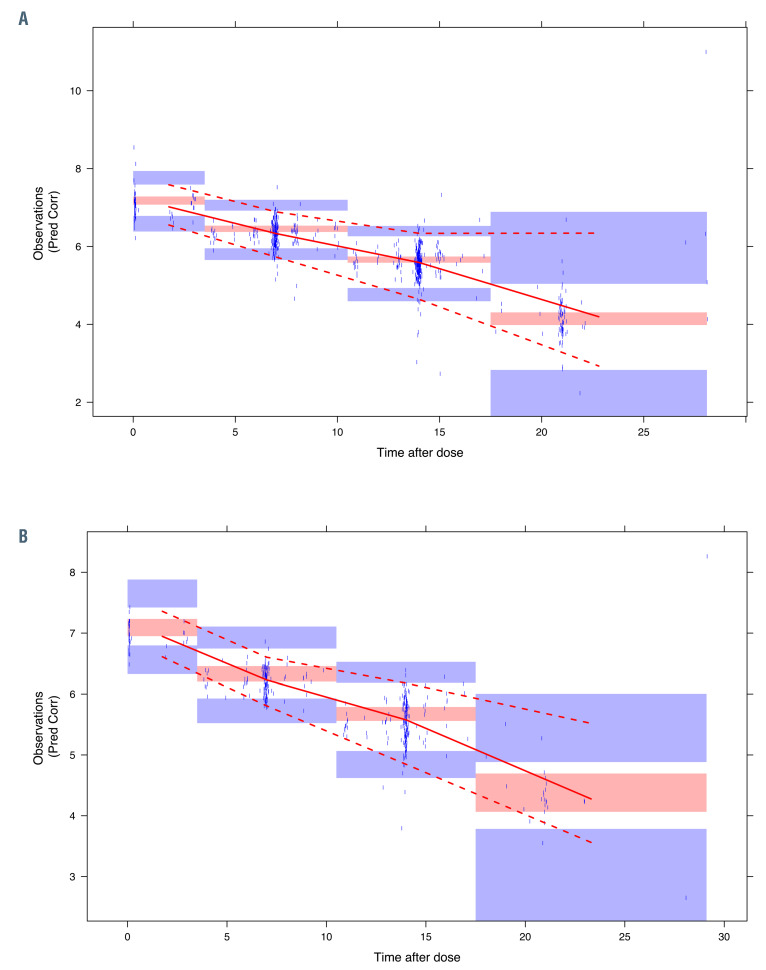
The parameter estimates of the final model were precise with regards to the relative standard errors, and the shrinkage values were acceptable (Table 2). The goodness of fit plots showed an even distribution of the population predictions and individual predictions around the line of unity (Online Supplementary Figure S1). The conditional weighted residuals, plotted against the time after dose, were also evenly distributed with a mean of zero, and no trend was found. The bootstrap analysis showed that the bootstrap estimates were consistent with the parameter estimates of the final model and the 95% Confidence Intervals (CI) were accurate (Table 2). The visual predictive check of the index dataset is shown in Figure 3. Both the median estimates and the 95% CI are within the simulated predicted values. Thus, the final model is accurate in predicting the PEGasparaginase popPK.
As an external validation, the final model derived from the index dataset was used to predict the asparaginase activity levels of the independent validation dataset. The goodness of fit plots and VPC of the validation dataset also show that the final model is adequate to describe the PEGasparaginase PK (Online Supplementary Figures S1 and S3).
Clinical implications
Table 4 shows several dosing regimens for PEGasparaginase (loading dose and maintenance dose) during induction and MRG intensification. Targeting a trough PEGasparaginase activity level of 100 IU/L, the loading dose recommended during induction is 800 IU/m2 followed by a biweekly maintenance dose of 600 IU/m2. Lower doses should be administered due to decreased CL for PEGasparaginase treatment during intensification, with doses being 600 IU/m2 and 400 IU/m2, respectively, to target 100 IU/L.
Based on the half-life during the first 13 days, the steady state is estimated to be reached after two doses, after which the dose can be adjusted based on trough or week asparaginase activity levels targeting trough levels between 100-250 IU/L or 250-400 IU/L (Table 5). If an infection occurs, it is advised to increase the dose with 38%, if clinically possible.
Table 3.
Univariate covariate analysis.
Discussion
In this study, the popPK of PEGasparaginase were investigated in order to identify patient and clinical characteristics associated with the CL of PEGasparaginase. Furthermore, the popPK model was used to develop a dosing guideline for the drug. It was shown that the CL is constant during the first 13 days after administration and increases thereafter. In addition, the CL was higher during induction, and during an infection.
During development of the structural model, neither first- and zero-order, nor Michaelis Menten elimination described the concentration-time profile of PEGasparaginase adequately. This has also been reported by Hempel et al.17 and Würthwein et al.20 In the present study, similar to Würthwein et al., the time dependency of CL proved to be described most adequately with a split model, showing that CL increases substantially after a period of approximately 13 days. This induced CL could be explained by the hydrolysis of the PEG moiety from the PEGasparaginase molecule, resulting in native E. coli asparaginase with a linker attached, originally connecting PEG to asparaginase. Thus, CL will increase to a value more or less comparable with that of native E. coli asparaginase, which has a half-life of 1.3 days,16 after several days.
Several associations between covariates and the PEGasparaginase CL were identified. The metabolism of PEGasparaginase appears to depend on the treatment phase and is influenced by the presence of an infection. Native E. coli asparaginase is eliminated mainly by macrophages of the mononuclear phagocyte system (MPS) in the bone marrow, spleen and liver.21 Although the mechanism of elimination of PEGasparaginase has not been studied, it is likely that this also holds for the PEGylated formulation as other PEGylated drugs are also eliminated by cells of the MPS.22
CL was the highest during protocol 1A containing vincristine, prednisone and daunorubicin. MR intensification, maintenance and SR protocol IV had lower CL and all contained vincristine as well, so an effect of vincristine is unlikely. Especially as the CL during MR maintenance was lower than MR intensification, either doxorubicin and/or methotrexate probably influence the PEGasparaginase CL. The fact that the CL was the highest in induction might be caused by the other anthracycline, daunorubicin, which was administered weekly, whereas doxorubicin, was administered once every 3 weeks during intensification.
Besides the administration of specific chemotherapeutics, other mechanisms may explain the differences in CL between the treatment phases. It has to be taken into account that the physical condition of the patient alters during ALL treatment: during protocol 1A (and also 1B), the tumor load is higher and therapy is more intense compared to protocol M, MR intensification and maintenance, and SR protocol IV, which all had a lower CL. The MPS plays a role in tumor lysis,23,24 which may explain why the CL is higher during this treatment phase as well, although the asparaginase treatment starts at day 12 of the treatment protocol.
Figure 2.
PEGasparaginase activity levels. PEGasparaginase activity levels vs. time after administration for the index database (●, n=92) and the validation database (●, n=28). Note that the asparaginase activity levels nonlinearly decline after 12.7 days. Of note, dose adjustments could (partially) explain the variation in asparaginase activity levels shown in this figure.
Table 4.
Dosing guideline, starting dose.
Table 5.
Dosing guideline, dose adjustments.
Strikingly, the occurrence of an infection increases the CL by 38%, independent of the treatment phase and BSA, probably because of the activation of the MPS, which is responsible for the CL of asparaginase. This means that the PEGasparaginase activity levels will be 38% lower during an infection and that the PEGasparaginase dose should be increased by this percentage to obtain similar levels. Evidently, this should first be validated in clinical practice, taking into account the clinical situation of the patient.
BSA was included in the structural model, showing that the CL of PEGasparaginase increases with BSA, which is in line with the findings of Hempel et al.17 Sassen et al., however, studied the CL of Erwinia asparaginase and found the opposite: patients with a lower weight have a higher CL, requiring a higher starting dose of the drug.25 Shrey et al. studied the native E. coli asparaginase levels in different age groups and also showed lower asparaginase activity levels in younger patients, suggesting a higher CL in these patients.26 Thus, for a PEGylated form of asparaginase, this does not seem to apply, which is also supported by a study of PEGylated interferon α-2b in children, which also shows that the CL increases with age.27
In our analysis, PEGasparaginase CL was not statistically correlated with asparaginase-related toxicity. The correlation between toxicity and asparaginase activity levels was also studied in 382 pediatric patients treated according to the DCOG ALL-11 protocol. In these patients, PEGasparaginase treatment, as in the current cohort, was individualized based on asparaginase activity levels, resulting in much lower trough levels compared to patients who were treated according to the DCOG ALL-10 protocol, which had a fixed PEGasparaginase dose of 2,500 IU/m2. The asparaginase-related toxicity in both protocols, however, was similar and there was no correlation between asparaginase activity levels.28
Figure 3.
Visual predictive check. (A) and (B) show the visual predictive checks of the index and validation dataset, respectively. The observations and their corresponding median and 95% Confidence Intervals (CI) are indicated by the points, and the solid and dashed red lines. In both graphs, these lines fall within the 95% CI of the median and 95% CI (red and blue shaded areas) as obtained by simulation.
Based on the popPK model, dosing guidelines were developed taking into account the effect of the treatment phase on PEGasparaginase CL. Next, dose adjustments based on both week and trough levels were suggested targeting 100-250 IU/L or the higher range of 250-400 IU/L. These dosing guidelines, however, should first be validated clinically. In addition, the effect of increasing the dose in case of an infection on PEGasparaginase activity levels should be analyzed.
In conclusion, 18% of the inter- and 8% of the intrapatient variability in CL of PEGasparaginase, normalized for BSA, can be explained by i) treatment phase showing a higher CL during induction treatment (protocol 1A) and ii) the occurrence of an infection, which increases the CL. With the popPK model developed in this study, PEGasparaginase treatment may be individualized further, taking into account these covariates and the dosing guidelines provided.
Supplementary Material
Funding Statement
FundingThis work was supported by the KiKa foundation.
References
- 1.Broome JD. L-Asparaginase: discovery and development as a tumor-inhibitory agent. Cancer Treat Rep. 1981;65 Suppl 4: 111-114. [PubMed] [Google Scholar]
- 2.Bussolati O, Belletti S, Uggeri J, et al. Characterization of apoptotic phenomena induced by treatment with L-asparaginase in NIH3T3 cells. Exp Cell Res. 1995;220(2):283-291. [DOI] [PubMed] [Google Scholar]
- 3.Miller HK, Salser JS, Balis ME. Amino acid levels following L-asparagine amidohydrolase (EC.3.5.1.1) therapy. Cancer Res. 1969;29(1):183-187. [PubMed] [Google Scholar]
- 4.Ahlke E, Nowak-Gottl U, Schulze-Westhoff P, et al. Dose reduction of asparaginase under pharmacokinetic and pharmacodynamic control during induction therapy in children with acute lymphoblastic leukaemia. Br J Haematol. 1997;96(4):675-681. [DOI] [PubMed] [Google Scholar]
- 5.Albertsen BK, Schroder H, Ingerslev J, et al. Comparison of intramuscular therapy with Erwinia asparaginase and asparaginase Medac: pharmacokinetics, pharmacodynamics, formation of antibodies and influence on the coagulation system. Br J Haematol. 2001;115(4):983-990. [DOI] [PubMed] [Google Scholar]
- 6.Grigoryan RS, Panosyan EH, Seibel NL, et al. Changes of amino acid serum levels in pediatric patients with higher-risk acute lymphoblastic leukemia (CCG-1961). In Vivo. 2004;18(2):107-112. [PubMed] [Google Scholar]
- 7.Riccardi R, Holcenberg JS, Glaubiger DL, et al. L-asparaginase pharmacokinetics and asparagine levels in cerebrospinal fluid of rhesus monkeys and humans. Cancer Res. 1981;41(11 Pt 1):4554-4558. [PubMed] [Google Scholar]
- 8.Appel IM, Kazemier KM, Boos J, et al. Pharmacokinetic, pharmacodynamic and intracellular effects of PEG-asparaginase in newly diagnosed childhood acute lymphoblastic leukemia: results from a single agent window study. Leukemia. 2008;22(9): 1665-1679. [DOI] [PubMed] [Google Scholar]
- 9.Rizzari C, Zucchetti M, Conter V, et al. Lasparagine depletion and L-asparaginase activity in children with acute lymphoblastic leukemia receiving i.m. or i.v. Erwinia C. or E. coli L-asparaginase as first exposure. Ann Oncol. 2000;11(2):189-193. [DOI] [PubMed] [Google Scholar]
- 10.Tsurusawa M, Chin M, Iwai A, et al. LAsparagine depletion levels and L-asparaginase activity in plasma of children with acute lymphoblastic leukemia under asparaginase treatment. Cancer Chemother Pharmacol. 2004;53(3):204-208. [DOI] [PubMed] [Google Scholar]
- 11.Asselin BL, Whitin JC, Coppola DJ, et al. Comparative pharmacokinetic studies of three asparaginase preparations. J Clin Oncol. 1993;11(9):1780-1786. [DOI] [PubMed] [Google Scholar]
- 12.Pieters R, Hunger SP, Boos J, et al. L-asparaginase treatment in acute lymphoblastic leukemia: a focus on Erwinia asparaginase. Cancer. 2011;117(2):238-249. [DOI] [PMC free article] [PubMed] [Google Scholar]
- 13.Avramis VI, Sencer S, Periclou AP, et al. A randomized comparison of native Escherichia coli asparaginase and polyethylene glycol conjugated asparaginase for treatment of children with newly diagnosed standard-risk acute lymphoblastic leukemia: a Children's Cancer Group study. Blood. 2002;99(6):1986-1994. [DOI] [PubMed] [Google Scholar]
- 14.Hawkins DS, Park JR, Thomson BG, et al. Asparaginase pharmacokinetics after intensive polyethylene glycol-conjugated Lasparaginase therapy for children with relapsed acute lymphoblastic leukemia. Clin Cancer Res. 2004;10(16):5335-5341. [DOI] [PubMed] [Google Scholar]
- 15.Silverman LB, Gelber RD, Dalton VK, et al. Improved outcome for children with acute lymphoblastic leukemia: results of Dana- Farber Consortium Protocol 91-01. Blood. 2001;97(5):1211-1218. [DOI] [PubMed] [Google Scholar]
- 16.Asselin BL. The three asparaginases. Comparative pharmacology and optimal use in childhood leukemia. Adv Exp Med Biol. 1999;457:621-629. [PubMed] [Google Scholar]
- 17.Hempel G, Muller HJ, Lanvers-Kaminsky C, et al. A population pharmacokinetic model for pegylated-asparaginase in children. Br J Haematol. 2010;148(1):119-125. [DOI] [PubMed] [Google Scholar]
- 18.Tong WH, Pieters R, Kaspers GJ, et al. A prospective study on drug monitoring of PEGasparaginase and Erwinia asparaginase and asparaginase antibodies in pediatric acute lymphoblastic leukemia. Blood. 2014; 123(13):2026-2033. [DOI] [PMC free article] [PubMed] [Google Scholar]
- 19.Mosteller RD. Simplified calculation of body-surface area. N Engl J Med. 1987; 317(17):1098. [DOI] [PubMed] [Google Scholar]
- 20.Wurthwein G, Lanvers-Kaminsky C, Hempel G, et al. Population pharmacokinetics to model the time-varying clearance of the PEGylated Aaparaginase oncaspar(R) in children with acute lymphoblastic leukemia. Eur J Drug Metab Pharmacokinet. 2017;42(6):955-963. [DOI] [PubMed] [Google Scholar]
- 21.van der Meer LT, Terry SY, van Ingen Schenau DS, et al. In vivo imaging of antileukemic drug asparaginase reveals a rapid macrophage-mediated clearance from the bone marrow. J Nucl Med. 2017; 58(2):214-220. [DOI] [PubMed] [Google Scholar]
- 22.Yang Q, Lai SK. Anti-PEG immunity: emergence, characteristics, and unaddressed questions. Wiley Interdiscip Rev Nanomed Nanobiotechnol. 2015;7(5):655-677. [DOI] [PMC free article] [PubMed] [Google Scholar]
- 23.Adams DO. Tumor cell recognition and destruction by activated macrophages: effector and regulatory mechanisms. Dordrecht: Springer, 1985. [Google Scholar]
- 24.Becker S. Functions of the human mononuclear phagocyte system. Adv Drug Deliver Rev. 1988;2(1-29). [Google Scholar]
- 25.Sassen SD, Mathot RA, Pieters R, et al. Population pharmacokinetics of intravenous Erwinia asparaginase in pediatric acute lymphoblastic leukemia patients. Haematologica. 2017;102(3):552-561. [DOI] [PMC free article] [PubMed] [Google Scholar]
- 26.Schrey D, Borghorst S, Lanvers-Kaminsky C, et al. Therapeutic drug monitoring of asparaginase in the ALL-BFM 2000 protocol between 2000 and 2007. Pediatr Blood Cancer. 2010;54(7):952-958. [DOI] [PubMed] [Google Scholar]
- 27.Xu C, Gupta S, Krishna G, et al. Population pharmacokinetics of peginterferon alfa-2b in pediatric patients with chronic hepatitis C. [DOI] [PubMed] [Google Scholar]
Associated Data
This section collects any data citations, data availability statements, or supplementary materials included in this article.


