

Abstract
Background
Human milk as compared to formula reduces morbidity in preterm infants but requires fortification to meet their nutritional needs and to reduce the risk of extrauterine growth failure. Standard fortification methods are not individualized to the infant and assume that breast milk is uniform in nutritional content. Strategies for individualizing fortification are available; however it is not known whether these are safe, or if they improve outcomes in preterm infants.
Objectives
To determine whether individualizing fortification of breast milk feeds in response to infant blood urea nitrogen (adjustable fortification) or to breast milk macronutrient content as measured with a milk analyzer (targeted fortification) reduces mortality and morbidity and promotes growth and development compared to standard, non‐individualized fortification for preterm infants receiving human milk at < 37 weeks' gestation or at birth weight < 2500 grams.
Search methods
We used the standard search strategy of Cochrane Neonatal to search the Cochrane Central Register of Controlled Trials (CENTRAL; 2019, Issue 9), in the Cochrane Library; Ovid MEDLINE(R) and Epub Ahead of Print, In‐Process & Other Non‐Indexed Citations, Daily and Versions(R); and the Cumulative Index to Nursing and Allied Health Literature (CINAHL), on September 20, 2019. We also searched clinical trials databases and the reference lists of retrieved articles for pertinent randomized controlled trials (RCTs) and quasi‐randomized trials.
Selection criteria
We considered randomized, quasi‐randomized, and cluster‐randomized controlled trials of preterm infants fed exclusively breast milk that compared a standard non‐individualized fortification strategy to individualized fortification using a targeted or adjustable strategy. We considered studies that examined any use of fortification in eligible infants for a minimum duration of two weeks, initiated at any time during enteral feeding, and providing any regimen of human milk feeding.
Data collection and analysis
Data were collected using the standard methods of Cochrane Neonatal. Two review authors evaluated the quality of the studies and extracted data. We reported analyses of continuous data using mean differences (MDs), and dichotomous data using risk ratios (RRs). We used the GRADE approach to assess the certainty of evidence.
Main results
Data were extracted from seven RCTs, resulting in eight publications (521 total participants were enrolled among these studies), with duration of study interventions ranging from two to seven weeks. As compared to standard non‐individualized fortification, individualized (targeted or adjustable) fortification of enteral feeds probably increased weight gain during the intervention (typical mean difference [MD] 1.88 g/kg/d, 95% confidence interval [CI] 1.26 to 2.50; 6 studies, 345 participants), may have increased length gain during the intervention (typical MD 0.43 mm/d, 95% CI 0.32 to 0.53; 5 studies, 242 participants), and may have increased head circumference gain during the intervention (typical MD 0.14 mm/d, 95% CI 0.06 to 0.23; 5 studies, 242 participants). Compared to standard non‐individualized fortification, targeted fortification probably increased weight gain during the intervention (typical MD 1.87 g/kg/d, 95% CI 1.15 to 2.58; 4 studies, 269 participants) and may have increased length gain during the intervention (typical MD 0.45 mm/d, 95% CI 0.32 to 0.57; 3 studies, 166 participants). Adjustable fortification probably increased weight gain during the intervention (typical MD 2.86 g/kg/d, 95% CI 1.69 to 4.03; 3 studies, 96 participants), probably increased gain in length during the intervention (typical MD 0.54 mm/d, 95% CI 0.38 to 0.7; 3 studies, 96 participants), and increased gain in head circumference during the intervention (typical MD 0.36 mm/d, 95% CI 0.21 to 0.5; 3 studies, 96 participants). We are uncertain whether there are differences between individualized versus standard fortification strategies in the incidence of in‐hospital mortality, bronchopulmonary dysplasia, necrotizing enterocolitis, culture‐proven late‐onset bacterial sepsis, retinopathy of prematurity, osteopenia, length of hospital stay, or post‐hospital discharge growth. No study reported severe neurodevelopmental disability as an outcome. One study that was published after our literature search was completed is awaiting classification.
Authors' conclusions
We found moderate‐ to low‐certainty evidence suggesting that individualized (either targeted or adjustable) fortification of enteral feeds in very low birth weight infants increases growth velocity of weight, length, and head circumference during the intervention compared with standard non‐individualized fortification. Evidence showing important in‐hospital and post‐discharge clinical outcomes was sparse and of very low certainty, precluding inferences regarding safety or clinical benefits beyond short‐term growth.
Keywords: Humans; Infant, Newborn; Bias; Blood Urea Nitrogen; Body Height; Bone Diseases, Metabolic; Bone Diseases, Metabolic/epidemiology; Child Development; Child Development/physiology; Confidence Intervals; Enteral Nutrition; Enterocolitis, Necrotizing; Enterocolitis, Necrotizing/epidemiology; Food, Fortified; Head; Head/anatomy & histology; Head/growth & development; Infant Formula; Infant Nutritional Physiological Phenomena; Infant, Premature; Infant, Premature/growth & development; Infant, Very Low Birth Weight; Infant, Very Low Birth Weight/growth & development; Milk, Human; Randomized Controlled Trials as Topic; Retinopathy of Prematurity; Retinopathy of Prematurity/epidemiology; Weight Gain
Plain language summary
Individualized versus standard diet fortification for growth and development in very low birth weight infants receiving human milk
Review question: does individualized rather than standard, non‐individualized addition of nutrients and calories to breast milk feeds safely improve growth and other outcomes in preterm infants?
Background: preterm infants are at risk for poor growth following birth. Breast milk reduces their risk of illness but does not meet their nutritional needs. Therefore, breast milk fed to preterm infants must be fortified with extra nutrients. Usual methods of fortifying breast milk treat all breast milk and all preterm infants the same. However, two methods are available for individualizing fortification for each preterm infant. Targeted fortification adds nutrients to breast milk based on the results of breast milk analysis. Adjustable fortification adds nutrients based on the results of preterm infant laboratory results. Individualized fortification may improve preterm infant growth or other outcomes. However, it is not known whether targeted or adjustable fortification is safe or improves outcomes for preterm infants compared with the standard method.
Study characteristics: through literature searches updated to September 2019, we found seven studies that tested the effects of targeted or adjustable fortification of breast milk feeds compared to standard fortification in preterm infants, yielding eight publications (521 total participants were enrolled in these studies). One study that was published after our literature search was completed is awaiting classification.
Key results: targeted or adjustable fortification improves short‐term growth compared to standard fortification in preterm infants. Determining the best way to customize breast milk feeds is necessary, as is clarifying its safety and effects on other clinical outcomes.
Certainty of evidence: very low to moderate. Moderate certainty means that the true effect of individualized fortification on growth in preterm infants is likely to be close to the result of this review but there is a possibility that it is substantially different. Low certainty means that the true effect may be substantially different from the results of this review. Very low certainty means that the true effect of individualized fortification on growth in preterm infants is likely to be substantially different from the results of this review. Certainty of evidence was downgraded most often in this review due to small numbers of participants in included studies and significant differences in study design and outcome measures among included studies.
Summary of findings
Summary of findings 1. Targeted or adjustable individualized fortification compared to standard non‐individualized fortification for promoting growth and development in very low birth weight infants receiving human milk.
| Targeted or adjustable individualized fortification compared to standard non‐individualized fortification for promoting growth and development in very low birth weight infants receiving human milk | ||||||
| Patient or population: promoting growth and development in very low birth weight infants receiving human milk Setting: neonatal ICU Intervention: targeted or adjustable individualized fortification Comparison: standard non‐individualized fortification | ||||||
| Outcomes | Anticipated absolute effects* (95% CI) | Relative effect (95% CI) | № of participants (studies) | Certainty of the evidence (GRADE) | Comments | |
| Risk with standard non‐individualized fortification | Risk with targeted or adjustable individualized fortification | |||||
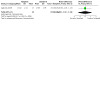
| Growth velocity, weight, g/kg/d, end of intervention | Mean growth velocity, weight, g/kg/d, end of intervention was 17.1 g/kg/d | MD 1.88 g/kg/d more (1.26 more to 2.5 more) | ‐ | 345 (6 RCTs) | ⊕⊕⊕⊝ MODERATEa | Although Kadioglu Simsek 2019 appeared prominent compared to other studies in its effects favoring individualized fortification, this was explored further in the sensitivity analysis; thus evidence was not downgraded further |
| Growth velocity, length, mm/d, end of intervention (length velocity) | Mean growth velocity, length, mm/d, end of intervention was 1.17 mm/d | MD 0.43 mm/d more (0.32 more to 0.53 more) | ‐ | 262 (5 RCTs) | ⊕⊕⊝⊝ LOWa,b | Although Kadioglu Simsek 2019 appeared prominent compared to other studies in its effects favoring individualized fortification, this was explored further in the sensitivity analysis; thus evidence was not downgraded further |
| Growth velocity, head circumference, mm/d, end of intervention | Mean growth velocity, head circumference, mm/d, end of intervention was 1.18 mm/d | MD 0.14 mm/d higher (0.06 higher to 0.23 higher) | ‐ | 242 (5 RCTs) | ⊕⊕⊝⊝ LOWa,b | No single study appeared to be an outlier compared to other studies |
| Necrotizing enterocolitis | No data available | |||||
| Culture‐proven late‐onset sepsis | No data available | |||||
| Mortality | No data available | |||||
| Bronchopulmonary dysplasia |
Study population | RR 0.89 (0.71 to 1.12) | 391 (4 RCTs) | ⊕⊝⊝⊝ VERY LOWb,c,d | ||
| 443 per 1000 | 394 per 1000 (315 to 496) | |||||
| Retinopathy of prematurity, any |
Study population | RR 0.79 (0.36 to 1.72) | 60 (1 RCT) | ⊕⊝⊝⊝ VERY LOWb,d | ||
| 350 per 1000 | 276 per 1000 (126 to 602) | |||||
| Osteopenia | Study population | RR 0.86 (0.40 to 1.84) | 60 (1 RCT) | ⊕⊝⊝⊝ VERY LOWb,d,e | ||
| 350 per 1000 | 301 per 1000 (140 to 644) | |||||
| *The risk in the intervention group (and its 95% confidence interval) is based on the assumed risk in the comparison group and the relative effect of the intervention (and its 95% CI). CI: confidence interval; ICU: intensive care unit; MD: mean difference; RCT: randomized controlled trial; RR: risk ratio. | ||||||
| GRADE Working Group grades of evidence. High certainty: we are very confident that the true effect lies close to that of the estimate of the effect. Moderate certainty: we are moderately confident in the effect estimate: the true effect is likely to be close to the estimate of the effect, but there is a possibility that it is substantially different. Low certainty: our confidence in the effect estimate is limited: the true effect may be substantially different from the estimate of the effect. Very low certainty: we have very little confidence in the effect estimate: the true effect is likely to be substantially different from the estimate of effect. | ||||||
aDowngraded by one for inconsistency due to high heterogeneity (≥ 75%) in estimate of effect.
bDowngraded by one for imprecision due to wide confidence intervals that include both clinically significant and clinically insignificant effects.
cDowngraded by one for inconsistency due to variation among studies in case definitions of outcome.
dDowngraded by two for imprecision due to total enrollment insufficient for 50% power to detect 20% change compared to control.
eDowngraded by one for indirectness due to use of surrogate outcome (osteopenia) rather than patient‐important outcome (fractures).
Summary of findings 2. Targeted individualized compared to standard non‐individualized fortification for promoting growth and development in very low birth weight infants receiving human milk.
| Targeted individualized compared to standard non‐individualized fortification for promoting growth and development in very low birth weight infants receiving human milk | ||||||
| Patient or population: promoting growth and development in very low birth weight infants receiving human milk Setting: neonatal ICU Intervention: targeted individualized Comparison: standard non‐individualized fortification | ||||||
| Outcomes | Anticipated absolute effects* (95% CI) | Relative effect (95% CI) | № of participants (studies) | Certainty of the evidence (GRADE) | Comments | |
| Risk with standard non‐individualized fortification | Risk with targeted individualized | |||||
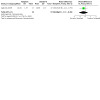
| Growth velocity, weight, g/kg/d, end of intervention | Mean growth velocity, weight, g/kg/d, end of intervention was 19.2 g/kg/d | MD 1.87 g/kg/d higher (1.15 higher to 2.58 higher) | ‐ | 269 (4 RCTs) | ⊕⊕⊕⊝ MODERATEa | Although Kadioglu Simsek 2019 appeared prominent compared to other studies in its effects favoring individualized fortification, this was explored further in the sensitivity analysis; thus evidence was not downgraded further |
| Growth velocity, length, mm/d, end of intervention | Mean growth velocity, length, mm/d, end of intervention was 1.64 mm/d | MD 0.45 mm/d higher (0.32 higher to 0.57 higher) | ‐ | 166 (3 RCTs) | ⊕⊕⊝⊝ LOWa,b | Although Kadioglu Simsek 2019 appeared prominent compared to other studies in its effects favoring individualized fortification, this was explored further in the sensitivity analysis; thus evidence was not downgraded further |
| Growth velocity, head circumference, mm/d, end of intervention |
Mean growth velocity, head circumference, mm/d, end of intervention was 1.29 mm/d | MD 0.08 mm/d higher (0.01 lower to 0.18 higher) | ‐ | 166 (3 RCTs) | ⊕⊕⊝⊝ LOWa,b | No single study appeared to be an outlier compared to other studies |
| Length of hospital stay, days | Mean length of hospital stay, days, was 86 days | MD 12 days lower (26.38 lower to 2.38 higher) | ‐ | 75 (1 RCT) | ⊕⊝⊝⊝ VERY LOWc,d | |
| Retinopathy of prematurity | No data available | |||||
| Bronchopulmonary dysplasia | No data available | |||||
| Mortality | No data available | |||||
| In‐hospital mortality | Study population | RR 0.14 (0.02 to 1.14) | 334 (3 RCTs) | ⊕⊝⊝⊝ VERY LOWb,d | ||
| 36 per 1000 | 5 per 1000 (1 to 41) | |||||
| Necrotizing enterocolitis | Study population | RR 0.40 (0.08 to 1.99) | 257 (2 RCTs) | ⊕⊝⊝⊝ VERY LOWb,d | ||
| 39 per 1000 | 16 per 1000 (3 to 78) | |||||
| Culture‐proven late‐onset bacterial sepsis | Study population | RR 1.29 (0.76 to 2.17) | 257 (2 RCTs) | ⊕⊝⊝⊝ VERY LOWb,d | ||
| 156 per 1000 | 202 per 1000 (119 to 339) | |||||
| *The risk in the intervention group (and its 95% confidence interval) is based on the assumed risk in the comparison group and the relative effect of the intervention (and its 95% CI). CI: confidence interval; MD: mean difference; RCT: randomized controlled trial; RR: risk ratio. | ||||||
| GRADE Working Group grades of evidence. High certainty: we are very confident that the true effect lies close to that of the estimate of the effect. Moderate certainty: we are moderately confident in the effect estimate: the true effect is likely to be close to the estimate of the effect, but there is a possibility that it is substantially different. Low certainty: our confidence in the effect estimate is limited: the true effect may be substantially different from the estimate of the effect. Very low certainty: we have very little confidence in the effect estimate: the true effect is likely to be substantially different from the estimate of effect. | ||||||
aDowngraded by one for inconsistency due to high heterogeneity in estimate of effect (I² ≥ 75%).
bDowngraded by one for imprecision due to wide confidence intervals that include both clinically significant and clinically insignificant effects.
cDowngraded by one for risk of bias. Prolacta Bioscience provided the product for the study and assisted in data analysis. Two study authors received financial support and speaker honoraria from Prolacta Bioscience. Two other study authors were employees of Prolacta Bioscience. Allocation concealment, blinding of outcome assessment not described. Masking of study groups was not possible at one site.
dDowngraded by two for imprecision due to total enrolment insufficient for 50% power to detect 20% change compared to control.
Summary of findings 3. Adjustable individualized fortification compared to standard non‐individualized fortification for promoting growth and development in very low birth weight infants receiving human milk.
| Adjustable individualized fortification compared to standard non‐individualized fortification for promoting growth and development in very low birth weight infants receiving human milk | ||||||
| Patient or population: promoting growth and development in very low birth weight infants receiving human milk Setting: neonatal ICU Intervention: adjustable individualized fortification Comparison: standard non‐individualized fortification | ||||||
| Outcomes | Anticipated absolute effects* (95% CI) | Relative effect (95% CI) | № of participants (studies) | Certainty of the evidence (GRADE) | Comments | |
| Risk with standard non‐individualized fortification | Risk with adjustable individualized fortification | |||||
| Growth velocity, weight, g/kg/d, end of intervention |
Mean growth velocity, weight, g/kg/d, end of intervention was 15.2 g/kg/d | MD 2.86 g/kg/d higher (1.69 higher to 4.03 higher) | ‐ | 96 (3 RCTs) | ⊕⊕⊕⊝ MODERATEa | Although Kadioglu Simsek 2019 appeared prominent compared to other studies in its effects favoring individualized fortification, this was explored further in the sensitivity analysis; thus evidence was not downgraded further |
| Growth velocity, length, mm/d, end of intervention |
Mean growth velocity, length, mm/d, end of intervention was 1.06 mm/d | MD 0.54 mm/d higher (0.38 higher to 0.7 higher) | ‐ | 96 (3 RCTs) | ⊕⊕⊕⊝ MODERATEa | Although Kadioglu Simsek 2019 appeared prominent compared to other studies in its effects favoring individualized fortification, this was explored further in the sensitivity analysis; thus evidence was not downgraded further |
| Growth velocity, head circumference, mm/d, end of intervention | Mean growth velocity, head circumference, mm/d, end of intervention was 0.98 mm/d | MD 0.36 mm/d higher (0.21 higher to 0.5 higher) | ‐ | 96 (3 RCTs) | ⊕⊕⊕⊕ HIGH | |
| Mortality | No data available | |||||
| NEC stage ≥ 2 | No data available | |||||
| Culture‐proven late‐onset sepsis | No data available | |||||
| Retinopathy of prematurity | No data available | |||||
| Bronchopulmonary dysplasia | No data available | |||||
| *The risk in the intervention group (and its 95% confidence interval) is based on the assumed risk in the comparison group and the relative effect of the intervention (and its 95% CI). CI: confidence interval; ICU: intensive care unit; MD: mean difference; NEC, necrotizing enterocolitis; RCT: randomized controlled trial. | ||||||
| GRADE Working Group grades of evidence. High certainty: we are very confident that the true effect lies close to that of the estimate of the effect. Moderate certainty: we are moderately confident in the effect estimate: the true effect is likely to be close to the estimate of the effect, but there is a possibility that it is substantially different. Low certainty: our confidence in the effect estimate is limited: the true effect may be substantially different from the estimate of the effect. Very low certainty: we have very little confidence in the effect estimate: the true effect is likely to be substantially different from the estimate of effect. | ||||||
aInconsistency due to high heterogeneity in estimate of effect (I² ≥ 75%).
Summary of findings 4. Targeted individualized fortification compared to adjustable individualized fortification for promoting growth and development in very low birth weight infants receiving human milk.
| Targeted individualized fortification compared to adjustable individualized fortification for promoting growth and development in very low birth weight infants receiving human milk | ||||||
| Patient or population: promoting growth and development in very low birth weight infants receiving human milk Setting: neonatal ICU Intervention: targeted individualized fortification Comparison: adjustable individualized fortification | ||||||
| Outcomes | Anticipated absolute effects* (95% CI) | Relative effect (95% CI) | № of participants (studies) | Certainty of the evidence (GRADE) | Comments | |
| Risk with adjustable individualized fortification | Risk with targeted individualized fortification | |||||
| Growth velocity, weight, g/kg/d ‐ end of intervention | Mean growth velocity, weight, g/kg/d ‐ end of intervention was 21.5 g/kg/d | MD 2.49 g/kg/d higher (0.44 higher to 4.54 higher) | ‐ | 72 (2 RCTs) | ⊕⊕⊕⊝ MODERATEa | |
| Growth velocity, length, mm/d ‐ end of intervention | Mean growth velocity, length, mm/d ‐ end of intervention was 1.5 mm/d | MD 0.07 mm/d higher (0.06 lower to 0.2 higher) | ‐ | 72 (2 RCTs) | ⊕⊕⊝⊝ LOWb | |
| Mortality | No data available | |||||
| NEC ≥ stage 2 | No data available | |||||
| Culture‐proven late‐onset sepsis | No data available | |||||
| Retinopathy of prematurity | No data available | |||||
| Bronchopulmonary dysplasia | No data available | |||||
aDowngraded by one for imprecision due to wide confidence intervals that include both clinically significant benefit and clinically insignificant effects.
bDowngraded by two for imprecision due to total enrolment insufficient for 50% power to detect 20% change compared to control.
Background
Description of the condition
Growth failure in preterm infants
Preterm birth is a major cause of mortality and morbidity worldwide. A major morbidity faced by preterm infants is extrauterine growth restriction (EUGR), defined as weight at discharge less than the tenth percentile of expected intrauterine growth at the corresponding gestational age (Clark 2003; Ehrenkranz 2014; Hu 2019). Although rates of EUGR are decreasing, it remains a significant problem among very low birth weight (VLBW) infants in reports from large multi‐center cohorts in North America and Israel (Griffin 2016; Horbar 2015; Ofek Shlomai 2014). Growth failure in VLBW infants results from the complex interaction of many factors, of which inadequate nutrition, especially during the first weeks of life, appears critically important (Embleton 2001). Growth failure during neonatal intensive care unit (NICU) hospitalization is associated with adverse neurodevelopmental outcomes including occurrence of cerebral palsy, scores less than 70 on the Bayley II Mental Development and Psychomotor Development Indices, and abnormal neurological examinations at 18 to 22 months (Ehrenkranz 1999), as well as abnormal performance in IQ and verbal flexibility, visual memory, and visual flexibility composite scores at a mean age of 25 years (Sammallahti 2014).
Fortification of human milk for preterm infants
The American Academy of Pediatrics recommends human milk for neonates due to its associated improved maternal and infant health outcomes (AAP 2012). These include decreased infections in the first year of life; reduced risk of sudden infant death syndrome; protective effects against asthma, atopic dermatitis, and eczema; reduction in certain gastrointestinal diseases, obesity, childhood leukemia, and lymphoma; and improved neurodevelopmental outcomes. Specifically, human milk protects against sepsis and necrotizing enterocolitis (NEC) in preterm infants, and is associated with fewer hospitalizations in the year after NICU discharge, lower rates of severe retinopathy of prematurity (ROP), and lower rates of metabolic syndrome and lower blood pressure in adolescence (AAP 2012). Human milk in preterm infants is also associated with improved neurodevelopmental outcomes, including mental, motor, and behavior skills (AAP 2012).
Although human milk has been established as the preferred enteral feeding option for preterm infants, its nutritional content is not sufficient to maintain the pace of intrauterine nutrient accretion. Intake of both protein and energy is crucial for the growth of preterm infants, and human milk does not adequately provide the recommended amounts at typical feeding volumes of between 135 and 200 mL/kg/d (Arslanoglu 2019). Thus, fortification of human milk can be used in the NICU setting to optimize nutritional intake and improve growth outcomes for preterm infants (Agostoni 2010; Ehrenkranz 2006). Bovine or human milk‐derived multi‐nutrient fortifier is typically introduced once the infant has demonstrated tolerance of enteral feeds advanced beyond minimal volumes. These fortifiers attempt to increase the protein and energy levels of enteral feeds to goals of 3.5 g/kg/d to 4.5 g/kg/d and 105 kcal/kg/d to 135 kcal/kg/d, respectively (Arslanoglu 2019). Fortifier amount is typically titrated clinically in response to infant growth and is usually continued until the infant approaches discharge.
Standard methods for fortifying human milk do not account proactively for variation in human milk nutrient content. However, when measured both within and among mothers, the macronutrient composition of human milk varies considerably (Wu 2018). In addition, the majority of banked donor milk is pooled from mothers of term infants and, when compared to preterm maternal milk, differs in macronutrient composition (Lawrence 2011; Radmacher 2013; Saarela 2005).
Description of the intervention
This review compared three approaches to human milk fortification for preterm infants: standard, adjustable, and targeted (Adamkin 2014; Alan 2013; Radmacher 2017). Standard fortification, the most commonly used approach, assumes that all breast milk has an average caloric content and macronutrient composition, and then fortifies with a predetermined amount of fortifier. With adjustable fortification, addition of fortifying nutrients is individualized using the infant’s metabolic response to enteral protein intake, as measured by blood urea nitrogen (BUN) (Alan 2013). Adjustable fortification typically increases protein content as tolerated using cutoff BUN levels typically around 9 mg/dL to 16 mg/dL, adding extra protein if BUN levels remain low (Arslanoglu 2019). Targeted fortification individualizes fortification using the results of human milk analysis, specifically by adding extra protein, fat, or carbohydrate based on the macronutrient concentration measured (Arslanoglu 2019). Milk analyzers assess breast milk content of carbohydrates, fat, protein, total solids, and energy, and may help healthcare providers meet the needs of infants requiring additional nutrients because of preterm birth or other health conditions. In 2018, the US Food and Drug Administration (FDA) approved a human milk analyzer for clinical use (US Food and Drug Administration 2018). NICUs are incorporating the use of analyzers into clinical care (Wake Forest/Baptist Medical Center 2018).
How the intervention might work
The primary goal of fortifying human milk for preterm infants is to support postnatal growth at a velocity similar to in utero growth (AAP 1977). Standard fortification practice fails to account for variation in the composition of mother’s milk and donor’s milk, and is associated with postnatal growth failure. By individualizing nutritional support, adjustable or targeted fortification strategies may improve growth failure and, secondarily, the neurodevelopmental outcomes associated with growth.
Why it is important to do this review
Given the known variation in human milk macronutrient composition before fortification, a systematic assessment of standard versus adjustable versus targeted diet fortification of VLBW infant feedings is warranted. This review is clearly distinct from existing reviews on topics involving human milk and preterm infants (donor milk versus formula, banked preterm milk versus banked term milk, maternal breast milk versus formula) and has incorporated sophisticated advances in human milk feeding techniques, for which important literature is just emerging. In addition, this review makes available summary results of randomized controlled trials on different fortification strategies as they emerge, supporting management and promotion of optimal VLBW outcomes.
Infrared human milk analyzers efficiently provide accurate macronutrient profiles for individual specimens of human milk. They have reached the market, they are cost‐effective, and they are used in descriptive research studies to examine the composition of mother’s own milk and donor human milk (Radmacher 2013; Rochow 2013; Sauer 2011). In 2018, the FDA approved a human milk analyzer for clinical use. Analyzers therefore allow for targeted human milk fortification (i.e. tailored to individual infants and milk specimens) in clinical care. The impact of routine use of analyzers upon nutritional support, clinical outcomes, or long‐term neurodevelopment for VLBW infants receiving human milk is yet to be seen in the NICU setting. Similarly, the comparative merits of these fundamentally different approaches to fortification have not been well defined.
Objectives
To determine whether individualizing fortification of breast milk feeds in response to infant blood urea nitrogen (adjustable fortification) or to breast milk macronutrient content as measured with a milk analyzer (targeted fortification) reduces mortality and morbidity and promotes growth and development compared to standard, non‐individualized fortification for preterm infants receiving human milk at < 37 weeks' gestation or at birth weight < 2500 grams.
Methods
Criteria for considering studies for this review
Types of studies
We considered randomized controlled trials (RCTs), quasi‐RCTs, and cluster‐RCTs for inclusion. We excluded cross‐over trials.
Types of participants
Preterm infants at < 37 weeks' gestation or at birth weight < 2500 grams fed human milk exclusively ‐ either mother’s own milk or donor human milk ‐ or a combination of mother’s milk and donor milk.
Types of interventions
Interventions were human milk fortification methods. We compared each of the three fortification approaches: targeted and adjustable fortification; adjustable and standard fortification; targeted and standard fortification. We considered studies examining any use of fortification in eligible infants for a minimum duration of two weeks, initiated at any time during enteral feeding, and with any regimen of human milk feeding.
Types of outcome measures
Primary outcomes
-
End of intervention growth velocity
Weight (g/kg/d)
Length (mm/d)
Head circumference (mm/d)
Growth velocity may be expressed in various ways. For example, weight growth velocity may be expressed as g/d or as g/kg/d, and may be calculated, for example, as growth velocity = 1000 × Ln(Wt2/Wt1)/(D2 − D1), where Wt1 and Wt2 are the weights measured on days D1 (birth) and D2 (discharge), respectively (Patel 2005).
Secondary outcomes
-
In‐hospital growth outcomes (at 36 weeks' postmenstrual age; at hospital discharge)
Weight (g or Z score)
Length (cm or Z score)
Head circumference (cm or Z score)
Growth velocity in weight (g/kg/d), length (cm/week), and head circumference (cm/week)
Body mass index
Ponderal Index
Incidence of growth < 10th percentile for postmenstrual age
-
Post‐discharge growth outcomes (up to six months' corrected age; at six months' or greater corrected age)
Weight (g or Z score)
Length (cm or Z score)
Head circumference (cm or Z score)
Growth velocity in weight (g/kg/d), length (cm/week), and head circumference (cm/week)
Body mass index
Ponderal Index
Incidence of growth < 10th percentile for corrected age
-
Other growth outcomes
Time to regain birth weight (days)
-
Clinical feeding/nutritional outcomes
Time to establishment of full enteral feedings (days)
Duration of parenteral nutrition (days)
Feeding intolerance defined as the number of days when feeds were stopped or reduced and parenteral nutrition was either commenced or increased during hospital stay secondary to the inability to digest enteral feeds as indicated by gastric residual volume > 50%, abdominal distention or emesis, or both, or as defined by study authors (Moore 2011)
Osteopenia
-
In‐hospital clinical outcomes
In‐hospital mortality
NEC stage ≥ 2 (Bell 1978)
Culture‐proven sepsis
Any retinopathy of prematurity
Retinopathy of prematurity treated with retinal ablation or vascular endothelial growth factor (VEGF) inhibitor
Culture‐proven late‐onset sepsis
Bronchopulmonary dysplasia at 28 days of life and at 36 weeks' postmenstrual age (Jobe 2001)
Length of hospitalization (days)
Severe neurodevelopmental disability defined after 12 months' corrected age as the presence of one or more of the following: non‐ambulatory cerebral palsy; developmental delay (Bayley Scales of Infant Development) (Bayley 1993; Bayley 2005); auditory impairment (any impairment requiring or unimproved by amplification); and visual impairment (visual acuity < 6/60)
Search methods for identification of studies
We used the criteria and standard methods of Cochrane and Cochrane Neonatal.
Electronic searches
We conducted a comprehensive search including the Cochrane Central Register of Controlled Trials (CENTRAL; 2019, Issue 9), in the Cochrane Library; OVID MEDLINE(R) and Epub Ahead of Print, In‐Process & Other Non‐Indexed Citations, Daily and Versions(R) (1946 to September 20, 2019); MEDLINE via PubMed (September 1, 2018 to September 20, 2019) for the previous year; and the Cumulative Index to Nursing and Allied Health Literature (CINAHL) (1981 to September 21, 2019). We have presented the search strategies used for each database in Appendix 1. We did not apply language restrictions.
We searched clinical trial registries for ongoing or recently completed trials. We searched the World Health Organization’s International Clinical Trials Registry Platform (ICTRP) (www.who.int/ictrp/search/en), as well as the US National Library of Medicine’s ClinicalTrials.gov, via Cochrane CENTRAL. Additionally, we searched the ISRCTN Registry for any unique trials not found through the Cochrane CENTRAL search.
Searching other resources
We handsearched the reference lists of identified clinical trials.
Data collection and analysis
We used the standard methods of Cochrane Neonatal.
Selection of studies
Two review authors reviewed abstracts and studies for inclusion in this review. We resolved disagreements in opinion through discussion.
Data extraction and management
All review authors extracted data using an extraction form created for this study. Two review authors, assigned randomly, extracted data from each included study.
Assessment of risk of bias in included studies
Two review authors (JH, FS) independently assessed risk of bias (low, high, or unclear) of all included trials using Cochrane’s ‘Risk of bias’ tool (Higgins 2011a).
Sequence generation (selection bias)
Allocation concealment (selection bias)
Blinding of participants and personnel (performance bias)
Blinding of outcome assessment (detection bias)
Incomplete outcome data (attrition bias)
Selective reporting (reporting bias)
Any other bias
We resolved any disagreements by discussion or by consultation with a third review author. See Appendix 2 for a more detailed description of criteria used to assess each domain.
Measures of treatment effect
We used the standard methods of Cochrane Neonatal. We performed analyses using the most recent version of the statistical package Review Manager 5 (Review Manager 2014). We assessed dichotomous data using risk ratio (RR) and risk difference (RD) with corresponding 95% confidence intervals (CIs). If we detected a statistically significant difference, we calculated the number needed to treat for an additional beneficial outcome (NNTB) and the number needed to treat for an additional harmful outcome (NNTH). We presented means, standard deviations (SDs), and corresponding 95% CIs for continuous outcomes. We assumed a fixed‐effect model.
Unit of analysis issues
For each study, we reported whether the unit of randomization, and hence the unit of analysis, occurred at the individual level or at the cluster level. We did not identify any pertinent cluster‐randomized trials. Kadioglu Simsek 2019 tested all three fortification strategies in separate study arms. When targeted or adjustable fortification was compared with standard fortification (Comparison 1), the two individualized fortification arms (targeted, adjustable) were combined using the methods described in the Cochrane Handbook for Systematic Reviews of Interventions (Higgins 2019). For categorical outcomes, the targeted and adjustable fortification arms were combined into a single Individualized group and were used in a single comparison with the standard fortification arm. For continuous outcomes, targeted versus standard and adjustable versus standard were included as separate comparisons; however the total number of participants in the standard arm was divided in half for each comparison, and the means and standard deviations were left unchanged.
Dealing with missing data
We obtained data from primary investigators when published data were incomplete.
Assessment of heterogeneity
We evaluated heterogeneity of studies via the I² statistic, using the following cutoffs and labels for heterogeneity.
Less than 25% indicates no heterogeneity.
25% to 49% indicates low heterogeneity.
50% to 74% indicates moderate heterogeneity.
75% and above indicates high heterogeneity.
Assessment of reporting biases
When appropriate, we identified potential reporting bias using funnel plots.
Data synthesis
We assessed dichotomous data using risk ratio (RR) and risk difference (RD) with corresponding 95% confidence intervals (CIs). If we detected a statistically significant difference, we calculated the number needed to treat for an additional beneficial outcome (NNTB) and the number needed to treat for an additional harmful outcome (NNTH). We presented means, standard deviations, and corresponding 95% CIs for continuous outcomes.
Certainty of evidence
We used the GRADE approach, as outlined in the GRADE Handbook (Schünemann 2013), to assess the certainty of evidence for the following (clinically relevant) outcomes: growth velocity during intervention; mortality; NEC ≥ stage 2; culture‐proven late‐onset sepsis; retinopathy of prematurity; and bronchopulmonary dysplasia.
The GRADE approach yields an assessment of the certainty of a body of evidence as assigned to one of four grades.
High certainty: further research is very unlikely to change our confidence in the estimate of effect.
Moderate certainty: further research is likely to have an important impact on our confidence in the estimate of effect and may change the estimate.
Low certainty: further research is very likely to have an important impact on our confidence in the estimate of effect and is likely to change the estimate.
Very low certainty: we are very uncertain about the estimate.
Two review authors (JIH, JMT) independently assessed the certainty of evidence for each outcome. We used the GRADEpro GDT Guideline Development Tool to create four ‘Summary of findings’ tables to report the certainty of evidence. We downgraded the certainty of evidence for imprecision due to insufficient power based on sample size calculations performed with a web‐based calculator (Kohn 2020).
Subgroup analysis and investigation of heterogeneity
Planned subgroup analysis consisted of comparisons of standard versus adjustable versus targeted human milk fortification by birth weight (< 1000 grams; ≥ 1000 grams and < 1500 grams) and donor breast milk versus mother’s own milk.
Sensitivity analysis
If we included a sufficient number of trials in this review, we planned to perform sensitivity analyses by excluding unblinded trials and those without adequate treatment allocation concealment.
Results
Description of studies
Results of the search
Our search generated seven randomized controlled trials that resulted in eight publications and met inclusion criteria (Figure 1). Four published reports described the effects of targeted versus standard fortification on preterm neonates (Agakidou 2019; Hair 2014; Hair 2016 [secondary analysis of Hair 2014]; Rochow 2020). Two reports detailed the effects of adjustable versus standard fortification on preterm neonates (Arslanoglu 2006; Moro 1995). The remaining two reports described the effects of targeted versus adjustable fortification (Bulut 2019), as well as targeted or adjustable versus standard fortification, on preterm neonates (Kadioglu Simsek 2019). One multi‐center study was performed in the USA (Hair 2014). Six single‐center studies were performed in Canada (Rochow 2020), Greece (Agakidou 2019), Italy (Arslanoglu 2006; Moro 1995), and Turkey (Bulut 2019; Kadioglu Simsek 2019).
1.

Study flow diagram.
Included studies
This randomized double‐blinded study with parallel design took place in Greece between March 2013 and March 2016. Appropriate‐for‐gestational age preterm infants at between 25 and 32 weeks' gestation with birth weight < 1500 grams admitted to the study NICU within the first 24 hours of life were eligible for inclusion in the study. Infants with evidence of maternal health problems precluding breast‐feeding, congenital infection, metabolic/genetic syndrome, early death, grade III to IV intraperiventricular hemorrhage, or necrotizing enterocolitis were excluded from the study. Infants were randomized in clusters through a computer‐generated randomization list based on birth weight ≥ or < 1200 grams. All infants were initially fed exclusively with own mother’s milk fortified with a cow’s milk‐based, multi‐nutrient human milk fortifier (HMF) (PreNAN FM‐85; Nestlé, Vevey, Switzerland). Infants randomized to the standard fortification group received a fixed amount of fortification, 5 grams HMF/100 mL. Infants randomized to the targeted fortification group had fortification consisting of a daily protein content of 4 to 4.5 g/kg for infants with birth weight < 1200 grams and 3.5 to 4 g/kg for infants ≥ 1200 grams. The primary aims of this study were to compare the effects of protein‐targeted fortification on:
insulin‐like growth factor‐1 (IGF‐1) and ghrelin plasma levels up to the 35th week postmenstrual age; and
growth up to 12 months' corrected age.
The secondary outcome was to examine the effectiveness of two own mother’s milk fortification protocols in attaining the recommended range of macronutrient intake.
Arslanoglu and colleagues performed a single‐center RCT comparing adjustable fortification to standard fortification of feedings for very low birth weight infants. Infants with birth weight 600 to 1750 grams at gestational age 24 to 34 weeks who reached a feeding volume of 90 mL/kg/d of enteral feedings before 21 days of life were eligible for inclusion in this study. Infants with major congenital abnormalities, chromosomal aberrations, systemic disease, sepsis, necrotizing enterocolitis, or intraventricular hemorrhage, or who were ventilator‐dependent on day of life 21, were excluded from the study. Randomization used stratification by birth weight (< 1250, 1251 to 1500, and 1501 to 1750 grams). All infants received standard fortification practices until an enteral feeding volume of 150 mL/kg/d was achieved. Standard fortification practice was to fortify human milk with 5 g/100 mL HMF. Once an enteral feeding volume of 150 mL/kg/d was achieved, infants randomized to the adjustable fortification arm had adjustments to fortification based on blood urea nitrogen (BUN) levels. The primary outcome of this study was weight gain (g/kg/d, g/d) determined from study day 1 to a weight of 2000 grams. Secondary outcome measures were BUN and serum creatinine, albumin, calcium, phosphorus, and alkaline phosphatase levels.
This randomized controlled single‐center trial, performed in Turkey between September 2013 and February 2014, compared effects of targeted and adjustable protein fortification on early growth of VLBW infants receiving human milk. VLBW infants at ≤ 32 weeks' gestation who were receiving a diet exclusively of human milk were eligible for inclusion in this study. Infants were excluded if they had any congenital abnormality, metabolic disease, necrotizing enterocolitis, or moderate to severe bronchopulmonary dysplasia, or had received any formula feedings. Predetermined random assignments to feeding groups were kept in sequentially numbered sealed opaque envelopes. When enteral feeding volume reached 80 mL/kg/d, human milk was fortified in a stepwise manner up to 4 units fortifier/100 mL (Eoprotin; Aptamil, Milupa, Germany) per standard nursery practice. Randomization and study commencement occurred when the enteral feeding volume reached 150 mL/kg/d of fortified human milk. Infants randomized to the targeted fortification group received added protein (Protifar; Nutricia, Erlangen, Germany) following milk analysis with a mid‐infrared spectrophotometer (Miris AB, Uppsala, Sweden) to maintain a target protein intake of 4.5 g/kg/d. Infants randomized to the adjustable fortification group received added protein based on BUN levels to reach a maximum estimated amount of protein of 4.5 g/kg/d. The goal of this study was to compare the effects of targeted and adjustable fortification on early growth of breast‐fed VLBW infants.
Hair 2014: this study from the USA consisted of two separate reports published by the same investigators in 2014 and 2016.
Hair and colleagues randomized infants between 750 and 1250 grams birth weight to one of two groups ‐ a standard fortification group and a targeted fortification group that received a human milk‐derived cream supplement (Prolact CR; Prolacta Bioscience, City of Industry, CA, USA) if the human milk (HM) that infants were receiving was found to be < 20 kcal/oz based on milk analysis with a near‐infrared milk analyzer (SpectraStar 2400RTQ; Unity Scientific, Brookfield, CT, USA). Infants were randomized via blocks of four. Exclusion criteria included infants with major congenital anomalies, clinically significant congenital heart disease, low expectation for survival, high potential for early transfer to a non‐study institution, enrollment in another clinical study affecting nutritional management, failure to start minimum enteral feeds before 21 days of life, or intestinal perforation or stage 2 necrotizing enterocolitis before tolerating fortified feeds, or at the discretion of the study investigator. All study infants received standard fortification by the time they were tolerating 100 mL/kg/d of enteral feeds. Once feeds were established and tolerated, milk fed to infants randomized to the targeted fortification group was analyzed and fortified to a target level of 20 kcal/oz if analysis indicated caloric content < 20 kcal/oz. The primary outcomes of this study were growth velocity (weight, length, head circumference) and the amount of donor HM‐derived fortifier used.
Hair 2016 (secondary analysis of Hair 2014)
This report presented secondary analysis of outcomes from Hair 2014, analyzing the effect of targeted fortification using a human milk‐derived cream supplement on the growth velocity of preterm infants. Analysis of data in this publication pertained to clinical outcomes and length of stay. Inclusion and exclusion criteria and targeted fortification protocols were as described in Hair 2014. Primary outcomes of this secondary analysis included comorbidities collected in the original study: medically or surgically managed patent ductus arteriosus, culture‐proven late‐onset sepsis, ≥ stage 2 necrotizing enterocolitis, and bronchopulmonary dysplasia (BPD), as well as length of stay and postmenstrual age at discharge. Study investigators also performed a subgroup analysis of infants with BPD comparing clinical outcomes, mortality, length of stay, and postmenstrual age at discharge for study infants who received standard fortification versus infants who received targeted fortification.
Study authors performed a single‐center RCT in Turkey comparing the effects of adjustable, targeted, and standard fortification on early growth of very low birth weight infants. This study took place between January 2015 and December 2015. Infants were included if birth weight was < 1500 grams and gestational age < 32 weeks, and if they were fed only human milk. Infants with significant congenital anomalies, respiratory support requirements, sepsis, or a history of cardiac or intestinal surgery, or who received any formula feedings, were excluded. All study infants received fortification according to standard practice when milk intake reached 100 mL/kg/d and were randomized using computer‐generated sequential numbers when full enteral feeds reached a volume of 160 mL/kg/d. Infants in the adjustable fortification group had protein supplement (Aptamil, Milupa) added or reduced based on twice‐weekly BUN levels. In the targeted fortification group, milk analysis was performed with mid‐infrared spectrophotometry (Miris), and protein supplement was added to achieve a target protein intake of 3.5 to 4.5 g/kg. The primary outcome of this study was the change in percentile of body weight, head circumference, and height before and four weeks after initiation of fortification.
Moro and colleagues performed a single‐center RCT in Italy. Infants were included from the study if their birth weight was between 900 and 1500 grams, and if they were no longer receiving intravenous fluids. Exclusion criteria included major congenital abnormalities and systemic illness. In the standard fortification arm of the study, infants were fed breast milk fortified with bovine milk protein‐based fortifier in a fixed amount, 3.5 g/100 mL. Infants in the adjustable arm received fortified milk with the same bovine milk protein‐based fortifier, but the amount of fortifier was based on corrected serum urea nitrogen levels. The primary objective of this study was to test a novel fortification in comparison with standard fortification practices, hypothesizing that adjustable fortification would lead to higher protein intake, which would result in more rapid growth. A secondary objective of this study was to evaluate a new bovine milk‐protein‐based fortifier in comparison with standard human milk protein concentrate.
This single‐center RCT was performed in Canada. Infants were included from the study if they were < 30 weeks' gestational age with an anticipated length of stay > 21 days and were receiving fortified breast milk. Infants were excluded if they had gastrointestinal perforation, major congenital anomalies, stage 2 necrotizing enterocolitis, abdominal surgery, or gram‐negative sepsis. Randomization was stratified by gestational age > or < 28 weeks, with variable block sizes of 2, 4, and 6. Standard fortification (Enfamil HMF; Mead Johnson, Cleveland, OH, USA) was introduced at an enteral feeding volume of 120 mL/kg/d for all study infants. Infants randomized to the standard fortification arm received 1 package of HMF/25 mL, and those receiving donor human milk received an additional 0.4 grams of whey protein powder (Beneprotein; Nestlé, Vevey, Switzerland)/100 mL. In the targeted fortification arm, macronutrients were measured using a near‐infrared milk analyzer (SpectraStar; Unity Scientific, Brookfield, CT, USA). Fortification aimed to achieve milk contents according to European Society of Paediatric Gastroenterology, Hepatology and Nutrition (ESPGHAN) recommended intakes. The primary outcome of this study was weight gain velocity (g/kg/d) during the first 21 days of intervention. Secondary outcomes were macronutrient intake, nutritive efficiency, weight, head circumference, length, body composition, major morbidities of prematurity, and weekly clinical chemistries.
Excluded studies
We excluded six studies (reported in seven publications).
Boehm and colleagues investigated the effects of different types of protein ‐ a human milk protein, bovine whey protein hydrolysate, and a mixture of bovine proteins, peptides, and amino acids ‐ on the growth and plasma amino acid profiles of low birth weight infants. Researchers collected data on growth rates, as well as on serum preprandial essential amino acids and urea and prealbumin concentrations. We excluded this study because fortification arms were not designed to provide individualized fortification based on infant laboratory values or human milk analysis.
This RCT performed by Kanmaz and colleagues at a single‐center NICU in Turkey enrolled infants at ≤ 32 weeks' gestation and with birth weight ≤ 1500 grams between November 2010 and August 2011. Researchers randomized infants to three groups.
A standard fortification group, with estimated protein intake of 3 g/kg/d.
A moderate fortification group, with estimated protein intake of 3.3 g/kg/d.
An aggressive fortification group, with estimated protein intake of 3.6 g/kg/d.
Objectives of this study were to assess the effects of varying amounts of protein fortification on short‐term growth and feeding intolerance, and metabolic effects based on blood urea nitrogen, calcium, phosphorus, and alkaline phosphatase levels. We excluded this study because investigators used a blind‐fortification approach, assigning protein fortification in three fixed amounts. Fortification in study groups was not individualized to study infants based on laboratory values or human milk analysis.
These reports were the result of a single‐center, randomized controlled, partially blinded trial performed in Germany between October 2012 and October 2014. Included infants were ≤ 32 weeks' gestation and had birth weight ≤ 1500 grams. Infants were randomized to one of three groups.
A lower‐protein, standard fortification group administered 5 g/100 mL of milk fortifier (FM‐85, Nestlé Nutrition) to yield an estimated 3.5 g/kg/d of protein.
A higher‐protein group administered a fixed amount of investigational multi‐component fortifier aimed at achieving a goal protein of 4.5 g/kg/d.
A higher‐protein group that received individualized fortification on top of standard fortification based on analysis of human milk macronutrient concentration to achieve protein content of 4 to 4.5 g/kg/d based on birth weight above or below 1500 grams. We excluded these studies because included infants may not have received an exclusive human milk diet. Breast milk feeding was supplemented with standard preterm formula (Beba preterm infant formula, Nestlé Nutrition) if the breast milk supply of the infant’s mother did not meet the infant’s enteral feeding volume.
Maas 2017: the primary outcome of the original study was weight gain (g/kg/d) measured from birth to end of intervention. Secondary outcomes were head circumference from birth to end of intervention; weight, length, and head circumference at discharge; and lower leg longitudinal growth (mm/week).
Mathes 2018: this report was the result of analysis of secondary outcomes of the RCT originally reported by Maas 2017. The aim of this arm of the study was to determine the impact of increased enteral protein intake on plasma urea concentration and urine urea/creatinine ratio and to determine if the urine urea/creatinine ratio represents plasma urea concentration and the enteral protein supply. Secondary outcomes reported in this publication included analysis of urine urea/creatinine ratio and plasma urea concentration.
McLeod and colleagues reported on a randomized controlled, single‐center study out of Western Australia conducted between January 2009 and June 2009. Infants at < 30 weeks' gestation were included in the study if they had no congenital anomalies, if mothers planned to provide human milk, and if living remotely would not prevent participation in all assessments. Infants were randomized to one of two groups.
Routine practice to provide fortification based on assumed composition targeting 3.8 to 4.4 grams of protein/kg/d and 130 to 150 kcal/kg/d.
Intervention group providing individualized fortification based on measured milk composition analyzed with mid‐infrared spectrophotometry (Miris).
The goal of this study was to test the hypothesis that growth and body composition of preterm infants better match intrauterine growth if fortification is individualized based on human milk analysis. We excluded this study because an intervention infant did not receive an exclusive human milk diet and was transitioned to preterm formula due to lack of donor human milk.
This prospective interventional single‐center study was performed in Italy between October 2014 and March 2015. Infants at < 32 weeks' gestation, weighing < 1500 grams, and at ≥ 10th percentile of weight based on Fenton growth who were receiving a diet consisting exclusively of human milk were eligible for inclusion in this study. A cohort of infants treated in the same NICU during the six months before study intervention who fulfilled inclusion criteria for the study and received standard fortification according to nursery feeding guidelines was considered the control group. Analysis of human milk for the intervention group was performed using mid‐infrared spectroscopy (Miris). Individualized fortification was targeted to achieve fat, protein, and carbohydrate levels recommended by ESPGHAN. The primary aim of this study was to determine whether targeted breast milk fortification improved growth among very low birth weight infants. We excluded this study because it was not a randomized or quasi‐randomized controlled trial.
Quan and colleagues completed a prospective, randomized controlled, single‐center study between September 2012 and August 2016. Infants were included in this study if gestational age was < 34 weeks, birth weight was between 800 and 1800 grams, and infants received a diet exclusively of human milk defined as own mother’s milk comprising ≥ 80% of total enteral feeding. Infants who received ≤ 80% of mother’s own milk were excluded from the study. For infants in the individualized fortification group, the macronutrient composition of human milk was measured using a mid‐infrared milk analyzer (Miris), and blood urea nitrogen levels were evaluated twice weekly along with measurement of body weight. Based on protein level determined from milk analysis and blood urea nitrogen levels, fortifier was added via a defined level‐based system. Primary outcomes were protein intake from parenteral nutrition and enteral nutrition and weight gain velocity per week and throughout the study. Secondary outcomes were weekly protein intake, protein/energy ratio, growth Z scores, length of stay, and time for body weight to reach 1800 to 2000 grams. We excluded this study because infants did not receive an exclusive human milk diet; up to 20% of enteral feeding volume could comprise formula, as donor human milk was not available in the investigators’ NICU.
Risk of bias in included studies
A "Risk of bias" graph is provided in Figure 2 and a summary is provided in Figure 3.
2.

Risk of bias graph: review authors' judgements about each risk of bias item presented as percentages across all included studies.
3.

Risk of bias summary: review authors' judgements about each risk of bias item for each included study.
Allocation
Agakidou 2019 and Kadioglu Simsek 2019 allocated participants using a computer‐generated randomization list; Arslanoglu 2006, Bulut 2019, Moro 1995, and Rochow 2020 used sealed envelopes. In Hair 2014, the details of random sequence generation were unclear.
Blinding
Agakidou 2019 did not provide details on allocation concealment, although outcome assessment appeared adequately blinded. Bulut 2019 reported that it was not possible to blind investigators to study group assignment. Arslanoglu 2006 also reported that investigators were not blinded to study group assignment but noted that caregivers responsible for infants’ care and feeding were not involved in the investigation. Hair 2014 was unable to blind investigators to group assignment at one of two sites. Kadioglu Simsek 2019 and Moro 1995 did not provide details regarding blinding of personnel, and Arslanoglu 2006, Hair 2014, and Moro 1995 did not provide details regarding blinding of outcome assessment.
Incomplete outcome data
In Bulut 2019, seven deaths and four cases of NEC occurred, leading to exclusion "during the course of the study"; however it is unclear if these occurred before or during the study intervention; if the latter, it is unclear if these occurred equally in the two study arms.
In Hair 2014, three enrolled infants were excluded from the analyses presented in Hair 2016 (secondary analysis of Hair 2014) that were not excluded from the intention‐to‐treat analysis in the Hair 2014 initial report. It is unclear whether these post‐hoc exclusions affected the statistical significance of findings of the Hair 2016 report, or whether this was a factor in their exclusion.
Attrition was unbalanced among the three groups in Moro 1995 (0/14, 2/14, and 4/14), and data for withdrawals were not reported.
In Rochow 2020, 76 randomized infants were excluded before the study intervention was initiated due to early transfer before completing 14 study days, deviation from the feeding protocol, or use of steroids or diuretics; exclusions occurred equally in the two study arms. Clinical outcomes, but not growth outcomes, were reported for excluded infants.
Selective reporting
None of the included studies revealed selective outcome reporting.
Other potential sources of bias
In Hair 2014, the study sponsor, Prolacta Bioscience, provided the product for the study and assisted in data analysis. Two study authors received financial support and speaker honoraria from Prolacta Bioscience, and two other study authors were employees of Prolacta Bioscience.
Kadioglu Simsek 2019 did not provide case definitions for clinical sepsis, NEC, BPD, ROP, or osteopenia.
Effects of interventions
See: Table 1; Table 2; Table 3; Table 4
Comparison 1. Individualized (targeted or adjustable) versus standard fortification
See Table 1.
Six of the included studies measured the primary outcome of growth velocity of weight (Agakidou 2019; Arslanoglu 2006; Hair 2014; Kadioglu Simsek 2019; Moro 1995; Rochow 2020), and five of those studies measured growth velocity of length and head circumference at end of the intervention (Agakidou 2019; Arslanoglu 2006; Hair 2014; Kadioglu Simsek 2019; Moro 1995). In addition, one study that investigated this comparison collected data on retinopathy of prematurity and osteopenia (Kadioglu Simsek 2019), and four studies included bronchopulmonary dysplasia, defined as respiratory support at 36 weeks' postmenstrual age (PMA) (Agakidou 2019; Hair 2016 [secondary analysis of Hair 2014]; Kadioglu Simsek 2019; Rochow 2020). One study investigated targeted, adjustable, and standard fortification in three study arms (Kadioglu Simsek 2019); the study arms were combined as described earlier in Methods. The Hair 2016 report (secondary analysis of Hair 2014) was included in Analysis 1.4, and no other outcomes were included in this comparison because it included only the subgroup of infants with BPD from the prior study in 2014, and therefore could be included only in the BPD analysis for this comparison.
1.4. Analysis.

Comparison 1: Targeted or adjustable vs standard, Outcome 4: Bronchopulmonary dysplasia
Growth velocity, weight in g/kg/d, end of intervention
Among the six included studies, there was an estimated mean difference of 1.88 (95% confidence interval [CI] 1.26 to 2.50; 345 participants) favoring individualized fortification for improved weight growth velocity. The results show high heterogeneity (I² = 87%). We assessed the certainty of evidence as moderate for this outcome, downgrading by one level because of inconsistency due to high heterogeneity in the estimate of effect (Analysis 1.1).
1.1. Analysis.

Comparison 1: Targeted or adjustable vs standard, Outcome 1: Growth velocity, weight, g/kg/d, end of intervention
Growth velocity, length in mm/d, end of intervention
The estimated mean difference for length growth velocity was 0.43 (95% CI 0.32 to 0.53; 5 studies, 242 participants) favoring individualized fortification for improved length growth velocity. The results show high heterogeneity (I² = 88%). We assessed the certainty of evidence as low for this outcome, downgrading by one level for inconsistency due to high heterogeneity in estimate of effect, and by one level for imprecision due to wide confidence intervals that included both clinically significant and clinically insignificant effects (Analysis 1.2).
1.2. Analysis.

Comparison 1: Targeted or adjustable vs standard, Outcome 2: Growth velocity, length, mm/d, end of intervention
Growth velocity, head circumference in mm/d, end of intervention
The estimated mean difference for head circumference growth velocity was 0.14 (95% CI 0.06 to 0.23; 5 studies, 242 participants), again favoring individualized fortification. The results show high heterogeneity (I² = 75%). We assessed the certainty of evidence as low for this outcome, downgrading by one level for inconsistency due to high heterogeneity in estimate of effect, and by one level for imprecision due to wide confidence intervals that include both clinically significant and clinically insignificant effects (Analysis 1.3).
1.3. Analysis.

Comparison 1: Targeted or adjustable vs standard, Outcome 3: Growth velocity, head circumference, mm/d, end of intervention
Bronchopulmonary dysplasia
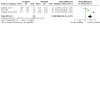
There appeared to be no difference in bronchopulmonary dysplasia, with an estimated risk ratio of 0.89 (95% CI 0.71 to 1.12; 4 studies, 391 participants). We assessed the certainty of evidence as very low for this outcome, downgrading by two levels for imprecision due to total enrollment insufficient for 50% power to detect 20% change compared to control, by one level for inconsistency due to variation among studies in case definition of the outcome, and by one level for imprecision due to wide confidence intervals that included both clinically significant and clinically insignificant effects (Analysis 1.4).
Retinopathy of prematurity
There appeared to be no difference in retinopathy of prematurity, with an estimated risk ratio of 0.79 (95% CI 0.36 to 1.72; 1 study, 60 participants). We assessed the certainty of evidence as very low for this outcome, downgrading by one level because of imprecision due to wide confidence intervals that include both clinically significant and clinically insignificant effects, and by two levels for imprecision due to total enrollment insufficient for 50% power to detect 20% change compared to control (Analysis 1.5).
1.5. Analysis.

Comparison 1: Targeted or adjustable vs standard, Outcome 5: Retinopathy of prematurity, any
Osteopenia of prematurity
Osteopenia of prematurity did not appear significantly different between groups, with an estimated risk ratio of 0.86 (95% CI 0.40 to 1.84; 1 study, 60 participants). We assessed the certainty of evidence as very low for this outcome, downgrading by one level for imprecision due to wide confidence intervals that include both clinically significant and clinically insignificant effects, by two levels for imprecision due to total enrollment insufficient for 50% power to detect 20% change compared to control, and by one level for indirectness due to use of the surrogate outcome of osteopenia rather than patient‐important outcomes of fracture (Analysis 1.6).
1.6. Analysis.

Comparison 1: Targeted or adjustable vs standard, Outcome 6: Osteopenia
Comparison 2. Targeted versus standard fortification
See Table 2.
Four studies compared targeted fortification to standard fortification and provided data on growth velocity of weight at the end of the intervention (Agakidou 2019; Hair 2014; Kadioglu Simsek 2019; Rochow 2020). Three of these studies included data on growth velocity of length and growth velocity of head circumference at the end of the intervention (Agakidou 2019; Hair 2014; Kadioglu Simsek 2019). Many of the outcomes in this comparison were collected in only one study, although different studies collected different outcomes (thus all of the data were not derived from the same study). One study collected growth parameter data at 40 weeks' PMA, and at 3, 6, 9, and 12 months' corrected age (CA) (Agakidou 2019). That same study also investigated change in body mass index (BMI) at those respective time points. In‐hospital mortality was compared in three studies (Agakidou 2019; Hair 2014; Rochow 2020), data on necrotizing enterocolitis and culture‐proven late‐onset bacterial sepsis were collected in two studies (Hair 2014; Rochow 2020), and BPD was analyzed in four studies (Agakidou 2019; Hair 2016 [secondary analysis of Hair 2014]; Kadioglu Simsek 2019; Rochow 2020). There was also a subgroup analysis of infants with BPD that analyzed the following outcomes: in‐hospital mortality, length of hospital stay, and PMA at discharge (Hair 2016, from a prior study Hair 2014).
Growth velocity, weight in g/kg/d, end of intervention
The estimated mean difference was 1.87 g/kg/d (95% CI 1.15 to 2.58; 4 studies, 269 participants), suggesting that targeted fortification yields improved growth velocity of weight when compared to standard fortification. The results show high heterogeneity (I² = 91%). We assessed the certainty of evidence as moderate for this outcome, downgrading by one level for inconsistency due to high heterogeneity in the estimate of effect (I² ≥ 75%) (Analysis 2.1).
2.1. Analysis.

Comparison 2: Targeted vs standard fortification, Outcome 1: Growth velocity, weight, g/kg/d, end of intervention
Growth velocity, weight in g/kg/d, start of fortification to 40 weeks' PMA
Only one study collected data on growth velocity of weight from start of intervention to 40 weeks' PMA. The estimated mean difference was ‐0.03 (95% CI ‐1.19 to 1.13; 46 participants) (Analysis 2.2).
2.2. Analysis.
Comparison 2: Targeted vs standard fortification, Outcome 2: Growth velocity, weight, g/kg/d, start of fortification to 40 weeks' PMA
Growth velocity, weight in g/kg/d, start of fortification to three months' CA
The same study collected growth velocity of weight data from start of intervention to three months' CA. The estimated mean difference was ‐0.31 (95% CI ‐1.11 to 0.49; 46 participants) (Analysis 2.3).
2.3. Analysis.
Comparison 2: Targeted vs standard fortification, Outcome 3: Growth velocity, weight, g/kg/d, start of fortification to 3 months' CA
Growth velocity, weight in g/kg/d, start of fortification to six months' CA
The same study analyzed growth velocity of weight data from start of intervention to six months' CA. The estimated mean difference was 0.09 (95% CI ‐0.31 to 0.49; 45 participants) (Analysis 2.4).
2.4. Analysis.

Comparison 2: Targeted vs standard fortification, Outcome 4: Growth velocity, weight, g/kg/d, start of fortification to 6 months' CA
Growth velocity, weight in g/kg/d, start of fortification to 12 months' CA
The same study analyzed growth velocity of weight data from start of intervention to 12 months' CA. The estimated mean difference was ‐0.04. (95% CI ‐0.36 to 0.28; 45 participants) (Analysis 2.5).
2.5. Analysis.

Comparison 2: Targeted vs standard fortification, Outcome 5: Growth velocity, weight, g/kg/d, start of fortification to 12 months' CA
Growth velocity, length in mm/d, end of intervention
There was an estimated mean difference of 0.45 (95% CI 0.32 to 0.57, 3 studies, 166 participants), suggesting that growth velocity of length at the end of the intervention is positively affected in the targeted fortification group compared to the standard fortification group. Heterogeneity was high (I² = 91%). We assessed the certainty of evidence as low for this outcome, downgrading by one level for inconsistency due to high heterogeneity in estimate of effect (I² ≥ 75), and by one level for imprecision due to wide confidence intervals that include both clinically significant and clinically insignificant effects (Analysis 2.6).
2.6. Analysis.
Comparison 2: Targeted vs standard fortification, Outcome 6: Growth velocity, length, mm/d, end of intervention
Growth velocity, length in mm/d, start of fortification to 40 weeks' PMA
Only one study collected data on growth velocity of length from start of intervention to 40 weeks' PMA. The estimated mean difference was 0.02 (95% CI ‐0.16 to 0.20; 48 participants) (Analysis 2.7).
2.7. Analysis.

Comparison 2: Targeted vs standard fortification, Outcome 7: Growth velocity, length, mm/d, start of fortification to 40 weeks' PMA
Growth velocity, length in mm/d, start of fortification to three months' CA
The same study collected growth velocity of length data from start of intervention to three months' CA. The estimated mean difference was ‐0.02 (95% CI ‐0.12 to 0.08; 46 participants) (Analysis 2.8).
2.8. Analysis.

Comparison 2: Targeted vs standard fortification, Outcome 8: Growth velocity, length, mm/d, start of fortification to 3 months' CA
Growth velocity, length in mm/d, start of fortification to six months' CA
The same study collected growth velocity of length data from start of intervention to six months' CA. The estimated mean difference was 0.07 (95% CI 0.00 to 0.14; 45 participants) (Analysis 2.9).
2.9. Analysis.

Comparison 2: Targeted vs standard fortification, Outcome 9: Growth velocity, length, mm/d, start of fortification to 6 months' CA
Growth velocity, length in mm/d, start of fortification to 12 months' CA
The same study collected growth velocity of length data from start of intervention to 12 months' CA. The estimated mean difference was 0.00 (95% CI ‐0.07 to 0.07; 44 participants) (Analysis 2.10).
2.10. Analysis.

Comparison 2: Targeted vs standard fortification, Outcome 10: Growth velocity, length, mm/d, start of fortification to 12 months' CA
Growth velocity, head circumference in mm/d, end of intervention
Head circumference growth velocity was not statistically significantly different between fortification groups, with an estimated mean difference of 0.08 (95% CI ‐0.01 to 0.18; 3 studies, 166 participants). The results show high heterogeneity (I² = 79%). We assessed the certainty of evidence as low for this outcome, downgrading by one level for inconsistency due to heterogeneity in estimate of effect, and by one level for imprecision due to wide confidence intervals that include both clinically significant and clinically insignificant effects (Analysis 2.11).
2.11. Analysis.

Comparison 2: Targeted vs standard fortification, Outcome 11: Growth velocity, head circumference, mm/d, end of intervention
Growth velocity, head circumference in mm/d, start of fortification to 40 weeks' PMA
Only one study collected data on growth velocity of head circumference from start of intervention to 40 weeks' PMA. The estimated mean difference was ‐0.07 (95% CI ‐0.16 to 0.02; 48 participants) (Analysis 2.12).
2.12. Analysis.

Comparison 2: Targeted vs standard fortification, Outcome 12: Growth velocity, head circumference, mm/d, start of fortification to 40 weeks' PMA
Growth velocity, head circumference in mm/d, start of fortification to three months' CA
The same study collected growth velocity of head circumference data from start of intervention to three months' CA. The estimated mean difference was 0.00 (95% CI ‐0.06 to 0.06; 46 participants) (Analysis 2.13).
2.13. Analysis.

Comparison 2: Targeted vs standard fortification, Outcome 13: Growth velocity, head circumference, mm/d, start of fortification to 3 months' CA
Growth velocity, head circumference in mm/d, start of fortification to six months' CA
The same study collected growth velocity of head circumference data from start of intervention to six months' CA. The estimated mean difference was 0.01 (95% CI ‐0.03 to 0.05; 45 participants) (Analysis 2.14).
2.14. Analysis.

Comparison 2: Targeted vs standard fortification, Outcome 14: Growth velocity, head circumference, mm/d, start of fortification to 6 months' CA
Growth velocity, head circumference in mm/d, start of fortification to 12 months' CA
The same study collected growth velocity of head circumference data from start of intervention to 12 months' CA. The estimated mean difference was ‐0.01 (95% CI ‐0.04 to 0.02; 45 participants) (Analysis 2.15).
2.15. Analysis.

Comparison 2: Targeted vs standard fortification, Outcome 15: Growth velocity, head circumference, mm/d, start of fortification to 12 months' CA
Change in BMI, end of intervention
The same study collected change in BMI data at end of intervention. The estimated mean difference was ‐0.08 (95% CI ‐0.28 to 0.12; 48 participants) (Analysis 2.16).
2.16. Analysis.

Comparison 2: Targeted vs standard fortification, Outcome 16: Change in BMI, end of intervention
Change in BMI, start of fortification to 40 weeks' PMA
The same study collected change in BMI data from start of fortification to 40 weeks' PMA. The estimated mean difference was ‐0.05 (95% CI ‐0.18 to 0.08; 48 participants) (Analysis 2.17).
2.17. Analysis.

Comparison 2: Targeted vs standard fortification, Outcome 17: Change in BMI, start of fortification to 40 weeks' PMA
Change in BMI, start of fortification to three months' CA
The same study collected change in BMI data from start of fortification to three months' CA. The estimated mean difference was ‐0.04 (95% CI ‐0.11 to 0.03; 46 participants) (Analysis 2.18).
2.18. Analysis.

Comparison 2: Targeted vs standard fortification, Outcome 18: Change in BMI, start of fortification to 3 months' CA
Change in BMI, start of fortification to six months' CA
The same study collected change in BMI data from start of fortification to six months' CA. The estimated mean difference was ‐0.02 (95% CI ‐0.05 to 0.01; 45 participants) (Analysis 2.19).
2.19. Analysis.

Comparison 2: Targeted vs standard fortification, Outcome 19: Change in BMI, start of fortification to 6 months' CA
Change in BMI, start of fortification to 12 months' CA
The same study collected change in BMI data from start of fortification to 12 months' CA. The estimated mean difference was ‐0.02 (95% CI ‐0.05 to 0.01; 44 participants) (Analysis 2.20).
2.20. Analysis.

Comparison 2: Targeted vs standard fortification, Outcome 20: Change in BMI, start of fortification to 12 months' CA
Length of hospital stay in days
Length of hospital stay in days was collected in one study, with an estimated mean difference of ‐12.00 days (95% CI ‐26.38 to 2.38; 75 participants). We assessed the certainty of evidence as very low for this outcome, downgrading by one level due to risk of bias, and by two levels for imprecision due to total enrollment insufficient for 50% power to detect 20% change compared to control (Analysis 2.21).
2.21. Analysis.

Comparison 2: Targeted vs standard fortification, Outcome 21: Length of hospital stay, days
Postmenstrual age at discharge in weeks
Postmenstrual age at discharge in weeks was collected in one study, with an estimated mean difference of ‐1.70 (95% CI ‐3.47 to 0.07; 75 participants). We downgraded the evidence by one level for imprecision due to wide confidence intervals that include both clinically significant and clinically insignificant effects, and by two levels for imprecision due to total enrollment insufficient for 50% power to detect 20% change compared to control (Analysis 2.22).
2.22. Analysis.

Comparison 2: Targeted vs standard fortification, Outcome 22: Postmenstrual age at discharge, weeks
In‐hospital mortality
The estimated risk ratio for in‐hospital mortality was 0.14 (95% CI 0.02 to 1.14; 3 studies, 334 participants), suggesting no differences between fortification groups. We assessed the certainty of evidence as very low for this outcome, downgrading by one level for inconsistency due to variation among studies in fortification procedures, and by two levels for imprecision due to wide confidence intervals that include both clinically significant and clinically insignificant effects and due to the small number of events (Analysis 2.23).
2.23. Analysis.

Comparison 2: Targeted vs standard fortification, Outcome 23: In‐hospital mortality
Necrotizing enterocolitis
The estimated risk ratio for necrotizing enterocolitis was 0.40 (95% CI 0.08 to 1.99; 2 studies, 257 participants), revealing no differences between fortification groups. We assessed the certainty of evidence as very low for this outcome, downgrading by one level for imprecision due to wide confidence intervals that include both clinically significant and clinically insignificant effects, and by two levels for imprecision due to total enrollment insufficient for 50% power to detect 20% change compared to control (Analysis 2.24).
2.24. Analysis.

Comparison 2: Targeted vs standard fortification, Outcome 24: Necrotizing enterocolitis
Culture‐proven late‐onset bacterial sepsis
The estimated risk ratio for culture‐proven late‐onset bacterial sepsis was 1.29 (95% CI 0.76 to 2.17; 2 studies, 257 participants), revealing no differences between groups. We assessed the certainty of evidence as low for this outcome, downgrading by one level for imprecision due to wide confidence intervals that include both clinically significant and clinically insignificant effects, and by two levels for imprecision due to total enrollment insufficient for 50% power to detect 20% change compared to control (Analysis 2.25).
2.25. Analysis.

Comparison 2: Targeted vs standard fortification, Outcome 25: Culture‐proven late‐onset bacterial sepsis
Retinopathy of prematurity, any
Only one study collected data on retinopathy of prematurity. The risk ratio was 1.00 (95% CI 0.43 to 2.33; 40 participants) (Analysis 2.26).
2.26. Analysis.

Comparison 2: Targeted vs standard fortification, Outcome 26: Retinopathy of prematurity, any
Osteopenia of prematurity
Only one study collected data on osteopenia of prematurity. The risk ratio was 0.86 (95% CI 0.35 to 2.10; 40 participants) (Analysis 2.27).
2.27. Analysis.

Comparison 2: Targeted vs standard fortification, Outcome 27: Osteopenia
Bronchopulmonary dysplasia
The estimated risk ratio for bronchopulmonary dysplasia was 0.88 (95% CI 0.70 to 1.11; 4 studies, 371 participants), revealing no differences between fortification groups (Analysis 2.28).
2.28. Analysis.

Comparison 2: Targeted vs standard fortification, Outcome 28: Bronchopulmonary dysplasia
BPD subgroup – in‐hospital mortality
In a subgroup analysis from one prior study, in‐hospital mortality of patients with BPD was analyzed in the two fortification groups for a total of 21 participants, but the odds ratio could not be estimated (Analysis 2.29).
2.29. Analysis.

Comparison 2: Targeted vs standard fortification, Outcome 29: BPD subgroup ‐ in‐hospital mortality
BPD subgroup – length of hospital stay in days
That same subgroup analysis collected data on in‐hospital mortality. The estimated mean difference was ‐17.00 (95% CI ‐48.53 to 14.53; 21 participants) (Analysis 2.30).
2.30. Analysis.

Comparison 2: Targeted vs standard fortification, Outcome 30: BPD subgroup ‐ length of hospital stay, days
BPD subgroup – postmenstrual age at discharge in weeks
That same subgroup analysis collected data on PMA at discharge. The mean difference was ‐2.90 (95% CI ‐6.78 to 0.98; 21 participants) (Analysis 2.31).
2.31. Analysis.

Comparison 2: Targeted vs standard fortification, Outcome 31: BPD subgroup ‐ postmenstrual age at discharge, weeks
Comparison 3. Adjustable versus standard fortification
See Table 3.
Three studies provided end of intervention outcome data for growth velocity outcomes, weight in g/kg/d, length in mm/d, and head circumference in mm/d (Arslanoglu 2006; Kadioglu Simsek 2019; Moro 1995). Two studies provided end of intervention outcome data for the outcome growth velocity in weight g/d (Arslanoglu 2006; Moro 1995). One study provided end of intervention data for any retinopathy of prematurity, osteopenia, and bronchopulmonary dysplasia (Kadioglu Simsek 2019).
Growth velocity, weight in g/kg/d, end of intervention
The estimated mean difference for the outcome of growth velocity and weight at end of intervention was 2.86 (95% CI 1.69 to 4.03; 3 studies, 96 participants), favoring adjustable over standard fortification for improved weight growth velocity at end of intervention. Heterogeneity between studies was high (I² = 94%). We assessed the certainty of evidence as moderate for this outcome, downgrading by one level for inconsistency due to high heterogeneity in the estimate of effect (I² ≥ 75%) (Analysis 3.1).
3.1. Analysis.

Comparison 3: Adjustable vs standard fortification, Outcome 1: Growth velocity, weight, g/kg/d, end of intervention
Growth velocity, length in mm/d, end of intervention
Adjustable fortification improved linear growth velocity in preterm infants when compared to standard fortification practices. The estimated mean difference for growth velocity of length at end of intervention was 0.54 (95% CI 0.38 to 0.70; 3 studies, 96 participants). Heterogeneity between studies was high (I² = 92%). We assessed the certainty of evidence as moderate for this outcome, downgrading by one level for inconsistency due to high heterogeneity in the estimate of effect (I² ≥ 75%) (Analysis 3.2).
3.2. Analysis.

Comparison 3: Adjustable vs standard fortification, Outcome 2: Growth velocity, length, mm/d, end of intervention
Growth velocity, head circumference in mm/d, end of intervention
Adjustable fortification improved velocity of head growth in preterm infants when compared to standard fortification practices. The estimated mean difference for growth velocity of head circumference at end of intervention was 0.36 (95% CI 0.21 to 0.50; 3 studies, 96 participants). Heterogeneity between studies was moderate (I² = 50%). We assessed the certainty of evidence as high for this outcome (Analysis 3.3).
3.3. Analysis.

Comparison 3: Adjustable vs standard fortification, Outcome 3: Growth velocity, head circumference, mm/d, end of intervention
Growth velocity, weight in g/d, end of intervention
The estimated mean difference for growth velocity of weight in g/d at end of intervention in preterm infants was 3.26 (95% CI 1.17 to 5.34; 2 studies, 56 participants), favoring adjustable over standard fortification for improved weight growth velocity at end of intervention (Analysis 3.4).
3.4. Analysis.

Comparison 3: Adjustable vs standard fortification, Outcome 4: Growth velocity, weight, g/d, end of intervention
Retinopathy of prematurity, any
The estimated risk ratio for retinopathy of prematurity was 0.57 (95% CI 0.20 to 1.65; 1 study, 40 participants) (Analysis 3.5).
3.5. Analysis.

Comparison 3: Adjustable vs standard fortification, Outcome 5: Retinopathy of prematurity, any
Osteopenia
The estimated risk ratio for osteopenia was 1.00 (95% CI 0.39 to 2.58; 1 study, 40 participants) (Analysis 3.6).
3.6. Analysis.

Comparison 3: Adjustable vs standard fortification, Outcome 6: Osteopenia
Bronchopulmonary dysplasia
The estimated risk ratio for bronchopulmonary dysplasia was 1.20 (95% CI 0.44 to 3.30; 1 study, 40 participants) (Analysis 3.7).
3.7. Analysis.

Comparison 3: Adjustable vs standard fortification, Outcome 7: Bronchopulmonary dysplasia
Comparison 4. Targeted versus adjustable fortification
See Table 4.
Two studies provided end of intervention outcome data for growth velocity, weight in g/kg/d, length in mm/d, and head circumference in mm/d (Bulut 2019; Kadioglu Simsek 2019). One study provided end of intervention data for the following outcomes: any retinopathy of prematurity, osteopenia, and bronchopulmonary dysplasia (Kadioglu Simsek 2019).
Growth velocity, weight in g/kg/d, end of intervention
The estimated mean difference for growth velocity of weight at end of intervention was 2.49 (95% CI 0.44 to 4.54; 2 studies, 72 participants), suggesting no difference in velocity of weight gain for infants who received targeted fortification compared to adjustable fortification. We assessed the certainty of evidence as moderate for this outcome, downgrading by one level for imprecision due to wide confidence intervals that include both clinically significant benefit and clinically insignificant effects (Analysis 4.1).
4.1. Analysis.

Comparison 4: Targeted vs adjustable fortification, Outcome 1: Growth velocity, weight, g/kg/d, end of intervention
Growth velocity, length in mm/d, end of intervention
The estimated mean difference for growth velocity of length at end of intervention was 0.07 (95% CI ‐0.06 to 0.20; 2 studies, 72 participants). This suggests no difference in linear growth velocity when the effects of targeted practices were compared with the effects of adjustable fortification practices. We assessed the certainty of evidence as low for this outcome, downgrading by two levels for imprecision due to total enrollment insufficient for 50% power to detect a 20% change compared to control (Analysis 4.2).
4.2. Analysis.

Comparison 4: Targeted vs adjustable fortification, Outcome 2: Growth velocity, length, mm/d, end of intervention
Growth velocity, head circumference in mm/d, end of intervention
No difference in velocity of head growth was evident when effects of targeted practices were compared with effects of adjustable fortification practices. The estimated mean difference in growth velocity of head circumference in mm/d at end of intervention was 0.04 (95% CI ‐0.10 to 0.17; 2 studies, 72 participants). We assessed the certainty of evidence as low for this outcome, downgrading by two levels for imprecision due to total enrollment insufficient for 50% power to detect a 20% change compared to control (Analysis 4.3).
4.3. Analysis.

Comparison 4: Targeted vs adjustable fortification, Outcome 3: Growth velocity, head circumference, mm/d, end of intervention
Retinopathy of prematurity, any
The estimated risk ratio for retinopathy of prematurity was 1.75 (95% CI 0.61 to 5.05; 1 study, 40 participants) (Analysis 4.4).
4.4. Analysis.

Comparison 4: Targeted vs adjustable fortification, Outcome 4: Retinopathy of prematurity, any
Osteopenia
The estimated risk ratio for osteopenia was 1.00 (95% CI 0.39 to 2.58; 1 study, 40 participants) (Analysis 4.5).
4.5. Analysis.

Comparison 4: Targeted vs adjustable fortification, Outcome 5: Osteopenia
Bronchopulmonary dysplasia
The estimated risk ratio for bronchopulmonary dysplasia was 1.00 (95% CI 0.39 to 2.58; 1 study, 40 participants) (Analysis 4.6).
4.6. Analysis.

Comparison 4: Targeted vs adjustable fortification, Outcome 6: Bronchopulmonary dysplasia
Subgroup analyses and investigation of heterogeneity
None of the studies included in this review subgrouped their study cohort either by birth weight or by donor breast milk versus mother’s own milk; therefore planned subgroup analyses could not be performed.
Studies included in this review differed with respect to standard feeding and fortification regimens, pre‐intervention regimens, fortifiers used, duration of the intervention, reported outcomes, and timing of outcome measurements. This variation among studies was reflected in nine analyses that showed high heterogeneity in the estimate of effect. When inspection of forest plots suggested that one outlier study was a primary cause of heterogeneity, we performed a sensitivity analysis to assess the impact of this upon the result of excluding the outlier study.
Analysis 1.1: Kadioglu Simsek 2019 appeared prominent compared to other studies in its effects favoring individualized fortification. When this study was excluded, heterogeneity was decreased but the overall result of the analysis was not changed, continuing to significantly favor individualized fortification (mean difference [MD] 1.47, 95% confidence interval [CI] 0.84 to 2.11).
Analysis 1.2: Kadioglu Simsek 2019 appeared prominent compared to other studies in its effects favoring individualized fortification. When this study was excluded, heterogeneity was decreased and the overall result of the analysis continued to favor individualized fortification; however this finding was no longer statistically significant (MD 0.14, 95% CI 0.00 to 0.28; P = 0.06).
Analysis 1.3: no single study appeared to be an outlier compared to other studies.
Analysis 2.1: Kadioglu Simsek 2019 appeared prominent compared to other studies in its effects favoring individualized fortification. When this study was excluded, heterogeneity was decreased but the overall result of the analysis was not changed, continuing to significantly favor individualized fortification (MD 1.47, 95% CI 0.74 to 2.20).
Analysis 2.6: Kadioglu Simsek 2019 appeared prominent compared to other studies in its effects favoring individualized fortification. When this study was excluded, heterogeneity was decreased and the overall result of the analysis continued to favor individualized fortification; however this finding was no longer statistically significant (MD 0.16, 95% CI ‐0.01 to 0.34; P = 0.06).
Analysis 2.11: no single study appeared to be an outlier compared to other studies.
Analysis 3.1: Kadioglu Simsek 2019 appeared prominent compared to other studies in its effects favoring individualized fortification. When this study was excluded, heterogeneity was decreased but the overall result of the analysis was not changed, continuing to significantly favor individualized fortification (MD 1.48, 95% CI 0.22 to 2.75).
Analysis 3.2: Kadioglu Simsek 2019 appeared prominent compared to other studies in its effects favoring individualized fortification. When this study was excluded, heterogeneity was decreased and the overall result of the analysis continued to favor individualized fortification; however this finding was no longer statistically significant (MD 0.08, 95% CI ‐0.18 to 0.33; P = 0.55).
Analysis 4.3: no single study appeared to be an outlier compared to other studies.
Sensitivity analyses
We planned to perform sensitivity analyses by excluding unblinded trials and those without adequate treatment allocation concealment. Of seven included studies, one was assessed as having high risk of bias due to lack of allocation concealment (Bulut 2019), one due to lack of blinding of personnel (Hair 2014), and one due to lack of blinding of outcome assessment (Arslanoglu 2006). In sensitivity analyses, Analysis 1.3 (Comparison: Targeted or adjustable vs standard; Outcome: growth velocity, head circumference in mm/d, end of intervention) became non‐significant (MD 0.10, 95% CI ‐0.03 to 0.23; P = 0.13) with exclusion of Arslanoglu 2006 and Hair 2014. Analysis 3.4 (Comparison: Adjustable vs standard; Outcome: growth velocity, weight in g/d, end of intervention) became non‐significant (MD 2.30, 95% CI ‐0.23 to 4.83; P = 0.07) with exclusion of Arslanoglu 2006. Analysis 4.1 (Comparison: Targeted vs adjustable; Outcome: growth velocity, weight in g/kg/d, end of intervention) became non‐significant (MD 0.78, 95% CI ‐2.04 to 3.60; P = 0.59) with exclusion of Bulut 2019. Exclusion of Arslanoglu 2006, Bulut 2019, and Hair 2014 did not change the statistical significance of any other analyses when they were included. Hair 2014 was the only study reporting outcomes for Analyses 2.21, 2.22, 2.29, 2.30, and 2.31.
Discussion
Summary of main results
We assessed the comparison between individualized (adjustable and/or targeted) and standard fortification of human breast milk in very preterm infants using growth velocity of weight as the primary outcome. We included seven studies and eight publications in this analysis. Six studies provided data on the primary outcome and compared individualized versus standard fortification for a total of 345 participants, two reported data on the primary outcome and compared type of individualization (targeted versus adjustable) for a total of 72 participants, and one was a follow‐up analysis of a specific cohort of patients from one of the other studies, for a total of 21 participants. One study consisted of three arms and compared standard versus targeted versus adjustable. In addition, the study that was a follow‐up subgroup analysis was not included in either of these comparisons but was included separately in the targeted versus standard fortification analysis, as it gave additional information on a bronchopulmonary dysplasia (BPD) subgroup. Individualized versus standard fortification studies were further categorized and analyzed by specific type of individualization: targeted versus standard (4 studies, 269 participants) and adjustable versus standard (3 studies, 96 participants).
I. Individualized (adjustable/targeted) versus standard fortification
When compared to standard fortification, individualized fortification led to improved growth velocities among all three growth parameters measured: weight, length, and head circumference at end of intervention (low‐ to moderate‐certainty evidence).
Retinopathy of prematurity (ROP), osteopenia, and BPD were not different between groups, but data on these outcomes were limited; only one study assessed ROP and osteopenia, and four studies assessed BPD. All reported a small or very small number of events (very low‐certainty evidence).
II. Targeted versus standard fortification
Targeted fortification resulted in improved growth velocities of weight and length but no statistically significant difference in head circumference (low‐ to moderate‐certainty evidence).
One study followed all three growth parameters and calculated body mass index (BMI) at end of intervention, at 40 weeks' postmenstrual age (PMA), and at 3, 6, and 12 months' corrected age (CA), and found no significant differences among groups in any of these outcomes at any of the time points (Agakidou 2019). The only study that evaluated these outcomes beyond end of intervention did not observe a significant difference at end of intervention among groups fed targeted versus standard fortification.
In a BPD subgroup analysis of in‐hospital mortality, length of hospital stay, and PMA at discharge in one study (Hair 2016) (secondary analysis of Hair 2014), no differences were evident.
No differences were evident between fortification groups for the following clinical outcomes.
Length of hospital stay in days and PMA at discharge in weeks; however data were collected in only one study (very low‐certainty evidence).
In‐hospital mortality, necrotizing enterocolitis, and culture‐proven late‐onset bacterial sepsis, but these outcomes were evaluated in only two of the included studies (very low‐certainty evidence).
Retinopathy of prematurity and osteopenia, but these were evaluated in only one study.
BPD, collected in three studies.
III. Adjustable versus standard fortification
Adjustable fortification resulted in significant improvement in growth velocity of weight, length, and head circumference at end of intervention when compared to standard fortification (moderate‐ to high‐certainty evidence). When growth velocity of weight was expressed in grams/d as opposed to grams/kg/d, a significant difference was evident, in which infants receiving adjustable fortification showed improved growth.
Retinopathy of prematurity, osteopenia, and BPD did not appear to be different between the two groups but were assessed in only one study.
IV. Targeted versus adjustable fortification
When methods of individualized fortification were compared, targeted fortification resulted in improved growth velocity of weight when compared to adjustable fortification, but length and head circumference growth velocities were not different between the two groups. These methods were compared in only two studies (low‐ to moderate‐certainty evidence).
Retinopathy of prematurity, osteopenia, and BPD were not significantly different between the two groups, but again, these data were collected in only one of the studies.
Overall completeness and applicability of evidence
Included studies were conducted in similar populations in neonatal intensive care units (NICUs) in several different countries, including Greece, Italy, Turkey, USA, and Canada. Accordingly, our synthesized observed findings are likely generalizable to NICU populations with the resources available to individualize fortification. Further, these studies included detailed feeding regimen information to promote replicability and clinical implementation.
Although feeding regimen details were reported, site‐specific regimens varied. These observed inconsistencies contributed to the heterogeneity of findings, and thus decreased the overall quality of evidence. Specifically, differences existed among studies with respect to standard regimens, pre‐intervention regimens, duration of the intervention, timing of corresponding measurements, and reported outcomes. The design and implementation of interventions and the use of fortifiers varied. The data leave a very important clinical question unanswered: what is an optimal fortification practice? Although it appears that individualized fortification is better in the short term for multiple growth parameters, the optimal regimen with which to individualize fortification remains unidentified. Studies of adjustable fortification differed in details of the adjustment algorithms. Two of the studies used the same strategy for testing blood urea nitrogen (BUN) but used different protein supplements (Arslanoglu 2006; Kadioglu Simsek 2019), and one of the studies used a calculation for “corrected serum nitrogen” and used a different upper threshold for when to hold on adding fortifier ‐ 12 as opposed to 14 (Moro 1995). Studies of targeted fortification differed in the macronutrients fortified. Some targeted protein only (Agakidou 2019; Kadioglu Simsek 2019), one focused only on kcal/oz (Hair 2014), and one targeted goals for all three components: protein, carbohydrate, and fat (Rochow 2020).
Studies consistently assessed short‐term growth outcomes including weight, length, and head circumference growth velocities at end of intervention. Evidence was insufficient to justify conclusions on other clinical or outpatient growth outcomes. The safety of the interventions remains unknown. Further, no studies evaluated neurodevelopmental outcomes including severe neurodevelopmental impairment.
Quality of the evidence
Identified evidence addressing our review question was of very low to moderate certainty. There was heterogeneity, sometimes substantial, due to differences between studies in standard feeding regimens, pre‐intervention regimens, duration of intervention, timing of end of intervention measurements, reported outcomes, and case definitions of some reported outcomes. Studies of adjustable fortification differed in the details of their adjustment algorithms. Studies of targeted fortification differed in the macronutrients they fortified (e.g. protein only [Agakidou 2019]; protein, carbohydrate, and fat [Rochow 2020]). Included studies were often imprecise due to relatively small enrollment or small numbers of events.
Potential biases in the review process
We attempted to minimize bias in our review process as feasible. The literature search included searches of major literature databases, clinical trial registries, and Cochrane databases of clinical trials. Two review authors screened each abstract for further review based on the inclusion criteria, and a third review author adjudicated disagreement. Once an abstract was chosen, two review authors reviewed the full article and extracted data. Risk of bias was also assessed by two review authors. Study authors were contacted by email for clarification or to request unpublished data when necessary.
Agreements and disagreements with other studies or reviews
We found no other reviews of this topic during our search. The Cochrane Library includes reviews of non‐individualized nutritional fortification of breast milk feedings in preterm infants, including reviews of multi‐nutrient fortification versus no fortification (Brown 2020), human‐ versus bovine‐derived milk fortifier (Premkumar 2019), fortification versus no fortification following hospital discharge (Young 2013), protein fortification versus no protein fortification (Amissah 2018a), carbohydrate fortification versus no carbohydrate fortification (Amissah 2018b), fat fortification versus no fat fortification (Amissah 2018c), and early versus late fortification (Thanigainathan 2020). In contrast, this review examines the strategy of individualized versus non‐individualized fortification, irrespective of the specific macronutrient fortified. Thus this review is not directly comparable to reviews of non‐individualized versus no fortification or of different non‐individualized fortification regimens. However, the authors of reviews of non‐individualized nutritional fortification of breast milk feedings in preterm infants have found, as we did, that the literature addressing their review question was often noteworthy for small sample sizes, low precision, and other causes of low certainty of evidence (Amissah 2018a).
Authors' conclusions
Implications for practice.
We found moderate‐ to low‐certainty evidence suggesting that individualized (targeted or adjustable) fortification of enteral feeds in very low birth weight infants increases growth velocity of weight, length, and head circumference during the intervention compared with standard non‐individualized fortification. Evidence examining important in‐hospital and post‐discharge clinical outcomes was sparse and of low or very low certainty, precluding inferences regarding safety or clinical benefits beyond short‐term growth. The optimal regimen for individualizing fortification remains unknown.
Implications for research.
The best approach for individualized fortification remains largely unexplored. Findings from this review suggest that targeted or adjustable approaches may improve short‐term growth, but data were insufficient to establish which method, if either, is superior. Current data also lack conclusive evidence regarding which macronutrients the individualized fortification should be directed toward when such practices are implemented. Thus, does the addition of protein, fat, or carbohydrates, or a combination of those macronutrients, yield the best growth when individualized fortification strategies are used? In addition, further research is warranted to evaluate safety with respect to important clinical outcomes, including mortality, necrotizing enterocolitis, bronchopulmonary dysplasia, sepsis, neurodevelopmental outcomes, and growth beyond NICU discharge in this population.
History
Protocol first published: Issue 11, 2019 Review first published: Issue 11, 2020
Acknowledgements
The Methods section of this protocol is based on a standard template used by Cochrane Neonatal.
We acknowledge the work of Ms. Carol Friesen, Information Specialist, for designing literature searches for this review; Ms. Colleen Ovelman, Managing Editor, in peer‐reviewing the MEDLINE Ovid search strategy; and Dr William McGuire for offering editorial feedback.
We acknowledge Dr Jacqueline Miller, who has peer‐reviewed and offered feedback for this review.
We also acknowledge Lauren Tosi, MPH, and Fiona Stewart for administrative support and assistance with reviews.
Appendices
Appendix 1. Search strategies
The RCT filters have been created using Cochrane's highly sensitive search strategies for identifying randomised trials (Higgins 2011b). The neonatal filters were created and tested by the Cochrane Neonatal Information Specialist.
CENTRAL via CRS Web
1MESH DESCRIPTOR Milk, Human EXPLODE ALL AND CENTRAL:TARGET
2MESH DESCRIPTOR Food, Fortified EXPLODE ALL AND CENTRAL:TARGET
3MESH DESCRIPTOR Dietary Supplements EXPLODE ALL AND CENTRAL:TARGET
4#3 OR #2 AND CENTRAL:TARGET
5#1 AND #4 AND CENTRAL:TARGET
6(fortif* OR supplement* OR enrich*) ADJ4 (human OR breast OR expressed OR mother* OR maternal OR donor*) ADJ2 milk* AND CENTRAL:TARGET
7(fortif* OR supplement* OR enrich*) ADJ4 (DHM OR HM OR breastmilk*) AND CENTRAL:TARGET
8#5 OR #6 OR #7 AND CENTRAL:TARGET
9MESH DESCRIPTOR Infant, Newborn EXPLODE ALL AND CENTRAL:TARGET
10infant or infants or infant’s or "infant s" or infantile or infancy or newborn* or "new born" or "new borns" or "newly born" or neonat* or baby* or babies or premature or prematures or prematurity or preterm or preterms or "pre term" or premies or "low birth weight" or "low birthweight" or VLBW or LBW or ELBW or NICU AND CENTRAL:TARGET
11#10 OR #9
12#11 AND #8
MEDLINE via Ovid
1. exp Milk, Human/
2. exp Food, Fortified/
3. exp Dietary Supplements/
4. 2 or 3
5. 1 and 4
6. (fortif* adj4 ((human or breast or expressed) adj2 milk*)).mp.
7. (fortif* adj4 ((mother* or maternal or donor*) adj2 milk*)).mp.
8. (supplement* adj4 ((human or breast or expressed) adj2 milk*)).mp.
9. (supplement* adj4 ((mother* or maternal or donor*) adj2 milk*)).mp.
10. (enrich* adj4 ((human or breast or expressed) adj2 milk*)).mp.
11. (enrich* adj4 ((mother* or maternal or donor*) adj2 milk*)).mp.
12. ((fortif* or supplement* or enrich*) adj4 DHM).mp.
13. ((fortif* or supplement* or enrich*) adj4 HM).mp.
14. ((fortif* or supplement* or enrich*) adj4 breastmilk*).mp.
15. 6 or 7 or 8 or 9 or 10 or 11 or 12 or 13 or 14
16. 5 or 15
17. exp infant, newborn/
18. (newborn* or new born or new borns or newly born or baby* or babies or premature or prematurity or preterm or pre term or low birth weight or low birthweight or VLBW or LBW or infant or infants or "infant s" or infant's or infantile or infancy or neonat*).ti,ab.
19. 17 or 18
20. randomized controlled trial.pt.
21. controlled clinical trial.pt.
22. randomized.ab.
23. placebo.ab.
24. drug therapy.fs.
25. randomly.ab.
26. trial.ab.
27. groups.ab.
28. or/20‐27
29. exp animals/ not humans.sh.
30. 28 not 29
31. 19 and 30
32. 16 and 31
MEDLINE via PubMed
Terms: (((("Milk, Human"[Mesh] AND ("Food, Fortified"[Mesh] OR "Dietary Supplements"[Mesh]))) OR ((fortif*[TW] OR supplement*[TW] OR enrich*[TW]) AND (human[TW] OR breast[TW] OR expressed[TW] OR mother*[TW] OR maternal[TW] OR donor*[TW]) AND milk*[TW])) OR ((fortif*[TW] OR supplement*[TW] OR enrich*[TW]) AND (DHM[TW] OR HM[TW] OR breastmilk*[TW]))) AND (((infant, newborn[MeSH] OR newborn*[TIAB] OR "new born"[TIAB] OR "new borns"[TIAB] OR "newly born"[TIAB] OR baby*[TIAB] OR babies[TIAB] OR premature[TIAB] OR prematurity[TIAB] OR preterm[TIAB] OR "pre term"[TIAB] OR “low birth weight”[TIAB] OR "low birthweight"[TIAB] OR VLBW[TIAB] OR LBW[TIAB] OR infant[TIAB] OR infants[TIAB] OR infant’s[TIAB] OR “infant s”[TIAB] OR infantile[TIAB] OR infancy[TIAB] OR neonat*[TIAB]) AND (randomized controlled trial[pt] OR controlled clinical trial[pt] OR randomized[tiab] OR placebo[tiab] OR drug therapy[sh] OR randomly[tiab] OR trial[tiab] OR groups[tiab]) NOT (animals[mh] NOT humans[mh]))) Filters: Publication date from 2018/09/01
CINAHL via EBSCOhost
S1MH milk, human
S2MH Food, Fortified
S3MH Dietary Supplementation
S4S2 OR S3
S5S1 AND S4
S6(fortif* OR supplement* OR enrich*) AND (human OR breast OR expressed OR mother* OR maternal OR donor*) AND milk*
S7(fortif* OR supplement* OR enrich*) AND (DHM OR HM OR breastmilk*)
S8S5 OR S6 OR S7
S9 ((infant or infants or infant’s or infantile or infancy or newborn* or "new born" or "new borns" or "newly born" or neonat* or baby* or babies or premature or prematures or prematurity or preterm or preterms or "pre term" or premies or "low birth weight" or "low birthweight" or VLBW or LBW)) AND ((randomized controlled trial OR controlled clinical trial OR randomized OR randomised OR placebo OR clinical trials as topic OR randomly OR trial OR PT clinical trial))
S10S8 AND S9
ISRCTN
milk AND Interventions: fortification AND Participant age range: Neonate milk AND Interventions: supplementation AND Participant age range: Neonate
Appendix 2. 'Risk of bias' tool
Sequence generation (checking for possible selection bias). Was the allocation sequence adequately generated?
For each included study, we categorized the method used to generate the allocation sequence as:
low risk (any truly random process, e.g. random number table; computer random number generator);
high risk (any non‐random process, e.g. odd or even date of birth; hospital or clinic record number); or
unclear risk.
Allocation concealment (checking for possible selection bias). Was allocation adequately concealed?
For each included study, we categorized the method used to conceal the allocation sequence as:
low risk (e.g. telephone or central randomization; consecutively numbered, sealed, opaque envelopes);
high risk (open random allocation; unsealed or non‐opaque envelopes, alternation; date of birth); or
unclear risk.
Blinding of participants and personnel (checking for possible performance bias). Was knowledge of the allocated intervention adequately prevented during the study?
For each included study, we categorized the methods used to blind study participants and personnel from knowledge of which intervention a participant received. We assessed blinding separately for different outcomes or classes of outcomes. We categorized the methods as:
low risk, high risk, or unclear risk for participants; and
low risk, high risk, or unclear risk for personnel.
Blinding of outcome assessment (checking for possible detection bias). Was knowledge of the allocated intervention adequately prevented at the time of outcome assessment?
For each included study, we categorized the methods used to blind outcome assessment. We assessed blinding separately for different outcomes or classes of outcomes. We categorized the methods as:
low risk for outcome assessors;
high risk for outcome assessors; or
unclear risk for outcome assessors.
Incomplete outcome data (checking for possible attrition bias through withdrawals, dropouts, protocol deviations). Were incomplete outcome data adequately addressed?
For each included study and for each outcome, we described the completeness of data including attrition and exclusions from the analysis. We noted whether attrition and exclusions were reported, the numbers included in the analysis at each stage (compared with the total randomized participants), reasons for attrition or exclusion where reported, and whether missing data were balanced across groups or were related to outcomes. Where sufficient information was reported or supplied by the trial authors, we re‐included missing data in the analyses. We categorized the methods as:
low risk (< 20% missing data);
high risk (≥ 20% missing data); or
unclear risk.
Selective reporting bias. Are reports of the study free of the suggestion of selective outcome reporting?
For each included study, we described how we investigated the possibility of selective outcome reporting bias and what we found. We assessed the methods as:
low risk (where it is clear that all of the study's pre‐specified outcomes and all expected outcomes of interest to the review have been reported);
high risk (where not all of the study's pre‐specified outcomes have been reported; one or more reported primary outcomes were not pre‐specified outcomes of interest and are reported incompletely and so cannot be used; the study fails to include results of a key outcome that would have been expected to have been reported); or
unclear risk.
Other sources of bias. Was the study apparently free of other problems that could put it at high risk of bias?
For each included study, we described any important concerns we had about other possible sources of bias (e.g. whether there was a potential source of bias related to the specific study design, whether the trial was stopped early due to some data‐dependent process). We assessed whether each study was free of other problems that could put it at risk of bias as:
low risk;
high risk; or
unclear risk.
If needed, we planned to explore the impact of the level of bias by undertaking sensitivity analyses.
Data and analyses
Comparison 1. Targeted or adjustable vs standard.
| Outcome or subgroup title | No. of studies | No. of participants | Statistical method | Effect size |
|---|---|---|---|---|
| 1.1 Growth velocity, weight, g/kg/d, end of intervention | 6 | 345 | Mean Difference (IV, Fixed, 95% CI) | 1.88 [1.26, 2.50] |
| 1.2 Growth velocity, length, mm/d, end of intervention | 5 | 242 | Mean Difference (IV, Fixed, 95% CI) | 0.43 [0.32, 0.53] |
| 1.3 Growth velocity, head circumference, mm/d, end of intervention | 5 | 242 | Mean Difference (IV, Fixed, 95% CI) | 0.14 [0.06, 0.23] |
| 1.4 Bronchopulmonary dysplasia | 4 | 391 | Risk Ratio (M‐H, Fixed, 95% CI) | 0.89 [0.71, 1.12] |
| 1.5 Retinopathy of prematurity, any | 1 | 60 | Risk Ratio (M‐H, Fixed, 95% CI) | 0.79 [0.36, 1.72] |
| 1.6 Osteopenia | 1 | 60 | Risk Ratio (M‐H, Fixed, 95% CI) | 0.86 [0.40, 1.84] |
Comparison 2. Targeted vs standard fortification.
| Outcome or subgroup title | No. of studies | No. of participants | Statistical method | Effect size |
|---|---|---|---|---|
| 2.1 Growth velocity, weight, g/kg/d, end of intervention | 4 | 269 | Mean Difference (IV, Fixed, 95% CI) | 1.87 [1.15, 2.58] |
| 2.2 Growth velocity, weight, g/kg/d, start of fortification to 40 weeks' PMA | 1 | 47 | Mean Difference (IV, Fixed, 95% CI) | ‐0.03 [‐1.19, 1.13] |
| 2.3 Growth velocity, weight, g/kg/d, start of fortification to 3 months' CA | 1 | 46 | Mean Difference (IV, Fixed, 95% CI) | ‐0.31 [‐1.11, 0.49] |
| 2.4 Growth velocity, weight, g/kg/d, start of fortification to 6 months' CA | 1 | 45 | Mean Difference (IV, Fixed, 95% CI) | 0.09 [‐0.31, 0.49] |
| 2.5 Growth velocity, weight, g/kg/d, start of fortification to 12 months' CA | 1 | 45 | Mean Difference (IV, Fixed, 95% CI) | ‐0.04 [‐0.36, 0.28] |
| 2.6 Growth velocity, length, mm/d, end of intervention | 3 | 166 | Mean Difference (IV, Fixed, 95% CI) | 0.45 [0.32, 0.57] |
| 2.7 Growth velocity, length, mm/d, start of fortification to 40 weeks' PMA | 1 | 48 | Mean Difference (IV, Fixed, 95% CI) | 0.02 [‐0.16, 0.20] |
| 2.8 Growth velocity, length, mm/d, start of fortification to 3 months' CA | 1 | 46 | Mean Difference (IV, Fixed, 95% CI) | ‐0.02 [‐0.12, 0.08] |
| 2.9 Growth velocity, length, mm/d, start of fortification to 6 months' CA | 1 | 45 | Mean Difference (IV, Fixed, 95% CI) | 0.07 [0.00, 0.14] |
| 2.10 Growth velocity, length, mm/d, start of fortification to 12 months' CA | 1 | 44 | Mean Difference (IV, Fixed, 95% CI) | 0.00 [‐0.07, 0.07] |
| 2.11 Growth velocity, head circumference, mm/d, end of intervention | 3 | 166 | Mean Difference (IV, Fixed, 95% CI) | 0.08 [‐0.01, 0.18] |
| 2.12 Growth velocity, head circumference, mm/d, start of fortification to 40 weeks' PMA | 1 | 48 | Mean Difference (IV, Fixed, 95% CI) | ‐0.07 [‐0.16, 0.02] |
| 2.13 Growth velocity, head circumference, mm/d, start of fortification to 3 months' CA | 1 | 46 | Mean Difference (IV, Fixed, 95% CI) | 0.00 [‐0.06, 0.06] |
| 2.14 Growth velocity, head circumference, mm/d, start of fortification to 6 months' CA | 1 | 45 | Mean Difference (IV, Fixed, 95% CI) | 0.01 [‐0.03, 0.05] |
| 2.15 Growth velocity, head circumference, mm/d, start of fortification to 12 months' CA | 1 | 45 | Mean Difference (IV, Fixed, 95% CI) | ‐0.01 [‐0.04, 0.02] |
| 2.16 Change in BMI, end of intervention | 1 | 48 | Mean Difference (IV, Fixed, 95% CI) | ‐0.08 [‐0.28, 0.12] |
| 2.17 Change in BMI, start of fortification to 40 weeks' PMA | 1 | 48 | Mean Difference (IV, Fixed, 95% CI) | ‐0.05 [‐0.18, 0.08] |
| 2.18 Change in BMI, start of fortification to 3 months' CA | 1 | 46 | Mean Difference (IV, Fixed, 95% CI) | ‐0.04 [‐0.11, 0.03] |
| 2.19 Change in BMI, start of fortification to 6 months' CA | 1 | 45 | Mean Difference (IV, Fixed, 95% CI) | ‐0.02 [‐0.05, 0.01] |
| 2.20 Change in BMI, start of fortification to 12 months' CA | 1 | 44 | Mean Difference (IV, Fixed, 95% CI) | ‐0.02 [‐0.05, 0.01] |
| 2.21 Length of hospital stay, days | 1 | 75 | Mean Difference (IV, Fixed, 95% CI) | ‐12.00 [‐26.38, 2.38] |
| 2.22 Postmenstrual age at discharge, weeks | 1 | 75 | Mean Difference (IV, Fixed, 95% CI) | ‐1.70 [‐3.47, 0.07] |
| 2.23 In‐hospital mortality | 3 | 334 | Risk Ratio (M‐H, Fixed, 95% CI) | 0.14 [0.02, 1.14] |
| 2.24 Necrotizing enterocolitis | 2 | 257 | Risk Ratio (M‐H, Fixed, 95% CI) | 0.40 [0.08, 1.99] |
| 2.25 Culture‐proven late‐onset bacterial sepsis | 2 | 257 | Risk Ratio (M‐H, Fixed, 95% CI) | 1.29 [0.76, 2.17] |
| 2.26 Retinopathy of prematurity, any | 1 | 40 | Risk Ratio (M‐H, Fixed, 95% CI) | 1.00 [0.43, 2.33] |
| 2.27 Osteopenia | 1 | 40 | Risk Ratio (M‐H, Fixed, 95% CI) | 0.86 [0.35, 2.10] |
| 2.28 Bronchopulmonary dysplasia | 4 | 371 | Risk Ratio (M‐H, Fixed, 95% CI) | 0.88 [0.70, 1.11] |
| 2.29 BPD subgroup ‐ in‐hospital mortality | 1 | 21 | Odds Ratio (M‐H, Fixed, 95% CI) | Not estimable |
| 2.30 BPD subgroup ‐ length of hospital stay, days | 1 | 21 | Mean Difference (IV, Fixed, 95% CI) | ‐17.00 [‐48.53, 14.53] |
| 2.31 BPD subgroup ‐ postmenstrual age at discharge, weeks | 1 | 21 | Mean Difference (IV, Fixed, 95% CI) | ‐2.90 [‐6.78, 0.98] |
Comparison 3. Adjustable vs standard fortification.
| Outcome or subgroup title | No. of studies | No. of participants | Statistical method | Effect size |
|---|---|---|---|---|
| 3.1 Growth velocity, weight, g/kg/d, end of intervention | 3 | 96 | Mean Difference (IV, Fixed, 95% CI) | 2.86 [1.69, 4.03] |
| 3.2 Growth velocity, length, mm/d, end of intervention | 3 | 96 | Mean Difference (IV, Fixed, 95% CI) | 0.54 [0.38, 0.70] |
| 3.3 Growth velocity, head circumference, mm/d, end of intervention | 3 | 96 | Mean Difference (IV, Fixed, 95% CI) | 0.36 [0.21, 0.50] |
| 3.4 Growth velocity, weight, g/d, end of intervention | 2 | 56 | Mean Difference (IV, Fixed, 95% CI) | 3.26 [1.17, 5.34] |
| 3.5 Retinopathy of prematurity, any | 1 | 40 | Risk Ratio (M‐H, Fixed, 95% CI) | 0.57 [0.20, 1.65] |
| 3.6 Osteopenia | 1 | 40 | Risk Ratio (M‐H, Fixed, 95% CI) | 1.00 [0.39, 2.58] |
| 3.7 Bronchopulmonary dysplasia | 1 | 40 | Risk Ratio (M‐H, Fixed, 95% CI) | 1.20 [0.44, 3.30] |
Comparison 4. Targeted vs adjustable fortification.
| Outcome or subgroup title | No. of studies | No. of participants | Statistical method | Effect size |
|---|---|---|---|---|
| 4.1 Growth velocity, weight, g/kg/d, end of intervention | 2 | 72 | Mean Difference (IV, Fixed, 95% CI) | 2.49 [0.44, 4.54] |
| 4.2 Growth velocity, length, mm/d, end of intervention | 2 | 72 | Mean Difference (IV, Fixed, 95% CI) | 0.07 [‐0.06, 0.20] |
| 4.3 Growth velocity, head circumference, mm/d, end of intervention | 2 | 72 | Mean Difference (IV, Fixed, 95% CI) | 0.04 [‐0.10, 0.17] |
| 4.4 Retinopathy of prematurity, any | 1 | 40 | Risk Ratio (M‐H, Fixed, 95% CI) | 1.75 [0.61, 5.05] |
| 4.5 Osteopenia | 1 | 40 | Risk Ratio (M‐H, Fixed, 95% CI) | 1.00 [0.39, 2.58] |
| 4.6 Bronchopulmonary dysplasia | 1 | 40 | Risk Ratio (M‐H, Fixed, 95% CI) | 1.00 [0.39, 2.58] |
Characteristics of studies
Characteristics of included studies [ordered by study ID]
Agakidou 2019.
| Study characteristics | ||
| Methods | Randomized double‐blind study with parallel design (2 treatment groups) and allocation ratio 1:1.performed at 1 center in Greece to compare the effects of a protein‐targeting fortification protocol vs standard fortification on growth up to 12 months' corrected age. Allocation was performed through a computer‐generated randomization list, with randomization clustered based on birth weight below and equal to/over 1200 grams. In both groups, fortification started as soon as enteral nutrition reached 100 mL/kg/d (T1). All infants in both intervention groups were fed exclusively own mother's milk (OMM) fortified with a cow’s milk‐based, multi‐nutrient HMF (PreNAN FM‐85; Nestlé, Vevey, Switzerland) containing 0.20 grams of protein, 0.66 grams of carbohydrates, 0.004 grams of fat, and 3.48 kcal per 1 gram of fortifier. During the week preceding OMM fortification initiation, eligible neonates were randomly allocated to either targeted or standard groups. Milk analysis was performed with mid‐infrared spectrometry, using the Milkoscan TM Minor (FOSS Analytical A/S, Hillerod, Denmark) | |
| Participants | Eligible were appropriate‐for‐gestational‐age preterm infants at 25 to 32 weeks' gestation, birth weight < 1500 grams, admitted within the first 24 hours of life to the study NICU between March 2013 and March 2016, whose mothers intended to provide them with their own breast milk. Excluded were infants with evidence of maternal health problems precluding breast‐feeding, congenital infection, metabolic/genetic syndromes, early death, intraperiventricular hemorrhage of grade III to IV, sepsis and/or necrotizing enterocolitis, and consent refusal. Post‐randomization exclusion criteria included death before the 40th week PMA, interruption of enteral or exclusive own mother's milk feeding for longer than 3 days for various reasons (i.e. inadequate OMM supply, feeding intolerance, sepsis, and/or necrotizing enterocolitis), moderate/severe bronchopulmonary dysplasia, and withdrawal of parental consent. 77 were randomized ‐ 39 and 38 in standard and targeted groups, respectively; 29 infants were excluded following randomization ‐ 16 from the standard group (4 moderate/severe bronchopulmonary dysplasia, 2 sepsis/necrotizing enterocolitis, 1 sepsis‐related death, 3 feeding intolerance, 6 inadequate milk supply), and 13 from the targeted group (3 moderate/severe bronchopulmonary dysplasia, 1 sepsis/necrotizing enterocolitis, 2 feeding intolerance, 7 inadequate milk supply) | |
| Interventions | Intervention was maintained until 35 weeks' PMA • Standard: the fixed fortification group received 5 grams of HMF per 100 mL of OMM, providing 1 gram of protein per 100 mL OMM • Targeted: fortifier was added based on protein content of OMM, birth weight, and daily amount of milk intake to attain the recommended daily protein intake (4 to 4.5 g/kg−1 for infants with birth weight < 1200 grams and 3.5 to 4.0 g/kg−1 for infants with birth weight of 1200 to 1500 grams). Lactose, fat, and energy content of OMM and HMF were not taken into account when the amount of HMF given to the targeted group was calculated. Adjustment of fortification to OMM protein content and daily volume of milk intake continued until the 35th week PCA (T2); then fortification was switched to the standard protocol |
|
| Outcomes | Growth outcomes
In‐hospital clinical outcomes: yes Neurodevelopmental outcomes: no Randomized infants who were excluded due to adverse events were included in the review for counts of BPD and death. No case definition was provided for NEC; sepsis and NEC were treated as a single adverse outcome |
|
| Notes | Also examined postnatal IGF‐1 and ghrelin plasma levels in the 2 fortification arms | |
| Risk of bias | ||
| Bias | Authors' judgement | Support for judgement |
| Random sequence generation (selection bias) | Low risk | Quote: "allocation was performed through a computer‐generated randomization list" |
| Allocation concealment (selection bias) | Unclear risk | Insufficient detail to assess |
| Blinding of participants and personnel (performance bias) All outcomes | Low risk | Only a member of the nursing staff who was not involved in the infants’ care and in clinical/laboratory assessment was aware of group assignment. The same person was responsible for precise measurement of the quantity of HMF and distribution of the proper portion (divided into 8 feeds) for each participant |
| Blinding of outcome assessment (detection bias) All outcomes | Unclear risk | Insufficient detail to assess |
| Incomplete outcome data (attrition bias) All outcomes | Low risk | Data available for all infants; no withdrawals from the study |
| Selective reporting (reporting bias) | Low risk | Outcomes seem to be reported in full |
| Other bias | Low risk | Nothing to indicate any other source of bias |
Arslanoglu 2006.
| Study characteristics | ||
| Methods | Randomized controlled trial performed at 1 center in Italy designed to explore the individualized adjustable approach to fortification of feedings in VLBW infants. Predetermined random assignments to feeding groups were kept in sequentially numbered sealed opaque envelopes. Randomization used stratification by birth weight (< 1250, 1251 to 1500, and 1501 to 1750 grams). Infants were enrolled and randomized to 1 of the feeding groups ‐ adjustable or standard ‐ if and when they reached a feeding volume of 90 mL/kg/d. The actual study began when the feeding volume reached 150 mL/kg/d with full‐strength standard fortification. The study ended when the infant reached a weight of 2000 grams. Infants received the regimen to which they were randomized throughout the study | |
| Participants | Infants with birth weight between 600 and 1750 grams and gestational age between 24 and 34 weeks were eligible if they reached a feeding volume of 90 mL/kg/d before DOL (day of life) 21. Excluded were infants with major congenital abnormalities, chromosomal aberrations, systemic disease, sepsis, necrotizing enterocolitis or intraventricular hemorrhage, ventilator dependent on DOL 21, and multiple births. 36 participants were enrolled and 32 infants completed the study (16 in each study arm) | |
| Interventions | The intervention was maintained until a weight of 2 kg was achieved or for a minimum 14 days • Standard: infants in the standard fortification arm received human milk fortified with HMF in the standard amount (5 g/100 mL of HM) throughout the study. The HMF provided (per 100 mL of breast milk) 0.8 grams of protein in the form of hydrolyzed bovine whey proteins and 18 calories (from protein and maltodextrins) • Adjustable: infants in the adjustable fortification arm started out with standard fortification, but then adjustments to fortification were made at 6 levels, differing in the amount of HMF and additional protein added based on 2 times‐weekly (Monday and Thursday) determinations of blood urea nitrogen (BUN). If BUN was between 9 and 14 mg/dL (3.2 to 5.0 mmol/L), no adjustment was made. Every time the BUN was < 9 mg/dL (< 3.2 mmol/L), fortification was increased by 1 level. If BUN was > 14 mg/dL (> 5.0 mmol/L), a decrease in fortification by 1 level was made |
|
| Outcomes | Growth outcomes
In‐hospital clinical outcomes: no Neurodevelopmental outcomes: no Weight gain in grams/d was calculated as the difference between initial and final weight, divided by the number of days elapsed, and in g/kg/d by dividing gain in grams/d by average weight during the observation period |
|
| Notes | Single center, non‐blinded, small sample size | |
| Risk of bias | ||
| Bias | Authors' judgement | Support for judgement |
| Random sequence generation (selection bias) | Unclear risk | Insufficient detail to assess (no details about how randomization was done) |
| Allocation concealment (selection bias) | Low risk | Quote. "predetermined random assignments to feeding groups were kept in sequentially numbered sealed opaque envelopes" |
| Blinding of participants and personnel (performance bias) All outcomes | Low risk | Quote: "caregivers responsible for infants’ care and feeding were not involved in the investigation" |
| Blinding of outcome assessment (detection bias) All outcomes | High risk | Quote: "it was not possible to blind investigators to study group assignment" |
| Incomplete outcome data (attrition bias) All outcomes | Low risk | 1 infant in each group withdrew after randomization due to reaching 2000 grams before 14 days, and their data were excluded. Not likely to lead to attrition bias (1 in each group) |
| Selective reporting (reporting bias) | Low risk | Outcomes seem to be reported in full |
| Other bias | Low risk | Nothing to indicate any other source of bias |
Bulut 2019.
| Study characteristics | ||
| Methods | Randomized controlled trial performed at 1 center in Turkey; to compare effects of targeted and adjustable protein fortification on early growth of breast‐fed VLBW preterm infants. The study was a prospective, single‐center, randomized trial in which infants received either the targeted or adjustable protein fortification regimen during 4 weeks. Predetermined random assignments to feeding groups were kept in sequentially numbered sealed opaque envelopes. It was not possible to blind investigators to study group assignment, but caregivers responsible for infant care and feeding were not involved in the investigation. Assessment of growth included measurement of daily weight gain (g/d and g/kg/d) and weekly increases in head circumference (mm) and length (cm). Weight gain in g/d was calculated as the difference between initial and final weights, divided by the number of days elapsed, and in g/kg/d by dividing gain in g/d by average weight during the observation period. All anthropometric measurements were taken by nurses who were blinded to the study. Growth status was evaluated by determining Z scores and the end of study extrauterine growth restriction (EUGR) ratio of the total population. Growth Z scores were calculated at birth, at the beginning of the study, and at the end of the study using the LMS method, based on Fenton growth charts. EUGR was defined as a decrease > 1 Z score (severe EUGR > 2) in weight between birth and other measures taken during the hospital stay. Parenteral nutrition was initiated on the first day of life at 70 to 80 mL/kg/d, including 3 g/kg/d protein and 1 g/kg/d lipid; this was increased to 150 to 160 mL/kg/d, including 3.5 g/kg/d protein and 2 g/kg/d lipid within the first week. Minimal enteral nutrition commenced as soon as colostrum was produced. The daily volume of enteral nutrition was increased in increments of 10 to 20 mL/kg, as tolerated. When the feeding volume reached 80 mL/kg/d, breast milk was enriched with a commercially available fortifier (Aptamil Eoprotin; Milupa, Fulda, Germany), first at 1 unit/80 mL, then at 3 units/90 mL, and last at 4 units/100 mL milk (standard fortification). Infants were randomized to targeted (n = 16) and adjustable (n = 16) protein fortification groups when the volume of fortified breast milk given reached 150 mL/kg/d, which was the commencement day of the trial. The study ended after growth of all infants was monitored for 4 weeks | |
| Participants | VLBW preterm infants ≤ 32 weeks' gestational age who were hospitalized at our NICUs between September 2013 and February 2014, and who were exclusively fed fortified breast milk Excluded was any congenital abnormality, metabolic disease, necrotizing enterocolitis, moderate to severe bronchopulmonary dysplasia, or feeding with formula or formula plus breast milk. 49 participants were enrolled and 32 completed the study, with 16 in each study arm | |
| Interventions | Intervention maintained for 4 weeks • Targeted: breast milk was analyzed daily with a mid‐infrared spectrophotometer (Miris, Uppsala, Sweden). When protein intake was < 4.5 g/kg/d in the targeted protein fortification group, additional protein (Protifar; Nutricia, Fulda, Germany) supplement was given to maintain the target protein intake at 4.5 g/kg/d • Adjustable: the protein content of breast milk with standard fortification was presumed to be 2.2 g/100 mL. BUN values were measured weekly, and at levels > 5 mg/dL, protein intake was considered sufficient. At < 5 mg/dL, additional protein was given to reach a maximum estimated amount of 4.5 g/kg/d |
|
| Outcomes | Growth outcomes
In‐hospital clinical outcomes: no Neurodevelopmental outcomes: no Weight gain in g/d was calculated as the difference between initial and final weight, divided by the number of days elapsed, in g/kg/d, by dividing gain in g/d by average weight during the observation period |
|
| Notes | ClinicalTrials.gov NCT03324126 | |
| Risk of bias | ||
| Bias | Authors' judgement | Support for judgement |
| Random sequence generation (selection bias) | Low risk | Predetermined random assignments to feeding groups were kept in sequentially numbered sealed opaque envelopes |
| Allocation concealment (selection bias) | High risk | It was not possible to blind investigators to study group assignment |
| Blinding of participants and personnel (performance bias) All outcomes | Low risk | Caregivers responsible for infant care and feeding were not involved in the investigation |
| Blinding of outcome assessment (detection bias) All outcomes | Low risk | All anthropometric measurements were taken by nurses who were blinded to the study |
| Incomplete outcome data (attrition bias) All outcomes | High risk | 7 deaths, 4 cases of NEC occurred, leading to exclusion (quote: "during the course of the study"); unclear if these occurred before or during the study intervention; if the latter, unclear if these occurred equally in the 2 study arms |
| Selective reporting (reporting bias) | Unclear risk | Insufficient detail to assess (comparative clinical outcomes, safety data not reported) |
| Other bias | Low risk | Nothing to indicate any other source of bias |
Hair 2014.
| Study characteristics | ||
| Methods | Randomized controlled trial performed at 2 centers in USA (quote: "to evaluate whether premature infants who received an exclusive human milk [HM]‐based diet and an HM‐derived cream supplement [cream] would have weight gain [g/kg/d] at least as good as infants receiving a standard feeding regimen [control])." Infants were randomized to 1 of 2 groups via blocks of 4. Fortification began by the time infants were tolerating 100 mL/kg/d of enteral feeds, if not sooner. The cream group was defined as the intent‐to‐treat group. Fortification began by the time infants were tolerating 100 mL/kg/d of enteral feeds, if not sooner. Once fortified feeds were tolerated, the caloric content of HM was determined daily from a 24‐hour batch sample, using a commercially available near‐infrared milk analyzer (Spectrastar 2400RTW; Unity Scientific, Brookfield, CT, USA). This caloric information was available only to study investigators and was not part of routine care at either study site | |
| Participants | Included infants were 750 to 1250 grams BW, with reasonable expectation of survival for study duration through 36 weeks' postmenstrual age (PMA), weaned from fortification, adherence to a feeding protocol providing an exclusive HM‐based diet and potentially a donor HM‐derived cream supplement, achievement of enteral feeds by 21 days of life, and informed consent from parent or legal guardian. Excluded were infants with "major congenital anomalies or clinically significant congenital heart disease, low expectation for survival, high potential for early transfer to a non‐study institution, enrollment in another clinical study that affected nutritional management, failure to start minimum enteral feeds before 21 days of life, presence of intestinal perforation or stage 2 NEC before tolerating fortified feeds, or inability to participate in the study for any reason based on the decision of the study investigator." 78 participants were randomized, with 39 in each study arm. None were excluded after randomization For the Hair 2016 secondary analysis: 3 of these infants were excluded from analysis (1 due to sepsis and a subsequent bowel obstruction before the start of milk analysis, 1 due to clinically significant congenital heart disease and chromosomal abnormality, and 1 due to intestinal perforation before the start of fortified feeds), as their underlying condition placed undue influence on the primary outcomes of this study. Thus, 75 infants (Control n = 37, Cream n = 38) were evaluated |
|
| Interventions | Intervention was maintained until 36 weeks' PMA or weaned from fortifier, whichever occurred first • Standard: control group received fortification based on the assumption that the HM was 20 kcal/oz. Human milk and human milk‐derived fortifier were provided according to the institutional standard of care, and there was no use of milk analysis (mother's own or donor) • Targeted: cream group received the same standard feeding regimen with the addition of a donor HM‐derived cream supplement if the HM they were receiving was found to be < 20 kcal/oz after analysis. The donor HM‐derived cream supplement, Prolact CR (Prolacta Bioscience, City of Industry, CA, USA), was standardized to 25% lipids and contained 2.5 kcal/mL. The appropriate amount of cream was added to HM to bring the caloric content to approximately 20 kcal/oz. Donor HM or own mother’s milk was fortified with cream supplement to a target level of 20 kcal/oz because it is generally assumed that mother’s milk is 20 kcal/oz |
|
| Outcomes | Growth outcomes
In‐hospital clinical outcomes: yes Neurodevelopmental outcomes: no Weight gain velocity (g/kg/d) was calculated using the Patel Method. If a study subject failed to complete the requisite study period (through 36 weeks' PMA or weaned from fortifier), then the rate of change in weight was calculated for time on the study |
|
| Notes | ClinicalTrials.gov NCT01487928. Funded by the US Department of Agriculture (USDA)/Agricultural Research Service (ARS) (58‐6250‐6‐001) and the National Center for Research Resources General Clinical Research for Children (RR00188). Prolacta Bioscience provided the product for the study and assisted in data analysis | |
| Risk of bias | ||
| Bias | Authors' judgement | Support for judgement |
| Random sequence generation (selection bias) | Unclear risk | Insufficient detail to assess (quote: "[I]nfants were randomized into 1 of 2 groups via blocks of 4, the size of which was blinded") |
| Allocation concealment (selection bias) | Unclear risk | Insufficient detail to assess |
| Blinding of participants and personnel (performance bias) All outcomes | High risk | Quote: "because of the nature of the interventions by which the nutrition was prepared and delivered, masking of the study groups was not possible at 1 site. The cream supplement mixes readily with HM and its addition does not change the composition or consistency of the HM. At 1 site, we were unable to prepare the milk and deliver it to the infant in a blinded fashion for logistical reasons" |
| Blinding of outcome assessment (detection bias) All outcomes | Unclear risk | Insufficient detail to assess |
| Incomplete outcome data (attrition bias) All outcomes | Low risk | Data available for all infants; no withdrawals from the study (for Hair 2014) Unclear risk for Hair 2016: secondary analysis: 3 enrolled infants were excluded from the analyses presented in this paper but were not excluded from the intention‐to‐treat analysis in the 2014 initial report. It is unclear whether these post‐hoc exclusions affected the statistical significance of findings of the current study |
| Selective reporting (reporting bias) | Low risk | All outcomes seem to be reported in full |
| Other bias | High risk | Prolacta Bioscience provided the product for the study and assisted in data analysis. 2 study authors received financial support and received speaker honoraria from Prolacta Bioscience. 2 other study authors are employees of Prolacta Bioscience |
Kadioglu Simsek 2019.
| Study characteristics | ||
| Methods | Randomized controlled trial performed at 1 center in Turkey to compare effects of adjustable fortification (AF), targeted fortification (TF), and standard fortification (SF) methods on early growth of very low birth weight infants. Milk was unfortified initially. SF was commenced when milk intake reached 100 mL/kg/d of enteral feeding in all study infants. Infants were randomized to 3 fortification groups when feeding volumes reached 160 mL/kg/d (full enteral feeding). In Group 2 (AF), fortification was based on BUN levels tested 2 times a week and was performed according to Arslanoglu 2006. Protein supplement (Milupa Aptamil protein supplement; Nutricia, Fulda, Germany) was added to HM according to BUN results. Fortification started at level 0 (0.8 grams protein/100 mL) and was reduced by 1 level when BUN level was > 14 mg/dL, or was increased by 1 level when BUN was < 9 mg/dL. In Group 3 (TF), breast milk analyses were performed at 2 different days of the week in the morning from batches collected by mothers to measure the protein content of breast milk for each infant. Milk samples were analyzed using an HMA (Miris, Uppsala, Sweden) | |
| Participants | Clinically stable infants with birth weight (BW) < 1500 grams and gestational age < 32 weeks who were fed only human milk (HM) were included in the study. Excluded were Infants with significant congenital anomalies, respiratory support requirement, or sepsis, and those who underwent cardiac and intestinal surgery, or who were receiving mixed feeding (preterm formula/breast milk). 60 infants were randomized, with 20 in each study arm | |
| Interventions | Intervention maintained for 4 weeks • Standard: in Group 1 (SF), 1 gram (1 scoop) of HMF Eoprotin (Milupa) was added to every 25 mL of HM. Infants in the SF group received HM fortified with human milk fortifier (HMF) in the standard amount (2.3 g/100 mL of HM). HMF provided 0.8 grams of protein and 10 calories per 100 mL of breast milk • Adjustable: in Group 2 (AF), infants were also fed an SF regimen at the beginning. AF was based on BUN levels tested 2 times a week and was performed according to the Arslanoglu 2006 study. Protein supplement (Milupa Aptamil protein supplement) was added to HM according to BUN results. Fortification was started at level 0 (0.8 grams protein/100 mL) and was reduced 1 level when BUN level was > 14 mg/dL, or was increased 1 level when BUN was < 9 mg/dL • Targeted: an appropriate amount of protein supplement was added right before the milk was consumed to achieve target protein intake of 3.5 to 4.5 g/kg |
|
| Outcomes | Growth outcomes
In‐hospital clinical outcomes: yes Neurodevelopmental outcomes: no Weight gain in grams per day was calculated as the difference between initial and final weight, divided by the number of days elapsed; this was converted to grams/(kilogram per day) by dividing gain in grams per day by average weight during the observation period |
|
| Notes | Continuous outcomes reported as median (IQR) converted to mean (SD) (Luo 2018; Median to Mean Calculator 2020). Case definitions not provided for clinical sepsis, NEC, BPD, ROP, or osteopenia. 4 cases of NEC occurred in the study cohort; however none were observed after randomization | |
| Risk of bias | ||
| Bias | Authors' judgement | Support for judgement |
| Random sequence generation (selection bias) | Low risk | Quote: "sequential numbers generated at the computer center of the NICU" |
| Allocation concealment (selection bias) | Low risk | Quote: "the allocations were contained in opaque sequentially numbered sealed envelopes" |
| Blinding of participants and personnel (performance bias) All outcomes | Unclear risk | Insufficient detail to assess |
| Blinding of outcome assessment (detection bias) All outcomes | Low risk | All measurements were performed by trained nurses…and they were blind to the study group |
| Incomplete outcome data (attrition bias) All outcomes | Low risk | Data available for all participants |
| Selective reporting (reporting bias) | Low risk | No study protocol, but outcomes seem to be reported in full |
| Other bias | Unclear risk | Insufficient detail to assess (case definitions not provided for clinical sepsis, NEC, BPD, ROP, or osteopenia) |
Moro 1995.
| Study characteristics | ||
| Methods | Randomized controlled trial performed at 1 center in Italy to test adjustable fortification and to compare it to a standard fortification scheme where fortifier is added in fixed proportions. Feeding of (unfortified) breast milk was initiated at the discretion of the attending physicians. Most of the infants were fed their own mother's expressed breast milk, but ~ 25% of infants received predominantly or exclusively pasteurized breast milk from a local milk bank. The proportion of infants receiving banked milk was similar in the 3 feeding groups. When milk volume reached 150 mL/kg/d and intravenous fluids were discontinued, infants whose parents consented were enrolled in the study, and fortification with the assigned regimen was started. Separate randomization schedules were used for AGA and SGA infants. As soon as feedings reached the respective target volume, which usually occurred 3 days later, the study began (day 1) | |
| Participants | Infants were eligible if their birth weight was between 900 and 1500 grams, if they were no longer receiving intravenous fluids, and if they were free of major congenital malformations and systemic illness. 42 participants were enrolled and 36 infants completed the study, with 12 in each study arm | |
| Interventions | Intervention was maintained until hospital discharge at a body weight of ~ 2200 grams • Standard: in the standard fortification arm, infants were fed breast milk fortified with an experimental bovine milk protein‐based fortifier (EBMF), added in a fixed amount (3.5 grams to each 100 mL of breast milk) • Adjustable: in the adjustable arm, infants were fed breast milk that was also fortified with EBMF, except that the amount of fortifier was added at 7 levels, differing in the amount of fortifier, on the basis of 2 times‐weekly determinations of corrected serum urea nitrogen (CSUN). "Correction" of serum urea to a normal serum creatinine concentration was used because the low glomerular filtration rate of young preterm infants leads to elevation of serum urea nitrogen (SUN) independently from the level of protein intake. CSUN was calculated as SUN × 0.5/SCr, where 0.5 is the "normal" serum creatinine concentration, and SCr is the serum creatinine concentration determined at the same time as SUN. In this way, by correcting the SUN to a creatinine concentration of 0.5 mg/dL, the "renal" component of the SUN value was in effect removed. If the CSUN was between 9.1 and 12.0 mg/dL, fortification was not changed from the standard 3.5 grams per 100 mL of milk. If it was outside this range, the amount of fortifier was changed by not more than 1 level at a time |
|
| Outcomes | Growth outcomes
In‐hospital clinical outcomes: no Neurodevelopmental outcomes: no Gains in weight, length, and head circumference were calculated in the customary fashion as the difference between values at the beginning and at the end, divided by the number of days in the interval. Expression of weight gain per unit of body weight (kg) was accomplished using average weight for the interval |
|
| Notes | Infants continued to receive the assigned regimen until hospital discharge at a body weight of ‐2200 grams; however growth outcomes were reported only for 3 weeks after the beginning of the intervention | |
| Risk of bias | ||
| Bias | Authors' judgement | Support for judgement |
| Random sequence generation (selection bias) | Unclear risk | Insufficient detail to assess (quote: "randomization schedules"; no details given) |
| Allocation concealment (selection bias) | Low risk | Assignment of infants to 1 of 3 fortification regimens was done via sealed envelopes |
| Blinding of participants and personnel (performance bias) All outcomes | Unclear risk | Insufficient detail to assess |
| Blinding of outcome assessment (detection bias) All outcomes | Unclear risk | Insufficient detail to assess |
| Incomplete outcome data (attrition bias) All outcomes | High risk | Imbalanced attrition (0/14, 2/14, and 4/14) and data not reported for withdrawals |
| Selective reporting (reporting bias) | Low risk | Outcomes seem to be reported in full |
| Other bias | Low risk | No indication of any other bias |
Rochow 2020.
| Study characteristics | ||
| Methods | Randomized controlled trial performed at 1 center in Canada to compare growth of preterm infants fed targeted or standard fortification. Randomization was stratified by gestational age (< 28 weeks vs > 28 weeks) with variable block sizes of 2, 4, and 6, to minimize bias in patient allocation. For each stratum, a series of opaque, sealed, and consecutively numbered envelopes were generated and opened by dietary assistants in their offices outside the NICU. After reaching total fluid intake of 120 mL/kg/d, standard fortification was introduced for all study participants using half of the full concentration for 2 days and the final concentration of standard fortification thereafter. In cases of elevated blood urea nitrogen levels (> 100 mmol/L), triglycerides (> 3 mmol/L), or glucose (> 12 mmol/L), the fortification dosage was halved and the study period was discontinued, as long as these conditions were present. After normalization, the study was resumed when infants were expected to complete the minimum study period. The intervention was discontinued for infants who required fluid restriction (< 140 mL/kg/d for > 3 days), had hepatic disease (total serum bilirubin > 10 mg/dL), or developed NEC (Bell stage ≥ 2) or Gram‐negative sepsis | |
| Participants | Infants at < 30 weeks' gestational age at birth with anticipated length of stay > 21 days and receiving fortified BM were eligible. Excluded were infants with gastrointestinal malformation, major congenital anomalies, stage 2 NEC, abdominal surgery, and Gram‐negative sepsis. 179 participants were enrolled and 103 infants were included in the final analysis. 76 were excluded before initiating study intervention or due to early transfer before completing 14 study days, deviation of the feeding protocol, or use of steroids or diuretics. This left 51 and 52 infants in the 2 study arms for final analysis | |
| Interventions | Intervention maintained for minimum 21 days to be completed before 36 weeks' postmenstrual age (PMA) • Standard: infants in the standard fortification arm received standard fortifier (Enfamil HMF; Mead Johnson, Cleveland, OH, USA) powder at recommended dosage of 1 package per 25 mL, providing an additional 1 gram of fat, 1.1 gram of protein, and 0.4 gram of carbohydrates per 100 mL of BM. Infants on donor milk received an additional 0.4 gram of whey protein powder per 100 mL (Beneprotein) • Targeted: infants in the targeted fortification arm received standard fortification similar to that of infants in the standard arm and had additional modular components added after human milk analysis. Macronutrients of BM were measured using a calibrated and validated near‐infrared milk analyzer (SpectraStar; Unity Scientific, Brookfield, CT, USA). Lactose content was measured using an established reference method. Osmolality of native and fortified BM was measured using a freezing point osmometer (3320 MicroOsmometer; Advanced Instruments, Norwood, MA, USA). Analysis of mother's own milk and of donor milk was done 3 times per week. The amount of additional fortification required to reach ESPGHAN targets was calculated for each macronutrient using a standardized study recipe sheet. After milk analysis, fortifier was added to achieve BM contents of 4.4 grams fat, 8.3 grams carbohydrates, and 3.0 grams protein per 100 mL to reach ESPGHAN recommended intakes, assuming an average fluid intake of 150 mL/kg/d, leading to total daily intake of 6.6, 12.5, and 4.5 g/kg/d for fat, carbohydrates, and protein, respectively. To prepare feeds, standard fortifier was first added to native BM at the recommended dosage as per standard fortification practices. Then, individual modular components were added to achieve target concentrations according to the fortification recipe. In the intervention group, standard fortification was introduced similarly to the control group (i.e. over two days once intake of 120 mL/kg/d was reached). Thereafter, the modular components were introduced over a 3‐day period |
|
| Outcomes | Growth outcomes
In‐hospital clinical outcomes: yes Neurodevelopmental outcomes: no Growth velocity was calculated as average rate of weight gain (g/kg/d) during the 21‐day study period with a generalized reduced gradient method, starting on study day 2 after full introduction of targeted fortification. Clinical outcomes were reported for all randomized infants, including those excluded post randomization |
|
| Notes | ClinicalTrials.gov NCT01609894. | |
| Risk of bias | ||
| Bias | Authors' judgement | Support for judgement |
| Random sequence generation (selection bias) | Low risk | Randomization was stratified by gestational age with variable block sizes of 2, 4, and 6 to minimize bias in patient allocation |
| Allocation concealment (selection bias) | Low risk | For each stratum, a series of opaque, sealed, and consecutively numbered envelopes were generated and opened by dietary assistants in their offices outside the NICU |
| Blinding of participants and personnel (performance bias) All outcomes | Low risk | All investigators, research assistants, parents, and healthcare providers, except dietary assistants, were blinded to randomization and nutritional intervention |
| Blinding of outcome assessment (detection bias) All outcomes | Low risk | All investigators, research assistants, parents, and healthcare providers, except dietary assistants, were blinded to randomization and nutritional intervention |
| Incomplete outcome data (attrition bias) All outcomes | Low risk | 76 randomized subjects were excluded before initiating study intervention or due to early transfer before completing 14 study days, deviation of feeding protocol, or use of steroids or diuretics; exclusions occurred equally in the 2 study arms. Clinical outcomes but not growth outcomes were reported for excluded infants |
| Selective reporting (reporting bias) | Low risk | Growth outcomes were not available for infants excluded after randomization |
| Other bias | Low risk | Nothing to indicate any other source of bias |
AF: adjustable fortification; AGA: appropriate for gestational age; BPD: bronchopulmonary dysplasia; BUN: blood urea nitrogen; BW: birth weight; CSUN: corrected serum urea nitrogen; DOL: day of life; EBMF: experimental bovine milk protein‐based fortifier; ESPGHAN: European Society of Paediatrics Gastroenterology, Hepatology and Nutrition; EUGR: extrauterine growth restriction; HM: human milk; HMF: human milk fortifier; IGF‐1: insulin‐like growth factor‐1; IQR: interquartile range; NEC: necrotizing enterocolitis; NICU: neonatal intensive care unit; OMM: own mother's milk; PCA: postconceptual age; PMA: postmenstrual age; ROP: retinopathy of prematurity; SCr: serum creatinine concentration; SD: standard deviation; SF: standard fortification; SGA: small for gestational age; SUN: serum urea nitrogen; TF: targeted fortification; VLBW: very low birth weight.
Characteristics of excluded studies [ordered by study ID]
| Study | Reason for exclusion |
|---|---|
| Boehm 1993 | Fortification not individualized in any study arm |
| Kanmaz 2013 | Fortification not individualized in any study arm |
| Maas 2017 | Participants did not receive human milk exclusively |
| Mathes 2018 | Participants did not receive human milk exclusively |
| McLeod 2016 | Participants did not receive human milk exclusively |
| Morlacchi 2016 | Assignment was not randomized or quasi‐randomized |
| Quan 2019 | Participants did not receive human milk exclusively |
Characteristics of studies awaiting classification [ordered by study ID]
Brion 2020.
| Methods | |
| Participants | |
| Interventions | |
| Outcomes | |
| Notes | This study is awaiting classification because it was published after our literature review was completed |
Differences between protocol and review
We made the following changes to the published protocol (Fabrizio 2019).
Inclusion criteria for birth weight were broadened to include all preterm infants at < 37 weeks' gestation or < 2500 grams birth weight.
We updated the "Risk of bias" tool.
Outcomes included in the protocol, but not included in the review, were Ponderal Index, incidence of growth at < 10th percentile for corrected age, time to regain birth weight, time to establishment of full enteral feedings, duration of parenteral nutrition, feeding intolerance, and neurodevelopmental outcomes. These were not included because they were not addressed in the included studies.
The primary outcome in the protocol was in‐hospital growth; however due to available data in the included studies, the primary outcome in the review is growth velocity at end of study intervention.
We included “any retinopathy of prematurity,” which was listed in our protocol, but not the additionally defined treated ROP, due to available data in the included studies.
We included “any BPD” as opposed to the more rigorous definition of BPD as provided in our protocol due to available data in the included studies.
Osteopenia was included in the review but had not been included in the protocol because it was one of the outcomes provided in one of the included studies.
"Sepsis" or "late‐onset sepsis" in the protocol became "culture‐proven sepsis" in the review.
"Length of hospitalization" in the protocol was called "length of hospital stay" in the review.
Contributions of authors
Drs Fabrizio, Trzaski, and Hagadorn drafted this review, and all review authors reviewed and revised the final draft and take responsibility for its contents.
Sources of support
Internal sources
No sources of support supplied
External sources
-
Vermont Oxford Network, USA
Cochrane Neonatal Reviews are produced with support from Vermont Oxford Network, a worldwide collaboration of health professionals dedicated to providing evidence‐based care of the highest quality for newborn infants and their families.
-
The Gerber Foundation, USA
Editorial support for this review, as part of a suite of preterm nutrition reviews, has been provided by a grant from The Gerber Foundation. The Gerber Foundation is a separately endowed, private, 501(c)(3) foundation not related to Gerber Products Company in any way.
Declarations of interest
VF on the Mothers' Milk Bank Northeast Advisory Board in a voluntary capacity. This is a non‐profit community milk bank that provides donated, pasteurized human milk. JMT has no interests to declare. EAB has no interests to declare. PE has no interests to declare. SL has no interests to declare. MML has no interests to declare. JIH has no interests to declare.
Core editorial and administrative support for this review has been provided by a grant from The Gerber Foundation. The Gerber Foundation is a separately endowed, private foundation, independent from the Gerber Products Company. The grantor has no input on the content of the review or the editorial process (see Sources of support).
New
References
References to studies included in this review
Agakidou 2019 {published and unpublished data}
- Agakidou E, Karagiozoglou-Lampoudi T, Parlapani E, Fletouris DJ, Sarafidis K, Tzimouli V, et al. Modifications of own mothers' milk fortification protocol affect early plasma IGF-I and ghrelin levels in preterm infants: a randomized clinical trial. Nutrients 2019;11(12):3056. [DOI: 10.3390/nu11123056] [PMID: ] [DOI] [PMC free article] [PubMed] [Google Scholar]
Arslanoglu 2006 {published data only}
- Arslanoglu S, Moro GE, Ziegler EE. Adjustable fortification of human milk fed to preterm infants: does it make a difference? Journal of Perinatology 2006;26(10):614-21. [DOI: 10.1038/sj.jp.7211571] [PMID: ] [DOI] [PubMed] [Google Scholar]
Bulut 2019 {published data only}
- Bulut O, Coban A, Uzunhan O, Ince Z. Effects of targeted versus adjustable protein fortification of breast milk on early growth in very low-birth-weight preterm infants: a randomized clinical trial. Nutrition in Clinical Practice 2020;35(2):335-43. [DOI: 10.1002/ncp.10307] [PMID: ] [DOI] [PubMed] [Google Scholar]
Hair 2014 {published data only}
- Hair AB, Bergner EM, Lee ML, Moreira AG, Hawthorne KM, Rechtman DJ, et al. Premature infants 750-1,250 g birth weight supplemented with a novel human milk-derived cream are discharged sooner. Breastfeeding Medicine 2016;11(3):133-7. [DOI: 10.1089/bfm.2015.0166] [PMID: 26982282] [DOI] [PMC free article] [PubMed] [Google Scholar]
- Hair AB, Blanco CL, Moreira AG, Hawthorne KM, Lee ML, Rechtman DJ, et al. Randomized trial of human milk cream as a supplement to standard fortification of an exclusive human milk-based diet in infants 750-1250 g birth weight. Journal of Pediatrics 2014;165(5):915-20. [DOI: 10.1016/j.jpeds.2014.07.005] [PMID: ] [DOI] [PubMed] [Google Scholar]
Kadioglu Simsek 2019 {published data only}
- Kadioglu Simsek G, Alyamac Dizdar E, Arayici S, Canpolat F, Sari F, Uras N, et al. Comparison of the effect of three different fortification methods on growth of very low birth weight infants. Breastfeeding Medicine 2019;14(1):63-8. [DOI: 10.1089/bfm.2018.0093Abstract] [PMID: ] [DOI] [PubMed] [Google Scholar]
Moro 1995 {published data only}
- *.Moro GE, Minoli I, Ostrom M, Jacobs JR, Picone TA, Raiha NC, et al. Fortification of human milk: evaluation of a novel fortification scheme and of a new fortifier. Journal of Pediatric Gastroenterology and Nutrition 1995;20(2):162-72. [DOI: 10.1097/00005176-199502000-00005] [PMID: ] [DOI] [PubMed] [Google Scholar]
Rochow 2020 {published data only (unpublished sought but not used)}
- Rochow N, Fusch G, Ali A, Bhatia A, So HY, Iskander R, et al. Individualized target fortification of breast milk with protein, carbohydrates, and fat for preterm infants: a double-blind randomized controlled trial. Clinical Nutrition 2020;S0261-5614(20):30303-8. [DOI: 10.1016/j.clnu.2020.04.031] [PMID: ] [DOI] [PubMed] [Google Scholar]
References to studies excluded from this review
Boehm 1993 {published data only}
- Boehm G, Borte M, Bellstedt K, Moro G, Minoli I. Protein quality of human milk fortifier in low birth weight infants: effects on growth and plasma amino acid profiles. Europena Journal of Pediatrics 1993;152(12):1036-9. [DOI: 10.1007/BF01957232] [PMID: ] [DOI] [PubMed] [Google Scholar]
Kanmaz 2013 {published data only}
- Kanmaz HG, Mutlu B, Canpolat FE, Erdeve O, Oguz SS, Uras N, et al. Human milk fortification with differing amounts of fortifier and its association with growth and metabolic responses in preterm infants. Journal of Human Lactation 2013;29(3):400-5. [DOI: 10.1177/0890334412459903] [PMID: ] [DOI] [PubMed] [Google Scholar]
Maas 2017 {published data only}
- Maas C, Mathes M, Bleeker C, Vek J, Bernhard W, Wiechers C, et al. Effect of increased enteral protein intake on growth in human milk-fed preterm infants: a randomized clinical trial. JAMA Pediatrics 2017;171(1):16-22. [DOI: 10.1001/jamapediatrics.2016.2681] [PMID: ] [DOI] [PubMed] [Google Scholar]
Mathes 2018 {published data only}
- Mathes M, Maas C, Bleeker C, Vek J, Bernhard W, Peter A, et al. Effect of increased enteral protein intake on plasma and urinary urea concentrations in preterm infants born at < 32 weeks gestation and < 1500 g birth weight enrolled in a randomized controlled trial - a secondary analysis. BioMed Central Pediatrics 2018;18(1):154. [DOI: 10.1186/s12887-018-1136-5] [PMID: ] [DOI] [PMC free article] [PubMed] [Google Scholar]
McLeod 2016 {published data only}
- McLeod G, Sherriff J, Hartmann PE, Nathan E, Geddes D, Simmer K. Comparing different methods of human breast milk fortification using measured v. assumed macronutrient composition to target reference growth: a randomised controlled trial. British Journal of Nutrition 2016;115(3):431-9. [DOI: 10.1017/S0007114515004614] [PMID: ] [DOI] [PubMed] [Google Scholar]
Morlacchi 2016 {published data only}
- Morlacchi L, Mallardi D, Gianni ML, Roggero P, Amato O, Piemontese P, et al. Is targeted fortification of human breast milk an optimal nutrition strategy for preterm infants? An interventional study. Journal of Translational Medicine 2016;14(1):195. [DOI: 10.1186/s12967-016-0957-y] [PMID: ] [DOI] [PMC free article] [PubMed] [Google Scholar]
Quan 2019 {published data only}
- Quan M, Wang D, Gou L, Sun Z, Ma J, Zhang L, et al. Individualized human milk fortification to improve the growth of hospitalized preterm infants. Nutrition in Clinical Practice 2019:Online ahead of print. [DOI: 10.1002/ncp.10366] [PMID: ] [DOI] [PubMed] [Google Scholar]
References to studies awaiting assessment
Brion 2020 {published data only}
- Brion LP, Rosenfeld CR, Heyne R, Brown LS, Lair CS, Petrosyan E, et al. Optimizing individual nutrition in preterm very low birth weight infants: double-blinded randomized controlled trial. Journal of Perinatology 2020;40(4):655-65. [DOI: 10.1038/s41372-020-0609-1] [PMID: ] [DOI] [PubMed] [Google Scholar]
Additional references
AAP 1977
- American Academy of Pediatrics Committee on Nutrition. Nutritional needs of low-birth-weight infants. Pediatrics 1977;60(4):519-30. [PMID: ] [PubMed] [Google Scholar]
AAP 2012
- American Academy of Pediatrics. Breastfeeding and the use of human milk. Pediatrics 2012;129(3):e827-41. [DOI: 10.1542/peds.2011-3552] [PMID: ] [DOI] [PubMed] [Google Scholar]
Adamkin 2014
- Adamkin DH, Radmacher PG. Fortification of human milk in very low birth weight infants (VLBW <1500 g birth weight). Clinics in Perinatology 2014;41(2):405-21. [DOI: 10.1016/j.clp.2014.02.010] [PMID: ] [DOI] [PubMed] [Google Scholar]
Agostoni 2010
- Agostoni C, Buonocore G, Carnielli VP, De Curtis M, Darmaun D, Decsi T, et al, ESPGHAN Committee on Nutrition. Enteral nutrient supply for preterm infants: commentary from the European Society for Paediatric Gastroenterology, Hepatology, and Nutrition Committee on Nutrition. Journal of Pediatric Gastroenterology and Nutrition 2010;50(1):85-91. [DOI: 10.1097/MPG.0b013e3181adaee0] [PMID: ] [DOI] [PubMed] [Google Scholar]
Alan 2013
- Alan S, Atasay B, Cakir U, Duran Y, Kilic A, Kahvecioglu D, et al. An intention to achieve better postnatal in-hospital growth for preterm infants: adjustable protein fortification of human milk. Early Human Development 2013;89(12):1017-23. [DOI: 10.1016/j.earlhumdev.2013.08.015] [PMID: ] [DOI] [PubMed] [Google Scholar]
Amissah 2018a
- Amissah EA, Brown J, Harding JE. Protein supplementation of human milk for promoting growth in preterm infants. Cochrane Database of Systematic Reviews 2018, Issue 6. [DOI] [PMC free article] [PubMed] [Google Scholar]
Amissah 2018b
- Amissah EA, Brown J, Harding JE. Carbohydrate supplementation of human milk to promote growth in preterm infants. Cochrane Database of Systematic Reviews 2018, Issue 8. [DOI] [PMC free article] [PubMed] [Google Scholar]
Amissah 2018c
- Amissah EA, Brown J, Harding JE. Fat supplementation of human milk for promoting growth in preterm infants. Cochrane Database of Systematic Reviews 2018, Issue 6. [DOI] [PMC free article] [PubMed] [Google Scholar]
Arslanoglu 2019
- Arslanoglu S, Boquien CY, King C, Lamireau D, Tonetto P, Barnett D, et al. Fortification of human milk for preterm infants: update and recommendations of the European Milk Bank Association (EMBA) Working Group on Human Milk Fortification. Frontiers in Pediatrics March 2019;7:76. [DOI: 10.3389/fped.2019.00076] [PMID: 30968003] [DOI] [PMC free article] [PubMed] [Google Scholar]
Bayley 1993
- Bayley N. Bayley Scales of Infant Development–II. San Antonio, Texas: Psychological Corporation, 1993. [Google Scholar]
Bayley 2005
- Bayley N. Bayley Scales of Infant and Toddler Development. 3rd edition. San Antonio, TX: Harcourt Assessment, 2005. [Google Scholar]
Bell 1978
- Bell M, Ternberg J, Feigin R, Keating J, Marshall R, Barton L, et al. Neonatal necrotizing enterocolitis. Therapeutic decisions based upon clinical staging. Annals of Surgery 1978;187(1):1-7. [DOI: 10.1097/00000658-197801000-00001] [PMID: ] [DOI] [PMC free article] [PubMed] [Google Scholar]
Brown 2020
- Brown JV, Lin L, Embleton ND, Harding JE, McGuire W. Multi-nutrient fortification of human milk for preterm infants. Cochrane Database of Systematic Reviews 2020, Issue 6. [DOI: 10.1002/14651858] [DOI] [PMC free article] [PubMed] [Google Scholar]
Clark 2003
- Clark R, Thomas P, Peabody J. Extrauterine growth restriction remains a serious problem in prematurely born neonates. Pediatrics 2003;111(5 Pt1):986-90. [DOI: 10.1542/peds.111.5.986] [PMID: ] [DOI] [PubMed] [Google Scholar]
Ehrenkranz 1999
- Ehrenkranz R, Younes N, Lemons J, Fanaroff A, Donovan E, Wright L, et al. Longitudinal growth of hospitalized very low birth weight infants. Pediatrics 1999;104(2 Pt 1):280-9. [DOI: 10.1542/peds.104.2.280] [PMID: ] [DOI] [PubMed] [Google Scholar]
Ehrenkranz 2006
- Ehrenkranz RA, Dusic AM, Vohr BR, Wright LL, Wrage LA, Poole WK. Growth in the neonatal intensive care unit influences neurodevelopmental and growth outcomes of extremely low birth weight infants. Pediatrics 2006;117(4):1253-61. [DOI: 10.1542/peds.2005-1368] [PMID: ] [DOI] [PubMed] [Google Scholar]
Ehrenkranz 2014
- Ehrenkranz RA. Extrauterine growth restriction: is it preventable? Jornal de Pediatria 2014;90(1):1-3. [DOI: 10.1016/j.jped.2013.10.003] [PMID: ] [DOI] [PubMed] [Google Scholar]
Embleton 2001
- Embleton NE, Pang N, Cooke RJ. Postnatal malnutrition and growth retardation: an inevitable consequence of current recommendations in preterm infants? Pediatrics 2001;107(2):270-3. [DOI: 10.1542/peds.107.2.270] [PMID: ] [DOI] [PubMed] [Google Scholar]
GRADEpro GDT [Computer program]
- GRADEpro GDT. Version accessed 05/25/2020. Hamilton (ON): McMaster University (developed by Evidence Prime). Available at gradepro.org.
Griffin 2016
- Griffin IJ, Tancredi DJ, Bertino E, Lee HC, Profit J. Postnatal growth failure in very low birthweight infants born between 2005 and 2012. Archives of Disease in Childhood. Fetal and Neonatal Edition 2016;101(1):F50-5. [DOI: 10.1136/archdischild-2014-308095] [PMID: ] [DOI] [PubMed] [Google Scholar]
Higgins 2011a
- Higgins JP, Altman DG, Sterne JA, on behalf of the Cochrane Statistical Methods Group and the Cochrane Bias Methods Group. Chapter 8. Assessing risk of bias in included studies. In: Higgins JP, Green S, editor(s). Cochrane Handbook for Systematic Reviews of Interventions Version 5.1.0 (updated March 2011). The Cochrane Collaboration, 2011. Available from handbook.cochrane.org.
Higgins 2011b
- Higgins JP, Green S, editor(s). Cochrane Handbook for Systematic Reviews of Interventions Version 5.1.0 (updated March 2011). The Cochrane Collaboration, 2011. Available from handbook.cochrane.org.
Higgins 2019
- Higgins JPT, Eldridge S, Li T. Chapter 23. Including variants on randomized trials, Section 23.3. Studies with more than two intervention groups. In: Higgins JPT, Thomas J, Chandler J, Cumpston M, Li T, Page MJ, Welch VA, editors(s). Cochrane Handbook for Systematic Reviews of Interventions Version 6.0 (updated July 2019). Available from www.training.cochrane.org/handbook. Cochrane, 2019. [Google Scholar]
Horbar 2015
- Horbar JD, Ehrenkranz RA, Badger GJ, Edwards EM, Morrow KA, Soll RF, et al. Weight growth velocity and postnatal growth failure in infants 501 to 1500 grams: 2000-2013. Pediatrics 2015;136(1):e84-92. [DOI: 10.1542/peds.2015-0129] [PMID: ] [DOI] [PubMed] [Google Scholar]
Hu 2019
- Hu F, Tang Q, Wang Y, Wu J, Ruan H, Lu L, et al. Analysis of nutrition support in very low-birth-weight infants with extrauterine growth restriction. Nutrition in Clinical Practice 2019;34(3):436-43. [DOI: 10.1002/ncp.10210] [PMID: 30421458] [DOI] [PMC free article] [PubMed] [Google Scholar]
Jobe 2001
- Jobe AH, Bancalari E. Bronchopulmonary dysplasia. American Journal of Respiratory and Critical Care Medicine 2001;163(7):1723-9. [DOI: 10.1164/ajrccm.163.7.2011060] [PMID: ] [DOI] [PubMed] [Google Scholar]
Kohn 2020
- Kohn MA, Senyak J. Sample Size Calculators [website]. UCSF CTSI. 27 July 2020. Available at https://www.sample-size.net/ (accessed 19 August 2020).
Lawrence 2011
- Lawrence RA, Lawrence RM. Breastfeeding: A Guide for the Medical Professional. 7th edition. St Louis, MO: Mosby (Elsevier), 2010. [Google Scholar]
Luo 2018
- Dehui L, Xiang W, Jiming L, Tiejun T. Optimally estimating the sample mean from the sample size, median, mid-range, and/or mid-quartile range. Statistical Methods in Medical Research 2018;27(6):1785–805. [DOI] [PubMed] [Google Scholar]
Median to Mean Calculator 2020
- Estimating the sample mean and standard deviation from the sample size, median, range and/or interquartile range. http://www.math.hkbu.edu.hk/~tongt/papers/median2mean.html. (accessed 29 May 2020). [DOI] [PMC free article] [PubMed]
Moore 2011
- Moore TA, Wilson ME. Feeding intolerance: a concept analysis. Advances in Neonatal Care 2011;11(3):149-54. [DOI: 10.1097/ANC.0b013e31821ba28e] [PMID: ] [DOI] [PubMed] [Google Scholar]
Ofek Shlomai 2014
- Ofek Shlomai N, Reichman B, Lerner-Geva L, Boyko V, VBar-Oz B. Population-based study shows improved postnatal growth in preterm very-low-birthweight infants between 1995 and 2010. Acta Paediatrica 2014;103(5):498-503. [DOI: 10.1111/apa.12569] [PMID: ] [DOI] [PubMed] [Google Scholar]
Patel 2005
- Patel AL, Engstrom JL, Meier PP, Kimura RE. Accuracy of methods for calculating postnatal growth velocity for extremely low birth weight infants. Pediatrics 2005;116(6):1466-73. [DOI: 10.1542/peds.2004-1699] [PMID: ] [DOI] [PubMed] [Google Scholar]
Premkumar 2019
- Premkumar MH, Pammi M, Suresh G. Human milk-derived fortifier versus bovine milk-derived fortifier for prevention of mortality and morbidity in preterm neonates. Cochrane Database of Systematic Reviews 2019, Issue 11. [DOI] [PMC free article] [PubMed] [Google Scholar]
Radmacher 2013
- Radmacher PG, Lewis SL, Adamkin DH. Individualizing fortification of human milk using real time human milk analysis. Journal of Neonatal-Perinatal Medicine 2013;6(4):319-23. [DOI: 10.3233/NPM-1373113] [PMID: ] [DOI] [PubMed] [Google Scholar]
Radmacher 2017
- Radmacher PG, Adamkin DH. Fortification of human milk for preterm infants. Seminars in Fetal & Neonatal Medicine 2017;22(1):30-5. [DOI: 10.1016/j.siny.2016.08.004] [PMID: ] [DOI] [PubMed] [Google Scholar]
Review Manager 2014 [Computer program]
- Review Manager 5 (RevMan 5). Version 5.3. Copenhagen: Nordic Cochrane Centre, The Cochrane Collaboration, 2014.
Rochow 2013
- Rochow N, Fusch G, Choi A, Chessell L, Elliott L, McDonald K, et al. Target fortification of breast milk with fat, protein and carbohydrates for preterm infants. Journal of Pediatrics 2013;163(4):1001-7. [DOI: 10.1016/j.jpeds.2013.04.052] [PMID: ] [DOI] [PubMed] [Google Scholar]
Saarela 2005
- Saarela T, Kojjonen J, Koivisto M. Macronutrient and energy contents of human milk fractions during the first six months of life. Acta Paediatrica 2005;94(9):1176-81. [DOI: 10.1111/j.1651-2227.2005.tb02070.x] [PMID: ] [DOI] [PubMed] [Google Scholar]
Sammallahti 2014
- Sammallahti S, Pyhälä R, Lahti M, Lahti J, Pesonen AK, Heinonen K, et al. Infant growth after preterm birth and neurocognitive abilities in young adulthood. Journal of Pediatrics 2014;165(6):1109-15.e3. [DOI: 10.1016/j.jpeds.2014.08.028] [PMID: ] [DOI] [PubMed] [Google Scholar]
Sauer 2011
- Sauer CW, Kim JH. Human milk macronutrient analysis using point-of-care near infrared spectrophotometry. Journal of Perinatology 2011;31(5):339-43. [DOI: 10.1038/jp.2010.123] [PMID: ] [DOI] [PubMed] [Google Scholar]
Schünemann 2013
- Schünemann H, Brożek J, Guyatt G, Oxman A, editors, Grade Working Group. Handbook for grading the quality of evidence and the strength of recommendations using the GRADE approach (updated October 2013). GRADE Working Group, 2013. Available from gdt.guidelinedevelopment.org/app/handbook/handbook.html.
Thanigainathan 2020
- Thanigainathan S, Abiramalatha T. Early fortification of human milk versus late fortification to promote growth in preterm infants. Cochrane Database of Systematic Reviews 2020, Issue 7. [DOI] [PMC free article] [PubMed] [Google Scholar]
US Food and Drug Administration 2018
- US Food and Drug Administration. FDA permits marketing of a diagnostic test to aid in measuring nutrients in breast milk. US FDA website: online news article 2018. Retrieved 25 August 2019, from www.fda.gov/news-events/press-announcements/fda-permits-marketing-diagnostic-test-aid-measuring-nutrients-breast-milk.
Wake Forest/Baptist Medical Center 2018
- Wake Forest/Baptist Medical Center. Brenner Children's NICU is first in nation to use FDA-approved breast milk analyzer. Online news article 2018. Retrieved 25 August 2019 from newsroom.wakehealth.edu/News-Releases/2019/05/Brenner-Childrens-NICU-is-First-in-Nation-to-Use-FDA-Approved-Breast-Milk-Analyzer.
Wu 2018
- Wu X, Jackson RT, Khan SA, Ahuja J, Pehrsson PR. Human milk nutrient composition in the United States: current knowledge, challenges, and research needs. Current Developments in Nutrition 2018;2(7):nzy025. [DOI: 10.1093/cdn/nzy025] [PMID: ] [DOI] [PMC free article] [PubMed] [Google Scholar]
Young 2013
- Young L, Embleton ND, McCormick FM, McGuire W. Multinutrient fortification of human breast milk for preterm infants following hospital discharge. Cochrane Database of Systematic Reviews 2013, Issue 2. [DOI] [PMC free article] [PubMed] [Google Scholar]
References to other published versions of this review
Fabrizio 2019
- Fabrizio V, Trzaski JM, Brownell EA, Esposito P, Lainwala S, Lussier MM, et al. Targeted or adjustable versus standard diet fortification for growth and development in very low birth weight infants receiving human milk. Cochrane Database of Systematic Reviews 2019, Issue 11. Art. No: CD013465. [DOI: 10.1002/14651858.CD013465] [DOI] [PMC free article] [PubMed] [Google Scholar]