

Abstract
For some, glioma biomarkers have been expected to solve common diagnostic problems in routine neuropathology service caused by insufficient material, technical shortcomings or lack of experience. Further, biomarkers should predict patient outcome and direct optimal therapy for the individual patient. Unfortunately, current biomarkers still fall somewhat short of these grand expectations. While there has been some progress, it has generally been slow and in small steps. In this review, the newest set of glioma biomarkers: O6‐methylguanine‐DNA methyltransferase (MGMT) methylation, BRAF fusion and IDH1 mutation are discussed. MGMT methylation is well established as a prognostic/predictive marker for glioblastoma; however, technical questions regarding testing remain, it is not currently utilized widely in guiding patient management, and it has proven to be of no assistance in diagnostics. In contrast, BRAF fusion and IDH1 mutation analyses promise to be very helpful for classifying and grading gliomas, while their potential predictive value has yet to be established.
Keywords: biomarker, BRAF, glioma, IDH1, MGMT
MGMT PROMOTER HYPERMETHYLATION
Brief history
The gene encoding the O6‐methylguanine‐DNA methyltransferase (MGMT) has become one of the most, if not the most studied molecular marker in neurooncology since the first description of an association between MGMT promoter hypermethylation and response to alkylating drugs a decade ago (23). However, the interest in this gene was particularly enhanced in 2005 by the publication of Hegi et al showing in a prospective phase III trial, that glioblastoma (GBM) patients with methylated MGMT promoter status demonstrated a significant survival advantage with temozolomide treatment (39). Nonetheless, the dealkylating function of MGMT had already been described in the early 1980s 69, 72, with its cDNA being cloned 10 years later (87). In 1999, promoter hypermethylation was found to be the main inactivating mechanism of this gene in a broad variety of human cancers (22).
Distribution of MGMT promoter hypermethylation in tumor entities
MGMT promoter hypermethylation has been identified in a wide range of human cancers, including lung‐, head and neck‐, pancreatic‐, renal‐ and bladder carcinomas, as well as lymphomas, leukemias and melanoma (22). The reported frequency of MGMT promoter hypermethylation in gliomas varies widely. In clinical studies, it has ranged from 35% to 73% in GBM 8, 9, 10, 17, 18, 21, 23, 38, 39, 40, 74, 90, 96, 97, 98, 101. In diffusely infiltrating anaplastic gliomas [World Health Organization (WHO) grade III], it has been found in 50%–84% 7, 91, 99, while 43%–93% of the WHO grade II counterparts are reportedly positive 24, 51, 52. The substantial range of reported MGMT promoter hypermethylation frequencies is probably at least partially due to technical challenges (see below).
Mechanisms of action, tumor inactivation and chemosensitivity
The MGMT gene located on 10q26 has five exons and a CpG‐rich island of 763 bp with 98 CpG sites encompassing the first exon and large parts of the promoter. A minimal promoter and an enhancer region are located within the CpG island (Figure 1) (65). In normal tissue, most CpG sites within the island are unmethylated. In tumors, the cytosine in CpG sites often carries a methyl group, thereby increasing the affinity of proteins like methyl‐CpG‐binding protein 2 and methyl‐CpG‐binding domain protein 2 to the DNA. These proteins subsequently alter the chromatin structure and prevent binding of transcription factors, thereby silencing expression of MGMT (65).
Figure 1.

Genomic area covering the promoter, CpG island and exon 1 of O6‐methylguanine‐DNA methyltransferase (MGMT). Genomic data based on University of California Santa Cruz (UCSC) Genome Browser February 2009 assembly (http://genome.ucsc.edu/), chromosome 10 genomic contig GL000100.1 (GenBank)—a web‐based service offered by the NIH, MGMT sequence: NM_002412.3 (GenBank), CpG island predicted by UCSC Genome Bioinformatics position chr10: 131 264 949–131 265 710. Whole promoter DNA sequence according to (35). Minimal promoter region, enhancer region, upstream highly methylated region and downstream highly methylated region according to (65). CpG sites with best correlation between methylation status and MGMT expression according to (25). Methylation‐specific PCR (MS‐PCR) primers according to 23, 39, 99. Pyrosequencing region according to (62). HhaI cleaving sites used for methylation‐specific multiplex ligation dependent probe amplification (MS‐MLPA) according to (47). Real‐time‐MS‐PC (RT‐MS‐PCR) region according to (92).
MGMT is a suicide DNA repair protein that normally catalyzes the transfer of a methyl group from the O6‐position of a guanine DNA nucleotide to a cysteine residue at its own position 145. This alkylation of MGMT is a one‐way process, with alkylated MGMT ultimately targeted for degradation (30). In gliomas, this is relevant because application of alkylating chemotherapeutic drugs like temozolomide cause, among other actions, the binding of an alkyl group to the O6‐position of guanine, thereby inducing DNA‐mismatching, DNA‐double‐stand breakage and ultimately apoptosis in proliferating cells. Thus, MGMT protein counteracts the normally lethal effect of temozolomide by repairing DNA damage. When a tumor has a hypermethylated MGMT promoter, the hypothesis is that MGMT expression is reduced and the cytotoxic effects of alkylating drugs are then enhanced.
Yet, this widely accepted and intuitive concept that MGMT promoter hypermethylation acts as a chemosensitizer recently became challenged by the observation that patients suffering from anaplastic gliomas with hypermethylated MGMT similarly exhibited a survival benefit when treated with radiotherapy alone 90, 99. Therefore, it remains unclear whether MGMT also plays a role in repairing radiotherapy‐induced DNA damage, if other DNA repair genes are silenced by promoter hypermethylation in addition to MGMT, or if the survival advantages are better explained by other prognostically favorable genetic alterations like the 1p/19q codeletions 6, 63, 90 and IDH1 mutations (80) that often coexist with MGMT promoter hypermethylation.
Clinical relevance
In one of the most important series on therapy of patients with newly diagnosed GBM in the last decade and its follow‐up study, it was shown that those patients with a hypermethylated MGMT promoter demonstrated survival rates of 49% and 14% at 2 and 5 years respectively, when treated with concomitant and adjuvant temozolomide and radiotherapy. In contrast, estimated 2‐ and 5‐year survival rates were only 24% and 5% respectively, in similar patients that were initially treated with radiotherapy alone. GBM patients whose tumors lacked MGMT hypermethylation demonstrated 2‐ and 5‐year survival rates of 15% and 8% when they received combined radiochemotherapy, which dropped to only 2% and 0% when treated with radiotherapy alone 39, 85, 86. As such, temozolomide response was most dramatic in the methylation‐positive group, yet there was some advantage even in the non‐methylated cohort. Given this data, the fact that temozolomide is a well‐tolerated oral drug, and that few highly efficacious alternatives are currently available, most neuro‐oncologists still opt to treat their patients with this drug first, regardless of MGMT status. Nevertheless, multiple studies have subsequently confirmed the observation that MGMT promoter hypermethylation is one of the strongest prognostic factors for patients with newly diagnosed GBM and that it is a potent predictor for response to treatment with alkylating drugs 23, 31, 38, 40, 97, even in elderly patients (9). Furthermore, MGMT promoter hypermethylation was identified as the only molecular marker that was enriched in so‐called long‐term survivors of GBM (OS > 36 months) (54). However, prolonged survival can be seen without MGMT promoter hypermethylation, indicating the existence of other factors conferring this favorable prognosis 54, 64. So, while testing currently provides powerful prognostic information, its role in guiding patient management is more tenuous. Presumably however, as additional and perhaps more targeted therapeutic options become available, MGMT testing may become all the more important for patient management.
The role of MGMT testing in patients with WHO grade II or III diffuse gliomas is even less clear at this time. In anaplastic gliomas, MGMT promoter hypermethylation is associated with longer progression free survival for patients treated either by radiochemotherapy or radiation alone 90, 99. A predictive role of MGMT promoter hypermethylation for response to temozolomide treatment was documented for grade II gliomas 24, 51. However, a positive prognostic effect of MGMT promoter hypermethylation was not found for patients with WHO grade II astrocytomas (A II) (52) and oligodendrogliomas (O II) (94), who received no alkylating chemotherapy.
METHODS FOR MGMT ANALYSIS
MGMT promoter hypermethylation assays
Technical limitations of all available methods used in a routine setting prohibit analysis of all 98 CpG sites. Generally, each method focuses on only a couple of CpG sites based on the assumption that they reflect the methylation status of the whole CpG island, in turn predicting patient response to alkylating drugs. Yet, the methylation pattern is not always homogeneous and methods targeting different CpG sites may yield conflicting results (25). Only a few reports are available that allow conclusions regarding methylation of the majority of the CpG sites in gliomas. By clonal sequencing, Nakagawachi et al determined the methylation pattern of all CpG sites in glioma cells that did not express MGMT. They identified an upstream highly methylated region (UHMR) and a downstream highly methylated region (DHMR) and a region in between with varying methylation (65). According to their data, all CpG sites of the methylation‐specific polymerase chain reaction (MS‐PCR) and the commercially available pyrosequencing assay (see below) are located within the DHMR. Everhard et al analyzed the methylation profile of 52 CpG sites by pyrosequencing in GBM and compared the results with MGMT mRNA expression. In this way, they were able to identify six single CpG sites and two CpG regions that best correlated with overall expression. Only a partial overlap between these CpG sites and the CpG sites tested by the routine assays was observed (25) (Figure 1).
Most clinical studies have used MS‐PCR as first introduced by Esteller et al (22) to compare MGMT status with survival and therapeutic response. As such, MS‐PCR has become the standard method for MGMT testing to date. Five to nine CpG sites are usually covered by MS‐PCR, in which DNA bisulfite treatment converts unmethylated cytosine to uracil. Next, PCR amplification is done with two different primer pairs that align to regions encompassing those specific CpG sites. One primer pair is specific for methylated, “non‐uracilized” DNA, while the other is designed for DNA in which cytosine residues have been converted to uracil. In this way, converted and unconverted CpG sites can be distinguished from each other. In addition to the MGMT promoter, a completely unmethylated fragment of DNA (eg, COL2A1 promoter) and a completely methylated sample are often used as negative and positive controls, respectively. Finally, PCR products are visualized on an agarose gel. But while this method does not require expensive equipment and is widely established, the bisulfite reaction requires a great deal of technical expertise and is rather labor‐intensive. Also, MS‐PCR is frequently used with an increased number of PCR cycles and may result in false positive amplification. Depending on numerous factors, PCR efficiency varies, and therefore, the reproducibility is not as high as one would like for a clinical assay.
An improvement on MS‐PCR is real‐time MS‐PCR which allows a higher quantity of standardization, greater throughput and the definition of a cut‐off (92). In this variant, a methylation‐specific probe has an attached fluorophore and quencher, sitting between primer sites. After the primers hybridize and initiate PCR, the probe is degraded by an exonuclease that acts during the extension phase of PCR. This results in separation of the fluorophore from the quencher, with fluorescence being quantifiable. Results can be expressed as the ratio of methylation‐specific amplification of the tumor MGMT gene to the COL2A1 reference gene, that is the methylation index (MI). Based on prior work (90), an MI less than 4 is negative, an MI between 4 and 16 has a low level of methylation with uncertain clinical significance, and an MI greater than 16 is considered methylated.
Another attractive alternative is methylation‐specific pyrosequencing (62). This method also requires DNA bisulfite treatment as the initial step, followed by sequencing of a short DNA fragment covering usually five CpG sites using a luciferase‐based detection mechanism. Primers can be individually designed, but a commercial kit is available. The method allows analysis of highly fragmented DNA and is therefore robust and reproducible in formalin‐fixed, paraffin‐embedded clinical tissues. However, methylation‐specific pyrosequencing requires expensive equipment and the costs per sample are high if only a few cases are analyzed per run. An unsolved issue is the quantitative character of the results: each of the five tested CpG sites are assigned a value between 0 and 100% which needs to be finally condensed to a qualitative +/− result (Figure 2). No clinical study has yet been produced that allows a valid definition of an algorithm to calculate such a threshold. An example of an ambiguous result is depicted in Figure 2C.
Figure 2.
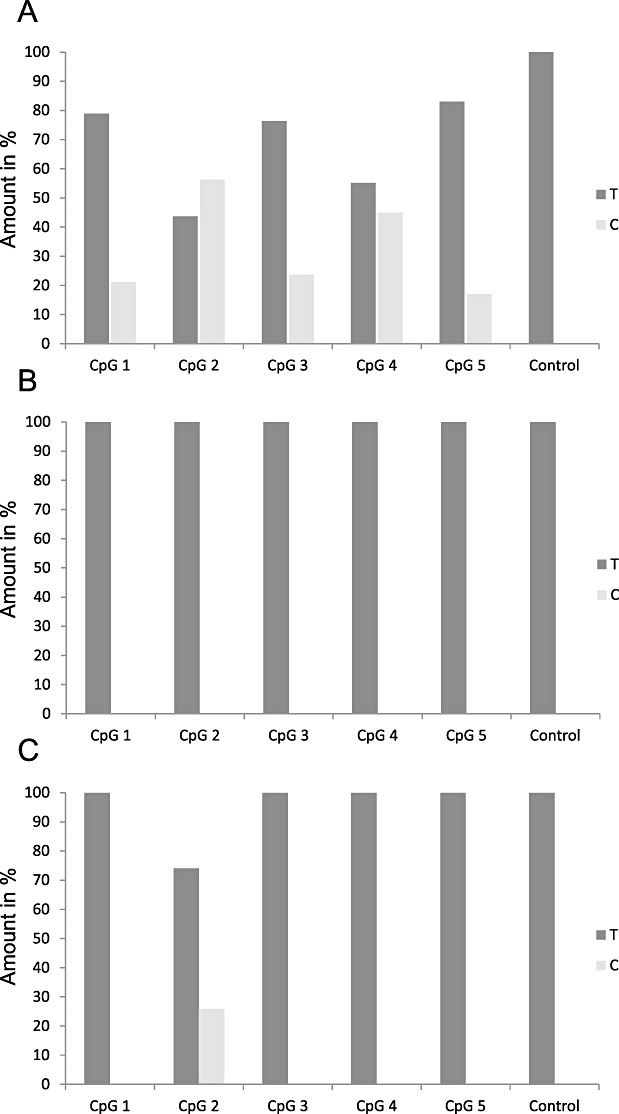
Bar plot showing different results for MGMT promoter hypermethylation analysis by pyrosequencing according to (62) . T: amount of thymidine in %. C: amount of cytosine in %. CpG 1—5: the different CpG sites. Control: a cytosine not followed by guanine that always becomes converted to 100% uracil/thymidine when DNA bisulfite treatment was successful. A. Nonambiguous pattern indicating methylation of all five CpG sites between 17% and 53%. B. Nonambiguous pattern indicating no methylation of all five CpG sites. C. Methylation of only CpG site no. 2 with 26%.
Another method suitable for routine diagnostics that generates quantitative methylation data is methylation‐specific multiplex ligation dependent probe amplification (MS‐MLPA) (47). MS‐MLPA was successfully used to analyze the tumor samples of the large European Organization for Research and Treatment of Cancer (EORTC) 26951 study for MGMT promoter hypermethylation (90). MS‐MLPA does not require a DNA consuming bisulfite treatment step. After probe annealing and ligation, digestion with the restriction enzyme HhaI only cuts DNA at unmethylated CpG sites. Finally, probes are amplified by PCR and visualized by fragment analysis together with a non‐HhaI digested control sample. The short probe annealing sequence should allow analysis of highly fragmented DNA. However, MS‐MLPA requires HhaI restriction sites within a CpG island and only one of the three suitable MGMT CpG sites are located within the region that is commonly analyzed by MS‐PCR or pyrosequencing (Figure 1). Furthermore, similar to pyrosequencing, quantitative MS‐MLPA data require an algorithm to calculate a qualitative +/− threshold. In our hands MS‐MLPA emerged as a less reliable method when formalin‐fixed paraffin‐embedded tissue (FFPE) was analyzed.
MGMT protein‐based assays
Immunohistochemistry (IHC) would seem to be the most direct and convenient assay to determine amount of actual MGMT protein. Although some studies have reported an association between IHC‐based MGMT expression and response to alkylating drugs in gliomas 3, 11, 15, 46, 58, the technique is fraught with problems. In glial tumors, various non‐neoplastic cells including lymphocytes, microglia, blood vessel cells and reactive astrocytes all express MGMT, thereby hampering targeted IHC‐based evaluation of tumor cells (26). A high interobserver variability has thus been reported and the cut‐off levels in the literature for positive staining have ranged from >10% to >50% positive cells (76). Finally, many researchers have failed to identify an association between IHC results and either MGMT methylation status based on MS‐PCR or patient survival/chemosensitivity 32, 55, 76, 77. Detection of MGMT mRNA expression is an alternative to IHC but currently no clinical study is available that has utilized this method. Measurement of enzymatic MGMT activity could potentially provide a more accurate assessment at the mechanistic level, but no study has demonstrated a value to this approach in a clinical setting to date. Both methods suffer from a dependence on fresh frozen tissue and otherwise elaborate, error‐prone methodology. Both also suffer the same risk of false‐negative “dilution” by non‐neoplastic MGMT‐producing cells.
CONSEQUENCES
Impact on diagnostic aspects
Due to demand by neuro‐oncologists for MGMT methylation status on their patients' tumors, some neuropathology departments already offer this test. However, in different labs, various methods of testing across diverse CpG sites are applied and even if MS‐PCR is chosen, the same primers and conditions are not always used, making it difficult to assess inter‐laboratory concordance rates. As a result, divergent results are sometimes generated if the same tumor is analyzed in multiple laboratories. To avoid doubts regarding the quality of MGMT testing, a methodological standardization combined with round‐robin testing organized by national neuropathology and molecular pathology societies is recommended. Commercially available MGMT test kits may enhance inter‐laboratory reproducibility. An alternative and less desirable approach would be to delegate MGMT promoter hypermethylation analysis to external commercial companies, who are less likely to have skill in glioma tissue evaluation and would not interpret the data in the overall context of other clinicopathological features.
A growing debate in the neuropathology community revolves around whether or not MGMT status should be incorporated into the next revision of the WHO classification scheme for central nervous system (CNS) tumors. Multiple studies (see above) clearly indicate that GBM can be separated into two biologically different groups based on MGMT status, potentially justifying incorporation of this variable in the next WHO classification. However, molecular assays are still not available worldwide and the WHO classification remains primarily a morphology‐based system for tumor stratification, aimed at the broadest audience possible.
Impact on clinical practice
Patients suffering from GBM do appear to benefit from concomitant and adjuvant temozolomide therapy when MGMT promoter is hypermethylated (39). However, as already mentioned, the lack of good alternative treatment options for patients with unmethylated GBMs and the small documented number of such patients that still respond to such therapy argues for the commonly utilized approach of trying temozolomide treatment first, independent of the MGMT status. Thus, routine MGMT analysis does not appear essential for patient management at this time, although MGMT testing in new glioma clinical trials has become a conditio sine qua non so adequate comparisons with the current standard of care can be made.
Conclusions
Currently, MGMT is one of the most requested molecular assays in clinical neuro‐oncology. Due to lack of therapeutic alternatives, MGMT evaluation is only currently essential for clinical trials, although that is likely to change once effective alternative therapies besides temozolomide are identified. A range of new methodologies have become available for MGMT testing that potentially allow higher levels of sensitivity, specificity, robustness, and reproducibility. However, clinical studies that critically compare these new assays to the current “gold standard” of MS‐PCR are urgently needed. Furthermore, systematic analyses to identify which CpG sites best reflect treatment outcome and patient survival are still lacking.
BRAF FUSIONS
Brief history
RAF kinases are part of the mitogen‐activated protein kinase (MAPK) cascade, a pathway that ultimately leads to the regulation of a wide range of substrates, including transcription factors and other protein kinases that control cell proliferation, differentiation and apoptosis. Oncogenic activation of BRAF has been well documented in many tumors (67). However, this usually results from point mutation rather than gene rearrangement, with a hotspot at residue 600 (BRAFV600E). An activating rearrangement of BRAF in a primary tumor was first reported in four papillary thyroid carcinomas, where an AKAP9:BRAF fusion was described (16). Translocations involving BRAF have also been reported in large congenital melanocytic nevi (67). Among astrocytic neoplasms, sporadic and hereditary (NF1 associated) pilocytic astrocytomas (PA I) share constitutive activation of the MAPK pathway. A few studies have characterized the proto‐oncogene BRAF as a particularly important factor in the pathogenesis of PA I in childhood 73, 88. Most notably, duplication of the BRAF locus at 7q34 with consecutive up‐regulation of BRAF expression and MAPK target genes such as CCND1, was found in more than 50% of these tumors (73). Several subsequent studies confirmed similar or even higher frequencies of BRAF tandem duplications in PA I 2, 28, 42, 45, 48, 49, 56, 83. Moreover, a few studies showed that tandem duplication at 7q34 leads to a fusion between KIAA1549 and BRAF in approximately 70% of these tumors 48, 49, 56, 83.
Distribution of KIAA1549:BRAF fusion in tumor entities
The KIAA1549:BRAF fusion in PA I has been found across all age groups and in various tumor locations, including cerebellum, cerebral hemispheres, hypothalamus, optic nerve and brain stem, although some studies revealed that BRAF duplication/fusion is a more frequent event in cerebellar PA I 28, 48, 49, 83. In contrast, BRAF gene fusion is a rare event in diffusely infiltrating gliomas, instead often containing BRAF point mutations, whereas, for example, BRAF V600E is found in approximately 25% of grade II–IV pediatric astrocytomas 53, 81. Occurrence and distribution of KIAA1549:BRAF fusions in other brain tumor subtypes are still unknown.
Mechanism of action
Genomic sequencing has revealed a few breakpoint variants: KIAA1549 exon16–BRAF exon 9, KIAA1549 exon 15–BRAF exon 9, KIAA1549 exon19–BRAF exon 9, KIAA1549 exon18–BRAF exon 10 and KIAA1549 exon 16–BRAF exon 11 28, 48, 49, 83, 88. The common thread through all these breakpoint variants is the formation of an oncogenic BRAF‐KIAA1549 fusion incorporating the BRAF kinase domain but lacking the amino‐localized auto‐inhibitory domain. This truncated BRAF, is constitutively active 48, 83, 88. While such activity likely is tumorigenic, it is interesting to note that constitutive activation of BRAF can lead to oncogene‐induced senescence in slowly growing benign tumors. An alternate mechanism of MAPK pathway activation in PA I constitutes tandem duplication at 3p25 in approximately 2% of cases leading to an in‐frame oncogenic fusion between SRGAP3 and RAF1, the latter of which shares high sequence homology with BRAF 28, 49, 56. In general, RAF gene fusion variants have been found in 80% of PA I and thus constitutes a hallmark aberration in this tumor entity.
Clinical relevance
Prognostic significance of the KIAA1549:BRAF fusion, if any, is still unclear, although a few studies have found no differences in survival between tumors with and without BRAF duplication/fusion 28, 42, 45, 48. Nevertheless, the frequent BRAF alteration in PA I may serve as a novel therapeutic target for pharmacological inhibition of the MAPK pathway, particularly in tumors that are difficult to fully excise surgically 75, 78, 88. Previous in vitro studies have revealed that stable silencing of BRAF through lentiviral transduction with inhibition of Map/Erk kinase (MEK)1/2 blocked proliferation and arrested growth of glioma cells (73). In addition, analysis of the KIAA1549:BRAF fusion might be very helpful for differential diagnosis between PA I and A II, especially in combination with mutational analyses of the IDH1/2 genes 53, 81.
METHODS FOR KIAA1549:BRAF FUSION ANALYSIS
Fusion detection in genomic DNA
For the mapping of breakpoints on genomic level, long‐distance inverse PCR (LDI‐PCR) is applied (60). LDI‐PCR is based on the hydrolysis of tumor DNA using distinct combinations of restriction enzymes, self‐ligation of the resulting DNA fragments and a subsequent PCR reaction using a specific set of oligonucleotides. The analysis is followed by direct‐sequencing with corresponding primers, confirming the fusion.
Fusion detection in cDNA
To detect gene fusion, 5′ rapid amplification of cDNA ends (RACE) method is usually applied (48). RACE results in the production of a cDNA copy of the RNA sequence of interest, produced through reverse transcriptase PCR (RT‐PCR) assay. The amplified cDNA copies are then sequenced and, if a fusion is present, should map to a unique mRNA that contains exons from both fusion partners (Figure 4).
Figure 4.

Detection of KIAA1549/BRAF fusion by 5′ rapid amplification of cDNA ends (RACE) analysis. Sequence traces consequently demonstrating a fusion between KIAA1549 exon 15: BRAF exon 11, KIAA1549 exon 16: BRAF exon 9 and KIAA1549 exon 15: BRAF exon 9.
FISH (fluorescence in situ hybridization)
For interphase FISH analysis of KIAA1549:BRAF fusion, the simplest strategy is to use two fluorochrome‐conjugated probes: a FITC‐labeled clone RP11‐355D18 corresponding to KIAA1549 and a digoxigenin‐labeled clone 726N20 mapping to BRAF (53). The BRAF‐KIAA1549 gene fusion is defined in the cases showing nuclei with a single fusion red‐green or yellow signal in addition to the normal pair of split red and green signals (Figure 3). Signals are scored in at least 100 non‐overlapping, intact nuclei, and BRAF fusion is typically detected in 20%–50% of nuclei in positive cases. Non‐neoplastic control tissues do not reveal this pattern.
Figure 3.

Detection of KIAA1549/BRAF fusion by fluorescence in situ hybridization (FISH) analysis. Nucleus of pilocytic astrocytoma carrying tandem duplication of BRAF (red signals) and KIAA1549 (green signals) resulting in a fusion of these loci (yellow signal).
Conclusions
DNA‐ and RNA‐based methods for detection of KIAA1549:BRAF fusion are well‐standardized and may be universally applied but snap frozen tissue samples produce the most optimal and reproducible results. Unfortunately, most of these methods require special equipment and are not generally applicable for every day diagnostic practice. In terms of routine application, DNA‐based markers for FISH are particularly attractive because of their robustness and applicability to FFPE samples. Nevertheless, some obstacles for universal application of this method exist—such as difficulties in standardization of the optimal cut‐off levels for fusion detection, absence of reliable criteria to distinguish real gene fusion from randomly overlapping signals and finally, absence of commercially available probe sets.
IDH1 MUTATIONS
Brief history
IDH1 is no doubt the “new kid in town”, receiving considerable attention since the discovery of its relation with human gliomas. Mutations in IDH1 emerged as a surprising finding from a sequencing project addressing the genome of human GBM with 18/149 of these tumors exhibiting a heterozygous point mutation in codon 132 (70). Interestingly, these IDH1 mutations were associated with young patient age and the secondary glioblastoma (sGBM) pattern, tumors that evolved from previously confirmed lower grade gliomas. This observation drew attention to A II and anaplastic astrocytoma WHO grade III (A III), both of which were found to carry IDH1 mutations in the majority of cases 1, 33, 44, 68, 80, 84, 91, 95, 97, 99, 100. Even more provocative was the finding that IDH1 mutations were just as common in oligodendroglial tumors. Prior to this, much effort had been put in separating astrocytic from oligodendroglial tumors on a molecular level, with the general consensus being that TP53 mutations are more associated with diffuse astrocytomas while combined 1p/19q deletions predominantly occurred in oligodendroglial tumors. Therefore, the shared trait of IDH1 mutations in both astrocytic and oligodendroglial gliomas suggests a possible origin of both entities from a common precursor cell type. Apart from A II, A III, O II, anaplastic oligodendroglioma WHO grade III (O III), oligoastrocytoma WHO grade II (OA II), anaplastic oligoastrocytoma WHO grade III (OA III) and sGBM, IDH1 mutations have been described only in about 10% of acute myeloid leukemias 59, 93. With the exception of rare individual cases, all other neoplasms studied thus far are essentially negative for IDH1 mutations 4, 50, 79.
Distribution of IDH1 mutations in tumor entities
Mutations in the cytosolic NADP‐dependent isocitrate dehydrogenase (IDH1) gene have recently been detected in a fraction ranging between 50% and 80% of astrocytomas, oligodendrogliomas and oligoastrocytomas 1, 41, 44, 84, 95, 100. There is no difference regarding IDH1 mutation frequency between WHO grade II and WHO grade III tumors, with sGBM also exhibiting a comparable mutation rate. This is contrasted by the distinct rarity of IDH1 mutations in primary or de novo GBMs, arising in the absence of a lower‐grade precursor. Interestingly, the rates of IDH1 mutations in PA I and ependymal tumors, as well as in less common glial tumor entities are very low, providing diagnostic utility (1).
IDH1 mutations affect codon 132 in the vast majority of the cases and have been detected in only one of the parental alleles, with the remaining gene copy apparently being wild type. We sequenced the codon 132 region of IDH1 in more than 3000 primary human brain tumors and detected (as of August 2010) 1212 mutations. Major portions of these data have been reported in prior studies 1, 37, 97, 99, but the distribution of mutation types is summarized in Table 1. In gliomas, approximately 93% of the mutations are of the R132H type, followed by R132C exchanges in 4%, R132S and R132G mutations in approximately 1.5% each, and single R132L mutations.
Table 1.
Types of IDH1 mutations detected in 1212 brain tumors (Heidelberg). Abbreviation: N (%) = number of tumors with mutation and corresponding percentage of mutation type among all mutations.
| Nucleotide change | Amino acid change | N (%) |
|---|---|---|
| G395A | R132H | 1130 (93.2) |
| C394T | R132C | 45 (3.7) |
| C394A | R132S | 16 (1.3) |
| C394G | R132G | 14 (1.2) |
| G395T | R132L | 6 (0.5) |
| C394G, G395T | R132V | 1 (0.1) |
This contrasts with the situation in acute myeloid leukemia (AML), the only other tumor entity so far known to carry IDH1 mutations in a significant portion of tumors, where the distribution of IDH1 mutations is wider 34, 59, 93. Interestingly, mutations in mitochondrial NADP‐dependent isocitrate dehydrogenase (IDH2) gene also occur predominantly in astrocytomas, oligodendrogliomas, oligoastrocytomas and AML. IDH2 mutation are encountered in roughly 3% in gliomas (37), but are more frequent in AML 5, 71, 89.
Mechanism of action
Wild‐type IDH1 decarboxylates isocitrate to α‐ketoglutarate (aKG), thereby reducing NADP to NADPH(29). Several concepts for the tumorigenic potential of mutant IDH1 protein have been promulgated. First, the mutation at codon 132 affects the binding site for isocitrate. Hence, it is not surprising that the decarboxylating activity of mutant IDH1 protein is significantly reduced or obliterated 44, 100. Activity drops below 50% because of a dominant effect of the mutation via inhibition of heterodimeric IDH1 complexes (102). Thus, the amount of NADPH equivalents necessary for cellular protection from oxidative stress might be reduced resulting in an increase of reactive oxygen species with subsequent pro‐oncogenic DNA damage (57). Another hypothesis suggests that IDH1 mutations cause reduced production of aKG. Because aKG has prolylhydroxylase activity, it normally promotes degradation of HIF1‐a. Therefore, IDH1 mutations may promote tumor growth and angiogenesis by reducing inhibition of HIF1‐a (102).
However, the hypotheses described above do not entirely explain a peculiarity of IDH1 mutations, its nearly exclusively heterozygous nature, wherein only one of the two IDH1 alleles is affected and the other one is perfectly intact, in stark contrast to the two‐hit mechanism classically encountered in tumor suppressor genes. Heterozygous IDH1/2 mutations are more consistent with a gain of function, rather than a loss of function. More recent work has suggested just such a function, in which the mutant enzyme reduces aKG to 2‐hydroxyglutarate (2‐HG), in the process consuming NADPH. In support of this, gliomas carrying IDH1/2 mutations have tissue levels of 2‐HG that are 1–2 full orders of magnitude higher than comparable wild‐type tumors (19). Similarly, the serum of AML patients with IDH1 or IDH2 mutations also has markedly elevated 2‐HG (33). It bears mentioning, though, that a clear‐cut tumorigenic effect of 2‐HG has yet to be elucidated.
Clinical relevance
Both the original GBM sequencing work and subsequent studies describing IDH1 mutations have shown better outcomes in these tumors than grade‐matched gliomas lacking this alteration. Analysis of patients enrolled in prospective studies or cohorts have also demonstrated a favorable association of IDH1 mutation with overall survival in A III (99), O III (91) and GBM (97) patients. From a diagnostic perspective, other studies have established that assays aimed at detecting IDH1 mutation are fairly sensitive for the presence of a diffuse glioma (vs. reactive gliosis) and are highly specific when other primary CNS tumors are considered in the differential (discussed further below).
METHODS FOR IDH1 ANALYSIS
Current methods of IDH1 analyses usually address either the sequence of the gene or the structure of the protein. However, it also might be possible to focus on analysis of the mutant enzyme product, 2‐HG. One such method is gas chromatography‐mass spectrometry. Because (so far) all mutations in R132 on IDH1 and R172 on IDH2 have been shown to result in the production of 2‐HG, this approach might prove to be highly efficient, yet has the obvious limitation of needing a solid sample of unfixed tissue.
Direct sequencing
Nearly all of the published studies rely on sequence analyses from tumor DNA. With development of rapid sequencing facilities, both workload and time required is rapidly decreasing. However, it should be kept in mind that the success of sequencing analysis relies heavily on suitability of the material. Contaminating DNA from adjacent brain tissue, lymphocytic infiltrates, microglial cells and endothelia can dilute mutant DNA below detection thresholds leading to false negative readings. On the other hand, background signals might also reach threshold levels resulting in false positive results. Classic Sanger sequencing requires at least 20% mutant alleles for reliable detection of the mutant. Thus, thorough adjunct histological analysis of tumor tissue prior to DNA extraction is of course mandatory.
Pyrosequencing
Recent studies have detected IDH1 mutations by pyrosequencing 27, 82. This approach appears as robust as traditional sequencing and allows for rapid analysis and high throughput. A major advantage of pyrosequencing is the quantitative nature of the readings, allowing mutation detection in tissues intermingled with non‐tumorous cells. It has been estimated that a concentration of approximately 7% mutant alleles is sufficient for detection. As mentioned above in the context of MGMT analysis, though, a key disadvantage of pyrosequencing is the considerable investment in machinery and consumables and the reduced cost efficiency if looking at single samples per run.
dCAPS
An alternative to DNA sequencing is the so‐called “derived cleaved amplified polymorphic sequence” (dCAPS) analysis (66). This method relies on the application of mismatched primers, which upon PCR amplification will generate restriction endonuclease sites that will vary depending on whether the mutation is present or not. Consecutive digestion with the appropriate endonucleases will yield DNA fragments of different sizes which can be separated on agarose gels. We have developed a battery of primers that allow the detection of both wild‐type IDH1 and all known R132 mutants, including R132H, R132C, R132G, R132L and R132S (61). While similar DNA quality is needed for this as is needed for sequencing, this approach does not require expensive sequencing facilities. And although only predefined sequence alterations are detectable with this assay, the aforementioned list appears to cover the vast majority of mutant IDH1.
Melting curve analysis
Yet another approach to detect IDH1 and IDH2 mutations is melting curve analysis performed on real‐time PCR products. A suitable protocol has recently been published, utilizing two fluorescent probes, one of which serves as sensor probe either spanning codon 132 of IDH1 or codon 172 of IDH2 and a light cycler (43). Having even a single base pair mismatch between the fluorescent probe and the PCR product will result in a lower melting temperature. PCR products from a typical mutated glioma would therefore have two melting peaks, a wild‐type sequence showing a higher melting point and a lower one showing a lower melting point. Sequencing can then be targeted to those cases with two peaks to verify the fluorescent melting curve analysis (FMCA). This method, which is already clinically employed in the detection of KRAS and BRAF point mutations in other tumors, appears to be less vulnerable to non‐neoplastic DNA “dilution” such that the detection threshold is roughly 10% mutant alleles.
IHC
The development of an IDH1 R132H mutation‐specific antibody (DIANOVA, clone H09) suitable for FFPE tissue immediately made IDH1 analysis in routine specimens accessible and relatively simple even for modestly‐sized pathology laboratories 13, 14. A caveat is that clone H09 is highly specific to R132H and does not recognize wild‐type sequence or the C, S, L or V amino acid substitutions in codon 132. Thus, approximately 93% of brain tumor‐associated IDH1 mutations in codon 132 are readily detectable, while the remaining 7% are missed, as are all IDH2 mutations. In our hands, however, we found the detection rate of R132H mutations by IHC to be slightly higher than that recovered by sequencing. This is due to the ability to detect single tumor cells (Figure 5), which cannot be accomplished in a practical way by sequencing. Our routine procedure for detection of IDH1 mutation is therefore an initial IHC screen, followed by DNA sequencing of cases negative or equivocal with the H09 antibody. In order to capture as many possible relevant tumors as possible, those cases are also sequenced for IDH2 mutations.
Figure 5.
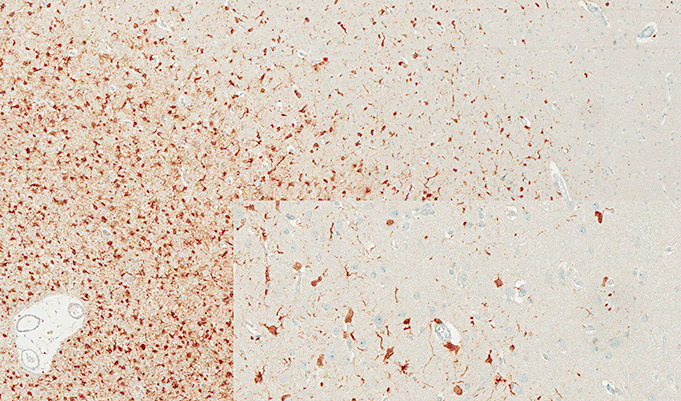
Binding of antibody H09 to tumor cells in infiltrating edge of oligodendroglioma.
CONSEQUENCES
Impact on diagnostic aspects
Knowledge of the IDH1 status is of both diagnostic and clinical relevance. On diagnostic grounds, IDH1 status greatly assists classification of gliomas. For example, it clearly separates oligodendroglial tumors from several entities that are sometimes difficult to distinguish, including central (or extraventricular) neurocytoma, tanycytic ependymoma, PA I with oligodendroglial‐like cytology and dysembryoplastic neuroepithelial tumor (DNT), all of which are characterized by the absence of IDH1 mutations (12). Because IDH1 mutations do not occur in reactive gliosis, conditions producing reactive gliosis can often be separated from the frequently mutated diffuse gliomas. The potential of antibody H09 to detect single cells is sometimes of great assistance in detection of tumor in very small samples or in specimens originating from the infiltrating tumor edge. Further, considering the frequency of R132H among IDH1/2‐mutated gliomas, screening with H09 IHC is expected to reduce the need for sequencing by approximately 90%. An overview of the distribution of IDH1 mutations in human brain tumors is given in Table 2.
Table 2.
IDH1 mutations in gliomas from the Heidelberg series.
| Diagnosis | N | Mut (%) |
|---|---|---|
| Astrocytoma WHO grade II (A II) | 299 | 225 (75.3) |
| Anaplastic astrocytoma WHO grade III (A III) | 339 | 213 (62.8) |
| Secondary glioblastoma WHO grade IV (secGBM) | 16 | 12 (75) |
| Oligodendroglioma WHO grade II (O II) | 196 | 160 (81.6) |
| Anaplastic oligodendroglioma WHO grade III (O III) | 227 | 158 (69.6) |
| Oligoastrocytoma WHO grade II (OA II) | 125 | 99 (79.2) |
| Anaplastic oligoastrocytoma WHO grade III (OA III) | 260 | 184 (70.8) |
| Primary Glioblastoma WHO grade IV (prGBM) | 518 | 42 (8.1) |
| Giant cell glioblastoma WHO grade IV (gcGBM) | 10 | 2 (20) |
| Pediatric Glioblastoma WHO grade IV (pedGBM) | 13 | 1 (7.7) |
| Gliosarcoma WHO grade IV (GS) | 10 | 0 |
| Ependymoma WHO grade II (E II) | 17 | 0 |
| Anaplastic ependymoma WHO grade III (E III) | 11 | 0 |
| Pilocytic astrocytoma WHO grade I (PA I) | 114 | 2 (1.7) |
| Subependymal giant cell astrocytoma WHO grade I (SEGA I) | 12 | 0 |
| Pleomorphic xanthoastrocytoma WHO grade II (PXA II) | 9 | 0 |
| Ganglioglioma WHO grade I (GG I) | 22 | 0 |
| Dysembryoplastic neuroepithelial tumor WHO grade I (DNT) | 21 | 0 |
| Central neurocytoma WHO grade II | 35 | 0 |
Impact on clinical aspects
Our recent analyses on patients enrolled in the NOA‐04 study (99) and the German Glioma Network (97) revealed that IDH1 status was of higher prognostic relevance than WHO diagnosis within a set of tumors consisting of A III and GBM. In this series, the order of most favorable to least was: A III with mutation; GBM with mutation; A III without mutation; and GBM without mutation (36). We believe that these findings may have imminent importance for the classification of A III and GBM and therefore, also on further management of these patients. There may also be a favorable prognostic effect of IDH1 mutations in A II, OA II and O II 20, 80.
Conclusions
The recognition of IDH1 mutations in gliomas has already greatly extended our understanding of these tumors, in particular underscoring the probable role of metabolism in gliomagenesis. The presence of IDH1 mutations in both diffuse astrocytic and oligodendroglial gliomas highlights the likely common origin of these entities, which have been mostly set apart from each other by molecular markers for the last two decades. Diagnostic challenges may be better met by knowledge of the IDH1 status. The high relevance of IDH1 status on clinical outcome of patients with A III and GBM is likely to prompt revisions of the current WHO classification of brain tumors. We expect that on grounds of the strong prognostic effect of IDH1 status on survival, future clinical studies on diffuse gliomas and GBM will uniformly include this analysis. These implications are of considerable interest to neuropathologists and clinicians, suggesting that determination of the IDH1 (and IDH2) status will be routinely performed in the near future.
REFERENCES
- 1. Balss J, Meyer J, Mueller W, Korshunov A, Hartmann C, Von Deimling A (2008) Analysis of the IDH1 codon 132 mutation in brain tumors. Acta Neuropathol 116:597–602. [DOI] [PubMed] [Google Scholar]
- 2. Bar EE, Lin A, Tihan T, Burger PC, Eberhart CG (2008) Frequent gains at chromosome 7q34 involving BRAF in pilocytic astrocytoma. J Neuropathol Exp Neurol 67:878–887. [DOI] [PubMed] [Google Scholar]
- 3. Belanich M, Pastor M, Randall T, Guerra D, Kibitel J, Alas L et al (1996) Retrospective study of the correlation between the DNA repair protein alkyltransferase and survival of brain tumor patients treated with carmustine. Cancer Res 56:783–788. [PubMed] [Google Scholar]
- 4. Bleeker FE, Lamba S, Leenstra S, Troost D, Hulsebos T, Vandertop WP et al (2009) IDH1 mutations at residue p.R132 [IDH1(R132)] occur frequently in high‐grade gliomas but not in other solid tumors. Hum Mutat 30:7–11. [DOI] [PubMed] [Google Scholar]
- 5. Boissel N, Nibourel O, Renneville A, Gardin C, Reman O, Contentin N et al (2010) Prognostic impact of isocitrate dehydrogenase enzyme isoforms 1 and 2 mutations in acute myeloid leukemia: a study by the Acute Leukemia French Association group. J Clin Oncol 28:3717–3723. [DOI] [PubMed] [Google Scholar]
- 6. Brandes AA, Nicolardi L, Tosoni A, Gardiman M, Iuzzolino P, Ghimenton C et al (2006) Survival following adjuvant PCV or temozolomide for anaplastic astrocytoma. Neuro Oncol 8:253–260. [DOI] [PMC free article] [PubMed] [Google Scholar]
- 7. Brandes AA, Tosoni A, Cavallo G, Reni M, Franceschi E, Bonaldi L et al (2006) Correlations between O6‐methylguanine DNA methyltransferase promoter methylation status, 1p and 19q deletions, and response to temozolomide in anaplastic and recurrent oligodendroglioma: a prospective GICNO study. J Clin Oncol 24:4746–4753. [DOI] [PubMed] [Google Scholar]
- 8. Brandes AA, Franceschi E, Tosoni A, Blatt V, Pession A, Tallini G et al (2008) MGMT promoter methylation status can predict the incidence and outcome of pseudoprogression after concomitant radiochemotherapy in newly diagnosed glioblastoma patients. J Clin Oncol 26:2192–2197. [DOI] [PubMed] [Google Scholar]
- 9. Brandes AA, Franceschi E, Tosoni A, Benevento F, Scopece L, Mazzocchi V et al (2009) Temozolomide concomitant and adjuvant to radiotherapy in elderly patients with glioblastoma: correlation with MGMT promoter methylation status. Cancer 115:3512–3518. [DOI] [PubMed] [Google Scholar]
- 10. Brandes AA, Tosoni A, Franceschi E, Sotti G, Frezza G, Amista P et al (2009) Recurrence pattern after temozolomide concomitant with and adjuvant to radiotherapy in newly diagnosed patients with glioblastoma: correlation With MGMT promoter methylation status. J Clin Oncol 27:1275–1279. [DOI] [PubMed] [Google Scholar]
- 11. Capper D, Mittelbronn M, Meyermann R, Schittenhelm J (2008) Pitfalls in the assessment of MGMT expression and in its correlation with survival in diffuse astrocytomas: proposal of a feasible immunohistochemical approach. Acta Neuropathol 115:249–259. [DOI] [PubMed] [Google Scholar]
- 12. Capper D, Reuss D, Schittenhelm J, Hartmann C, Bremer J, Sahm F et al Mutation specific IDH1 antibody differentiates oligodendrogliomas and oligoastrocytomas from other brain tumors with oligodendroglioma‐like morphology. Acta Neuropathol Berlin (in press). [DOI] [PubMed] [Google Scholar]
- 13. Capper D, Zentgraf H, Balss J, Hartmann C, Von Deimling A (2009) Monoclonal antibody specific for IDH1 R132H mutation. Acta Neuropathol Berlin 118:599–601. [DOI] [PubMed] [Google Scholar]
- 14. Capper D, Weißert S, Balss J, Habel A, Meyer J, Jäger D et al (2010) Characterization of R132H mutation sSpecific IDH1 antibody binding in brain tumors. Brain Pathol 20:245–254. [DOI] [PMC free article] [PubMed] [Google Scholar]
- 15. Chinot OL, Barrie M, Fuentes S, Eudes N, Lancelot S, Metellus P et al (2007) Correlation between O6‐methylguanine‐DNA methyltransferase and survival in inoperable newly diagnosed glioblastoma patients treated with neoadjuvant temozolomide. J Clin Oncol 25:1470–1475. [DOI] [PubMed] [Google Scholar]
- 16. Ciampi R, Knauf JA, Kerler R, Gandhi M, Zhu Z, Nikiforova MN et al (2005) Oncogenic AKAP9‐BRAF fusion is a novel mechanism of MAPK pathway activation in thyroid cancer. J Clin Invest 115:94–101. [DOI] [PMC free article] [PubMed] [Google Scholar]
- 17. Clarke JL, Iwamoto FM, Sul J, Panageas K, Lassman AB, DeAngelis LM et al (2009) Randomized phase II trial of chemoradiotherapy followed by either dose‐dense or metronomic temozolomide for newly diagnosed glioblastoma. J Clin Oncol 27:3861–3867. [DOI] [PMC free article] [PubMed] [Google Scholar]
- 18. Criniere E, Kaloshi G, Laigle‐Donadey F, Lejeune J, Auger N, Benouaich‐Amiel A et al (2007) MGMT prognostic impact on glioblastoma is dependent on therapeutic modalities. J Neurooncol 83:173–179. [DOI] [PubMed] [Google Scholar]
- 19. Dang L, White DW, Gross S, Bennett BD, Bittinger MA, Driggers EM et al (2009) Cancer‐associated IDH1 mutations produce 2‐hydroxyglutarate. Nature 462:739–744. [DOI] [PMC free article] [PubMed] [Google Scholar]
- 20. Dubbink HJ, Taal W, Van Marion R, Kros JM, Van Heuvel I, Bromberg JE et al (2009) IDH1 mutations in low‐grade astrocytomas predict survival but not response to temozolomide. Neurology 73:1792–1795. [DOI] [PubMed] [Google Scholar]
- 21. Dunn J, Baborie A, Alam F, Joyce K, Moxham M, Sibson R et al (2009) Extent of MGMT promoter methylation correlates with outcome in glioblastomas given temozolomide and radiotherapy. Br J Cancer 101:124–131. [DOI] [PMC free article] [PubMed] [Google Scholar]
- 22. Esteller M, Hamilton SR, Burger PC, Baylin SB, Herman JG (1999) Inactivation of the DNA repair gene O6‐methylguanine‐DNA methyltransferase by promoter hypermethylation is a common event in primary human neoplasia. Cancer Res 59:793–797. [PubMed] [Google Scholar]
- 23. Esteller M, Garcia‐Foncillas J, Andion E, Goodman SN, Hidalgo OF, Vanaclocha V et al (2000) Inactivation of the DNA‐repair gene MGMT and the clinical response of gliomas to alkylating agents. N Engl J Med 343:1350–1354. [DOI] [PubMed] [Google Scholar]
- 24. Everhard S, Kaloshi G, Criniere E, Benouaich‐Amiel A, Lejeune J, Marie Y et al (2006) MGMT methylation: a marker of response to temozolomide in low‐grade gliomas. Ann Neurol 60:740–743. [DOI] [PubMed] [Google Scholar]
- 25. Everhard S, Tost J, El Abdalaoui H, Criniere E, Busato F, Marie Y et al (2009) Identification of regions correlating MGMT promoter methylation and gene expression in glioblastomas. Neuro Oncol 11:348–356. [DOI] [PMC free article] [PubMed] [Google Scholar]
- 26. Felsberg J, Rapp M, Loeser S, Fimmers R, Stummer W, Goeppert M et al (2009) Prognostic significance of molecular markers and extent of resection in primary glioblastoma patients. Clin Cancer Res 15:6683–6693. [DOI] [PubMed] [Google Scholar]
- 27. Felsberg J, Wolter M, Seul H, Friedensdorf B, Goppert M, Sabel MC, Reifenberger G (2010) Rapid and sensitive assessment of the IDH1 and IDH2 mutation status in cerebral gliomas based on DNA pyrosequencing. Acta Neuropathol 119:501–507. [DOI] [PubMed] [Google Scholar]
- 28. Forshew T, Tatevossian RG, Lawson AR, Ma J, Neale G, Ogunkolade BW et al (2009) Activation of the ERK/MAPK pathway: a signature genetic defect in posterior fossa pilocytic astrocytomas. J Pathol 218:172–181. [DOI] [PubMed] [Google Scholar]
- 29. Geisbrecht BV, Gould SJ (1999) The human PICD gene encodes a cytoplasmic and peroxisomal NADP(+)−dependent isocitrate dehydrogenase. J Biol Chem 274:30527–30533. [DOI] [PubMed] [Google Scholar]
- 30. Gerson SL (2004) MGMT: its role in cancer aetiology and cancer therapeutics. Nat Rev Cancer 4:296–307. [DOI] [PubMed] [Google Scholar]
- 31. Gorlia T, Van Den Bent MJ, Hegi ME, Mirimanoff RO, Weller M, Cairncross JG et al (2008) Nomograms for predicting survival of patients with newly diagnosed glioblastoma: prognostic factor analysis of EORTC and NCIC trial 26981‐22981/CE.3. Lancet Oncol 9:29–38. [DOI] [PubMed] [Google Scholar]
- 32. Grasbon‐Frodl EM, Kreth FW, Ruiter M, Schnell O, Bise K, Felsberg J et al (2007) Intratumoral homogeneity of MGMT promoter hypermethylation as demonstrated in serial stereotactic specimens from anaplastic astrocytomas and glioblastomas. Int J Cancer 121:2458–2464. [DOI] [PubMed] [Google Scholar]
- 33. Gravendeel LA, Kloosterhof NK, Bralten LB, Van Marion R, Dubbink HJ, Dinjens W et al (2010) Segregation of non‐p.R132H mutations in IDH1 in distinct molecular subtypes of glioma. Hum Mutat 31:E1186–E1199. [DOI] [PubMed] [Google Scholar]
- 34. Gross S, Cairns RA, Minden MD, Driggers EM, Bittinger MA, Jang HG et al (2010) Cancer‐associated metabolite 2‐hydroxyglutarate accumulates in acute myelogenous leukemia with isocitrate dehydrogenase 1 and 2 mutations. J Exp Med 207:339–344. [DOI] [PMC free article] [PubMed] [Google Scholar]
- 35. Harris LC, Potter PM, Tano K, Shiota S, Mitra S, Brent TP (1991) Characterization of the promoter region of the human O6‐methylguanine‐DNA methyltransferase gene. Nucleic Acids Res 19:6163–6167. [DOI] [PMC free article] [PubMed] [Google Scholar]
- 36. Hartmann C, Hentschel B, Wick W, Capper D, Felsberg J, Simon M et al IDH1 mutation status defines distinct prognostic subgroups among anaplastic astrocytoma and glioblastoma patients and accounts for the unfavorable prognostic effect of higher age. Acta Neuropathol Berlin: DOI: 10.1007/s00401‐010‐0781‐z [Epub ahead of print]. [DOI] [PubMed] [Google Scholar]
- 37. Hartmann C, Meyer J, Balss J, Capper D, Mueller W, Christians A et al (2009) Type and frequency of IDH1 and IDH2 mutations are related to astrocytic and oligodendroglial differentiation and age: a study of 1010 diffuse gliomas. Acta Neuropathol 118:469–474. [DOI] [PubMed] [Google Scholar]
- 38. Hegi ME, Diserens AC, Godard S, Dietrich PY, Regli L, Ostermann S et al (2004) Clinical trial substantiates the predictive value of O‐6‐methylguanine‐DNA methyltransferase promoter methylation in glioblastoma patients treated with temozolomide. Clin Cancer Res 10:1871–1874. [DOI] [PubMed] [Google Scholar]
- 39. Hegi ME, Diserens AC, Gorlia T, Hamou MF, De Tribolet N, Weller M et al (2005) MGMT gene silencing and benefit from temozolomide in glioblastoma. N Engl J Med 352:997–1003. [DOI] [PubMed] [Google Scholar]
- 40. Herrlinger U, Rieger J, Koch D, Loeser S, Blaschke B, Kortmann RD et al (2006) Phase II trial of lomustine plus temozolomide chemotherapy in addition to radiotherapy in newly diagnosed glioblastoma: UKT‐03. J Clin Oncol 24:4412–4417. [DOI] [PubMed] [Google Scholar]
- 41. Horbinski C, Kofler J, Kelly LM, Murdoch GH, Nikiforova MN (2009) Diagnostic use of IDH1/2 mutation analysis in routine clinical testing of formalin‐fixed, paraffin‐embedded glioma tissues. J Neuropathol Exp Neurol 68:1319–1325. [DOI] [PubMed] [Google Scholar]
- 42. Horbinski C, Hamilton RL, Nikiforov Y, Pollack IF (2010) Association of molecular alterations, including BRAF, with biology and outcome in pilocytic astrocytomas. Acta Neuropathol 119:641–649. [DOI] [PMC free article] [PubMed] [Google Scholar]
- 43. Horbinski C, Kelly L, Nikiforov YE, Durso MB, Nikiforova MN (2010) Detection of IDH1 and IDH2 mutations by fluorescence melting curve analysis as a diagnostic tool for brain biopsies. J Mol Diagn 12:487–492. [DOI] [PMC free article] [PubMed] [Google Scholar]
- 44. Ichimura K, Pearson DM, Kocialkowski S, Backlund LM, Chan R, Jones DT, Collins VP (2009) IDH1 mutations are present in the majority of common adult gliomas but are rare in primary glioblastomas. Neuro Oncol 11:341–347. [DOI] [PMC free article] [PubMed] [Google Scholar]
- 45. Jacob K, Albrecht S, Sollier C, Faury D, Sader E, Montpetit A et al (2009) Duplication of 7q34 is specific to juvenile pilocytic astrocytomas and a hallmark of cerebellar and optic pathway tumours. Br J Cancer 101:722–733. [DOI] [PMC free article] [PubMed] [Google Scholar]
- 46. Jaeckle KA, Eyre HJ, Townsend JJ, Schulman S, Knudson HM, Belanich M et al (1998) Correlation of tumor O6 methylguanine‐DNA methyltransferase levels with survival of malignant astrocytoma patients treated with bis‐chloroethylnitrosourea: a Southwest Oncology Group study. J Clin Oncol 16:3310–3315. [DOI] [PubMed] [Google Scholar]
- 47. Jeuken JW, Cornelissen SJ, Vriezen M, Dekkers MM, Errami A, Sijben A et al (2007) MS‐MLPA: an attractive alternative laboratory assay for robust, reliable, and semiquantitative detection of MGMT promoter hypermethylation in gliomas. Lab Invest 87:1055–1065. [DOI] [PubMed] [Google Scholar]
- 48. Jones DT, Kocialkowski S, Liu L, Pearson DM, Backlund LM, Ichimura K, Collins VP (2008) Tandem duplication producing a novel oncogenic BRAF fusion gene defines the majority of pilocytic astrocytomas. Cancer Res 68:8673–8677. [DOI] [PMC free article] [PubMed] [Google Scholar]
- 49. Jones DT, Kocialkowski S, Liu L, Pearson DM, Ichimura K, Collins VP (2009) Oncogenic RAF1 rearrangement and a novel BRAF mutation as alternatives to KIAA1549:BRAF fusion in activating the MAPK pathway in pilocytic astrocytoma. Oncogene 28:2119–2123. [DOI] [PMC free article] [PubMed] [Google Scholar]
- 50. Kang MR, Kim MS, Oh JE, Kim YR, Song SY, Seo SI et al (2009) Mutational analysis of IDH1 codon 132 in glioblastomas and other common cancers. Int J Cancer 125:353–355. [DOI] [PubMed] [Google Scholar]
- 51. Kesari S, Schiff D, Drappatz J, LaFrankie D, Doherty L, Macklin EA et al (2009) Phase II study of protracted daily temozolomide for low‐grade gliomas in adults. Clin Cancer Res 15:330–337. [DOI] [PubMed] [Google Scholar]
- 52. Komine C, Watanabe T, Katayama Y, Yoshino A, Yokoyama T, Fukushima T (2003) Promoter hypermethylation of the DNA repair gene O6‐methylguanine‐DNA methyltransferase is an independent predictor of shortened progression free survival in patients with low‐grade diffuse astrocytomas. Brain Pathol 13:176–184. [DOI] [PMC free article] [PubMed] [Google Scholar]
- 53. Korshunov A, Meyer J, Capper D, Christians A, Remke A, Witt H et al (2009) Combined molecular analysis of BRAF and IDH1 distinguishes pilocytic astrocytoma from diffuse astrocytoma. Acta Neuropathol 118:401–405. [DOI] [PubMed] [Google Scholar]
- 54. Krex D, Klink B, Hartmann C, Von Deimling A, Pietsch T, Simon M et al (2007) Long‐term survival with glioblastoma multiforme. Brain 130:2596–2606. [DOI] [PubMed] [Google Scholar]
- 55. Lavon I, Zrihan D, Zelikovitch B, Fellig Y, Fuchs D, Soffer D, Siegal T (2007) Longitudinal assessment of genetic and epigenetic markers in oligodendrogliomas. Clin Cancer Res 13:1429–1437. [DOI] [PubMed] [Google Scholar]
- 56. Lawson AR, Tatevossian RG, Phipps KP, Picker SR, Michalski A, Sheer D et al (2010) RAF gene fusions are specific to pilocytic astrocytoma in a broad paediatric brain tumour cohort. Acta Neuropathol 120:271–273. [DOI] [PubMed] [Google Scholar]
- 57. Lee SM, Koh HJ, Park DC, Song BJ, Huh TL, Park JW (2002) Cytosolic NADP(+)−dependent isocitrate dehydrogenase status modulates oxidative damage to cells. Free Radic Biol Med 32:1185–1196. [DOI] [PubMed] [Google Scholar]
- 58. Levin N, Lavon I, Zelikovitsh B, Fuchs D, Bokstein F, Fellig Y, Siegal T (2006) Progressive low‐grade oligodendrogliomas: response to temozolomide and correlation between genetic profile and O6‐methylguanine DNA methyltransferase protein expression. Cancer 106:1759–1765. [DOI] [PubMed] [Google Scholar]
- 59. Mardis ER, Ding L, Dooling DJ, Larson DE, McLellan MD, Chen K et al (2009) Recurring mutations found by sequencing an acute myeloid leukemia genome. N Engl J Med 361:1058–1066. [DOI] [PMC free article] [PubMed] [Google Scholar]
- 60. Meyer C, Marschalek R (2009) LDI‐PCR: identification of known and unknown gene fusions of the human MLL gene. Methods Mol Biol 538:71–83. [DOI] [PubMed] [Google Scholar]
- 61. Meyer J, Pusch S, Balss J, Capper D, Mueller W, Christians A et al (2010) PCR and restriction endonuclease based detection of IDH1 mutations. Brain Pathol 20:298–300. [DOI] [PMC free article] [PubMed] [Google Scholar]
- 62. Mikeska T, Bock C, El‐Maarri O, Hubner A, Ehrentraut D, Schramm J et al (2007) Optimization of quantitative MGMT promoter methylation analysis using pyrosequencing and combined bisulfite restriction analysis. J Mol Diagn 9:368–381. [DOI] [PMC free article] [PubMed] [Google Scholar]
- 63. Mollemann M, Wolter M, Felsberg J, Collins VP, Reifenberger G (2005) Frequent promoter hypermethylation and low expression of the MGMT gene in oligodendroglial tumors. Int J Cancer 113:379–385. [DOI] [PubMed] [Google Scholar]
- 64. Murat A, Migliavacca E, Gorlia T, Lambiv WL, Shay T, Hamou MF et al (2008) Stem cell‐related “self‐renewal” signature and high epidermal growth factor receptor expression associated with resistance to concomitant chemoradiotherapy in glioblastoma. J Clin Oncol 26:3015–3024. [DOI] [PubMed] [Google Scholar]
- 65. Nakagawachi T, Soejima H, Urano T, Zhao W, Higashimoto K, Satoh Y et al (2003) Silencing effect of CpG island hypermethylation and histone modifications on O6‐methylguanine‐DNA methyltransferase (MGMT) gene expression in human cancer. Oncogene 22:8835–8844. [DOI] [PubMed] [Google Scholar]
- 66. Neff MM, Neff JD, Chory J, Pepper AE (1998) dCAPS, a simple technique for the genetic analysis of single nucleotide polymorphisms: experimental applications in Arabidopsis thaliana genetics. Plant J 14:387–392. [DOI] [PubMed] [Google Scholar]
- 67. Niault TS, Baccarini M (2010) Targets of Raf in tumorigenesis. Carcinogenesis 31:1165–1174. [DOI] [PubMed] [Google Scholar]
- 68. Nobusawa S, Watanabe T, Kleihues P, Ohgaki H (2009) IDH1 mutations as molecular signature and predictive factor of secondary glioblastomas. Clin Cancer Res 15:6002–6007. [DOI] [PubMed] [Google Scholar]
- 69. Olsson M, Lindahl T (1980) Repair of alkylated DNA in Escherichia coli. Methyl group transfer from O6‐methylguanine to a protein cysteine residue. J Biol Chem 255:10569–10571. [PubMed] [Google Scholar]
- 70. Parsons DW, Jones S, Zhang X, Lin JC, Leary RJ, Angenendt P et al (2008) An integrated genomic analysis of human glioblastoma multiforme. Science 321:1807–1812. [DOI] [PMC free article] [PubMed] [Google Scholar]
- 71. Paschka P, Schlenk RF, Gaidzik VI, Habdank M, Kronke J, Bullinger L et al (2010) IDH1 and IDH2 mutations are frequent genetic alterations in acute myeloid leukemia and confer adverse prognosis in cytogenetically normal acute myeloid leukemia with NPM1 mutation without FLT3 internal tandem duplication. J Clin Oncol 28:3636–3643. [DOI] [PubMed] [Google Scholar]
- 72. Pegg AE, Wiest L, Foote RS, Mitra S, Perry W (1983) Purification and properties of O6‐methylguanine‐DNA transmethylase from rat liver. J Biol Chem 258:2327–2333. [PubMed] [Google Scholar]
- 73. Pfister S, Janzarik WG, Remke M, Ernst A, Werft W, Becker N et al (2008) BRAF gene duplication constitutes a mechanism of MAPK pathway activation in low‐grade astrocytomas. J Clin Invest 118:1739–1749. [DOI] [PMC free article] [PubMed] [Google Scholar]
- 74. Prados MD, Chang SM, Butowski N, DeBoer R, Parvataneni R, Carliner H et al (2009) Phase II study of erlotinib plus temozolomide during and after radiation therapy in patients with newly diagnosed glioblastoma multiforme or gliosarcoma. J Clin Oncol 27: 579–584. [DOI] [PMC free article] [PubMed] [Google Scholar]
- 75. Pratilas CA, Solit DB (2010) Targeting the mitogen‐activated protein kinase pathway: physiological feedback and drug response. Clin Cancer Res 16:3329–3334. [DOI] [PMC free article] [PubMed] [Google Scholar]
- 76. Preusser M, Charles Janzer R, Felsberg J, Reifenberger G, Hamou MF, Diserens AC et al (2008) Anti‐O6‐methylguanine‐methyltransferase (MGMT) immunohistochemistry in glioblastoma multiforme: observer variability and lack of association with patient survival impede its use as clinical biomarker. Brain Pathol 18:520–532. [DOI] [PMC free article] [PubMed] [Google Scholar]
- 77. Rodriguez FJ, Thibodeau SN, Jenkins RB, Schowalter KV, Caron BL, O'Neill BP et al (2008) MGMT immunohistochemical expression and promoter methylation in human glioblastoma. Appl Immunohistochem Mol Morphol 16:59–65. [DOI] [PubMed] [Google Scholar]
- 78. Rokes CA, Remke M, Guha‐Thakurta N, Witt O, Korshunov A, Pfister S, Wolff JE (2010) Sorafenib plus valproic acid for infant spinal glioblastoma. J Pediatr Hematol Oncol 32:511–514. [DOI] [PubMed] [Google Scholar]
- 79. Sahm F, Capper D, Meyer J, Hartmann C, Herpel E, Andrulis M et al Immunohistochemical analysis of 1844 human epithelial and hematopoietic tumors and sarcomas for IDH1R132H mutation. Histopathology (in press). [DOI] [PubMed] [Google Scholar]
- 80. Sanson M, Marie Y, Paris S, Idbaih A, Laffaire J, Ducray F et al (2009) Isocitrate dehydrogenase 1 codon 132 mutation is an important prognostic biomarker in gliomas. J Clin Oncol 27:4150–4154. [DOI] [PubMed] [Google Scholar]
- 81. Schiffman JD, Hodgson JG, VandenBerg SR, Flaherty P, Polley MY, Yu M et al (2010) Oncogenic BRAF mutation with CDKN2A inactivation is characteristic of a subset of pediatric malignant astrocytomas. Cancer Res 70:512–519. [DOI] [PMC free article] [PubMed] [Google Scholar]
- 82. Setty P, Hammes J, Rothamel T, Vladimirova V, Kramm CM, Pietsch T, Waha A (2010) A pyrosequencing‐based assay for the rapid detection of IDH1 mutations in clinical samples. J Mol Diagn 12:750–756. [DOI] [PMC free article] [PubMed] [Google Scholar]
- 83. Sievert AJ, Jackson EM, Gai X, Hakonarson H, Judkins AR, Resnick AC et al (2009) Duplication of 7q34 in pediatric low‐grade astrocytomas detected by high‐density single‐nucleotide polymorphism‐based genotype arrays results in a novel BRAF fusion gene. Brain Pathol 19:449–458. [DOI] [PMC free article] [PubMed] [Google Scholar]
- 84. Sonoda Y, Kumabe T, Nakamura T, Saito R, Kanamori M, Yamashita Y et al (2009) Analysis of IDH1 and IDH2 mutations in Japanese glioma patients. Cancer Sci 100:1996–1998. [DOI] [PMC free article] [PubMed] [Google Scholar]
- 85. Stupp R, Mason WP, Van Den Bent MJ, Weller M, Fisher B, Taphoorn MJ et al (2005) Radiotherapy plus concomitant and adjuvant temozolomide for glioblastoma. N Engl J Med 352:987–996. [DOI] [PubMed] [Google Scholar]
- 86. Stupp R, Hegi ME, Mason WP, Van Den Bent MJ, Taphoorn MJ, Janzer RC et al (2009) Effects of radiotherapy with concomitant and adjuvant temozolomide versus radiotherapy alone on survival in glioblastoma in a randomised phase III study: 5‐year analysis of the EORTC‐NCIC trial. Lancet Oncol 10:459–466. [DOI] [PubMed] [Google Scholar]
- 87. Tano K, Shiota S, Collier J, Foote RS, Mitra S (1990) Isolation and structural characterization of a cDNA clone encoding the human DNA repair protein for O6‐alkylguanine. Proc Natl Acad Sci U S A 87:686–690. [DOI] [PMC free article] [PubMed] [Google Scholar]
- 88. Tatevossian RG, Lawson AR, Forshew T, Hindley GF, Ellison DW, Sheer D (2010) MAPK pathway activation and the origins of pediatric low‐grade astrocytomas. J Cell Physiol 222:509–514. [DOI] [PubMed] [Google Scholar]
- 89. Thol F, Damm F, Wagner K, Gohring G, Schlegelberger B, Hoelzer D et al (2010) Prognostic impact of IDH2 mutations in cytogenetically normal acute myeloid leukemia. Blood 116:614–616. [DOI] [PubMed] [Google Scholar]
- 90. Van Den Bent MJ, Dubbink HJ, Sanson M, Van Der Lee‐Haarloo CR, Hegi M, Jeuken JW et al (2009) MGMT promoter methylation is prognostic but not predictive for outcome to adjuvant PCV chemotherapy in anaplastic oligodendroglial tumors: a report from EORTC Brain Tumor Group Study 26951. J Clin Oncol 27:5881–5886. [DOI] [PMC free article] [PubMed] [Google Scholar]
- 91. Van Den Bent MJ, Dubbink HJ, Marie Y, Brandes AA, Taphoorn MJ, Wesseling P et al (2010) IDH1 and IDH2 mutations are prognostic but not predictive for outcome in anaplastic oligodendroglial tumors: a report of the European Organization for Research and Treatment of Cancer Brain Tumor Group. Clin Cancer Res 16:1597–1604. [DOI] [PubMed] [Google Scholar]
- 92. Vlassenbroeck I, Califice S, Diserens AC, Migliavacca E, Straub J, Di Stefano I et al (2008) Validation of real‐time methylation‐specific PCR to determine O6‐methylguanine‐DNA methyltransferase gene promoter methylation in glioma. J Mol Diagn 10:332–337. [DOI] [PMC free article] [PubMed] [Google Scholar]
- 93. Ward PS, Patel J, Wise DR, Abdel‐Wahab O, Bennett BD, Coller HA et al (2010) The common feature of leukemia‐associated IDH1 and IDH2 mutations is a neomorphic enzyme activity converting alpha‐Ketoglutarate to 2‐Hydroxyglutarate. Cancer Cell 17:225–234. [DOI] [PMC free article] [PubMed] [Google Scholar]
- 94. Watanabe T, Nakamura M, Kros JM, Burkhard C, Yonekawa Y, Kleihues P, Ohgaki H (2002) Phenotype versus genotype correlation in oligodendrogliomas and low‐grade diffuse astrocytomas. Acta Neuropathol 103:267–275. [DOI] [PubMed] [Google Scholar]
- 95. Watanabe T, Nobusawa S, Kleihues P, Ohgaki H (2009) IDH1 mutations are early events in the development of astrocytomas and oligodendrogliomas. Am J Pathol 174:653–656. [DOI] [PMC free article] [PubMed] [Google Scholar]
- 96. Weiler M, Hartmann C, Wiewroth D, Herrlinger U, Gorlia T, Bahr O et al (2010) Chemoradiotherapy of newly diagnosed glioblastoma with intensified temozolomide. Int J Radiat Oncol Biol Phys 77:670–676. [DOI] [PubMed] [Google Scholar]
- 97. Weller M, Felsberg J, Hartmann C, Berger H, Steinbach J, Schramm J et al (2009) Molecular predictors of progression‐free and overall survival in patients with newly diagnosed glioblastoma: a prospective translational study of the German Glioma Network. J Clin Oncol 27:5743–5750. [DOI] [PubMed] [Google Scholar]
- 98. Wick W, Stupp R, Beule AC, Bromberg J, Wick A, Ernemann U et al (2008) A novel tool to analyze MRI recurrence patterns in glioblastoma. Neuro Oncol 10:1019–1024. [DOI] [PMC free article] [PubMed] [Google Scholar]
- 99. Wick W, Hartmann C, Engel C, Stoffels M, Felsberg J, Stockhammer F et al (2009) NOA‐04 randomized phase III trial of sequential radiochemotherapy of anaplastic glioma with procarbazine, lomustine, and vincristine or temozolomide. J Clin Oncol 27:5874–5880. [DOI] [PubMed] [Google Scholar]
- 100. Yan H, Parsons DW, Jin G, McLendon R, Rasheed BA, Yuan W et al (2009) IDH1 and IDH2 mutations in gliomas. N Engl J Med 360:765–773. [DOI] [PMC free article] [PubMed] [Google Scholar]
- 101. Zawlik I, Vaccarella S, Kita D, Mittelbronn M, Franceschi S, Ohgaki H (2009) Promoter methylation and polymorphisms of the MGMT gene in glioblastomas: a population‐based study. Neuroepidemiology 32:21–29. [DOI] [PubMed] [Google Scholar]
- 102. Zhao S, Lin Y, Xu W, Jiang W, Zha Z, Wang P et al (2009) Glioma‐derived mutations in IDH1 dominantly inhibit IDH1 catalytic activity and induce HIF‐1alpha. Science 324:261–265. [DOI] [PMC free article] [PubMed] [Google Scholar]