

Abstract
Stroke is one of the major medical burdens in industrialized countries. Animal experiments indicate that blockade of the angiotensin AT1 receptor (AT1R) improves neurological outcome after cerebral ischemia. These protective effects are partially mediated by the angiotensin AT2 receptor (AT2R). The transcription factor promyelocytic leukemia zinc finger (PLZF) was identified as a direct adapter protein of the AT2R. Furthermore, our group was able to demonstrate that PLZF also directly binds and mediates the effects of the human (pro)renin receptor [(P)RR] which is involved in brain development. Therefore, we hypothesized that PLZF is involved in neuroprotection.
Here we show that PLZF and its receptors (P)RR and AT2R exhibited an ubiquitous expression pattern in different brain regions. Furthermore, stable PLZF overexpression in human neuronal cells was able to mediate neuroprotection in a glutamate toxicity model in vitro. Consistently, PLZF mRNA and protein were downregulated on the ipsilateral side in a stroke model in vivo, whereas the neurodetrimental PLZF target genes cyclin A2 and BID were upregulated under this condition. Further analyses indicated that the neuroprotective AT2R is upregulated upon stable PLZF overexpression in cultured neuronal cells.
Finally, reporter gene assays demonstrated the functionality of (P)RR promoter polymorphisms regarding basal and PLZF‐induced activity.
Keywords: angiotensin AT1 and AT2 receptors, experimental stroke, neuroprotection, PLZF, (pro)renin receptor, transcription factor
INTRODUCTION
The renin‐angiotensin system (RAS) is well known for its crucial role in cardiovascular pathophysiology 11, 19, but also exerts important functions in the nervous system. Sub‐hypotensive (ie, without causing blood pressure reduction) pretreatment with the angiotensin AT1 receptor blocker (ARB) candesartan was shown to reduce stroke volume and improve neurological outcome in a rat model of focal cerebral ischemia (28). Furthermore, even post‐treatment with candesartan can decrease cerebral infarct size 4, 13. Consistently, human clinical trials in patients with cardiovascular risk factors indicated that ARBs can reduce the stroke incidence and might also attenuate neurological deficits of a stroke via mechanisms beyond blood pressure reduction 26, 55. Our group was able to demonstrate that the neuroprotective effect of an ARB in an animal stroke model is mediated indirectly by the angiotensin AT2 receptor (AT2R) (29). Regarding putative underlying mechanisms, angiotensin AT1 receptor (AT1R) blockade interrupts the negative feedback of angiotensin II on renin release. Therefore, treatment with ARBs will lead to pronounced increases in plasma, and possibly also tissue angiotensin II levels. Because this angiotensin II cannot bind to the blocked AT1Rs, it stimulates unopposed AT2Rs (18). In this context, it is important to note that ARBs are selective (1000‐fold and more) for the AT1R 5, 57, 58. Consistent with neuroprotective effects of the AT2R, AT2R knockout mice exhibit a greater neurological deficit after experimental stroke (24). Moreover, the AT2R is able to promote neuronal differentiation in vitro 30, 34, 53 and is involved in nerve regeneration in central (32) and peripheral (42) injury models.
Regarding the signal transduction of the AT2R, four different types of adapter proteins have been described so far: certain G proteins (61), the phosphatase SHP‐1 (14), the AT2R binding protein [ATBP (59)], also called AT2 receptor interacting protein (ATIP) (35) and the transcription factor promyelocytic leukemia zinc finger ( PLZF ) (49). With respect to the nervous system, PLZF is of interest, as it is expressed in temporally dynamic and spatially restricted patterns during brain development (8). Furthermore, PLZF is also the principal adapter protein of the (pro)renin receptor [(P)RR, also called RER](44). A mutation in the (P)RR gene can cause a X‐linked mental retardation and epilepsy syndrome in humans (39), and the zebrafish (P)RR mutant displays for example a reduced head size as well as a central nervous system necrosis (1). PLZF knockout mice themselves are characterized by a distorted development of the limbs and the axial skeleton as well as by an altered proliferation/ apoptosis on the cellular level (2). Consistently, PLZF target genes include bone morphogenetic proteins (BMPs), Hox genes, the p85α subunit of phosphatidylinositol‐3 kinase (PI3K) and cyclin A (45).
Based on these findings regarding the functional roles of AT2R and (P)RR within nervous system pathophysiology we hypothesized that PLZF itself is modulating neuronal survival. The present study therefore investigates the neuronal function of PLZF in vitro and its expression in experimental stroke.
MATERIALS AND METHODS
Cell culture
KELLY (human neuronal) (47), SH‐SY5Y (human neuronal) and SK‐N‐AS (human neuronal) cells were cultured in RPMI (Invitrogen, Karlsruhe, Germany) supplemented with 10% fetal bovine serum (FBS), 100 U/mL penicillin and 100 µg/mL streptomycin. SK‐N‐SH (human, neuronal) were cultured in Dulbecco's modified Eagle's medium (DMEM) (Invitrogen) with 4.5 g/L glucose supplemented with 10% FBS and 1% glutamine. U‐87 MG (human glial) and U‐373 MG (human glial) were cultured in DMEM (Invitrogen) with 4.5 g/L glucose supplemented with 10% FBS, 100 U/mL penicillin and 100 µg/mL streptomycin. KELLY cells were obtained from DSMZ (German Collection of Microorganisms and Cell Cultures, Braunschweig, Germany), SK‐N‐SH from ECACC (European Collection of Cell Cultures, Salisbury, UK); all other cell lines were a kind gift of the Department of Hepatology and Gastroenterology of the Charité Berlin, Campus Virchow‐Klinikum.
Primary neuronal cultures of cerebral cortex were obtained from embryos [embryonic day 16 (E16) to E18] of Wistar rats (provided by U. Dirnagl, Charité Berlin) as described previously (21). Briefly, cerebral cortices were dissected, incubated for 15 minutes in trypsin/ ethylenediaminetetraacetic acid (EDTA) (0.05/0.02% w/v in PBS) at 37°C, rinsed twice with PBS and once with dissociation medium (modified Eagle's medium with 10% FBS, 10 mM 4‐(2‐hydroxyethyl)piperazine‐1‐ethanesulfonic acid (HEPES), 44 mM glucose, 100 U/mL penicillin plus 100 µg/mL streptomycin, 2 mM L‐glutamine, 100 IU insulin/L), dissociated by a Pasteur pipette in dissociation medium, pelleted by centrifugation (210 g for 2 minutes at 21°C), redissociated in starter medium [neurobasal medium (Invitrogen) with supplement B27, 100 U of penicillin plus 100 µg streptomycin per mL, 0.5 mM L‐glutamine, and 25 µM glutamate], and plated out in six‐well plates at a density of 150 000 cells/cm2. Wells were coated with poly‐L‐lysine for 1 h at room temperature (0.5% w/v in PBS), rinsed with PBS and incubated with coating medium [dissociation medium with 0.03‰ w/v collagen G (Biochrom, Berlin, Germany)] for 1 h at 37°C followed by two rinsing steps with PBS. Cells were seeded in starter medium. Primary cortical neurons were cultivated with serum‐free neurobasal medium with B27 supplement for 10 to 14 days in vitro before starting with the experiments.
Primary astrocyte‐enriched cultures were prepared from cerebral tissue of 2‐day‐old Wistar rats as described previously (12). All cell lines were grown in a humidified atmosphere of 5% CO2 in air and at 37°C.
Animals
Male normotensive Wistar rats (180 g–200 g; Harlan Winkelmann, Borchen, Germany) were kept in a specific pathogen‐free (SPF) barrier under standardized conditions with respect to temperature and humidity, and were housed on a 12 h light/12 h dark cycle in groups of 4–5 with food and water ad libitum. Animal housing, care and applications of experimental procedures complied with the Guide for the Care and Use of Laboratory Animals of the State Government of Berlin, Germany (http://www.berlin.de/lageso/).
Middle cerebral artery occlusion (MCAO) with reperfusion
Focal cerebral ischemia was induced by right MCAO with subsequent reperfusion after 90 minutes as described previously 10, 20, 29. Briefly, under general anesthesia with isoflurane (Abbot, Wiesbaden, Germany) the right cervical carotid bifurcation was exposed through a midline neck incision. After ligation of the external carotid artery and the proximal common carotid artery (CCA), a 4–0 silicon‐coated nylon monofilament (Ethicon, Norderstedt, Belgium) was gently inserted through the CCA into the internal carotid artery and finally into the middle cerebral artery. After 90 minutes, the filament was withdrawn into the stump of the CCA to allow reperfusion. Sham‐sham‐operated rats underwent only the anesthesia and the right cervical carotid bifurcation was exposed through a midline neck incision. Sham‐operated rats underwent the same surgical procedures as the MCAO group including ligation but except vasotomy and insertion of the occluding monofilament. Body temperature was maintained at 37 ± 0.5°C by a heating pad.
T2‐weighted magnetic resonance imaging (MRI)
MRI was performed 24 h and 48 h after MCAO on a 7 T Bruker scanner (Pharmascan 70/16 AS; Bruker Biospin, Ettlingen, Germany). Anesthesia was induced with 3% and maintained with 1.5%–2.0% isoflurane (Abbot) delivered in 0.5 L/min of 100% O2 via a facemask under constant ventilation monitoring (Small Animal Monitoring & Gating System, SA Instruments, Stony Brook, NY, USA). Cerebral ischemic areas were visualized with a T2‐weighted, fat suppressed 2D turbo spin‐echo sequence (TR 5218.7 ms; TEeff 65.2 ms, RARE factor 8 and 6 averages). Thirty‐five axial slices with a slice thickness of 0.5 mm and no interslice distance were positioned to cover the whole brain. The field of view (FOV) was 3.5 × 3.5 cm and the matrix was 256 × 256 resulting in an inplane resolution of 137 µm. Calculation of lesion volume was carried out with the program Analyze 5.0 (AnalyzeDirect, Inc., Lenexa, KS, USA).
Tissue preparation
Animals used in quantitative real‐time polymerase chain reaction (qPCR) experiments and immunoblots were decapitated 24 h or 48 h post‐MCAO or (sham‐)sham operation in final anesthesia and the brains were removed immediately. The whole brain was cut into serial 2 mm‐thick coronal sections using a plastic rat brain matrix (Zivic Instruments, Pittsburgh, PA, USA). Afterwards, a segment of the right hemisphere (ie, ipsilateral side covering the ischemic area and penumbra in case of MCAO) and left hemisphere (ie, contralateral side) was snap‐frozen in liquid nitrogen.
Brains of animals used in basal (ie, without stroke) expression analysis were dissected into six parts: frontal cortex, piriform cortex, hippocampus, hypothalamus, striatum and amygdala. These preparations were preformed on a cold plate (−10°C) according to Paxinos and Watson (38).
Conventional (semi‐quantitative) reverse transcription (RT) PCR (RT‐PCR)
Cellular total RNA was isolated using the Nucleospin RNA II kit (Macherey‐Nagel, Düren, Germany) according to the manufacturer's protocol including a DNase digest.
Tissue total RNA was isolated using Trizol (Invitrogen) according to the manufacturer's protocol. For both RNA isolations an additional DNase digest was carried out (RQ1 RNase free DNase, Promega, Mannheim, Germany).
cDNA synthesis was performed using random hexamer primers and M‐MLV reverse transcriptase (RNase H minus; Promega, Mannheim, Germany); no template controls (NTCs) and reactions without addition of reverse transcriptase (RT‐) served as negative controls.
PCRs were carried out using 5 U/µL DNA polymerase (PAN, Aidenbach, Germany) and the following primer pairs:
-
1
human PLZF: 5′‐TAGGGTGCACACAGGTGAGA‐3′ (sense),
-
2
5′‐GTGCAGATGGTGCACTGGTA‐3′ (antisense);
-
3
rat PLZF: 5′‐GGAGCATCATGGATCTGACA‐3′ (sense),
-
4
5′‐GATGACCACATCGCACAAAG‐3′ (antisense);
-
5
human AT2R: 5′‐AACATTACCAGCGGTCTTCAC‐3′ (sense),
-
6
5′‐GGAATTGCATCTAAATGCTTATCTGATGGT‐3′ (antisense);
-
7
rat AT2R: 5′‐AATCCCTGGCAAGCATCTTATGT‐3′ (sense),
-
8
5′‐CGGAAATAAAATGTTGGCAATG‐3′ (antisense);
-
9
human (P)RR: 5′‐AAACAAGCGAAGAACCCAGC‐3′ (sense),
-
10
5′‐GGTGATAATCACAGCCAAGGC‐3′ (antisense);
-
11
rat (P)RR: 5′‐CTTGCTGTGGGCAACCTATT‐3′ (sense),
-
12
5′‐GGAACTGCATTCTCCAAAGG‐3′ (antisense);
-
13
human PI3K‐p85α: 5′‐CGGATCTTGCAGAGCAGTTT‐3′ (sense),
-
14
5′‐AGGTTGCTGGAGCTCTGTGT‐3′ (antisense);
-
15
rat PI3K‐p85α: 5′‐CCTGGAAGCCATTGAGAAGA‐3′ (sense),
-
16
5′‐TCGAACACATCCAAGTCCAC‐3′ (antisense);
-
17
human AT1R: 5′‐ CATATTTGTCATGATTCCTACTT‐3′ (sense),
-
18
5′‐GCACAAACTGTAATATTGGTGT‐3′ (antisense);
-
19
rat AT1aR: 5′‐ ACCAGGTCAAGTGGATTTCG‐3′ (sense),
-
20
5′‐TCAACCTCTACGCCAGTGTG‐3′ (antisense);
-
21
rat AT1bR: 5′‐ GGTTCCCCACCAAATATTCA‐3′ (sense),
-
22
5′‐TTTGGGCTAAGCAGCTCACT‐3′ (antisense);
-
23
human, rat beta‐actin: 5′‐ TGTCACCAACTGGGACGATA‐3′ (sense),
-
24
5′‐CTCTCAGCTGTGGTGGTGAA‐3′ (antisense).
The identities of the AT2R‐specific transcripts were confirmed by sequencing.
Quantitative (real‐time) RT‐PCR (qPCR)
qPCR of PLZF, PLZF target genes [eg, PI3K‐p85α (P)RR, cyclin A2] and stroke‐related genes (eg, cyclin D1) was performed applying a SYBR Green I reaction mix (Applied Biosystems, Darmstadt, Germany) and run on a Stratagene Mx3000P (Stratagene, La Jolla, CA, USA). Data analysis was performed according to the ΔΔC T method (31). Following primer pairs were used for RT‐PCR: PLZF, AT2R, PI3K‐p85α (P)RR and β‐actin: as in conventional RT‐PCR;
-
1
rat BID: 5′‐ CGACGAGGTGAAGACATCCT‐3′ (sense),
-
2
5′‐AGACGTCACGGAGCAGAGAT‐3′ (antisense);
-
3
human BID: 5′‐CAGCAAAGTGGTTCCCTC ‐3′ (sense),
-
4
5′‐CCTCATGTTGTGGTCACA ‐3′ (antisense);
-
5
rat cyclin A2: 5′‐ GTAAACAGCCTGCCTTCACC‐3′ (sense),
-
6
5′‐GAGACAGCGGCACTAAAAGC‐3′ (antisense);
-
7
human cyclin A2: 5′‐TTATTGCTGGAGCTGCCT ‐3′ (sense),
-
8
5′‐CTCTGGTGGGTTGAGGA ‐3′ (antisense);
-
9
rat cyclin D1: 5′‐ TGCAAATGGAACTGCTTCTG‐3′ (sense),
-
10
5′‐GCGGATGATCTGCTTGTTCT‐3′ (antisense);
-
11
rat IL‐6: 5′‐ ATATGTTCTCAGGGAGATCTTGGAA‐3′ (sense)
-
12
5′‐AGTGCATCATCGCTGTTCATACA‐3′ (antisense).
Data represent the mean expression level ± standard error of the mean (SEM) (standardized to β‐actin expression) of at least three independent measurements per cDNA (technical triplicates).
Immunoblotting
Cells or homogenized tissue were dissociated with a pestle and incubated on ice for 60 minutes in a lysis buffer containing 10 mM Tris‐HCl pH 8.0, 140 mM NaCl, 1% Triton X‐100, 0.1% sodium deoxycholate, 0.1% sodium dodecyl sulfate (SDS), 1 mM EDTA (pH 7.4), 0.5 mM ethylene glycol tetraacetic acid (EGTA) (pH 8.0), 1 mM sodium fluoride (NaF) and 1 mM Na3VO4, and supplemented with a protease inhibitor cocktail (Roche, Penzberg, Germany) and mixed every 10 minutes. After centrifugation at 15 000 g for 30 min the supernatant was harvested.
For all samples, we quantified the lysates for total protein using the Bicinchoninic Acid Protein Assay (BCA assay, Sigma, Saint Quentin Fallavier, France). 15 microg protein per lysate was added to 6× loading buffer [0.7 M Tris‐Base pH 6.8, 10% SDS, 30% Glycerin, 0.6 M dithiothreitol (DTT) and 0.012% bromo‐phenol‐blue], diluted with water to a concentration of 1×, heated at 95°C for 5 minutes and loaded on a 10% SDS‐polyacrylamide (PAA) gel.
Proteins were wet‐blotted on a PVDF membrane (GE HealthCare, München, Germany) for 1 h and 100 V/6 cm in Towbin buffer containing 25.9 mM Tris‐Base, 192 mM Glycine, 0.05% SDS and 20% methanol. Membranes were incubated with mouse anti‐PLZF (1:500; sc‐28319) monoclonal antibody, rabbit anti‐AT2R (1:1000; sc‐9040), rabbit anti‐AT1R (1:1000; sc‐1173) polyclonal antibodies (all from Santa Cruz, Heidelberg, Germany), goat anti‐(P)RR (1:1000) polyclonal antibody (corresponding to the anti‐ATP6AP2 antibody from Abcam, Cambridge, UK), rabbit anti‐PI3K‐p85α (1:1000; #4292, polyclonal antibody) from Cell Signaling, Frankfurt a. M., Germany and mouse anti‐glyceraldehyde‐3‐phosphate dehydrogenase (GAPDH) (1:100 000; MAB374, monoclonal antibody from Chemicon, Schwalbach, Germany), respectively, followed by an incubation with rabbit anti‐goat (1:2000), swine anti‐rabbit (1:2000) or rabbit anti‐mouse (1:3000) horseradish peroxidase (HRP)‐conjugated secondary antibodies (Dako, Hamburg, Germany; Denmark), respectively. Target proteins were detected by the Enhanced Chemiluminescence Detection System (GE HealthCare). Densitometric quantification of Western blot signal intensities [given as integrated density values (IDV)] standardized to GAPDH and normalized to the sham‐sham animals was performed using the program ImageJ (National Institut of Health, Bethesda, MD, USA).
Subcellular protein extraction
A fractionated extraction of cytosolic and nuclear proteins was performed as described previously (16). Protein concentrations were determined using the DC Protein Assay (Bio‐Rad, München, Germany). Cytosolic and nuclear fractions were controlled by Western blotting using antibodies against calpain (1:1000; cat. no. 208730, Calbiochem, Darmstadt, Germany) and TFIID (TBP) (1:200; sc‐273, Santa Cruz), respectively.
Constructs
The complete coding sequence (CDS) of the human PLZF, based on GenBank GI:31543978, was subcloned into the mammalian expression vector pCEP4 (Invitrogen) with a C‐terminal HA‐tag using the following primers:
-
1
5′‐GAGGAAAGCTTGCCACCATGGATCTGACAAAAATGGGCATGATCCAGC–3′ (sense, translation start codon underlined),
-
2
5′‐TCCTCCTCGAGTCAAGCGTAGTCTGGGACGTCGTATGGGTACACATAGCACAGGTAGAGGTACGTCTTCTCTATCCTCCAGTCGGGCGGGATCTCCTCGGGC‐3′ (antisense).
Serial deletion mutants of the human AT2R promoter were subcloned into the luciferase reporter vector pGL3‐basic (Promega, Mannheim, Germany) as described previously (43).
Four promoter haplotypes resulting from two single nucleotide polymorphisms (SNPs) within the human (P)RR promoter [−991G > A (infrequent SNP based on preliminary data) and −884A > G (refSNP ID rs2968915) (both positions relative to the translational start site)] were subcloned into the luciferase reporter vector pGL3‐basic (Promega). Respective PCRs—spanning 1100 bp of the (P)RR promoter directly upstream of the translational start site as described previously (15) —were performed on genomic DNA of donors after approval by the ethical committee of the Charité (votes no. 2140, EA1/076/05 and 215‐10) and on the basis of a written informed consent; the infrequent SNP −991G > A was introduced by site‐directed mutagenesis as described previously (15).
All constructs were confirmed by sequencing.
Generation of stably PLZF overexpressing KELLY cells
Neuronal KELLY cells were cultured in six‐well plates to a confluence of 50%–70%. Three µg of an insertless pCEP4 vector or a PLZF‐pCEP4 expression vector were transfected per well using Genejuice (Merck Biosciences, Bad Soden, Germany) according to the manufacturer's protocol. Twenty‐four hours after transfection medium was exchanged and transfected cells were selected in medium containing hygromycin B. The concentration of hygromycin B was based on the results of preliminary tests (250 µg/mL, at which there were no surviving cells at day 7 after beginning of treatment).
Luciferase assays
Cells were seeded on day 0 in 24‐well plates; 50 ng of indicated pGL3‐basic constructs (encoding firefly luciferase) and 10 ng of phRL‐null plasmid (encoding humanized renilla luciferase for standardization of promoter activity; Promega) per well were transfected on day 2 at 60%–80% confluency using Genejuice (Merck Biosciences) according to the manufacturer's protocol. Cells were harvested 48 h after transfection using Passive Lysis Buffer (Promega). Reporter activities were measured in a Wallac1420 Multilabel Counter Victor (PerkinElmer LAS GmbH, Rodgau‐Jügesheim, Germany) using the Dual‐Luciferase Reporter Assay System (Promega). Promoter activity is expressed as relative luciferase activity (RLA), that is, ratio of the firefly luciferase/renilla luciferase mean values of each construct related to the promoterless reporter plasmid pGL3‐basic (17). RLA data represent the mean ± SEM of at least three single, parallel transfection experiments.
Glutamate treatment
The indicated cell types were seeded in 96‐well plates for the Cell Viability Assay (see below) at a density of 0.5 × 10⁶ cells per cm2 on day 0. Cells were starved for 24 h on day 3 and then treated with 0, 25, 50, 75 and 100 mM glutamate (Sigma, Taufkirchen, Germany) for additional 24 h.
Cell viability assay, caspase assay and proliferation assay
KELLY wild‐type cells and KELLY cells stably transfected with an insertless pCEP4 vector or a PLZF‐pCEP4 expression vector were seeded in 96‐well plates at a density of 0.5 × 10⁶ cells per cm2 on day 0; 24, 48, 72, 96 and 120 h later, the Celltiter‐Glo Luminescent Cell Viability Assay and Caspase‐Glo 3/7 Assay (both Promega) were performed following the manufacturer's standard protocol. Proliferation was measured using the 5‐bromo‐2′‐deoxy‐uridine (BrdU) Labeling and Detection Kit III (Roche, Mannheim, Germany).
Statistical analysis
A two‐tailed t‐test was applied and statistical significance was assumed at p < 0.05. Vertical lines in the histograms indicate SEM.
RESULTS
Expression of PLZF and RAS components in cultured cells and murine brain regions
To analyze the expression of PLZF and RAS components on transcript and protein level, we performed semi‐quantitative RT‐PCR and Western blot analyses of different human cell lines, primary neuronal and glial cells as well as of murine brain nuclei. The observed molecular weights of PLZF (51) AT2R (29), AT1R (29), (P)RR (44), PI3K (49) in our Western blot analysis are consistent with the literature. Among cultured human cells, positive mRNA and protein expression of PLZF was only observed in neuronal KELLY cells (Figure 1, Table 1). Furthermore, all primary murine cells and brain areas analyzed including, for example, cortex and striatum expressed PLZF mRNA and protein (Figure 1, Table 1). The AT2R showed a similar pattern as PLZF (Figure 1, Table 1). AT1R, PI3K and (P)RR exhibited an ubiquitous expression (Figure 1, Table 1). We therefore used the human, neuronal KELLY cells for our subsequent in vitro studies.
Figure 1.
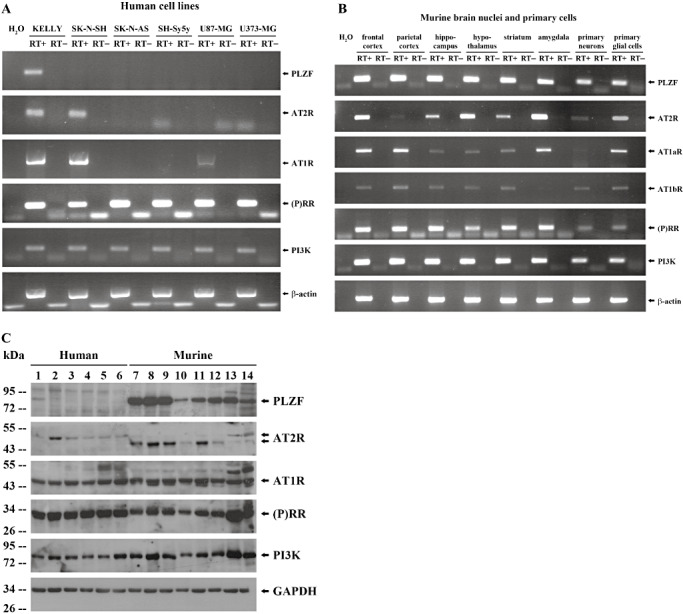
Expression analysis of PLZF and related components of the RAS. A,B. Indicated transcript expression was analyzed in human cell lines (A) as well as in murine brain nuclei and primary cells (B) by semi‐quantitative RT‐PCR. C. Indicated protein expression of KELLY (lane 1), SK‐N‐SH (lane 2), SK‐N‐AS (lane 3), SH‐Sy5y (lane 4), U87‐MG (lane 5), U373‐MG cells (lane 6), frontal cortex (lane 7), parietal cortex (lane 8), hippocampus (lane 9), hypothalamus (lane 10), striatum (lane 11), amygdala (lane 12), primary neurons (lane 13) and primary glial cells (lane 14) was quantified by Western blotting. The two different molecular sizes of human and murine AT2R most likely reflect different glycosylation patterns (50). Abbreviations: PLZF = promyelocytic leukemia zinc finger; RAS = Renin‐angiotensin system; RT‐PCR = Reverse transcription polymerase chain reaction; AT2R = AT2 receptor; AT1R = AT1 receptor; (P)RR = (Pro)renin receptor; PI3K = Phosphatidylinositol‐3 kinase; GAPDH = Glyceraldehyde‐3‐phosphate dehydrogenase.
Table 1.
Expression analysis of promyelocytic leukemia zinc finger (PLZF) and related components of the renin‐angiotensin system (RAS). Abbreviations: AT2R = AT2 receptor; AT1R = AT1 receptor; (P)RR = (Pro)renin receptor; PI3K = Phosphatidylinositol‐3 kinase.
| KELLY | SK‐N‐SH | SK‐N‐AS | SH‐Sy5y | U87‐MG | U373‐MG | Frontal cortex | Parietal cortex | Hippocampus | Hypothalamus | Striatum | Amygdala | Primary neuronal cells | Primary glial cells | ||
|---|---|---|---|---|---|---|---|---|---|---|---|---|---|---|---|
| PLZF | mRNA protein | + | − | − | − | − | − | + | + | + | + | + | + | + | + |
| + | − | − | − | − | − | + | + | + | + | + | + | + | + | ||
| AT2R | mRNA protein | + | + | − | − | − | − | + | (+) | + | + | + | + | (+) | + |
| (+) | + | (+) | (+) | (+) | (+) | + | + | + | (+) | + | (+) | (+) | (+) | ||
| AT1R (a/b) | mRNA protein | + | + | − | − | + | − | + | + | + | + | +/(+) | + | (+) | + |
| + | + | + | + | + | + | + | + | + | + | + | + | + | + | ||
| (P)RR | mRNA protein | + | + | + | + | + | + | + | + | + | + | + | + | + | + |
| + | + | + | + | + | + | + | + | + | + | + | + | + | + | ||
| PI3K‐p85α‐subunit | mRNA protein | + | + | + | + | + | + | + | + | + | + | + | + | + | + |
| + | + | + | + | + | + | + | + | + | + | + | + | + | + | ||
| housekeeping | mRNA protein | + | + | + | + | + | + | + | + | + | + | + | + | + | + |
| + | + | + | + | + | + | + | + | + | + | + | + | + | + |
Protein and total RNA were extracted from different human neuronal and glial cell lines, from murine brain nuclei as well as from primary murine cells followed by Western blotting and reverse transcription polymerase chain reaction (RT‐PCR) analysis, respectively. β‐actin (mRNA level) and glyceraldehyde‐3‐phosphate dehydrogenase (GAPDH) (protein level) served as housekeeping genes. +: expression; (+): weak expression; −: no expression.
PLZF overexpression mediates neuroprotection in human neuronal cells
To evaluate the function of PLZF regarding neuronal survival in vitro, KELLY cells were stably transfected with an episomal expression plasmid encoding the complete coding sequence of PLZF or an insertless control vector. qPCR indicated an approximate 1000‐fold increased expression of PLZF in the respective cell line (Figure 2A). The nuclear overexpression of PLZF on protein level was demonstrated by a fractionated protein isolation followed by Western blotting against PLZF (Figure 2B). Overexpression was also confirmed using an antibody against the HA‐tag and total proteins (data not shown). PLZF overexpression caused a significant 1.4‐fold decrease in absolute neuronal cell number 4 days after seeding compared with insertless vector control and also wild‐type cells (Figure 3A). Proliferation—as measured by BrdU incorporation at day 4 after seeding—significantly decreased 1.2‐fold in cells overexpressing PLZF compared with vector control (Figure 3B). Neuronal apoptosis also decreased significantly by PLZF overexpression (Figure 3C). Nevertheless, mechanisms besides PLZF overexpression [eg, effects related to the selection process using hygromycin B (41)] seem to be involved in the regulation of caspase activity as overexpression of the insertless control vector already strongly affected caspase activity (Figure 3C). In contrast, wild‐type and insertless control cells did not exhibit significant differences regarding proliferation (Figure 3B).
Figure 2.
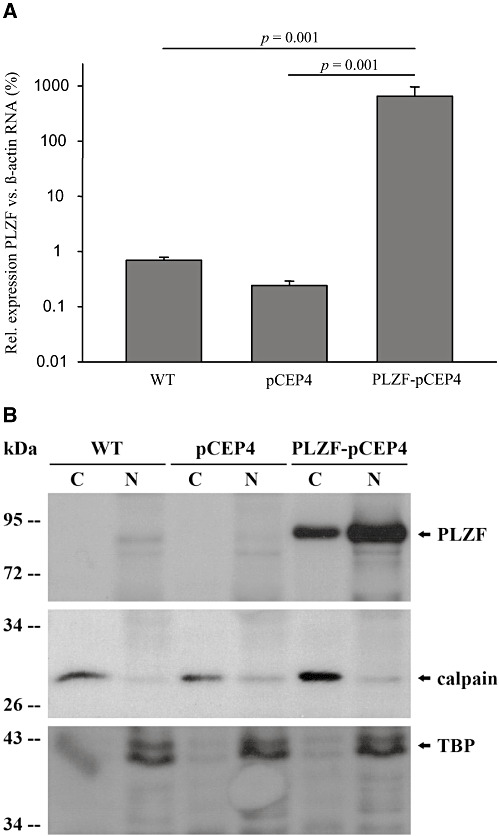
Generation of stably promyelocytic leukemia zinc finger (PLZF) overexpressing KELLY cells. A. PLZF mRNA expression standardized to β‐actin was quantified by real‐time polymerase chain reaction in wild‐type (WT) KELLY cells and in KELLY cells stably transfected with an episomal PLZF overexpression construct (PLZF‐pCEP4) or an insertless vector control (pCEP4), respectively. Data (mean ± standard error of the mean; logarithmic scale) represent four independent experiments (each in technical triplicates) based on two independent stable transfections. B. Nuclear (N) and cytosolic (C) proteins were isolated from KELLY cells as in Figure 2A and protein expression of PLZF as well as nuclear [TATA box‐binding protein (TBP)] and cytosolic (calpain) control markers were analyzed by Western blotting.
Figure 3.
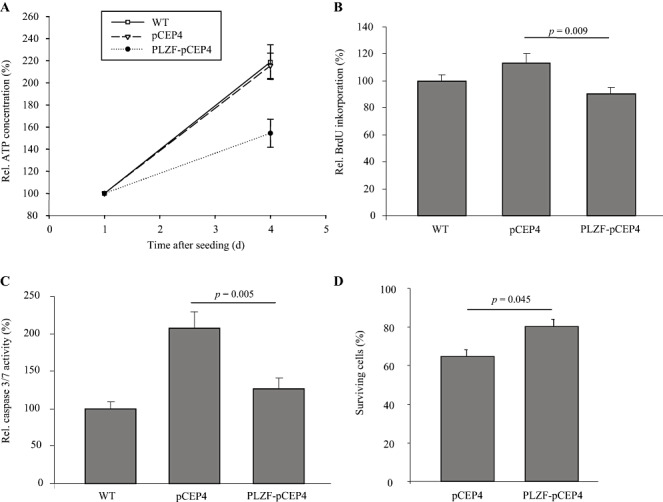
Functional analysis of promyelocytic leukemia zinc finger (PLZF) overexpressing KELLY cells. A. Viable cell numbers of wild‐type (WT) KELLY cells (set to 100%) and of KELLY cells stably transfected with an episomal PLZF overexpression construct (PLZF‐pCEP4) or an insertless vector control (pCEP4) were measured by a chemoluminescence‐based ATP assay. Data [mean ± standard error of the mean (SEM)] normalized to day 1 after seeding represent four independent experiments (each with n = 6) based on two independent stable transfections. p = 0.023 (WT vs. PLZF‐pCEP4); p = 0.033 (pCEP4 vs. PLZF‐pCEP4). B. Proliferation of WT KELLY cells (set to 100%), of PLZF‐pCEP4 and pCEP4 KELLY cells was measured by 5‐bromo‐2'‐deoxy‐uridine (BrdU) incorporation. Data (mean ± SEM) represent two independent experiments (each with n = 6). C. Caspase 3/7 activity of WT KELLY cells (set to 100%), PLZF‐pCEP4 and pCEP4 KELLY cells was measured by a chemoluminescence‐based caspase assay. Data (mean ± SEM) represent four independent experiments (each with n = 6). D. PLZF‐pCEP4 and pCEP4 KELLY cells were subjected to glutamate toxicity for 24 h. Number of surviving cells (after 24 h of glutamate incubation) relative to untreated cells (pCEP4 or PLZF‐pCEP4, respectively) at the same time point were measured as in (A). Data (mean ± SEM) represent four independent experiments (each with n = 6) based on two independent stable transfections.
To analyze the effect of PLZF in an in vitro neuronal injury model, KELLY cells were subjected to glutamate. After a glutamate incubation period of 24 h, 65% of cells with an endogenous PLZF expression level survived. PLZF overexpression increased survival rate to 80% (Figure 3D).
Finally, a series of PLZF target genes were evaluated by qPCR to examine putative molecular mechanisms underlying these cellular effects. PLZF overexpression caused a significant upregulation of AT2R transcripts, whereas cyclin A2 was repressed by PLZF (Figure 4). Other putative target genes of the PLZF pathway such as (P)RR or PI3K‐p85α were not altered in the neuronal KELLY context (Figure 4).
Figure 4.
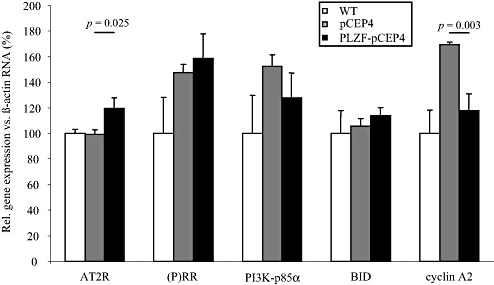
Expression of promyelocytic leukemia zinc finger (PLZF)‐related genes in PLZF overexpressing KELLY cells. Expression of PLZF interaction partners and putative known PLZF target genes were measured by real‐time polymerase chain reaction in wild‐type (WT) KELLY cells (set to 100%) and in KELLY cells stably transfected with an episomal PLZF overexpression construct (PLZF‐pCEP4) or an insertless vector control (pCEP4). Data (mean ± SEM) represent technical triplicates. Abbreviations: AT2R = AT2 receptor; (P)RR = (Pro)renin receptor; PI3K = Phosphatidylinositol‐3 kinase; SEM = Standard error of the mean.
Functional analysis of AT2R and (P)RR promoters
Previously, we have subcloned several deletion mutants of the human AT2R promoter (43). To analyze the putative effect of PLZF on these constructs [ie, whether the effect of PLZF on the AT2R mRNA level (Figure 4) is mediated on the promoter level], the respective luciferase reporter vectors were transiently transfected into stably PLZF overexpressing neuronal KELLY cells and respective insertless control cells (Figure 5A). We were able to confirm the major regulatory impact of the exon 1‐intron 1 region on the gene regulation of the AT2R as the [−216 bp] construct comprising this region exhibited the strongest promoter activity (Figure 5A). PLZF overexpression did not change promoter activities of any deletion mutant (Figure 5A).
Figure 5.
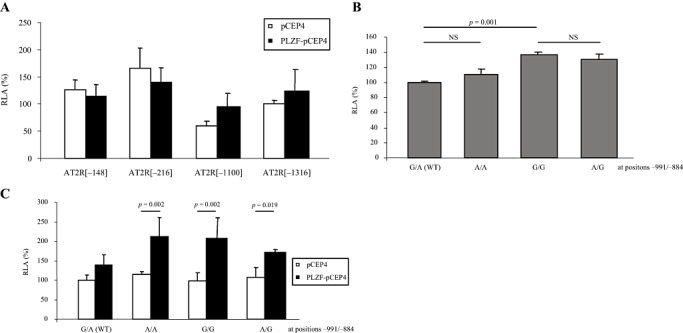
Functional analysis of human AT2 receptor (AT2R) and (pro)renin receptor [(P)RR promoters]. A. Serial deletion mutants of the human AT2R promoter were transiently transfected into KELLY cells stably transfected with an episomal promyelocytic leukemia zinc finger (PLZF) overexpression construct (PLZF‐pCEP4) or an insertless vector control (pCEP4), respectively. Promoter activities are expressed as relative luciferase activity (RLA) with the full‐length construct (AT2R[−1316]) set to 100%. Data [mean ± standard error of the mean (SEM)] represent six independent experiments (each with n = 3) based on two independent stable transfections. B. Four different promoter haplotypes of the human (P)RR were subcloned into the luciferase reporter vector pGL3‐basic and transiently transfected into KELLY wild‐type cells. G/A, A/A, G/G and G/A refer to the nucleotide at polymorphic position −991 and −884, respectively. Data (mean ± SEM) represent technical triplicates. WT = Wild‐type; NS = Non‐significant. C. The haplotype‐specific promoter constructs shown in (B) were transiently transfected into PLZF‐pCEP4 or pCEP4 KELLY cells, respectively. Data (mean ± SEM) represent two independent experiments (each with n = 3) based on two independent stable transfections.
The human (P)RR promoter contains a functional cis‐element for PLZF binding (44). Furthermore, as discussed above, the (P)RR is involved in neuronal survival during development. Therefore, the functional effects of two SNPs located upstream of the transcriptional start site on basal (P)RR promoter activity were analyzed. The SNP −884(A > G), which was described in NCBI database (rs2968915) and in the literature (23) significantly affected basal promoter activity in wild‐type (ie, without selection pressure) KELLY cells (Figure 5B). This effect was independent of the nucleotide at position −991, that is, there was no significant differences in promoter activities of G/A vs. A/A and of G/G vs. A/G, respectively (Figure 5B).
PLZF overexpression did not alter standardized luciferase activity of the wild‐type (P)RR promoter but significantly increased RLAs of the less frequent haplotypes (Figure 5C).
In contrast to wild‐type cells, the SNPs did not affect luciferase activity in KELLY cells stably transfected with an insertless control vector (Figure 5C) which might reflect effects of the antibiotic selection.
Expression of PLZF and its target genes in an in vivo stroke model
MCAO is an established in vivo model of stroke (28). We analyzed the expression of PLZF and PLZF‐related genes in 35 male Wistar rats 24 h and 48 h after MCAO on the ipsilateral (ie, stroke hemisphere) and contralateral (ie, intraindividual control) side. Ipsilateral stroke induction was confirmed by MRI, and animals with a volume greater than 50 mm3 were subjected to further molecular analyses. As expected, transcripts known to be upregulated after stroke such as cyclin D1 and IL‐6 3, 37 were strongly induced (2‐ to 12‐fold depending on the time point; Table 2A, B) on the ipsilateral hemisphere in animals subjected to MCAO but not in control rats.
Table 2.
Expression analysis of promyelocytic leukemia zinc finger (PLZF), PLZF‐associated renin‐angiotensin system (RAS) components and stroke‐related genes in murine stroke. Abbreviations: AT2R = AT2 receptor; (P)RR = (Pro)renin receptor; PI3K = Phosphatidylinositol‐3 kinase, MCAO = middle cerebral artery occlusion.
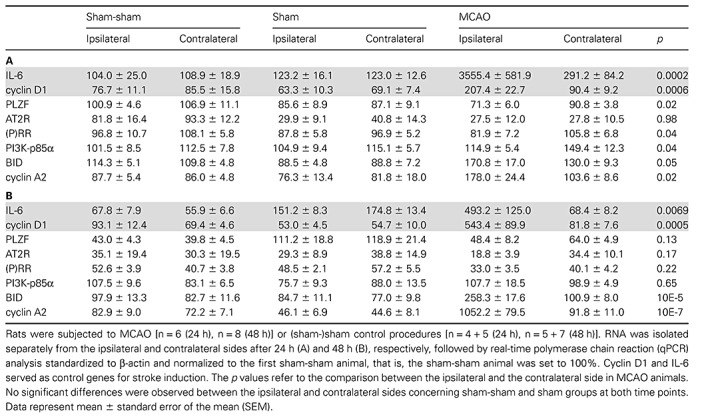
Cyclin A2 significantly increased on the injured hemisphere at both time points (Table 2A, B). The respective upstream regulator PLZF was downregulated at 24 h on mRNA level (Table 2A) and at 48 h on protein level (Figure 6B) after MCAO only on the ipsilateral hemisphere. The above‐mentioned PLZF protein regulation refers to the Western blot signal between 72 kDa and 95 kDa which is consistent with the literature (51). Interestingly, we also observed the appearance of an additional shorter signal of about 72 kDa only on the ipsilateral stroke side (Figure 6A, B).
Figure 6.
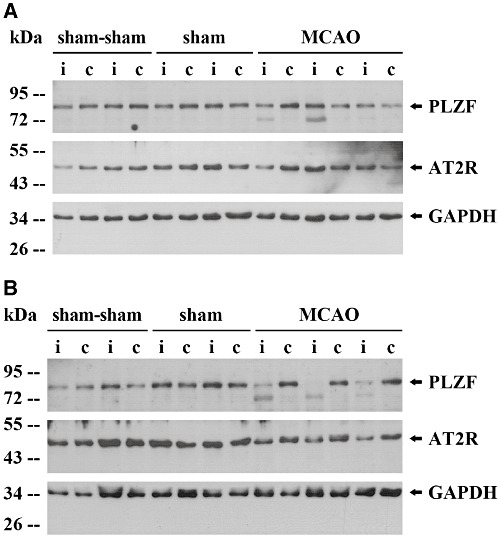
Promyelocytic leukemia zinc finger (PLZF) and AT2 receptor (AT2R) protein expression in experimental stroke. Rats were subjected to middle cerebral artery occlusion MCAO (n = 3) or (sham‐)sham control procedures (n = 2 + 2). Proteins were isolated separately from the ipsilateral (i) and contralateral (c) sides after 24 h (A) and 48 h (B), respectively, followed by Western blotting. Abbreviation: GAPDH = Glyceraldehyde‐3‐phosphate dehydrogenase.
Regarding PLZF target gene expression on the ipsilaterial hemisphere, we found a significant increase of cyclin A2 and BID 24 h and 48 h after stroke as well as a significant decrease of (P)RR and PI3K mRNA expression 24 h after MCAO (Table 2A, B). Concerning AT2R mRNA expression, a stroke‐induced reduction, which did not reach significance, was observed after 48 h (Table 2B). Regarding AT2R expression on the protein level at 48 h, a non‐significant [from 75% to 49% IDV(AT2R)/IDV(GAPDH); p = 0.06; not shown] reduction was detected in the ipsilateral (stroke) side compared with the contralateral hemisphere, whereas in sham‐sham and sham animals there was no tendency for a reduction in AT2R expression (p = 0.95 and p = 0.4, respectively) (Figure 6B).
DISCUSSION
Recently, the transcription factor PLZF was identified as a novel regulator within the RAS based on its ability to mediate the signal transduction of the (P)RR (44) and also of the AT2R (49). Both receptors are involved in neuronal survival 1, 29 and differentiation 7, 34. Nevertheless, the role of PLZF per se in adult neuronal pathophysiology is unknown. Here we have demonstrated that PLZF exerts antiproliferative effects in human neuronal cells and mediates neuroprotection in a glutamate in vitro toxicity model. It is known that activation of the cell cycle—caused, for example, by the loss of endogenous cyclin‐dependent kinase (cdk) inhibitors and the consecutive activation of cyclin D1—causes cellular death in terminally differentiated neurons 25, 27, 40 thereby linking pro‐proliferative signals and neuronal loss as illustrated in Figure 7. Consistent with the literature (27), we have demonstrated that cyclin A and cyclin D1—with the latter used as positive control for ipsilateral stroke induction—is upregulated in ischemic injury. PLZF likely counteracts this detrimental activation of cyclins and the consecutive neuronal death based on our in vitro finding that it acts as a suppressor of cyclin A2 and a neuroprotective factor (Figure 7). During ischemic injury this protective mechanism is inactivated as PLZF protein was strongly downregulated on the ipsilateral stroke side with an associated upregulation of cyclin A (Table 2A, B; 6, 7).
Figure 7.
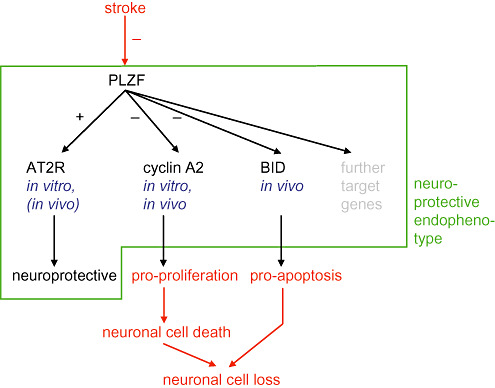
Mechanisms of promyelocytic leukemia zinc finger (PLZF)‐induced neuroprotection. The effects of PLZF on the neuroprotective factor AT2 receptor (AT2R), the pro‐proliferative protein cyclin A2 and the pro‐apoptotic protein BID are shown. The link between pro‐proliferative signals and neuronal loss is based on the fact that activation of the cell cycle causes cellular death in terminally differentiated neurons.
Consistent with our data, it was shown that PLZF represses pro‐proliferative genes 33, 60 and exhibits growth inhibitory effects (9). Besides the antiproliferative effects of PLZF in the neuronal context in this study, there are additional mechanisms which may underlay the neuroprotective effects of PLZF. Here we have demonstrated that AT2R is significantly upregulated by PLZF in vitro. This receptor is known for its neuroprotective (54) and antiproliferative (52) effects (Figure 7). Nevertheless, despite two consensus sequences for PLZF within the AT2R promoter according to the bioinformatic tool Matinspector (6), PLZF overexpression did not alter AT2R promoter activity within our luciferase assay (Figure 5A) which might reflect effects of the chromatin context or regulation of mRNA stability. In this study, stroke did not cause a significant dysregulation of the AT2R as measured by qPCR and Western blotting on the entire ipsilateral side. A previous publication (29) showed an increased AT2R expression in the peri‐infarct area which might indicate specific regulation of the AT2R in the penumbra.
Concerning the gene regulation of the (P)RR, we were able to demonstrate the functionality of a SNP at position −884 relative to the translational start site (Figure 5B). Interestingly, this polymorphism is associated with hypertension in humans (23). The −884G allele, which displayed higher basal promoter activity, was also associated with a higher systolic and diastolic 24 h blood pressure. According to Matinspector (6) this non‐wild‐type G‐allele causes a loss of consensus sequences for the intestine‐specific homeodomain factor CDX‐1, HOX‐PBX complexes and Fork head domain factors such as winged‐helix transcription factor, IL‐2 enhancer binding factor (ILF) or forkhead box K2 (FOXK2). Further experiments such as super‐shift electrophoretic mobility shift assays (EMSAs) are necessary to identify which of these transcription factors is responsible for the functionality of the −884 SNP. Interestingly, the (P)RR SNPs seem to affect the effects of a stable PLZF overexpression as only the non‐wild‐type promoter haplotypes are positively regulated by this intervention in the neuronal KELLY cells (Figure 5C). In additon, PLZF overexpression does not alter (P)RR mRNA expression in KELLY cells (Figure 4). Furthermore (P)RR is not strongly regulated in stroke (Table 2A, B). We have shown previously that PLZF is a negative regulator of the (P)RR gene and that transient PLZF cotransfection represses the (P)RR promoter activity in non‐KELLY cells (44). Furthermore, the (pro)renin‐(P)RR‐PLZF pathway causes pro‐proliferation in epithelial cells (46), cardiomyoblasts (44) and endothelial cells (56). These different transcriptional and cellular effects of the (P)RR cascade might reflect cell type specificities, gene regulatory kinetics (eg, the duration of PLZF overexpression/activation and the time‐point of the downstream target analysis) and/or stroke‐related mechanisms.
The gene encoding (P)RR exhibits housekeeping properties (44) which is consistent with the observed ubiquitous expression pattern of the (P)RR (Table 1, Figure 1). The apparent expression of the AT2R and AT1R in several human cells in the absence of the respective mRNA expression (Table 1) might be explained, for example, by highly unstable, low abundant transcripts or by different mRNA and protein kinetics depending on factors such as confluence.
Besides the decreased proliferation rate and reduced cell number caused by PLZF overexpression (Figure 3A, B), we unexpectedly observed a decreased activation of caspase 3/7 when the PLZF expression vector and the insertless control vector are compared (Figure 3C). Nevertheless, this apparent regulation of the caspases on the molecular level does not translate to the total cell number which is decreased by PLZF overexpression. This might imply that activation of caspase 3/7 does not necessarily cause apoptosis on the cellular level, a phenomenon which already has been observed 22, 48. Alternatively, because stable transfection of the control vector per se already altered caspase activity compared with wild‐type cells (Figure 3C), we conclude that PLZF affects caspase activity only in a cellular system with an increased basal (ie, by selection procedure) activation of caspase 3/7.
Concerning the role of apoptosis in vivo, we have shown here that stroke upregulates the pro‐apoptotic factor BID, a known target gene of PLZF (36). This mechanism—besides the cell cycle activation—might contribute to the neuronal loss in this pathological condition. Regarding gene regulation in stroke, we observed an additional PLZF isoform by Western blotting only in ipsilateral stroke side of about 72 kDa (Figure 6A, B). This restricted expression pattern (ie, only on ipsilateral stroke side) is indicative of specificity. PLZF isoforms generated by alternative splicing have been described in the literature (62). We performed analyses on RNA level in these tissues without detecting splicing events (data not shown). Therefore, the additional 72 kDa PLZF isoform might represent a degradation product or a different post‐translational modification.
Regarding the transferability of the observed neuroprotective effects of PLZF in vitro to the in vivo context, our expression analyses in the stroke animal model per se is not indicative of a causal link between PLZF and certain target genes in vivo and of a neuroprotective role in vivo. Nevertheless, our in vitro analyses of PLZF overexpressing cells (Figure 4) indicated that PLZF is upstream of the AT2R gene. Furthermore, the presence of cis‐elements for PLZF binding in the promoter regions of cyclin A (60) and BID (36) indicates that PLZF is also upstream of these genes. Future investigations—for example, MCAO in wild‐type vs. PLZF knockout mice—are necessary to better address the putative neuroprotective effects of PLZF in vivo.
To conclude, we have shown that stroke decreases the ipsilateral expression of the transcription factor PLZF which per se causes a neuroprotective endophenotype by regulation of certain neuroprotective and neurodetrimental target genes such as AT2R and cyclin A2, respectively (Figure 7).
ACKNOWLEDGMENTS
The work on the RER was supported by grants from the Investitionsbank Berlin (IBB) (ProFIT program, no. 10138510, Europäische Union. Europäischer Fonds für regionale Entwicklung (EFRE). Investition in Ihre Zukunft.) and the European Union (Network of Excellence “InGenious HyperCare”, no. 037093, JRP B1–P15).
REFERENCES
- 1. Amsterdam A, Nissen RM, Sun Z, Swindell EC, Farrington S, Hopkins N (2004) Identification of 315 genes essential for early zebrafish development. Proc Natl Acad Sci U S A 101:12792–12797. [DOI] [PMC free article] [PubMed] [Google Scholar]
- 2. Barna M, Hawe N, Niswander L, Pandolfi PP (2000) Plzf regulates limb and axial skeletal patterning. Nat Genet 25:166–172. [DOI] [PubMed] [Google Scholar]
- 3. Basic Kes V, Simundic AM, Nikolac N, Topic E, Demarin V (2008) Pro‐inflammatory and anti‐inflammatory cytokines in acute ischemic stroke and their relation to early neurological deficit and stroke outcome. Clin Biochem 41:1330–1334. [DOI] [PubMed] [Google Scholar]
- 4. Brdon J, Kaiser S, Hagemann F, Zhao Y, Culman J, Gohlke P (2007) Comparison between early and delayed systemic treatment with candesartan of rats after ischaemic stroke. J Hypertens 25:187–196. [DOI] [PubMed] [Google Scholar]
- 5. Brunton LL, Lazo JS, Parker KL (2006) The Pharmacological Basis of Therapeutics, 11th edn. Goodman and Gilman's: McGraw‐Hill: New York. [Google Scholar]
- 6. Cartharius K, Frech K, Grote K, Klocke B, Haltmeier M, Klingenhoff A et al (2005) MatInspector and beyond: promoter analysis based on transcription factor binding sites. Bioinformatics 21:2933–2942. [DOI] [PubMed] [Google Scholar]
- 7. Contrepas A, Walker J, Koulakoff A, Franek KJ, Qadri F, Giaume C et al (2009) A role of the (pro)renin receptor in neuronal cell differentiation. Am J Physiol Regul Integr Comp Physiol 297:R250–R257. [DOI] [PMC free article] [PubMed] [Google Scholar]
- 8. Cook M, Gould A, Brand N, Davies J, Strutt P, Shaknovich R et al (1995) Expression of the zinc‐finger gene PLZF at rhombomere boundaries in the vertebrate hindbrain. Proc Natl Acad Sci U S A 92:2249–2253. [DOI] [PMC free article] [PubMed] [Google Scholar]
- 9. Costoya JA, Hobbs RM, Pandolfi PP (2008) Cyclin‐dependent kinase antagonizes promyelocytic leukemia zinc‐finger through phosphorylation. Oncogene 27:3789–3796. [DOI] [PubMed] [Google Scholar]
- 10. Dai WJ, Funk A, Herdegen T, Unger T, Culman J (1999) Blockade of central angiotensin AT(1) receptors improves neurological outcome and reduces expression of AP‐1 transcription factors after focal brain ischemia in rats. Stroke 30:2391–2398. discussion 2398–2399. [DOI] [PubMed] [Google Scholar]
- 11. De Gasparo M, Catt KJ, Inagami T, Wright JW, Unger T (2000) International union of pharmacology. XXIII. The angiotensin II receptors. Pharmacol Rev 52:415–472. [PubMed] [Google Scholar]
- 12. De Groot CJ, Langeveld CH, Jongenelen CA, Montagne L, Van Der Valk P, Dijkstra CD (1997) Establishment of human adult astrocyte cultures derived from postmortem multiple sclerosis and control brain and spinal cord regions: immunophenotypical and functional characterization. J Neurosci Res 49:342–354. [DOI] [PubMed] [Google Scholar]
- 13. Engelhorn T, Doerfler A, Heusch G, Schulz R (2006) Reduction of cerebral infarct size by the AT1‐receptor blocker candesartan, the HMG‐CoA reductase inhibitor rosuvastatin and their combination. An experimental study in rats. Neurosci Lett 406:92–96. [DOI] [PubMed] [Google Scholar]
- 14. Feng YH, Sun Y, Douglas JG (2002) Gbeta gamma‐independent constitutive association of Galpha s with SHP‐1 and angiotensin II receptor AT2 is essential in AT2‐mediated ITIM‐independent activation of SHP‐1. Proc Natl Acad Sci U S A 99:12049–12054. [DOI] [PMC free article] [PubMed] [Google Scholar]
- 15. Funke‐Kaiser H, Bolbrinker J, Theis S, Lemmer J, Richter CM, Paul M, Orzechowski HD (2000) Characterization of the c‐specific promoter of the gene encoding human endothelin‐converting enzyme‐1 (ECE‐1). FEBS Lett 466:310–316. [DOI] [PubMed] [Google Scholar]
- 16. Funke‐Kaiser H, Lemmer J, Langsdorff CV, Thomas A, Kovacevic SD, Strasdat M et al (2003) Endothelin‐converting enzyme‐1 (ECE‐1) is a downstream target of the homeobox transcription factor Nkx2‐5. FASEB J 17:1487–1489. [DOI] [PubMed] [Google Scholar]
- 17. Funke‐Kaiser H, Reichenberger F, Kopke K, Herrmann SM, Pfeifer J, Orzechowski HD et al (2003) Differential binding of transcription factor E2F‐2 to the endothelin‐converting enzyme‐1b promoter affects blood pressure regulation. Hum Mol Genet 12:423–433. [DOI] [PubMed] [Google Scholar]
- 18. Funke‐Kaiser H, Reinemund J, Steckelings UM, Unger T (2010) Adapter proteins and promoter regulation of the angiotensin AT2 receptor—implications for cardiac pathophysiology. J Renin Angiotensin Aldosterone Syst 11:7–17. [DOI] [PubMed] [Google Scholar]
- 19. Fyhrquist F, Saijonmaa O (2008) Renin‐angiotensin system revisited. J Intern Med 264:224–236. [DOI] [PMC free article] [PubMed] [Google Scholar]
- 20. Groth W, Blume A, Gohlke P, Unger T, Culman J (2003) Chronic pretreatment with candesartan improves recovery from focal cerebral ischaemia in rats. J Hypertens 21:2175–2182. [DOI] [PubMed] [Google Scholar]
- 21. Harms C, Lautenschlager M, Bergk A, Freyer D, Weih M, Dirnagl U et al (2000) Melatonin is protective in necrotic but not in caspase‐dependent, free radical‐independent apoptotic neuronal cell death in primary neuronal cultures. FASEB J 14:1814–1824. [DOI] [PubMed] [Google Scholar]
- 22. Hashimoto T, Yamauchi L, Hunter T, Kikkawa U, Kamada S (2008) Possible involvement of caspase‐7 in cell cycle progression at mitosis. Genes Cells 13:609–621. [DOI] [PubMed] [Google Scholar]
- 23. Hirose T, Hashimoto M, Totsune K, Metoki H, Asayama K, Kikuya M et al (2009) Association of (pro)renin receptor gene polymorphism with blood pressure in Japanese men: the Ohasama study. Am J Hypertens 22:294–299. [DOI] [PubMed] [Google Scholar]
- 24. Iwai M, Liu HW, Chen R, Ide A, Okamoto S, Hata R et al (2004) Possible inhibition of focal cerebral ischemia by angiotensin II type 2 receptor stimulation. Circulation 110:843–848. [DOI] [PubMed] [Google Scholar]
- 25. Jang SW, Liu X, Fu H, Rees H, Yepes M, Levey A, Ye K (2009) Interaction of Akt‐phosphorylated SRPK2 with 14‐3‐3 mediates cell cycle and cell death in neurons. J Biol Chem 284:24512–24525. [DOI] [PMC free article] [PubMed] [Google Scholar]
- 26. Kaschina E, Unger T (2003) Angiotensin AT1/AT2 receptors: regulation, signalling and function. Blood Press 12:70–88. [DOI] [PubMed] [Google Scholar]
- 27. Katchanov J, Harms C, Gertz K, Hauck L, Waeber C, Hirt L et al (2001) Mild cerebral ischemia induces loss of cyclin‐dependent kinase inhibitors and activation of cell cycle machinery before delayed neuronal cell death. J Neurosci 21:5045–5053. [DOI] [PMC free article] [PubMed] [Google Scholar]
- 28. Krikov M, Thone‐Reineke C, Muller S, Villringer A, Unger T (2008) Candesartan but not ramipril pretreatment improves outcome after stroke and stimulates neurotrophin BNDF/TrkB system in rats. J Hypertens 26:544–552. [DOI] [PubMed] [Google Scholar]
- 29. Li J, Culman J, Hortnagl H, Zhao Y, Gerova N, Timm M et al (2005) Angiotensin AT2 receptor protects against cerebral ischemia‐induced neuronal injury. FASEB J 19:617–619. [DOI] [PubMed] [Google Scholar]
- 30. Li JM, Mogi M, Tsukuda K, Tomochika H, Iwanami J, Min LJ et al (2007) Angiotensin II‐induced neural differentiation via angiotensin II type 2 (AT2) receptor‐MMS2 cascade involving interaction between AT2 receptor‐interacting protein and Src homology 2 domain‐containing protein‐tyrosine phosphatase 1. Mol Endocrinol 21:499–511. [DOI] [PubMed] [Google Scholar]
- 31. Livak KJ, Schmittgen TD (2001) Analysis of relative gene expression data using real‐time quantitative PCR and the 2(‐Delta Delta C(T)) Method. Methods 25:402–408. [DOI] [PubMed] [Google Scholar]
- 32. Lucius R, Gallinat S, Rosenstiel P, Herdegen T, Sievers J, Unger T (1998) The angiotensin II type 2 (AT2) receptor promotes axonal regeneration in the optic nerve of adult rats. J Exp Med 188:661–670. [DOI] [PMC free article] [PubMed] [Google Scholar]
- 33. McConnell MJ, Chevallier N, Berkofsky‐Fessler W, Giltnane JM, Malani RB, Staudt LM, Licht JD (2003) Growth suppression by acute promyelocytic leukemia‐associated protein PLZF is mediated by repression of c‐myc expression. Mol Cell Biol 23:9375–9388. [DOI] [PMC free article] [PubMed] [Google Scholar]
- 34. Meffert S, Stoll M, Steckelings UM, Bottari SP, Unger T (1996) The angiotensin II AT2 receptor inhibits proliferation and promotes differentiation in PC12W cells. Mol Cell Endocrinol 122:59–67. [DOI] [PubMed] [Google Scholar]
- 35. Nouet S, Amzallag N, Li JM, Louis S, Seitz I, Cui TX et al (2004) Trans‐inactivation of receptor tyrosine kinases by novel angiotensin II AT2 receptor‐interacting protein, ATIP. J Biol Chem 279:28989–28997. [DOI] [PubMed] [Google Scholar]
- 36. Parrado A, Robledo M, Moya‐Quiles MR, Marin LA, Chomienne C, Padua RA, Alvarez‐Lopez MR (2004) The promyelocytic leukemia zinc finger protein down‐regulates apoptosis and expression of the proapoptotic BID protein in lymphocytes. Proc Natl Acad Sci U S A 101:1898–1903. [DOI] [PMC free article] [PubMed] [Google Scholar]
- 37. Patzer A, Zhao Y, Stock I, Gohlke P, Herdegen T, Culman J (2008) Peroxisome proliferator‐activated receptorsgamma (PPARgamma) differently modulate the interleukin‐6 expression in the peri‐infarct cortical tissue in the acute and delayed phases of cerebral ischaemia. Eur J Neurosci 28:1786–1794. [DOI] [PubMed] [Google Scholar]
- 38. Paxinos G, Watson C (1997) The Rat Brain in Stereotactic Coordinates, 3rd edn. Academic Press, Harcourt Brace & Company: London, Boston, New York, Sydney, Tokyo, Toronto. [Google Scholar]
- 39. Ramser J, Abidi FE, Burckle CA, Lenski C, Toriello H, Wen G et al (2005) A unique exonic splice enhancer mutation in a family with X‐linked mental retardation and epilepsy points to a novel role of the renin receptor. Hum Mol Genet 14:1019–1027. [DOI] [PubMed] [Google Scholar]
- 40. Rashidian J, Iyirhiaro GO, Park DS (2007) Cell cycle machinery and stroke. Biochim Biophys Acta 1772:484–493. [DOI] [PubMed] [Google Scholar]
- 41. Rodolosse A, Barbat A, Chantret I, Lacasa M, Brot‐Laroche E, Zweibaum A, Rousset M (1998) Selecting agent hygromycin B alters expression of glucose‐regulated genes in transfected Caco‐2 cells. Am J Physiol 274:G931–G938. [DOI] [PubMed] [Google Scholar]
- 42. Reinecke K, Lucius R, Reinecke A, Rickert U, Herdegen T, Unger T (2003) Angiotensin II accelerates functional recovery in the rat sciatic nerve in vivo: role of the AT2 receptor and the transcription factor NF‐kappaB. FASEB J 17:2094–2096. [DOI] [PubMed] [Google Scholar]
- 43. Reinemund J, Seidel K, Steckelings UM, Zaade D, Klare S, Rompe F et al (2009) Poly(ADP‐ribose) polymerase‐1 (PARP‐1) transcriptionally regulates angiotensin AT2 receptor (AT2R) and AT2R binding protein (ATBP) genes. Biochem Pharmacol 77:1795–1805. [DOI] [PubMed] [Google Scholar]
- 44. Schefe JH, Menk M, Reinemund J, Effertz K, Hobbs RM, Pandolfi PP et al (2006) A novel signal transduction cascade involving direct physical interaction of the renin/prorenin receptor with the transcription factor promyelocytic zinc finger protein. Circ Res 99:1355–1366. [DOI] [PubMed] [Google Scholar]
- 45. Schefe JH, Unger T, Funke‐Kaiser H (2008) PLZF and the (pro)renin receptor. J Mol Med 86:623–627. [DOI] [PubMed] [Google Scholar]
- 46. Schefe JH, Neumann C, Goebel M, Danser J, Kirsch S, Gust R et al (2008) Prorenin engages the (pro)renin receptor like renin and both ligand activities are unopposed by aliskiren. J Hypertens 26:1787–1794. [DOI] [PubMed] [Google Scholar]
- 47. Schwab M, Alitalo K, Klempnauer KH, Varmus HE, Bishop JM, Gilbert F et al (1983) Amplified DNA with limited homology to myc cellular oncogene is shared by human neuroblastoma cell lines and a neuroblastoma tumour. Nature 305:245–248. [DOI] [PubMed] [Google Scholar]
- 48. Schwerk C, Schulze‐Osthoff K (2003) Non‐apoptotic functions of caspases in cellular proliferation and differentiation. Biochem Pharmacol 66:1453–1458. [DOI] [PubMed] [Google Scholar]
- 49. Senbonmatsu T, Saito T, Landon EJ, Watanabe O, Price E Jr, Roberts RL et al (2003) A novel angiotensin II type 2 receptor signaling pathway: possible role in cardiac hypertrophy. EMBO J 22:6471–6482. [DOI] [PMC free article] [PubMed] [Google Scholar]
- 50. Servant G, Dudley DT, Escher E, Guillemette G (1994) The marked disparity between the sizes of angiotensin type 2 receptors from different tissues is related to different degrees of N‐glycosylation. Mol Pharmacol 45:1112–1118. [PubMed] [Google Scholar]
- 51. Shiraishi K, Yamasaki K, Nanba D, Inoue H, Hanakawa Y, Shirakata Y et al (2007) Pre‐B‐cell leukemia transcription factor 1 is a major target of promyelocytic leukemia zinc‐finger‐mediated melanoma cell growth suppression. Oncogene 26:339–348. [DOI] [PubMed] [Google Scholar]
- 52. Stoll M, Steckelings UM, Paul M, Bottari SP, Metzger R, Unger T (1995) The angiotensin AT2‐receptor mediates inhibition of cell proliferation in coronary endothelial cells. J Clin Invest 95:651–657. [DOI] [PMC free article] [PubMed] [Google Scholar]
- 53. Stroth U, Blume A, Mielke K, Unger T (2000) Angiotensin AT(2) receptor stimulates ERK1 and ERK2 in quiescent but inhibits ERK in NGF‐stimulated PC12W cells. Brain Res Mol Brain Res 78:175–180. [DOI] [PubMed] [Google Scholar]
- 54. Thone‐Reineke C, Steckelings UM, Unger T (2006) Angiotensin receptor blockers and cerebral protection in stroke. J Hypertens Suppl 24:S115–S121. [DOI] [PubMed] [Google Scholar]
- 55. Unger T (2005) Does losartan reduce the risk of stroke in patients with hypertension? Nat Clin Pract Cardiovasc Med 2:236–237. [DOI] [PubMed] [Google Scholar]
- 56. Uraoka M, Ikeda K, Nakagawa Y, Koide M, Akakabe Y, Nakano‐Kurimoto R et al (2009) Prorenin induces ERK activation in endothelial cells to enhance neovascularization independently of the renin‐angiotensin system. Biochem Biophys Res Commun 390:1202–1207. [DOI] [PubMed] [Google Scholar]
- 57. Wan Y, Wallinder C, Plouffe B, Beaudry H, Mahalingam AK, Wu X et al (2004) Design, synthesis, and biological evaluation of the first selective nonpeptide AT2 receptor agonist. J Med Chem 47:5995–6008. [DOI] [PubMed] [Google Scholar]
- 58. Weber MA (1997) Comparison of type 1 angiotensin II receptor blockers and angiotensin converting enzyme inhibitors in the treatment of hypertension. J Hypertens Suppl 15:S31–S36. [DOI] [PubMed] [Google Scholar]
- 59. Wruck CJ, Funke‐Kaiser H, Pufe T, Kusserow H, Menk M, Schefe JH et al (2005) Regulation of transport of the angiotensin AT2 receptor by a novel membrane‐associated Golgi protein. Arterioscler Thromb Vasc Biol 25:57–64. [DOI] [PubMed] [Google Scholar]
- 60. Yeyati PL, Shaknovich R, Boterashvili S, Li J, Ball HJ, Waxman S et al (1999) Leukemia translocation protein PLZF inhibits cell growth and expression of cyclin A. Oncogene 18:925–934. [DOI] [PubMed] [Google Scholar]
- 61. Zhang J, Pratt RE (1996) The AT2 receptor selectively associates with Gialpha2 and Gialpha3 in the rat fetus. J Biol Chem 271:15026–15033. [PubMed] [Google Scholar]
- 62. Zhang T, Xiong H, Kan LX, Zhang CK, Jiao XF, Fu G et al (1999) Genomic sequence, structural organization, molecular evolution, and aberrant rearrangement of promyelocytic leukemia zinc finger gene. Proc Natl Acad Sci U S A 96:11422–11427. [DOI] [PMC free article] [PubMed] [Google Scholar]