

Abstract
The neurotransmitter dopamine causes DNA damage, oxidative stress and is involved in the pathology of neurological diseases. To elucidate this potential link we investigated the mechanism of dopamine‐induced DNA damage. We studied the role of the dopamine transporter (DAT) in MDCK and MDCK‐DAT cells, containing the human DAT gene. After treatment with dopamine, only MDCK‐DAT cells showed elevated chromosomal damage and dopamine uptake. Although stimulation of dopamine type 2 receptor (D2R) with quinpirole in the absence of dopamine did not induce genotoxicity in rat neuronal PC12 cells, interference with D2R signaling by inhibition of G‐proteins, phosphoinositide 3 kinase and extracellular signal‐regulated kinases reduced dopamine‐induced genotoxicity and affected the ability of DAT to take up dopamine. Furthermore, the D2R antagonist sulpiride inhibited the dopamine‐induced migration of DAT from cytosol to cell membrane. To determine whether oxidation of dopamine by monoamine oxidase (MAO) is relevant in its genotoxicity, we inhibited MAO, which reduced the formation of micronuclei and of the oxidative DNA adduct 8‐oxodG. Overall, dopamine exerted its genotoxicity in vitro upon transport into the cells and oxidation by MAO. D2R signaling was involved in the genotoxicity of dopamine by affecting activation and cell surface expression of DAT and hence modulating dopamine uptake.
Keywords: dopamine, dopamine transporter, dopamine type 2 receptor, genotoxicity, micronucleus
INTRODUCTION
Dopamine neurotransmission is associated with motor function, emotional behavior and stress responsiveness 22, 28. Abnormalities in the dopamine level contribute to a variety of human neurological conditions, including attention‐deficit/hyperactivity disorder (ADHD), Parkinson's disease (PD) and schizophrenia (42) as well as cardiovascular insufficiency and renal failure (16). Upon completion of neurotransmission, dopamine signaling is terminated by uptake of extracellular dopamine via the dopamine transporter (DAT), a membrane spanning protein that belongs to the family of Na+ and Cl‐ co‐transporters. As biosynthetic recovery of DAT in vivo requires considerable time (18), another faster mechanism of DAT regulation seems to be necessary to respond to the need for fast clearance of the synaptic cleft. It has been shown that signaling from dopamine receptors and second messengers alters DAT activity and extent of membrane localization. Dopamine type 2 receptor (D2R) is a pertussis toxin sensitive G protein‐coupled receptor (GPCR). Through the GPCR signaling, D2R is able to activate a number of kinases in the cell. Via phosphorylation, these kinases can regulate DAT. Activation of protein kinase C for example is associated with redistribution of DAT from membrane to cytosol and hence decrease of transporter activity (38). Also, it has been reported that activation of extracellular signal‐regulated kinases 1 and 2 (ERK1/2) (45) and phosphoinositide 3 kinase (PI3K) increases the transporter activity (11).
Once dopamine is transported into the cell, it is readily oxidized in the presence of molecular oxygen to produce hydrogen peroxide (H2O2) and a quinone. Furthermore, dopamine is also deaminated enzymatically by MAO to form H2O2 and 3,4‐dihydroxyphenylacetaldehyde, which is then oxidized by aldehyde dehydrogenase and produces 3,4‐dihydroxyphenylacetic acid (DOPAC). DOPAC is finally methylated by catechol‐O‐methyl transferase (COMT) and gives the final product homovanillic acid (HVA) (26). Thus the oxidation of dopamine via autoxidation and enzymatic pathways results in the production of H2O2 and other reactive oxygen species (ROS).
The damaging effects of ROS have been well described. ROS can affect almost all biological macromolecules of cells (41). Their effects on DNA range from oxidized bases to single and double strand breaks (39). The occurrence of strand breaks can result in the formation of micronuclei, which are analyzed as an endpoint in routine genotoxicity testing of substances and human cytogenetic biomonitoring. A micronucleus that is formed during mitosis contains chromosome fragments or whole chromosomes that are unable to migrate to the spindle poles during anaphase. Later in telophase, these structures gain their own nuclear membrane and resemble a small nucleus, hence the name micronucleus (17).
We have previously described the induction of genomic damage by dopamine in cell lines with different tissue origin including rat pheochromocytoma PC12 cells (52). Using the micronucleus frequency test, we reported that combination of dopamine with sulpiride, a D2R antagonist, or any of the two DAT inhibitors GBR 12909 and nomifensine, hindered the genotoxic effect of dopamine, implying a role of D2R and DAT in the genotoxicity of dopamine. Recently, we reported that in the lymphocytes of PD patients who received a dopamine agonist together with the dopamine precursor L‐DOPA a correlation between the daily dose of consumed L‐DOPA with the number of micronuclei and also with the level of 8‐oxodG DNA alterations was detectable (47), whereas no correlation was observed in the absence of dopamine agonist. The current study was conducted to scrutinize the pathways involved in dopamine‐induced genotoxicity.
MATERIALS AND METHODS
Material
If not mentioned otherwise, all chemicals were purchased from Sigma‐Aldrich (Taufkirchen, Germany). The ERK activation inhibitor peptide was purchased from Calbiochem (Darmstadt, Germany), pertussis toxin was purchased from Enzo Life Sciences (Lörrach, Germany).
Cell culture
PC12, a rat pheochromocytoma cell line with many properties of primary sympathetic neurons, was obtained from Dr. P. Tas, Department of Anesthesiology, University of Wuerzburg, Germany, and cultured in RPMI 1640 supplemented with 10% horse serum, 5% fetal calf serum, 2 mM L‐glutamine and 1% antibiotics.
MDCK, Madin‐Darby Canine kidney cells were purchased from ATCC and maintained in MEM with Earl's salts supplemented with 10% fetal calf serum and 2 mM L‐glutamine.
MDCK‐DAT cells, MDCK cells transfected with the human dopamine transporter DAT (23) were a gift from Prof G. Rudnick, Department of Pharmacology, Yale University School of Medicine, Atlanta, Georgia, and were maintained in the same medium as MDCK cells. Occasionally, 0.9 g/L of G418 was added to the medium to ensure the presence of the transfected gene.
If not mentioned otherwise, all genotoxicity tests were performed in PC12 cells. MDCK and MDCK‐DAT cells were used to investigate the effect of DAT transfection on dopamine‐induced genotoxicity. The immunocytochemistry staining (DAT localization) was also performed in MDCK‐DAT cells because PC12 cells did not grow well on the cover slips. The quantification of dopamine in cell lysate was also conducted in MDCK‐DAT cells because of the inherent ability of PC12 cells to produce dopamine 7, 36, which interfered with our measurements.
Micronucleus frequency test
In 5 mL medium, 1 × 10⁵ cells/mL were incubated with test substances. After 4 h, medium was removed and replaced by fresh culture medium containing cytochalasin B (2 µg/mL). This inhibitor of actin polymerization blocks the separation of daughter cells but not of daughter nuclei, yielding binucleated cells. By limiting analysis to such binucleated cells, it can be ensured that these cells have actively divided since the treatment. After a further 20 h (MDCK, MDCK‐DAT) or 48 h (PC12), cells were harvested, applied onto glass slides by cytospin centrifugation and fixed in methanol (−20°C) for at least 2 h. Before counting, cells were stained for 3 minutes with acridine orange (62.5 µL/mL in Sørensen buffer, pH 6.8), washed twice with Sørensen buffer (15 mM Na2HPO4 and 15 mM KH2PO4, pH 6.8) and mounted for microscopy. A representative picture of a micronucleus in a binucleated PC12 cell is illustrated in Figure 1A. From each of two slides, 1000 binucleated cells were evaluated for cells containing micronuclei and the average was calculated. We rarely observed more than one micronucleus per cell under these conditions. In addition, the cytokinesis‐block proliferation index, CBPI (number of mononucleated cells + 2 × number of binucleated cells + 3 × number of multinucleated cells)/(sum of mononucleated, binucleated and multinucleated cells), was determined from 1000 cells of each sample. For substance combinations, concentrations that were described as effective in the literature and had been found non‐toxic in preliminary experiments were applied. To exclude interference of potential antioxidant capacity of the compounds used for pharmacological inhibition of the D2R signaling pathway with ROS‐induced genotoxicity quantification, all the inhibitors and antagonists were tested for antioxidant activity using the ferric‐reducing antioxidant power (FRAP) method (1). However, none of the used compounds showed any antioxidant capacity in this assay (data not shown).
Figure 1.
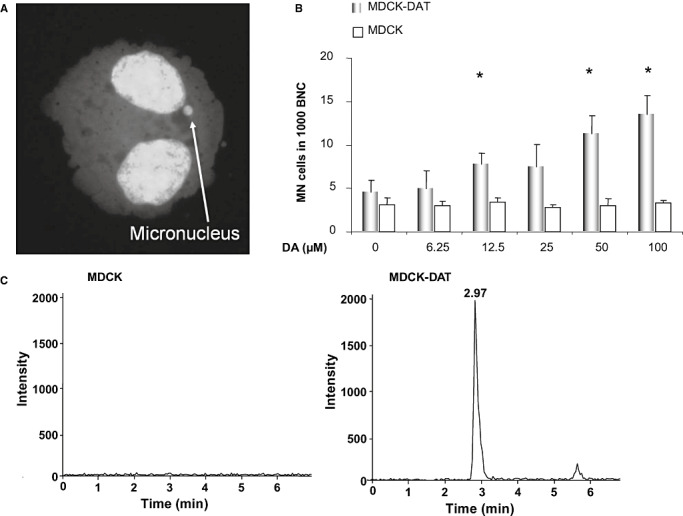
A. A representative picture of a micronucleus in a binucleated PC12 cell. B. Dopamine‐induced genotoxicity quantified by the micronucleus frequency test in MDCK and MDCK‐DAT (transfected with human dopamine transporter gene) cells after incubation with dopamine. Displayed are averages with standard deviations of three independent experiments. *P ≤ 0.05 vs. control (Mann–Whitney U‐test). C. Mass spectrometry graphs of dopamine analysis in MDCK and MDCK‐DAT cells upon incubation with 100 µM dopamine for 30 min. Only MDCK‐DAT cells (harboring the human dopamine transporter) show a peak for dopamine (retention time 2.97 minutes) in the cell lysate. Abbreviations: MN cells = micronucleated cells, BNC = binucleated cells, DA = dopamine.
RNA isolation and Real‐time PCR
The expression of mRNA was detected using the reverse transcription polymerase chain reaction (RT‐PCR). Total RNA was isolated from the cells with the RNeasy Mini Kit (Qiagen, Hilden, Germany) and 2.0 µg of RNA was used for cDNA synthesis using Verso cDNA Synthesis Kit (Thermo Scientific, Schwerte, Germany). The following primers were used for amplification of the dopamine receptors and the house keeping gene porphobilinogen deaminase (PBGD): DAT forward 5′‐CTG ACC AAC TCC ACC CTC AT‐3′, DAT reverse 5′‐CAC AGG TAG GGA AAC CTC CA‐3′ (146 bp), PBGD forward 5′‐ACA ACC GCG GAA GAA AAC‐3′, PBGD reverse, 5′‐ AGC ATC GCT ACC ACA GTG TC‐3′ (101 bp). Annealing temperature was 54°C. All primers were designed with the program Primer3 (51). Real‐time PCR was conducted on the Light Cycler® 480 instrument (Roche Diagnostics GmbH, Mannheim, Germany) and the data were analyzed with the Light Cycler® 480 software release 1.5.0 SP3 (version 1.5.0.39).
Immunocytochemistry staining
For immunocytochemistry staining the cells were cultured on cover slips and treated the day after. After treatment the cells were washed with phosphate‐buffered saline (PBS) containing 1 mM MgCl2 and 0.1 mM CaCl2 (PBS/Mg/Ca) and fixed in cold methanol for 10 minutes. The cells were then rehydrated for 5 minutes in PBS/Mg/Ca and then incubated in permeabilization buffer (PBS/Mg/Ca plus 0.3% Triton X‐100 and 0.1% bovine serum albumin) for 15 minutes. The blocking of unspecific proteins was performed in 16% FCS, 0.3% Triton X‐100, 0.45 M NaCl and 20 mM sodium phosphate pH 7.4. After blocking, the cells were incubated with monoclonal anti‐DAT antibody (Santa Cruz Biotechnology, Heidelberg, Germany) diluted 1:100 in blocking buffer with gentle shaking for 1 h. After three times washing with permeabilization buffer, FITC labeled goat anti rat antibody (Santa Cruz Biotechnology) was added (1:200 in blocking buffer) for 1 h. The cells were then washed three times with permeabilization buffer followed by a final washing step with 5 mM sodium phosphate, pH 7.5 for 5 minutes. The cover slips were mounted on slides using Confocal‐Matrix ® (Micro Tech Lab, Graz, Austria) and examined and photographed by Leica TCS SP5 confocal microscope (Leica, Wetzlar, Germany), which was equipped with LAS AF software (Leica). The pictures were then analyzed using ImageJ software (http://rsbweb.nih.gov/ij/) and the membrane to cytosol ratio of DAT was quantified. Because the membrane localization of DAT in polar cells like MDCK‐DAT is not homogenous (23), we decided to measure the fluorescence intensity of four different regions of the membrane. For each cell, the fluorescence intensity of an 8 × 8 pixel box from four regions of the cell membrane at 12, 3, 6 and 9 o'clock of the cell was measured. The fluorescence intensity of four similar boxes from the cytosol region in close vicinity to the membrane boxes was also quantified. Then, the ratio of the average intensity of the membrane boxes to the average intensity of the cytosol boxes was calculated for each cell. For each treatment 50 cells were analyzed. This procedure is illustrated in Figure 5G.
Figure 5.
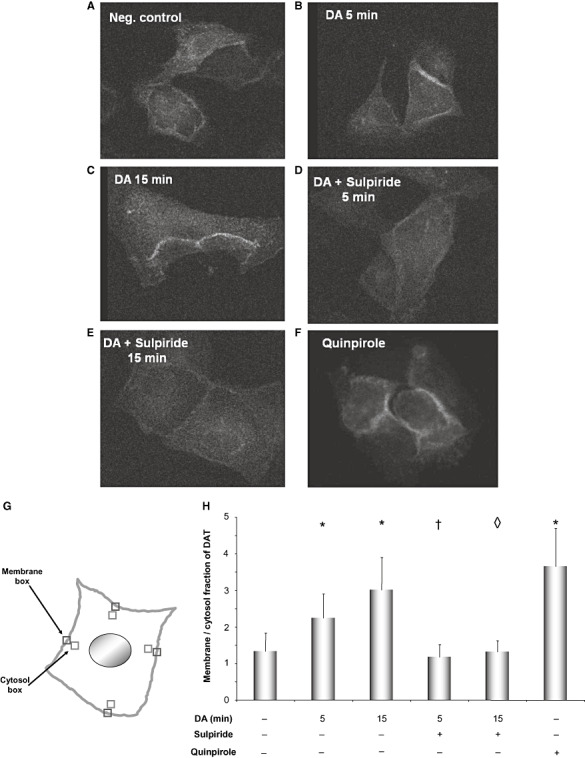
Immunocytochemical staining of MDCK‐DAT cells for the localization of the dopamine transporter protein (DAT). (A) Untreated cells, (B) Dopamine 100 µM for 5 minutes, (C) Dopamine 100 µM for 15 minutes, (D) 10 minutes of incubation with 10 µM of sulpiride followed by 5 minutes of incubation with 100 µM of dopamine, (E) 10 minutes of incubation with 10 µM of sulpiride followed by 15 minutes of incubation with 100 µM of dopamine, (F) Quinpirole 50 µM for 15 minutes. (G) Schematic representation of a cell to show the boxes used for quantification of localization of the dopamine transporter (DAT) in the cell membrane and the cytosol. (H) Quantification of the ratio of DAT localization in membrane and cytosol. Displayed in 5H is the average with standard deviation of 50 evaluated cells. *P ≤ 0.05 vs. control, †P ≤ 0.05 vs. 5‐minute dopamine‐treated sample, ◊ P ≤ 0.05 vs. 15‐minute dopamine‐treated sample (Student's T‐test).
Quantification of dopamine in cell lysate using mass spectrometry
The measurement of dopamine was performed according to Gu et al. (24) with some modifications. Briefly, the cells were harvested and pellets were spiked with the fixed amount of 1 µg internal standard isoproterenol to all the samples and lysed with 10% methanol in water containing 0.1% v/v formic acid. An aliquot of this suspension was used for Bradford protein concentration determination. The rest of the cell lysate was then filtered through 10 kD filters (Amicon, Millipore, Tullagreen, Ireland). Then 10 µL of the prepared sample was loaded onto Reprosil C‐18 AQ (150 × 2 mm; 3 µm) column using an auto sampler (Agilent 1100 series, Agilent GmbH, Waldbronn, Germany). The isocratic method was used to achieve the desired sample separation. 10% (v/v) methanol in water containing 0.1% v/v formic acid at a flow rate of 200 µL/min was delivered by a quaternary pump (Agilent 1100 series). The eluted sample from the HPLC system was introduced into the turbo ion spray source of an API 3000 triple‐quadrupole mass spectrometer (Applied Biosystems, Darmstadt, Germany), operating in the positive ion mode, using nitrogen as the nebulizing gas and with the turbo gas temperature set at 350°C. The multiple reaction monitoring (MRM) conditions were obtained for the fragmentation of dopamine (m/z) 154 to 91 and isoproterenol (m/z) 212 to 107. The nebulizer and curtain gas flow rate were set at 12 arbitrary units. The collision assisted dissociation gas and turbo gas were set at four arbitrary units for both. The collision energy was set at 15 and 30 eV for dopamine and isoproterenol, respectively, nitrogen used as a collision gas. The retention time for dopamine and internal standard isoproterenol was about 2.8 (±10%) and 4.5 (±10%) minutes, respectively, the total run time was 7 minutes. The system was controlled by analyst® software 1.4.1 (Applied Biosystems). The standards were prepared as described by Gu et al. (24). The values of dopamine were normalized to protein concentration determined using Bradford's method.
Measurement of released H2O2 in medium
H2O2 measurement was conducted according to the method described by Pick et al. (49) with some modifications. PC12 cells were cultured the day before the experiment. The cells were washed with PBS and then covered with phenol red solution (140 mM NaCl, 10 mM potassium phosphate buffer, pH 7.0, 5.5 mM dextrose, 0.56 mM phenol red and 19 U/mL horse radish peroxidase). The cells were then treated with PBS (negative control), 100 µM of dopamine or 1.56, 3.13, 6.25 and 12.5 µM of H2O2 (for standard curve) for 30 minutes. At the end of treatment the cells were collected and centrifuged. The supernatant was collected in a new tube and 1N NaOH was added. The absorbance of this solution was read at 600 nM. To account for directly dopamine‐mediated absorption at the applied wavelength, 100 µM of dopamine was added to the supernatant of a negative control sample and the measured absorbance (never more than a few percents of the total absorbance) was subtracted from absorbance of the dopamine‐treated samples. The pellet was used for determination of protein concentration. The amount of released H2O2 was calculated from the standard curve and was related to protein content of each sample.
Quantification of the oxidatively modified DNA base 8‐oxodG
Genomic DNA was extracted as described elsewhere (47). The concentration of DNA was determined by measuring absorbance at 260 nm and protein contamination was checked by measuring absorbance ratio of A260/A280. Samples with the ratio of 1.6 to 1.8 were considered acceptable. DNA hydrolysis of approximately 20 µg of DNA spiked with 2.82 pmol of [15N5] 8‐oxodG was performed as described by Chao et al. (12).
100 µL of DNA samples were loaded on the trap column using an auto sampler (Agilent 1100 series) and the content of 8‐oxodG was quantified as reported elsewhere 8, 12.
Statistics
Statistical calculations were performed using Statistica 8 [StatSoft (Europe) GmbH, Hamburg, Germany]. If not mentioned otherwise, data from at least three independent experiments ± standard deviation are depicted. Statistical significance among multiple groups was tested with Kruskal–Wallis test. Individual groups were then tested using the Mann–Whitney U‐test and results were considered significant if the P value was ≤0.05. For quantification of immunocytochemical data (DAT localization) Student's T‐test was used. The P value of ≤0.05 was considered significant.
RESULTS
Dopamine‐induced micronucleus formation in MDCK and MDCK‐DAT cells
In order to confirm the role of DAT in dopamine‐induced genotoxicity, we tested different concentrations of dopamine ranging from 6.25 to 100 µM in MDCK and MDCK‐DAT cells in the micronucleus frequency test (Figure 1B). While MDCK cells did not show any genotoxic response to dopamine in the range of concentrations that we applied, MDCK‐DAT cells, which are transfected with the human DAT gene, showed a dose‐dependent increase in micronucleus formation.
Activity of DAT in MDCK‐DAT cells
To confirm the activity of DAT in MDCK‐DAT cells, we measured the concentration of dopamine in the cell lysate using LC‐MS/MS after treatment of MDCK and MDCK‐DAT cells with 100 µM of dopamine for 30 minutes (Figure 1C). In MDCK cell lysate no peak from dopamine was recognized at the detection limit of 3.9 ng/mL (signal to noise ratio: 1.2) whereas the analysis of MDCK‐DAT‐lysate revealed a distinguishable peak for dopamine with signal to noise ratio of 159, showing that the latter cells were able to take up dopamine.
Stimulation of D2R
We have previously shown that co‐incubation of PC12 cells with dopamine and the high affinity D2R antagonist sulpiride hindered the micronucleus formation induced by treatment with dopamine alone, which allowed us to conclude that D2R signaling contributes to the genotoxicity of dopamine (52). To investigate if activation of D2R signaling alone is enough to cause genotoxic damage even in the absence of dopamine, we stimulated D2R with quinpirole, a widely used D2R and D3R agonist. As illustrated in Figure 2A, the indicated concentrations of quinpirole of up to 50 µM did not induce the formation of micronuclei.
Figure 2.
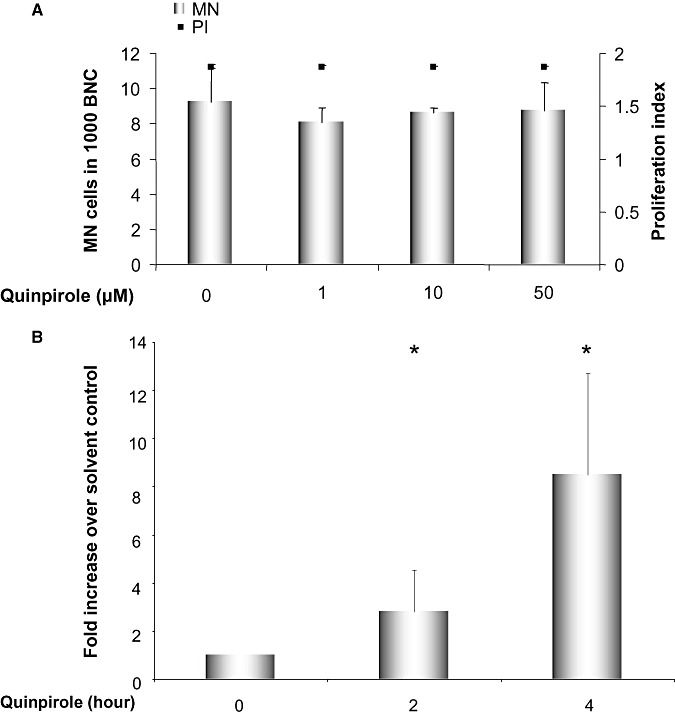
A. Micronucleus frequency after treatment with the dopamine receptor type 2 (D2R) agonist quinpirole in PC12 cells. Proliferation index is illustrated on the right axis to ensure that all the samples equally underwent proliferation. Displayed are averages with standard deviations of three independent experiments. MN cells = micronucleated cells, BNC = binucleated cells. B. Relative expression of DAT mRNA compared with the house keeping gene porphobilinogen deaminase (PBGD) after treatment with the dopamine receptor type 2 (D2R) agonist quinpirole in PC12 cells. For each experiment the ratio of DAT to PBGD expression was calculated and then all the ratios were normalized to the ratio of untreated sample. Displayed are the averages with standard deviations of three independent experiments.
DAT expression
We performed real‐time analysis of DAT expression after quinpirole treatment to question if D2R activation with quinpirole in the concentrations that failed to induce micronucleus formation affects DAT expression level. The PC12 cells were treated with quinpirole and total RNA was extracted and cDNA was produced. Afterward the expression of DAT was quantified (Figure 2B). Our results showed that the expression of DAT increases significantly after 2 and 4 h.
Inhibition of D2R‐related intracellular signaling
To identify components of the D2R‐signaling pathway involved in genotoxicity of dopamine, first, the Gi/o protein inhibitor pertussis toxin was applied to block the signaling from D2R in PC12 cells. Figure 3A shows that the combination of 0.2 and 2 ng/mL of pertussis toxin with dopamine significantly reduced the genotoxicity of dopamine in the micronucleus frequency test.
Figure 3.
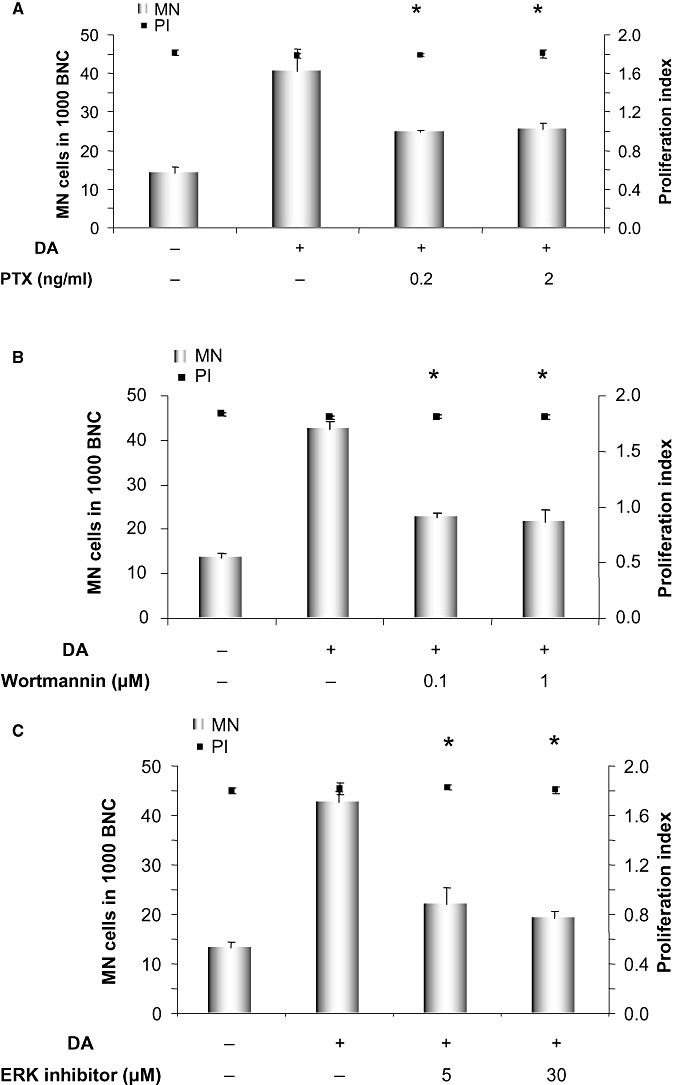
Micronucleus formation after treatment of PC12 cells with 100 µM dopamine, with or without co‐incubation with the indicated concentrations of (A) the Gi/Go G‐protein inhibitor pertussis toxin (PTX) (B) the PI3K inhibitor wortmannin and (C) an ERK activation inhibitor peptide. Proliferation index is illustrated on the right axis to ensure that all the samples equally underwent proliferation. MN cells = micronucleated cells, BNC = binucleated cells. Displayed are averages with standard deviations of three independent experiments. *P ≤ 0.05 vs. dopamine‐treated sample (Mann–Whitney U‐test).
Next, the role of PI3K and ERK1/2 inhibition was investigated, as it has been reported that activation of D2R can activate PI3K and ERK1/2. A number of studies have revealed that the activity of these kinases can ultimately affect redistribution of DAT from the cytosol to the membrane. To elucidate the role of these kinases in the pathway of genotoxicity of dopamine, we inhibited PI3K and ERK1/2 and evaluated the dopamine‐induced micronucleus formation in PC12 cells. PI3K was inhibited using the specific inhibitor wortmannin. Concentrations of 0.1 and 1 µM were able to decrease the number of dopamine‐induced micronuclei (Figure 3B).
Activation of ERK1/2 was inhibited using an ERK1/2 activation inhibitor peptide that was first developed by Kelemen et al. (33). This membrane permeable peptide selectively binds to ERK and prevents its interaction with MEK (MAP kinase kinase) and thereby has no effect on Jun N‐terminal kinases (JNKs) or p38 MAP kinase. The inhibitory peptide was able to impede the damage to the genetic material, which was induced by dopamine alone (Figure 3C). Thus, PI3K and ERK1/2 both contribute to the genotoxicity of dopamine.
Mass spectrometric analysis of dopamine content in the cell lysate
For further support of the results from the genotoxicity experiments, we analyzed the effect of antagonizing D2R and inhibiting DAT, PI3K and ERK1/2 on the ability of the MDCK‐DAT cells to take up dopamine. Therefore, the cell lysate was analyzed for dopamine using HPLC/MS (Figure 4). As expected, no dopamine was detected in the untreated sample. The dopamine amount from the sample treated with dopamine alone was considered 100% and the combination treatments were compared with this value. The DAT inhibitor nomifensine (30 µM) almost completely abrogated dopamine uptake (7.40 ± 0.51%). The D2R antagonist sulpiride (10 µM) was also able to affect DAT function and reduced dopamine uptake partially (66.97 ± 23.24%). Also, inhibition of PI3K (1 µM of wortmannin) and ERK1/2 activation (30 µM of activation inhibitor peptide) resulted in reduction of DA uptake to 59.29 ± 23.68% and 43.79 ± 15.87%, respectively.
Figure 4.
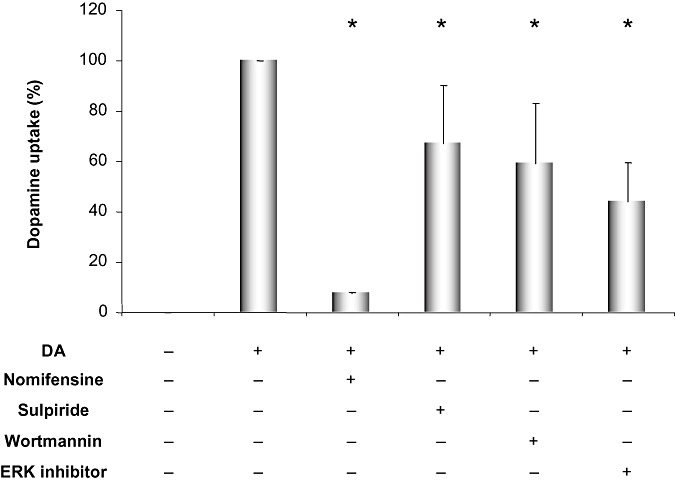
Results of mass spectrometric analysis of dopamine concentrations in cell lysate after treatment of MDCK‐DAT cells with 100 µM of dopamine with or without incubation with the dopamine transporter (DAT) inhibitor nomifensine (30 µM), the dopamine type 2 receptor (D2R) antagonist sulpiride (10 µM), the PI3K inhibitor wortmannin (1 µM) and an ERK activation inhibitor peptide (30 µM). The bars show the percentages normalized to dopamine treatment, which was set to 100%. Displayed are averages with standard deviations of three independent experiments. *P ≤ 0.05 vs. dopamine‐treated sample using Mann–Whitney U‐test.
Immunocytochemical staining of DAT
Treatment of MDCK‐DAT cells with 100 µM of dopamine for 5 and 15 minutes (Figure 5B,C) led to an increase of DAT migration from the cytosol to the membrane in comparison with untreated cells (Figure 5A), where DAT is more distributed throughout the cytosol. Pretreatment of the cells with 10 µM of sulpiride for 10 minutes prevented this migration and resulted in equal distribution of DAT in the cytosol and membrane regions (Figure 5D,E). Figure 5F shows that treatment with 50 µM of quinpirole for 15 minutes resulted in an increased localization of DAT in the cell membrane. The manner of quantification (5G) of DAT distribution between cytosol and membrane and the results of that (5H) are illustrated.
Measurement of released H2O2
To assess the release of H2O2 after dopamine treatment, a photometric determination of the H2O2 concentration of the supernatant of dopamine‐treated cells was performed according to the method of Pick et al. (49) with slight modifications. To account for cell number, the values were related to the protein content of the treated cells. The amount of H2O2 in the supernatant of untreated cells was considered as the basal level. The cells that were treated with 100 µM dopamine released 5.21 ± 3.59 µmol H2O2 per milligram of protein content in addition to the basal level.
MAO inhibition
Dopamine in the cells is either metabolized by the enzyme monoamine oxidase (MAO), other oxidizing enzymes or undergoes autoxidation. To distinguish whether any of these options is relevant in the genotoxicity of dopamine, we inhibited MAO with 50 µM of the MAO inhibitor trans‐2‐phenylcyclopropylamine hydrochloride (PCPA) and also with 1 µM of the MAO B specific inhibitor Ro 16‐6491 in PC12 cells (Figure 6A,B). Both compounds reduced the number of micronuclei induced by dopamine, indicating that oxidation of dopamine by MAO is likely to play a role in genotoxicity of dopamine. Once dopamine is metabolized by MAO, semiquinones, quinones and ROS are produced, which all are potentially able to damage cellular DNA. We used another substrate of MAO, 1‐phenylethylamine (PEA) with a similar structure to dopamine, which can be metabolized to ROS but not to semiquinones or quinones (Figure 6C). PEA induced micronuclei in PC12 cells, though not as many as dopamine, implying that ROS formation plays a role in dopamine genotoxicity, but semiquione‐ and quinone‐formation may also contribute.
Figure 6.
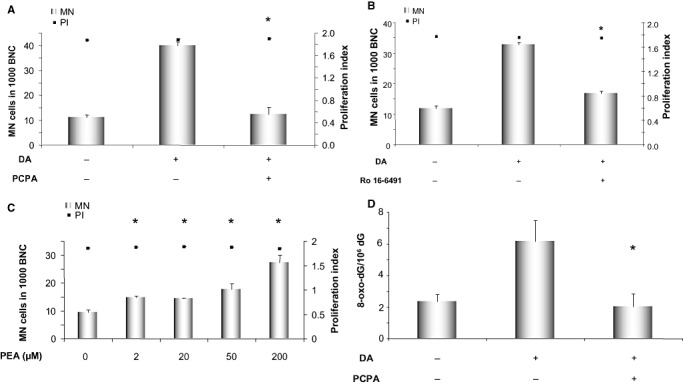
Micronucleus induction after treatment of PC12 cells with 100 µM of dopamine with or without co‐incubation with 50 µM of the monoamine oxidase inhibitor trans‐2‐phenylcyclopropylamine hydrochloride (PCPA) (A) or 1 µM of the MAO B specific inhibitor Ro 16‐6491 (B). (C) Micronucleus induction by the indicated concentration of monoamine oxidase substrate 1‐phenylethylamine (PEA). Proliferation index is illustrated on the right axis to ensure that all the samples equally underwent proliferation. (D) Mass spectrometric quantification of 8‐oxodG after treatment of PC12 cells with 100 µM of dopamine with or without co‐incubation with 50 µM of the monoamine oxidase inhibitor trans‐2‐phenylcyclopropylamine hydrochloride (PCPA). Displayed are averages with standard deviations of three independent experiments in A–C; D shows the average with standard deviation of two (negative control) or three (dopamine and dopamine + PCPA treated) independent experiments conducted in parallel. *P ≤ 0.05 vs. dopamine‐treated sample (A, B and D) or vs. control (C) (Mann–Whitney U‐test). Abbreviations: MN cells = micronucleated cells, BNC = binucleated cells.
Analysis of 8‐oxodG
To investigate if dopamine treatment can also lead to oxidative DNA alterations, we looked for the formation of 8‐oxodG, which is the most common oxidative base modification. As illustrated in Figure 6D, PC12 cells treated with 100 µM of dopamine for 4 h showed an almost three fold increase of 8‐oxodG level. This effect was prevented using 50 µM of MAO inhibitor, PCPA, which points to the involvement of MAO in formation of 8‐oxodG.
DISCUSSION
Recently we reported that dopamine treatment can cause induction of micronuclei in cell lines of different tissue origin. The highest sensitivity was observed in the neuronal‐like cell line PC12 (52). We found a reduction of the genotoxicity of dopamine after co‐treatment of the cells with dopamine together with antioxidants, a D2R antagonist and DAT inhibitors. The current study was conducted to elucidate the role of D2R signaling and DAT in the dopamine‐induced genotoxicity further. MDCK‐DAT cells that were transfected with human DAT (23) but not untransfected MDCK cells were able to take up dopamine that was added to their medium and then form micronuclei. This strong evidence of the role of DAT in dopamine‐induced DNA damage is in agreement with our previous results from pharmacological inhibition of DAT using GBR12909 and nomifensine (52). The D2 like receptor agonist quinpirole was not capable of inducing any genotoxic response in the absence of dopamine, which supports the idea that D2R signaling itself is not genotoxic, but is involved in the dopamine‐induced genotoxicity. The inability of quinpirole to induce micronucleus formation cannot be attributed to low concentration of the compound because the same concentration was able to induce DAT migration to the membrane (Figure 5F) and also to upregulate DAT mRNA in real‐time PCR experiments (Figure 2B).
The expression of D2R and DAT in axonal terminals is an anatomical hint for potential interaction between these two proteins (27). Among neurotransmitters, transporter internalization and trafficking are common mechanisms of rapid regulation of transporter function. For example, it has been reported that PKC is involved in activation and cell surface expression of serotonin transporter 4, 50. Many other reports provide evidence about the role of kinases in the regulation of DAT 5, 37, 45, 55. Activation of PKC is reported to decrease the Vmax of dopamine transport with no change in the affinity of the transporter for dopamine (15) and also to redistribute the localization of DAT from cell membrane to cytosol 38, 45. On the other hand PI3K and MAPK are reported to promote cell surface expression of DAT and therefore enhance dopamine uptake 11, 45. It has been suggested by others that stimulation of D2R leads to activation of ERK and PI3K in a pertussis toxin sensitive manner (10). The latter implies the contribution of Gi/o proteins, which are coupled to D2R. Several reports have already proved the expression of ERK and PI3K in PC12 21, 29, 31, 53 and MDCK cells 30, 34, 54, which made these two cell lines suitable for our study.
Confirming the involvement of D2R signaling in dopamine‐induced DNA damage, a combination of pertussis toxin with dopamine treatment was performed, which reduced the dopamine‐mediated micronucleus formation. Inhibition of ERK activation was conducted by applying a short cell‐permeable peptide that corresponds to the N‐terminus of MEK (MAP kinase kinase). This membrane permeable peptide selectively binds to ERK and prevents its interaction with MEK and thereby has no effect on JNKs or p38 MAP kinase, which makes it more suitable for specific inhibition of ERK activation in comparison with the common pharmacological inhibitors (33). Inhibition of ERK activation reduced the genotoxic effect of dopamine, which can be attributed to the decreased ability of DAT to take up dopamine (44% in MDCK‐DAT cells upon ERK inhibition). Inhibition of PI3K by wortmannin also reduced the dopamine‐induced DNA damage and measurement of dopamine uptake after wortmannin treatment also showed a decrease to 59%, which may account for the impeded genotoxic damage.
We also observed a reduction of dopamine uptake after treatment with the D2R antagonist sulpiride (to 67%). This reduction confirmed our results from immunocytochemistry where we could show that sulpiride was able to reduce dopamine‐induced migration of DAT from the cytosol to the membrane. This agrees with another report describing the effect of D2R antagonism on DAT localization using other methods (40).
Our results from reduction of DAT activity after PI3K inhibition are in accordance with some previous reports (11) but Bolan and co‐workers (5) suggested that DAT regulation by D2R is PI3K independent. It is important to consider that our observation here is probably the mixed effect of D2/D3 receptors. Regulation of DAT by D2 and D3 receptors may take place at least in part through different mechanisms (55). The last report also stresses that inhibition of PI3K does not influence phosphorylation of MAPK induced by D3 signaling. Therefore, the effect of PI3K on DAT regulation can be considered MAPK independent. In our model we cannot distinguish between the roles of D2 or D3 receptors in the genotoxicity of dopamine. More investigations would have to be conducted to clarify this aspect.
It has been demonstrated by others that the oxidation of dopamine via enzymatic pathways (for example by MAO) as well as autoxidation leads to the production of ROS 3, 9. We also confirmed the release of H2O2 by PC 12 cells into the culture medium after dopamine treatment. Our results using two different MAO inhibitors and dopamine in the micronucleus frequency test provide evidence that ROS production after MAO‐dependent oxidation of dopamine plays the major role in the genotoxicity of dopamine, although autoxidation may add to this. MAO deaminates dopamine in the cytoplasm and produces H2O2 as by‐product. H2O2 itself might damage the biological macromolecules of the cell. In the presence of ferrous ions it is reduced to the highly reactive hydroxyl radicals through the Fenton reaction (2), which can attack nucleic acids, lipids and proteins in the cells directly or be converted to other radicals, which all are potentially capable of damaging DNA as well as other biomolecules. The hydroxyl radical produces the altered DNA base 8‐oxodG, which is an important biomarker for oxidative stress (41) and also the most abundant oxidative DNA lesion (13). Our mass spectrometry measurements revealed that treatment of PC12 cells with dopamine led to a significant increase in 8‐oxodG level. This elevated level of 8‐oxodG was prevented when the MAO inhibitor PCPA was used in combination with dopamine, showing that dopamine‐induced 8‐oxodG formation in this cell line is MAO dependent. Because of base mispairing 8‐oxodG can lead to G : C to T : A transversions after replication, representing point mutations 13, 19.
PEA has a structure similar to dopamine with the exception of two hydroxyl groups lacking on the phenyl ring. This difference in structure inhibits PEA from producing quinones and semiquinones after being deaminated by MAO but not from production of H2O2 (32). PEA was able to induce micronucleus formation in PC12 cells suggesting that the genotoxicity of dopamine may be caused by production of ROS. As the effect of PEA was not as high as that of dopamine, formation of quinones and semiquinones may also be involved.
The relationship between ROS production and carcinogenesis 25, 35 as well as age‐related diseases has been well studied 26, 44, 48. Recently, micronucleus formation in peripheral blood lymphocytes has been correlated with cancer risk 6, 46. There is evidence that PD patients show a higher number of micronuclei in their lymphocytes (43). A second study using comet assay has also demonstrated elevated amounts of oxidative DNA damages in the lymphocytes of PD patients before L‐DOPA therapy (14). We also have investigated lymphocytes of PD patients under high dose L‐DOPA therapy (47).The results showed that in the patients who received L‐DOPA together with a dopamine receptor agonist, there is a positive correlation between the daily dose of L‐DOPA and the number of micronuclei as well as with the level of 8‐oxodG DNA alterations, which agrees with our hypothesis for the role of dopamine receptor signaling in the genotoxicity of dopamine in vitro. These correlations were absent (micronucleus frequency) or negative (8‐oxodG level) in the patients who were treated with L‐DOPA alone.
Several other groups have measured the physiological and pathophysiological concentration of dopamine in plasma or other body fluids. The values for physiological concentrations lie usually in the nanomolar range but these values can change extremely under pathophysiological conditions. One study reports values around 20 and 35 µM in blood and cerebrospinal fluid, respectively, of elderly individuals that were suspected for Alzheimer's disease (20). In vitro we have shown that in some cell lines even the dopamine concentration of 6.25 µM can lead to significant DNA damage (52). It still needs to be determined whether and at which concentration of dopamine there is a threshold for our observed mechanisms. Under physiological conditions, the amount of ROS that is produced from oxidation of dopamine is easily scavenged by the antioxidant defense system of the body like antioxidant enzymes (superoxide dismutase, catalase, etc.), endogenous antioxidants (glutathione) or exogenous antioxidants from food intake (vitamins, polyphenols, etc.). When the concentration of dopamine is elevated because of a pathophysiological condition, more ROS are produced from the oxidative metabolism of dopamine. This results in demand for higher activation of the antioxidative defense system. In this case, the success of the defense system depends on the amount of produced ROS, efficacy of antioxidant enzyme and nutritional habits of the individual.
In conclusion, the present results show that the uptake of dopamine via DAT is the key component of dopamine‐induced genotoxicity. Once inside the cells, dopamine undergoes deamination, mainly by MAO, which leads to the production of ROS as by‐products. These ROS are a major cause of the observed DNA damage in our system. D2R signaling is involved in this action via G‐protein‐mediated activation of PI3K and ERK, which ultimately results in higher activation and cell surface transfer of DAT and hence elevated dopamine uptake.
CONFLICT OF INTEREST STATEMENT
H Stopper acted as an independent consultant to Novartis Pharmaceutical Company in 2008. Consultancy did not involve any of the compounds applied in this study. The other authors declare that there are no conflicts of interest.
ACKNOWLEDGMENTS AND SOURCE OF FUNDING
We thank Prof. G Rudnick, Department of Pharmacology, Yale University School of Medicine, Atlanta, Georgia, for providing MDCK‐DAT cells.
G Fazeli was supported by a grant of the German Excellence Initiative to the Graduate School of Life Sciences, University of Wuerzburg.
We thank Benjamin Weber and Kathrin Welsch for their expert technical assistance.
REFERENCES
- 1. Benzie IF, Strain JJ (1996) The ferric reducing ability of plasma (FRAP) as a measure of “antioxidant power”: the FRAP assay. Anal Biochem 239:70–76. [DOI] [PubMed] [Google Scholar]
- 2. Betteridge DJ (2000) What is oxidative stress? Metabolism 49:3–8. [DOI] [PubMed] [Google Scholar]
- 3. Bisaglia M, Mammi S, Bubacco L (2007) Kinetic and structural analysis of the early oxidation products of dopamine—Analysis of the interactions with alpha‐synuclein. J Biol Chem 282:15597–15605. [DOI] [PubMed] [Google Scholar]
- 4. Blakely RD, Ramamoorthy S, Schroeter S, Qian Y, Apparsundaram S, Galli A, DeFelice LJ (1998) Regulated phosphorylation and trafficking of antidepressant‐sensitive serotonin transporter proteins. Biol Psychiatry 44:169–178. [DOI] [PubMed] [Google Scholar]
- 5. Bolan EA, Kivell B, Jaligam V, Oz M, Jayanthi LD, Han Y et al (2007) D2 receptors regulate dopamine transporter function via an extracellular signal‐regulated kinases 1 and 2‐dependent and phosphoinositide 3 kinase‐independent mechanism. Mol Pharmacol 71:1222–1232. [DOI] [PubMed] [Google Scholar]
- 6. Bonassi S, Znaor A, Ceppi M, Lando C, Chang WP, Holland N et al (2007) An increased micronucleus frequency in peripheral blood lymphocytes predicts the risk of cancer in humans. Carcinogenesis 28:625–631. [DOI] [PubMed] [Google Scholar]
- 7. Brajter‐Toth A, Chambers JQ (2002) Electroanalytical Methods for Biological Materials. Marcel Dekker: New York. [Google Scholar]
- 8. Brink A, Lutz U, Volkel W, Lutz WK (2006) Simultaneous determination of O6‐methyl‐2′‐deoxyguanosine, 8‐oxo‐7,8‐dihydro‐2′‐deoxyguanosine, and 1,N6‐etheno‐2′‐deoxyadenosine in DNA using on‐line sample preparation by HPLC column switching coupled to ESI‐MS/MS. J Chromatogr B Analyt Technol Biomed Life Sci 830:255–261. [DOI] [PubMed] [Google Scholar]
- 9. Cadet JL, Brannock C (1998) Free radicals and the pathobiology of brain dopamine systems. Neurochem Int 32:117–131. [DOI] [PubMed] [Google Scholar]
- 10. Cai G, Zhen X, Uryu K, Friedman E (2000) Activation of extracellular signal‐regulated protein kinases is associated with a sensitized locomotor response to D(2) dopamine receptor stimulation in unilateral 6‐hydroxydopamine‐lesioned rats. J Neurosci 20:1849–1857. [DOI] [PMC free article] [PubMed] [Google Scholar]
- 11. Carvelli L, Moron JA, Kahlig KM, Ferrer JV, Sen N, Lechleiter JD et al (2002) PI 3‐kinase regulation of dopamine uptake. J Neurochem 81:859–869. [DOI] [PubMed] [Google Scholar]
- 12. Chao MR, Yen CC, Hu CW (2008) Prevention of artifactual oxidation in determination of cellular 8‐oxo‐7,8‐dihydro‐2′‐deoxyguanosine by isotope‐dilution LC‐MS/MS with automated solid‐phase extraction. Free Radic Biol Med 44:464–473. [DOI] [PubMed] [Google Scholar]
- 13. Cheng KC, Cahill DS, Kasai H, Nishimura S, Loeb LA (1992) 8‐Hydroxyguanine, an abundant form of oxidative DNA damage, causes G—T and A—C substitutions. J Biol Chem 267:166–172. [PubMed] [Google Scholar]
- 14. Cornetta T, Palma S, Aprile I, Padua L, Tonali P, Testa A, Cozzi R (2009) Levodopa therapy reduces DNA damage in peripheral blood cells of patients with Parkinson's disease. Cell Biol Toxicol 25:321–330. [DOI] [PubMed] [Google Scholar]
- 15. Daniels GM, Amara SG (1999) Regulated trafficking of the human dopamine transporter. Clathrin‐mediated internalization and lysosomal degradation in response to phorbol esters. J Biol Chem 274:35794–35801. [DOI] [PubMed] [Google Scholar]
- 16. Doggrell SA (2002) The therapeutic potential of dopamine modulators on the cardiovascular and renal systems. Expert Opin Investig Drugs 11:631–644. [DOI] [PubMed] [Google Scholar]
- 17. Fenech M (2000) The in vitro micronucleus technique. Mutat Res 455:81–95. [DOI] [PubMed] [Google Scholar]
- 18. Fleckenstein AE, Pogun S, Carroll FI, Kuhar MJ (1996) Recovery of dopamine transporter binding and function after intrastriatal administration of the irreversible inhibitor RTI‐76 [3 beta‐(3p‐chlorophenyl) tropan‐2 beta‐carboxylic acid p‐isothiocyanatophenylethyl ester hydrochloride]. J Pharmacol Exp Ther 279:200–206. [PubMed] [Google Scholar]
- 19. Floyd RA (1990) The role of 8‐hydroxyguanine in carcinogenesis. Carcinogenesis 11:1447–1450. [DOI] [PubMed] [Google Scholar]
- 20. Fonteh AN, Harrington RJ, Tsai A, Liao P, Harrington MG (2007) Free amino acid and dipeptide changes in the body fluids from Alzheimer's disease subjects. Amino Acids 32:213–224. [DOI] [PubMed] [Google Scholar]
- 21. Gerdin MJ, Eiden LE (2007) Regulation of PC12 cell differentiation by cAMP signaling to ERK independent of PKA: do all the connections add up? Sci STKE 2007:pe15. [DOI] [PMC free article] [PubMed] [Google Scholar]
- 22. Giros B, Caron MG (1993) Molecular characterization of the dopamine transporter. Trends Pharmacol Sci 14:43–49. [DOI] [PubMed] [Google Scholar]
- 23. Gu HH, Ahn J, Caplan MJ, Blakely RD, Levey AI, Rudnick G (1996) Cell‐specific sorting of biogenic amine transporters expressed in epithelial cells. J Biol Chem 271:18100–18106. [DOI] [PubMed] [Google Scholar]
- 24. Gu Q, Shi X, Yin P, Gao P, Lu X, Xu G (2008) Analysis of catecholamines and their metabolites in adrenal gland by liquid chromatography tandem mass spectrometry. Anal Chim Acta 609:192–200. [DOI] [PubMed] [Google Scholar]
- 25. Guyton KZ, Kensler TW (1993) Oxidative mechanisms in carcinogenesis. Brit Med Bull 49:523–544. [DOI] [PubMed] [Google Scholar]
- 26. Hermida‐Ameijeiras A, Mendez‐Alvarez E, Sanchez‐Iglesias S, Sanmartin‐Suarez C, Soto‐Otero R (2004) Autoxidation and MAO‐mediated metabolism of dopamine as a potential cause of oxidative stress: role of ferrous and ferric ions. Neurochem Int 45:103–116. [DOI] [PubMed] [Google Scholar]
- 27. Hersch SM, Yi H, Heilman CJ, Edwards RH, Levey AI (1997) Subcellular localization and molecular topology of the dopamine transporter in the striatum and substantia nigra. J Comp Neurol 388:211–227. [PubMed] [Google Scholar]
- 28. Hyman SE (1996) Addiction to cocaine and amphetamine. Neuron 16:901–904. [DOI] [PubMed] [Google Scholar]
- 29. Jeon S, Park JK, Bae CD, Park J (2010) NGF‐induced moesin phosphorylation is mediated by the PI3K, Rac1 and Akt and required for neurite formation in PC12 cells. Neurochem Int 56:810–818. [DOI] [PubMed] [Google Scholar]
- 30. Johnson C, Sanders K, Fan H (2010) Jaagsiekte sheep retrovirus transformation in madin‐darby canine kidney epithelial cell 3‐D culture. J Virol 84:5379–5390. [DOI] [PMC free article] [PubMed] [Google Scholar]
- 31. Kamata Y, Shiraga H, Tai A, Kawamoto Y, Gohda E (2007) Induction of neurite outgrowth in PC12 cells by the medium‐chain fatty acid octanoic acid. Neuroscience 146:1073–1081. [DOI] [PubMed] [Google Scholar]
- 32. Kawano T, Pinontoan R, Uozumi N, Morimitsu Y, Miyake C, Asada K, Muto S (2000) Phenylethylamine‐induced generation of reactive oxygen species and ascorbate free radicals in tobacco suspension culture: mechanism for oxidative burst mediating Ca2+ influx. Plant Cell Physiol 41:1259–1266. [DOI] [PubMed] [Google Scholar]
- 33. Kelemen BR, Hsiao K, Goueli SA (2002) Selective in vivo inhibition of mitogen‐activated protein kinase activation using cell‐permeable peptides. J Biol Chem 277:8741–8748. [DOI] [PubMed] [Google Scholar]
- 34. Kierbel A, Gassama‐Diagne A, Mostov K, Engel JN (2005) The phosphoinositol‐3‐kinase‐protein kinase B/Akt pathway is critical for Pseudomonas aeruginosa strain PAK internalization. Mol Biol Cell 16:2577–2585. [DOI] [PMC free article] [PubMed] [Google Scholar]
- 35. Klaunig JE, Kamendulis LM (2004) The role of oxidative stress in carcinogenesis. Annu Rev Pharmacol 44:239–267. [DOI] [PubMed] [Google Scholar]
- 36. Li MW, Martin RS (2008) Microchip‐based integration of cell immobilization, electrophoresis, post‐column derivatization, and fluorescence detection for monitoring the release of dopamine from PC 12 cells. The Analyst 133:1358–1366. [DOI] [PMC free article] [PubMed] [Google Scholar]
- 37. Lin Z, Zhang PW, Zhu X, Melgari JM, Huff R, Spieldoch RL, Uhl GR (2003) Phosphatidylinositol 3‐kinase, protein kinase C, and MEK1/2 kinase regulation of dopamine transporters (DAT) require N‐terminal DAT phosphoacceptor sites. J Biol Chem 278:20162–20170. [DOI] [PubMed] [Google Scholar]
- 38. Loder MK, Melikian HE (2003) The dopamine transporter constitutively internalizes and recycles in a protein kinase C‐regulated manner in stably transfected PC12 cell lines. J Biol Chem 278:22168–22174. [DOI] [PMC free article] [PubMed] [Google Scholar]
- 39. Loft S, Poulsen HE (1996) Cancer risk and oxidative DNA damage in man. J Mol Med 74:297–312. [DOI] [PubMed] [Google Scholar]
- 40. Mayfield RD, Zahniser NR (2001) Dopamine D2 receptor regulation of the dopamine transporter expressed in Xenopus laevis oocytes is voltage‐independent. Mol Pharmacol 59:113–121. [DOI] [PubMed] [Google Scholar]
- 41. McCall MR, Frei B (1999) Can antioxidant vitamins materially reduce oxidative damage in humans? Free Radic Bio Med 26:1034–1053. [DOI] [PubMed] [Google Scholar]
- 42. Mehler‐Wex C, Riederer P, Gerlach M (2006) Dopaminergic dysbalance in distinct basal ganglia neurocircuits: implications for the pathophysiology of Parkinson's disease, schizophrenia and attention deficit hyperactivity disorder. Neurotox Res 10:167–179. [DOI] [PubMed] [Google Scholar]
- 43. Migliore L, Petrozzi L, Lucetti C, Gambaccini G, Bernardini S, Scarpato R et al (2002) Oxidative damage and cytogenetic analysis in leukocytes of Parkinson's disease patients. Neurology 58:1809–1815. [DOI] [PubMed] [Google Scholar]
- 44. Miyazaki I, Asanuma M (2008) Dopaminergic neuron‐specific oxidative stress caused by dopamine itself. Acta Med Okayama 62:141–150. [DOI] [PubMed] [Google Scholar]
- 45. Moron JA, Zakharova I, Ferrer JV, Merrill GA, Hope B, Lafer EM et al (2003) Mitogen‐activated protein kinase regulates dopamine transporter surface expression and dopamine transport capacity. J Neurosci 23:8480–8488. [DOI] [PMC free article] [PubMed] [Google Scholar]
- 46. Murgia E, Ballardin M, Bonassi S, Rossi AM, Barale R (2008) Validation of micronuclei frequency in peripheral blood lymphocytes as early cancer risk biomarker in a nested case‐control study. Mutat Res-Fundam Mol Mech Mutagen 639:27–34. [DOI] [PubMed] [Google Scholar]
- 47. Oli RG, Fazeli G, Kuhn W, Walitza S, Gerlach M, Stopper H (2010) No increased chromosomal damage in L‐DOPA‐treated patients with Parkinson's disease: a pilot study. J Neural Transm 117:737–746. [DOI] [PubMed] [Google Scholar]
- 48. Petrozzi L, Lucetti C, Scarpato R, Gambaccini G, Trippi F, Bernardini S et al (2002) Cytogenetic alterations in lymphocytes of Alzheimer's disease and Parkinson's disease patients. Neurol Sci 23(Suppl. 2):S97–S98. [DOI] [PubMed] [Google Scholar]
- 49. Pick E, Mizel D (1981) Rapid microassays for the measurement of superoxide and hydrogen peroxide production by macrophages in culture using an automatic enzyme immunoassay reader. J Immunol Methods 46:211–226. [DOI] [PubMed] [Google Scholar]
- 50. Qian Y, Galli A, Ramamoorthy S, Risso S, DeFelice LJ, Blakely RD (1997) Protein kinase C activation regulates human serotonin transporters in HEK‐293 cells via altered cell surface expression. J Neurosci 17:45–57. [DOI] [PMC free article] [PubMed] [Google Scholar]
- 51. Rozen S, Skaletsky H(2000) Primer3 on the WWW for general users and for biologist programmers. Methods Mol Biol 132:365–386. [DOI] [PubMed] [Google Scholar]
- 52. Stopper H, Schupp N, Fazeli G, Dietel B, Queisser N, Walitza S, Gerlach M (2009) Genotoxicity of the neurotransmitter dopamine in vitro . Toxicol In Vitro 23:640–646. [DOI] [PubMed] [Google Scholar]
- 53. Vaudry D, Stork PJ, Lazarovici P, Eiden LE (2002) Signaling pathways for PC12 cell differentiation: making the right connections. Science 296:1648–1649. [DOI] [PubMed] [Google Scholar]
- 54. Waheed F, Speight P, Kawai G, Dan Q, Kapus A, Szaszi K (2010) Extracellular signal regulated kinase and GEF‐H1 mediate depolarization‐induced Rho activation and paracellular permeability increase. Am J Physiol Cell Physiol 298:C1376–C1387. [DOI] [PMC free article] [PubMed] [Google Scholar]
- 55. Zapata A, Kivell B, Han Y, Javitch JA, Bolan EA, Kuraguntla D et al (2007) Regulation of dopamine transporter function and cell surface expression by D3 dopamine receptors. J Biol Chem 282:35842–35854. [DOI] [PubMed] [Google Scholar]