

Abstract
Neuroaxonal damage and loss are increasingly recognized as disability determining features in multiple sclerosis (MS) pathology. However, little is known about the long‐term sequelae of inflammatory demyelination on neurons and axons.
Spinal cord tissue of 31 MS patients was compared to three amyotrophic lateral sclerosis (ALS) and 10 control subjects. MS lesions were staged according to the density of KiM‐1P positive macrophages and microglia and the presence of myelin basic protein (MBP) positive phagocytes. T cells were quantified in the parenchyma and meninges. Neuroaxonal changes were studied by immunoreactivity (IR) for amyloid precursor protein (APP) and variably phosphorylated neurofilaments (SMI312, SMI31, SMI32).
Little T cell infiltration was still evident in chronic inactive lesions. The loss of SMI32 IR in ventral horn neurons correlated with MS lesion development and disease progression. Similarly, axonal loss in white matter (WM) lesions correlated with disease duration. A selective reduction of axonal phosphorylated neurofilaments (SMI31) was observed in WM lesions. In ALS, the loss of neuronal SMI32 IR was even more pronounced, whereas the relative axonal reduction resembled that found in MS.
Progressive neuroaxonal neurofilament alterations in the context of chronic inflammatory demyelination may reflect changes in neuroaxonal metabolism and result in chronic neuroaxonal dysfunction as a putative substrate of clinical progression.
Keywords: axonal loss, disease progression, multiple sclerosis, neurofilament phosphorylation, spinal cord
INTRODUCTION
Inflammatory demyelination and gliosis are the traditional hallmarks of multiple sclerosis (MS) pathology. After decades of focusing on myelin destruction, attention has recently been directed toward neuroaxonal damage and its contribution to disease outcome 4, 18, 19, 48, 50, 56. The extent and dynamics of neuroaxonal changes upon disease evolution in MS, however, are still controversial. We and others have recently shown that a fairly substantial neuronal demise is evident in the early stages of lesion development in MS spinal cord and may contribute to the neurological deficits 25, 48, 60. Neuronal damage and loss in MS were described in distinct gray matter (GM) areas of the cortex, thalamus, hippocampus and spinal cord 12, 25, 43, 48, 59, 60, 62.
In many patients, after an initial inflammatory, relapsing‐remitting phase, the disease converts into a progressive phase with continuous accumulation of disability and little response to immunomodulatory treatments. The pathological substrates of the progressive disease phase remain elusive so far. Given the paucity of acute inflammation evidenced by few or no gadolinium‐enhancing lesions in MRI, neuronal and axonal damage and/or loss have been proposed to contribute to disease progression 6, 14, 33, 54. In long‐standing disease, typical demyelinated lesions are present, but only little inflammation and little acute axonal damage can be detected (19). As a consequence of chronic demyelination, axons may react with impaired mitochondrial function and a redistribution of ion channels 7, 16, 40.
Spinal cord lesions are a major cause of clinical symptoms in MS, such as motor and sensory disturbances. In pathological and imaging studies, the MS spinal cord is characterized by prominent atrophy, presumed to be due to a combined loss of myelin and axons 1, 17, 23, 35. Axonal loss in spinal white matter (WM) is most prominent at the cervical and thoracic levels and correlates well with neurological disability 5, 15, 54, 55.
Given our recent observation that spinal neuronal loss does not progress with disease duration, we asked in the present study which other neuroaxonal changes might serve as pathological correlates of clinical disability and worsening. In experimental autoimmune encephalomyelitis (EAE), a reduction in the proportion of SMI32 immunoreactive spinal motoneurons, atrophy of neuronal cell bodies, as well as shortened and fragmented dendrites were described independent of neuronal loss (2). Furthermore, ongoing axonal damage and loss dissociated from inflammation and correlating with the clinical impairment have been described in EAE (27).
Neurons and axons contain variably phosphorylated neurofilaments of low, medium and high molecular weight (MW) with important functions in cytoskeletal organization, cellular transport and regeneration 34, 49. Phosphorylated high MW neurofilaments prevail in axons, identified by immunoreactivity (IR) for SMI31 and SMI35, whereas SMI32+ nonphosphorylated high MW neurofilaments are detected in the neuronal cell body (53). Neurofilament dephosphorylation in axons and hyperphosphorylation in neurons as indicators of axonal transport disturbance and neuronal damage have been described in MS 44, 56. After acute axotomy, phosphorylated high MW neurofilaments, detected by, for example, SMI31 and SMI35 antibodies, can accumulate in neuronal cell bodies as seen in active demyelinating MS lesions (48). Demyelinated and damaged axons show a higher proportion of nonphosphorylated, SMI32+ neurofilaments (56).
In the present study, we asked whether the extent of neuroaxonal pathology varied in relation to the lesion stage, and whether changes in neurofilament phosphorylation and axonal loss might be factors contributing to disease progression. We recognized significant alterations in neurofilament phosphorylation in neuronal cell bodies, namely a loss of SMI32 IR, increasing with lesion age and correlating with patient age at death and disease duration. Furthermore, a progressive loss of axons was observed with increasing lesion and disease chronicity. Parenchymal and meningeal T cells were found even after long disease duration. We thus propose that alterations in neurofilament phosphorylation induced by a chronic inflammatory demyelinating process may lead to neuronal and axonal dysfunction and eventually demise and represent a putative substrate of disease progression.
SUBJECTS AND METHODS
Spinal cord tissue
The study was performed on formalin‐fixed and paraffin‐embedded spinal cord tissue from 31 MS patients obtained at autopsy from six cervical, 14 thoracic and 11 lumbar segmental levels. The disease duration of the patients ranged between 1 and 39 years (Table 1). According to the clinical data available, the majority of the patients had severe spinal symptoms and were wheelchair‐bound [expanded disability status scale (EDSS) 7 equivalent](32). In addition, tissue from 10 individuals without neuropathological findings in the spinal cord and from three patients with neuropathologically confirmed amyotrophic lateral sclerosis (ALS) was studied (Table 1). The tissue was collected at the Institute of Neuropathology at the University Medical Centre Göttingen and the Neurological Institute of the McGill University in Montreal. The study was carried out according to the national ethical guidelines and legal regulations.
Table 1.
Clinical and lesion characteristics of multiple sclerosis (MS) and amyotrophic lateral sclerosis (ALS) patients, and controls. Abbreviations: incl. = including; ant. horn = anterior horn; WM = white matter demyelination; GM = gray matter demyelination; C = cervical; T = thoracic; L = lumbar; PP = primary progressive; CP = chronic progressive; RR = relapsing remitting; SP = secondary progressive; n/a = not available; ys = years; mo = months; M = male; F = female; – = no demyelinated lesion.
| MS patients no. | Age | Sex | Disease duration (ys) | Disease course | Spinal level | Lesion classification | Lesion location |
|---|---|---|---|---|---|---|---|
| 1 | 41 | M | 6 | SP | T | Active | WM, GM (incl. ant. horn) |
| 2 | 52 | F | 8 | PP | L | Active | WM, GM (incl. ant. horn) |
| 3 | 44 | M | 15 | PP | T | Active | WM |
| 4 | 36 | M | 1 | PP | C | Active | WM |
| 5 | 36 | F | n/a | PP | T | Active | WM, GM |
| 6 | 44 | F | 15 | PP | T | Active | WM, GM |
| 7 | 28 | M | 3 | PP | L | Active | WM, GM (incl. ant. horn) |
| 8 | 40 | F | 7 | RR | T | Active | WM, GM |
| 9 | 30 | F | 9 | PP | L | Inactive I | WM, GM (incl. ant. horn) |
| 10 | 66 | M | 39 | CP | L | Inactive I | WM |
| 11 | 54 | M | 11 | SP | C | Inactive I | WM, GM |
| 12 | 53 | F | 15 | SP | T | Inactive I | WM, GM |
| 13 | 57 | M | 11 | PP | L | Inactive I | WM, GM |
| 14 | 51 | M | 8 | PP | T | Inactive I | WM, GM (incl. ant. horn) |
| 15 | 59 | F | 16 | SP | C | Inactive I | WM, GM |
| 16 | 46 | M | 20 | CP | C | Inactive I | WM, GM |
| 17 | 42 | F | 10 | CP | T | Inactive I | WM, GM |
| 18 | 60 | F | 14 | PP | T | Inactive I | WM, GM |
| 19 | 74 | M | 10 | PP | T | Inactive II | WM, GM |
| 20 | 70 | F | 7 | PP | T | Inactive II | WM, GM |
| 21 | 61 | F | 19 | PP | L | Inactive II | WM, GM |
| 22 | 52 | M | 16 | SP | T | Inactive II | WM, GM (incl. ant. horn) |
| 23 | 66 | M | 15 | CP | L | Inactive II | WM |
| 24 | 65 | M | n/a | CP | L | Inactive II | WM, GM (incl. ant. horn) |
| 25 | 57 | M | 29 | SP | L | Inactive III | WM, GM |
| 26 | 63 | M | 19 | PP | C | Inactive III | WM, GM |
| 27 | 81 | F | 36 | SP | T | Inactive III | WM, GM (incl. ant. horn) |
| 28 | 61 | M | 6 | RR | L | Inactive III | WM, GM (incl. ant. horn) |
| 29 | 61 | F | 18 | SP | L | Inactive III | WM, GM (incl. ant. horn) |
| 30 | 35 | M | 15 | CP | C | Inactive III | WM, GM (incl. ant. horn) |
| 31 | 69 | F | 21 | CP | T | Inactive III | WM, GM (incl. ant. horn) |
| ALS patients No. | Age | Sex | Disease duration (ys) | Cause of death | Spinal levels | ||
|---|---|---|---|---|---|---|---|
| 1 | 41 | M | 3 mo | Pneumonia | T (5x), L | – | |
| 2 | 59 | M | 18 | n/a | C (2x), T, L | – | |
| 3 | 74 | M | n/a | Pneumonia | C (14x), L (4x) | – |
| Controls No. | Age | Sex | Cause of death | Spinal levels | |||
|---|---|---|---|---|---|---|---|
| 1 | 77 | M | Myocardial infarction | C, T, L | – | ||
| 2 | 71 | M | Aortic dissection | C (3x) | – | ||
| 3 | 62 | M | Ischemic heart disease | T, L (2x) | – | ||
| 4 | 62 | F | Breast cancer | C, T, L | – | ||
| 5 | 83 | M | Tumor metastases | C, T, L | – | ||
| 6 | 47 | M | Germinal cell tumor | C, T, L | – | ||
| 7 | 62 | M | Plasmocytoma | L | – | ||
| 8 | 81 | M | Pneumonia | C, T, L | – | ||
| 9 | 70 | M | Bronchial carcinoma | C, T | – | ||
| 10 | 52 | M | Acute pulmonary embolism | T | – |
Sections stained with Luxol fast blue/PAS and antibodies against myelin basic protein (MBP), macrophages/microglia (KiM‐1P), and T cells (CD3, CD8) were used for MS lesion classification.
Immunohistochemistry
Immunohistochemistry was carried out on 2–3 µm‐thick sections that were deparaffinized, hydrated and pretreated as described previously (52). Incubations with primary antibodies (Table 2) diluted in 10% fetal calf serum in phosphate‐buffered saline were carried out overnight at 4°C. Antibody detection was achieved using biotinylated secondary antisera followed by avidin‐peroxidase. Diaminobenzidine and fast blue (Sigma‐Aldrich Inc., St. Louis, MO, USA) were used as chromogenic substrates. Negative control sections without primary antibody or with isotype control antibody were processed in parallel. Sections were then counterstained with either hematoxylin or 4′,6′‐diamino‐2‐phenylindole (DAPI). Double fluorescence labeling with two mouse monoclonal primary antibodies was carried out according to a previously described protocol (48). Images were taken using an Olympus BX51 microscope equipped with a DP71 CCD camera (Olympus Optical Co, Ltd., Hamburg, Germany) and a Zeiss Cell Observer microscope with an AxioCam ICc 3 CCD camera (Carl Zeiss MicroImaging, Ltd., Göttingen, Germany).
Table 2.
Antibodies used for immunohistochemistry. Abbreviations: MBP = myelin basic protein; MW = microwave pretreatment; NF = neurofilament; nonP = nonphosphorylated; hypoP = hypo phosphorylated; P = phosphorylated; PC = polyclonal; H = high molecular weight; TSA = tyramide signal amplification.
| Antigen | Clone | Dilution | Pretreatment | Source |
|---|---|---|---|---|
| MBP | rabbit pc | 1:500 | MW | DakoCytomation, Glostrup, Denmark |
| Macrophages/microglia | KiM‐1P | 1:5 000 | MW | (47) |
| CD3 | CD3‐12 | 1:50 | MW | AbD Serotec, MorphoSys AG, Martinsried, Germany |
| CD8 | CD8‐144B | 1:50 | MW | DakoCytomation, Glostrup, Denmark |
| beta‐Tubulin | TUB 2.1 | 1:400 | MW | Sigma‐Aldrich Inc., Saint Louis, MO, USA |
| APP | 22C11 | 1:3 000 | MW | Chemicon International, Temecula, CA, USA |
| nonP‐NF | SMI311 | 1:1 000 | MW | Covance Inc., Princeton, NJ, USA |
| nonP‐NF‐H | SMI32 | 1:7 000 (TSA: 1:1 0000) | MW | Covance Inc., Princeton, NJ, USA |
| hypoP‐NF‐H | SMI35 | 1:1 0000 | MW | Covance Inc., Princeton, NJ, USA |
| P‐NF‐H | SMI31 | 1:1 000 | MW | Covance Inc., Princeton, NJ, USA |
| panP‐NF‐H | SMI312 | 1:1 000 | none | Covance Inc., Princeton, NJ, USA |
Morphometry
In MS patients, MBP‐stained spinal cord cross sections displayed sharply delineated, demyelinated gray and WM lesions. KiM‐1P+ mononuclear cells of both macrophage and microglia phenotype were counted in the lesions and given as absolute numbers per square millimeter. CD3+ and CD8+ T cells were counted both in the meninges (section perimeter) and in the parenchyma (cross‐sectional area) and given as mean absolute numbers per square millimeter.
Ventral GM designates Rexed laminae VII–IX, central GM Rexed laminae V and VI and dorsal GM Rexed laminae I–IV (42). To determine neuronal numbers, sections immunostained for SMI32 (nonP‐NF‐H) and counterstained with hematoxylin were used. The total number of neurons n is given as the sum of SMI32+ and SMI32− neurons located ventrally to a virtual line crossing the GM commissure, thus mainly encompassing lamina VII–IX neurons. SMI32− neurons were identified and counted according to morphological criteria (48). Neuronal numbers were confirmed using the pan‐neuronal marker SMI311. We calculated the proportion of SMI32+ neuronal somata compared to the neuronal n in the ventral horn.
The relative axonal densities in spinal WM lesions were determined in five standardized microscopic fields within the lesion center with an ocular grid at 1000 × magnification (oil immersion) using sections stained for SMI312 (panP‐NF‐H), SMI31 (highP‐NF‐H) and SMI32 (nonP‐NF‐H). The overall axonal density n was confirmed using Bielschowsky silver impregnation. As axonal densities did not differ between SMI312 immunohistochemistry and Bielschowsky silver impregnation (P = 0.90), both techniques were used to determine overall densities. Of note, axonal densities in MS lesions and ALS corticospinal tracts were compared to the mean density of five standardized microscopic fields obtained in the ventral and lateral corticospinal tracts as well as the dorsal columns of control spinal cords, resulting in a standardized control axonal density. In MS and ALS, relative axonal densities are given as percentages of controls. The number of amyloid precursor protein (APP) positive axonal spheroids in spinal cord WM lesions was determined in five standardized microscopic fields of 62 500 µm2 and is given as immunopositive profiles/mm2 ± standard deviation (SD).
Statistics
The nonparametric Kruskal–Wallis test with Dunn's multiple comparison post‐test was applied to compare numbers of KiM‐1P+ macrophages/microglia, CD3+/CD8+ T cells, Bielschowsky+/SMI312+/SMI31+/SMI32+ axons and their ratios, and APP+ axonal spheroids. Analysis of variance with Tukey's post‐test was used to compare numbers of SMI32+ neuronal somata. Spearman's rank correlation was used to identify interdependence of confounding variables. All tests were classified as significant if P was <0.05. The GraphPad PRISMTM software was used for statistical calculations and graph generation (Graph Pad Software, Inc., San Diego, CA, USA).
RESULTS
Classification of spinal MS lesions
Spinal cord cross sections from different spinal levels from 31 patients, harboring 27 combined WM and GM and four WM only lesions, were studied. Furthermore, 12/27 lesions with WM and GM involvement embraced the anterior horn on one (n = 3) or both sides (n = 9; Table 1). Lesions were classified according to the presence of MBP+ myelin degradation products in phagocytes (Active; Figure 1A, E, Y), and the density of KiM‐1P+ macrophages/microglia (Inactive I–III; Figure 1F–H) 3, 9, 47. We distinguished morphologically between round, foamy KiM‐1P+ cells and microglia‐like cells with a typical ramified phenotype. Lesion stages Inactive I–III designated inactive demyelinated lesions with decreasing numbers of KiM‐1P+ cells (Figure 1B–D and F–H). Foam cell densities were highest in stages Active (628 ± 200 cells/mm2, mean ± SD) and Inactive I (185 ± 90 cells/mm2, mean ± SD; Active vs. Inactive I; P < 0.001; Figure 1E, F, Z1, Table 3). Significantly lower densities were observed in stages Inactive II (10 ± 16 cells/mm2; Active vs. Inactive II; P < 0.001) and Inactive III (0 ± 0 cells/mm2; Active vs. Inactive III; P < 0.001; Inactive I vs. Inactive III; P < 0.01; Figure 1G, H, Z1, Table 3). Lesion stages Inactive II and III differed significantly with respect to the density of KiM‐1P+ ramified cells of microglia morphology (216 ± 48 vs. 87 ± 40 cells/mm2, P < 0.01; Figure 1G, H, Z2, Table 3). Thus, stage Inactive III designates lesions with the least microglia and an exceedingly low foam cell density most likely reflecting chronic lesions with long‐standing demyelination (1, 2; Table 3). A total of eight Active, 10 Inactive I, six Inactive II and seven Inactive III demyelinated lesions from different spinal levels, all from different patients (n = 31), were studied (1, 3). The density of KiM‐1P+ cells of macrophage morphology was inversely correlated with disease duration (n = 29, P = 0.008, r = −0.4826; Figure 1Z5) and age of the patients (n = 31, P ≤ 0.0001, r = −0.6422). Furthermore, in our samples, disease duration and age at death of the patients were highly correlated (n = 28, P = 0.003, r = 0.5406).
Figure 1.
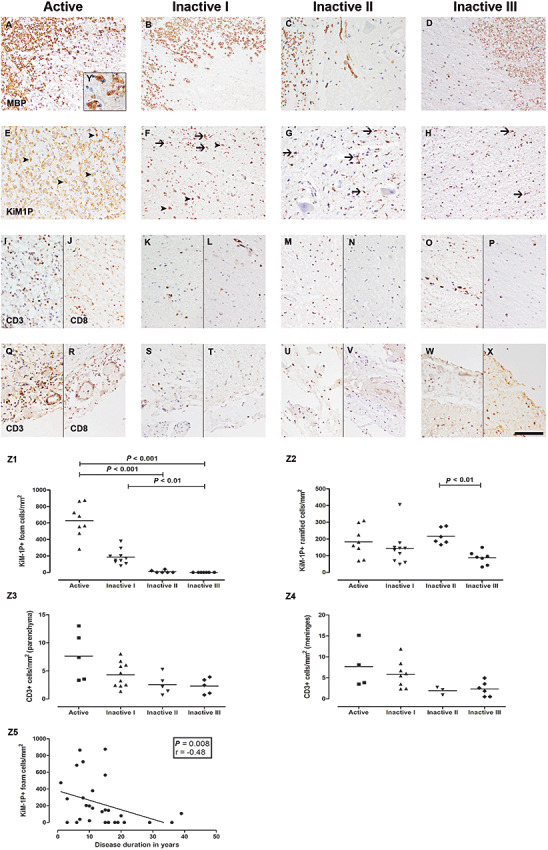
Staging of spinal multiple sclerosis (MS) lesions and T cell pathology. Spinal MS lesions were staged according to the presence of MBP+ (A–D) myelin degradation products in phagocytes (Active, A, E) and the density of KiM‐1P+ (E–H) macrophages/microglia (Inactive I–III, B–D, F–H), identified by morphological criteria: KiM‐1P immunohistochemistry revealed foam cells of variable density in Active and Inactive I lesions (E, F, arrowheads) and ramified cells of microglia phenotype in all lesion stages (E–H, arrows). Actively demyelinating lesions (Active) showed foamy phagocytes with incorporated MBP+ myelin degradation products (A and insert Y). Lesion stages Inactive I–III designate inactive demyelinated lesions with variable numbers of KiM‐1P+ cells (F–H) and a loss of MBP+ myelin sheaths (B–D). Few foam cells were still present in Inactive I lesions (B). Stage Inactive III harbored the lowest density of KiM‐1P+ cells (H). Foam cell densities decreased from lesion stages Active to Inactive I and Inactive II/III (Z1). Ramified microglia cell densities were significantly lower in lesions typed Inactive III compared to Inactive II (Z2). Decrease of macrophage like KiM‐1P+ cells correlated with the disease duration of the patients (Z5). Highest numbers of parenchymal and meningeal CD3+ and CD8+ T cells were found in stages Active (I, J and Q, R) and Inactive I (K, L and S, T). Sections with Inactive II (M, N and U, V) and Inactive III (O, P and W, X) lesions showed the lowest numbers of CD3+ and CD8+ cells. However, no statistically significant differences regarding CD3+ T cells in parenchymal lesions (Z3) and meninges (Z4) were observed. Scale bar (X): A–X: 100 µm; original magnifications: A–X: x200, Y: x1000.
Table 3.
Inflammation, acute axonal damage, and axonal and neuronal neurofilament phosphorylation changes with respect to lesion stage. Abbreviations: NF = neurofilament; H = high molecular weight; nonP = non phosphorylated; P = phosphorylated; SD = standard deviation.
| Active | Inactive I | Inactive II | Inactive III | |
|---|---|---|---|---|
| (mean ± SD) n = 8 | (mean ± SD) n = 10 | (mean ± SD) n = 6 | (mean ± SD) n = 7 | |
| KiM‐1P+ foam cells of macrophage morphology (per mm2) | 628 ± 200 | 185 ± 90 | 10 ± 16 | 0 ± 0 |
| KiM‐1P+ ramified cells of microglia morphology (per mm2) | 183 ± 91 | 144 ± 101 | 216 ± 48 | 87 ± 40 |
| CD3+ T cells/mm2 | ||||
| Parenchyma | 8 ± 4 | 4 ± 2 | 3 ± 2 | 2 ± 1 |
| Meninges | 8 ± 5 | 6 ± 3 | 2 ± 1 | 2 ± 2 |
| CD8+ T cells/mm2 | ||||
| Parenchyma | 6 ± 3 | 3 ± 2 | 2 ± 1 | 1 ± 1 |
| Meninges | 6 ± 5 | 5 ± 4 | 2 ± 1 | 2 ± 1 |
| Neuronal numbers (SMI32+ and SMI32− neurons) in % of controls | 83 ± 21 | 70 ± 23 | 80 ± 26 | 77 ± 20 |
| SMI32+ (nonP‐NF‐H) neurons in % of n neurons | 94 ± 2 | 90 ± 6 | 87 ± 4 | 77 ± 12 |
| Acute axonal damage (APP+ axonal spheroids/mm2) | 9 ± 8 | 4 ± 4 | 3 ± 3 | 0 ± 1 |
| Axonal density (axonal numbers in % of controls) | ||||
| Bielschowsky silver impregnation | 29 ± 17 | 45 ± 10 | 30 ± 17 | 19 ± 6 |
| panP‐NF‐H (SMI312) | 29 ± 16 | 44 ± 10 | 33 ± 18 | 17 ± 5 |
| P‐NF‐H (SMI31) | 18 ± 14 | 41 ± 14 | 28 ± 20 | 11 ± 7 |
| nonP‐NF‐H (SMI32) | 500 ± 605 | 480 ± 634 | 1000 ± 1110 | 640 ± 478 |
| Loss of axonal P‐NF‐H (Ratio of SMI31: Bielschowsky in %) | 52 ± 24 | 91 ± 23 | 72 ± 22 | 55 ± 26 |
Figure 2.
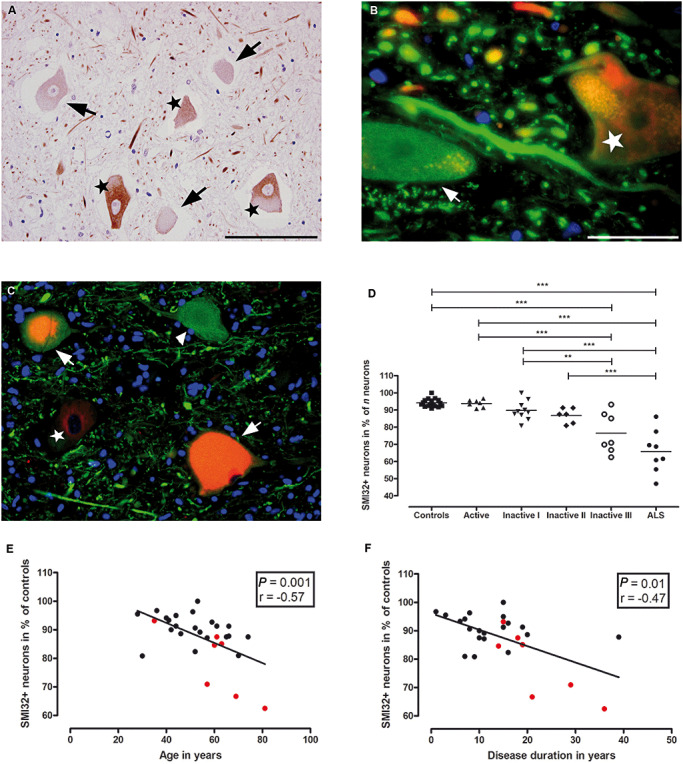
Relative reduction of SMI32+ ventral spinal neurons in MS. SMI32 IR (nonP‐NF‐H) is observed in 94.2 ± 2.3% (mean ± SD) of ventral spinal neurons in control subjects (D). However, the percentage of SMI32+ neurons (A–C: marked with stars) was significantly lower in ventral horns of sections harboring demyelinated lesions with low densities of KiM‐1P positive cells and no foam cells, presumably late‐stage lesions [A (Inactive III): SMI32+ neurons = stars, SMI32− neurons = arrows; D (**P < 0.01, ***P < 0.001)]. In B (Inactive I) and C (Active), SMI32 IR (red, stars) in neuronal cell bodies is displayed adjacent to beta‐Tubulin+ (green, arrow B) and SMI35+[green, arrowhead (hypoP‐NF‐H), C] cell bodies with absent IR for SMI32. Of note, in C, an actively demyelinating MS lesion, chromatolytic ventral horn neurons (arrows) with double IR for SMI32 (red) and SMI35 (green) are seen. The decline in the percentage of SMI32+ neurons correlated with age at death of the patients (E; P = 0.0011, r = −0.5734) and disease duration (F; P = 0.0056, r = −0.5094). In E and F, spinal cord cross sections with lesions staged Inactive III (red circles) are indicated. Of note, active lesions occur predominantly in patients with shorter disease duration, whereas late‐stage inactive lesions are more frequent in patients with longer disease duration. Scale bars: A, C: 100 µm; B: 20 µm; original magnifications: A, C: x400; B: x1000.
T cell infilteration in spinal MS lesions according to lesion stage
Parenchymal and meningeal T cell infiltration was studied with antibodies against CD3 and CD8. In line with the results obtained for macrophages/microglia, we observed the highest numbers of parenchymal as well as meningeal T cells in stages Active (parenchymal CD3+/CD8+ cells: 7.6/5.6 ± 4.3/3.4 cells/mm2, mean ± SD; meningeal CD3+/CD8+ cells: 7.7/6.4 ± 5.4/4.9 cells/mm2, mean ± SD; Figures 1I, J, Q, R, Z3 and Z4) and Inactive I (parenchymal CD3+/CD8+ cells: 4.3/2.9 ± 2.3/2 cells/mm2, mean ± SD; meningeal CD3+/CD8+ cells: 5.9/5.3 ± 3.2/3.7 cells/mm2, mean ± SD; Figures 1K, L, S, T, Z3 and Z4). Spinal specimens with lesions staged Inactive II (parenchymal CD3+/CD8+ cells: 2.6/1.8 ± 1.8/1.4 cells/mm2, mean ± SD; meningeal CD3+/CD8+ cells: 2/1.8 ± 0.9/0.8 cells/mm2, mean ± SD; Figures 1M, N, U, V, Z3 and Z4) and Inactive III (parenchymal CD3+/CD8+ cells: 2.3/1.6 ± 1.4/0.6 cells/mm2, mean ± SD; meningeal CD3+/CD8+ cells: 2.3/1.7 ± 1.8/1.1 cells/mm2, mean ± SD; Figures 1 O, P, W, X, Z3 and Z4) showed the lowest numbers of CD3+/CD8+ cells. A significant difference was only observed between Inactive I and Inactive III lesions with respect to meningeal CD8+ cells (P < 0.05) (Table 3).
Altered neurofilament phosphorylation status of neuronal cell bodies in MS spinal cord
In control spinal cord sections, large neurons, such as motor neurons, are characterized by cell bodies with an intense IR for nonphosphorylated neurofilament heavy chains (nonP‐NF‐H, SMI32; Figure 2A) (57). In MS, ventral SMI32+ and SMI32− neuronal cell bodies (Figure 2A–C) were counted on six cervical, 13 thoracic and 11 lumbar levels containing lesions of different stages (seven Active, 10 Inactive I, six Inactive II and seven Inactive III). The percentage of SMI32+ neurons was calculated and compared to 17 sections from several spinal levels from 10 control cases. We noted a decrease in the percentage of SMI32+ neurons in sections harboring late lesion stages, with the highest percentages in controls (94.18 ± 2.3%; mean ± SD) and Active sections (93.8 ± 2.2%) and the lowest in Inactive III sections (76.5 ± 11.8%; controls vs. Inactive III, P < 0.001; Figure 2D). A significant reduction in the percentage of neuronal SMI32 IR was evident between Active and Inactive III (93.8 ± 2.2% vs. 76.5 ± 11.8%; P < 0.001) and between Inactive I and Inactive III sections (89.7 ± 5.5% vs. 76.5 ± 11.8%; P < 0.01), respectively (Figure 2D; Table 3). The lowest counts for SMI32+ neurons were obtained in demyelinated, late‐stage (Inactive III) GM lesions involving the anterior horn (data not shown). In spinal sections of long‐standing ALS patients (three cervical, two thoracic, three lumbar sections), the relative reduction of SMI32+ neuronal cell bodies was on average greater than in MS (controls vs. ALS, P < 0.001; Active vs. ALS, P < 0.001; Inactive I vs. ALS, P < 0.001; Inactive II vs. ALS, P < 0.001; Figure 2D).
The reduction in the percentage of SMI32+ spinal neurons in MS was found to correlate with age at death of the patients (n = 29, P = 0.0011, r = −0.5734; Figure 2E) and disease duration (n = 28, P = 0.0119, r = −0.4684; Figure 2F). No differences in the percentage of SMI32+ neurons were observed between secondary progressive MS (SPMS) and primary progressive MS (PPMS) patients, and between females and males (data not shown).
Decline of axonal densities and neurofilament phosphorylation changes accompany lesion chronicity
In contrast to neuronal cell bodies, healthy axons display IR for SMI31 (P‐NF‐H). Axonal densities were assessed by determining the relative densities of Bielschowsky+/SMI312+/SMI31+/SMI32+ axons in 5/5/8/8 Active, 9/10/10/10 Inactive I, 5/4/6/6 Inactive II and 6/7/5/5 Inactive III spinal WM lesions (spinal levels, cervical: 6/6/6/6, thoracic: 11/10/14/14 and lumbar: 9/10/10/10; Figure 3D–F) and 8/8/8/8 ALS (three cervical, two thoracic and three lumbar sections; Figure 3G–I) spinal cords (Table 1) as percentage of axonal densities in control spinal cord sections (Figure 3A–C).
Figure 3.
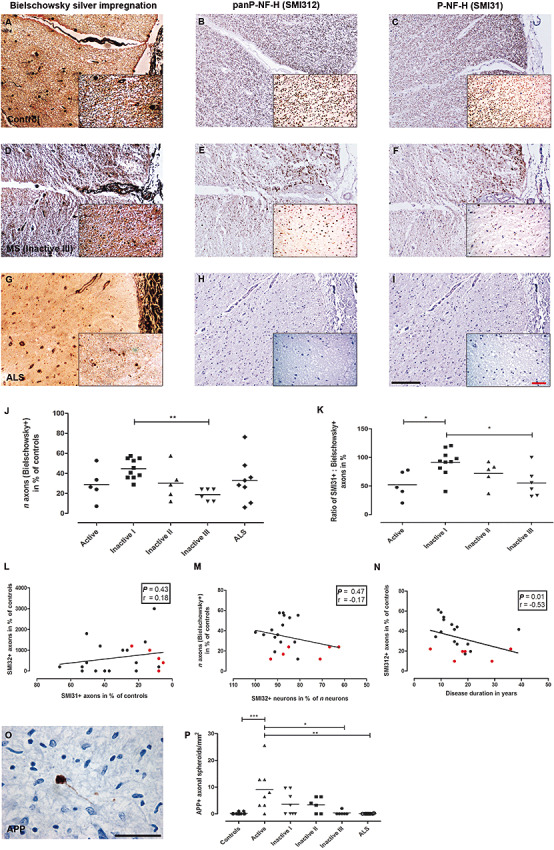
Decline of axonal densities and neurofilament phosphorylation changes in axons. Axonal densities in control (A–C), MS (Inactive III; D–F) and amyotrophic lateral sclerosis (ALS) spinal cord white matter (G–I). Axon counts were carried out on sections stained with Bielschowsky silver impregnation (A, D, G) and antibodies against panP‐NF‐H (SMI312; B, E, H) and P‐NF‐H (SMI31; C, F, I). Lowest densities of Bielschowsky+ axons were found in Inactive III lesions (D, J). Low axonal densities in Active‐staged WM lesions were predominantly due to edema and inflammatory cell infiltration [J (**P < 0.01)]. The ratio SMI31+/Bielschowsky+ revealed an overproportional loss of SMI31+ axons in relation to Bielschowsky+ axons with lowest numbers in stages Active and Inactive III[D, F, K (*P < 0.05)]. The decrease of axonal phosphorylated neurofilaments (SMI31) was not paralleled by an increase in nonphosphorylated neurofilaments (SMI32; L). Similarly, no correlation was observed between the relative loss of neuronal SMI32 IR and the loss of n axons (Bielschowsky+) in spinal cord cross sections with inactive lesions (M). However, in inactive WM lesions, the relative loss of axonal SMI312 IR was correlated with increasing disease duration (N). In L–N, spinal cord cross sections with lesions staged Inactive III (red squares) are indicated. APP+ axonal spheroids (O) were predominantly found in Active WM lesions in MS (P) compared to controls and ALS (*P < 0.05; **P < 0.01; ***P < 0.001). Scale bars: A–I (insets): 200 µm (50 µm); original magnifications: A–I: x100 (x400).
First, we analyzed the density of axons in sections stained with Bielschowsky silver impregnation compared to controls. Axonal densities were lowest in Inactive III lesions [18.78 ± 6% of control density, mean ± SD; Inactive I (44.6 ± 10.1%) vs. Inactive III; P < 0.01; Figure 3J]. MS WM lesions staged Active revealed the second lowest axonal density (28.8 ± 16.5%), most likely due to edema and cellular infiltration caused by acute inflammation (Figure 3J). More remarkably, axonal densities gradually declined with increasing lesion chronicity, ranging from Inactive I via Inactive II (30.2 ± 17.4%) to Inactive III lesions (Figure 3J; Table 3). Throughout the ventral and lateral corticospinal tracts of ALS cases from different spinal levels (Table 1), numbers were in the range of MS WM lesions staged Inactive II (33 ± 22.1% of control density, mean ± SD; Figure 3J). Similarly, immunostaining for phosphorylated neurofilaments also revealed significant differences in the relative axonal densities of SMI312 (panP‐NF‐H) and SMI31 (P‐NF‐H) IR between WM lesions staged Inactive I vs. Inactive III (SMI312: 44.1 ± 9.9% vs. 17.5 ± 5.4%; P < 0.01; SMI31: 40.74 ± 14.3% vs. 10.7 ± 7.15%; P < 0.01). Comparing the different staining techniques, we found the highest numbers of axons impregnated with Bielschowsky's technique and incubated with antibodies against panP‐NF‐H (SMI312). The decrease in axonal densities was more pronounced in SMI31− stained sections compared to Bielschowsky silver impregnation and SMI312 immunohistochemistry [ratio of SMI31+ axons to Bielschowsky+ axons (Inactive I vs. Inactive III): 91.4 ± 23% (mean ± SD) vs. 55.3 ± 25.6%; P < 0.05; Figure 3K]. Besides Inactive III staged lesions, the lowest SMI31/Bielschowsky ratios were found in Active lesions [52 ± 24.08%; (Active vs. Inactive I) P < 0.05; Figure 3K, Table 3].
With respect to nonP‐NF‐H, we detected a 5‐ to 10‐fold increase in SMI32+ axonal density in WM lesions throughout all lesion stages compared to control WM. Loss of SMI31+ axons was not paralleled by an increase in axonal SMI32 IR (n = 21, P = 0.4302, r = 0.1818; Figure 3L). Also, the reduction in SMI32+ neuronal cell bodies did not correlate with axonal density as determined by Bielschowsky silver impregnation (n = 21, P = 0.4669, r = −0.1679; Figure 3M). However, the loss of SMI312+ axons in Inactive I–III lesions correlated with the disease duration (Bielschowsky+/SMI312+/SMI31+: disease duration: n = 21/21/21, P = 0.0779/0.0139/0.0988, r = −0.3931/−0.5277/−0.3700; Figure 3N) but not with the age of the patients (n = 21/21/21, P = 0.5546/0.5462/0.5745, r = −0.1367/−0.1396/−0.13).
Acute axonal damage is a feature of early spinal MS lesions
The number of APP+ axonal spheroids was assessed as an indicator for interruption of axonal transport in MS WM spinal cord lesions 18, 31 (Figure 3O). Highest numbers were detected in Active lesions (9 ± 8.1 APP+ profiles/mm2) compared to controls (0.1 ± 0.3 APP+ profiles/mm2; P < 0.001), dropping gradually toward lesions graded Inactive III (0.3 ± 0.8 APP+ profiles/mm2; Active vs. Inactive III; P < 0.05; Figure 3P; Table 3) and spinal sections (corticospinal tracts) from ALS patients (0.03 ± 0.1 APP+ profiles/mm2; Active vs. ALS; P < 0.01 Figure 3P).
DISCUSSION
Although already suggested by Charcot in his early description of the disease (11), recent years brought firm evidence that the severity of the persistent clinical disability correlates best with the loss of neural tissue 13, 14, 54. Correspondingly, brain and spinal cord atrophy have proven good correlates of disease progression (41). It is now widely recognized that a variable degree of neuroaxonal damage and loss accompanies acute lesion formation 31, 48. However, the pathological substrates contributing to disease progression remain unclear so far.
In the present study, we examined MS spinal cord tissue of 31 MS patients, the majority with chronic progressive disease. Late‐stage spinal lesions were classified according to macrophage/microglia density, and thus roughly with regard to lesion chronicity. Reactions of neurons and axons in early and late stages of inflammatory demyelination were studied. In comparison, we examined autoptic spinal cord tissue from long‐standing ALS patients with pronounced motor neuron and tract degeneration. The underlying hypothesis was that “secondary” neurodegenerative phenomena, as found in MS, could possibly resemble those observed in ALS.
Extent and distribution of inflammation in chronic MS lesions
Many approaches have been made to stage MS lesions according to the extent and chronicity of inflammation and demyelination, mostly focusing on active plaques with ongoing demyelination 8, 20, 26, 37. Conversely, only little information is available about the distribution of inflammatory cells in chronic inactive lesions (19). For this study, we established a classification system for inactive lesions based on the density of KiM‐1P+ foamy cells and cells with ramified morphology (Table 3). We found that the decrease in KiM‐1P+ foamy cell density correlated with the disease duration. Moreover, we identified that the strongest decline in axonal densities—apart from active WM lesions biased by inflammation and edema—and neurofilament phosphorylation changes in both neuronal cell bodies and axons occurred in the most advanced late stage.
In addition, we analyzed the numbers and distribution of CD3+ and CD8+ T cells throughout the entire spinal sections and the meninges. T cells were either concentrated in perivascular cuffs or diffusely spread in both the demyelinated plaque and the normal appearing WM and GM. In accordance with a recent study by Frischer et al, we found the highest T cell numbers in active lesions (19). CD3+ and CD8+ cells did not differ significantly in their numbers and distribution in active and inactive lesions. However, T cells were scarce in lesions staged Inactive II and III.
Alterations in cytoplasmic neurofilament phosphorylation accompany disease progression in MS
We observed a decrease of about 17% in the proportion of SMI32 (nonP‐NF‐H) immunoreactive neurons in spinal cord cross sections harboring WM lesions with very low macrophage/microglia densities, thus presumably late‐stage lesions, compared to controls (Table 3). Loss of SMI32 IR in ventral spinal neurons was mostly seen in lesions involving the anterior horn of the spinal GM. In addition, 5/7 Inactive III lesions involved the anterior horn. Thus, long‐standing demyelination of both WM and GM may precipitate the loss of neuronal SMI32 IR (24). Recently, a transient reduction in SMI32+ spinal neurons was reported in animals with EAE (2). In contrast to these experimental findings, the reduction in neuronal SMI32 IR in the human disease apparently is not a transient but rather a persistent feature. Accordingly, the proportion of SMI32+ neuronal cell bodies decreased with lesion age, disease duration and patient age at death. Our age‐matched control group did not show a loss of neuronal SMI32 IR 46, 58.
We recently reported that the total number of ventral spinal neurons in MS is reduced by around 20% throughout all lesion stages and does not progress with disease duration (Table 3) (48). Thus, the majority of neuronal loss presumably occurs early and does not correlate with the progressive loss of neuronal cytoplasmic SMI32 IR.
Neurons can lose their physiological IR for nonP‐NF‐H subunits under a number of pathological circumstances, such as motor neuron disease (MND, ALS), Parkinson's and Alzheimer's disease 10, 21, 38. In MS, the direct influence of local inflammatory demyelination may induce a loss of SMI32 IR in spinal cord neurons. Alternatively, axonal degeneration and a loss of synaptic input might be causative. Interestingly, in contrast to the “acute loss” of SMI32 in, for example, chromatolytic neurons, the loss of neuronal SMI32 IR in MS spinal cord tissue was not paralleled by a gain in IR for SMI31, a marker for increased phosphorylation of NF‐H subunits (53). NF‐H hyperphosphorylation was rather found in acute lesion stages in relation to retrograde neuronal degeneration and in experimental studies showing declining phosphatase activities in aging mice 48, 58.
Axonal loss and neurofilament dephosphorylation are progressive features in chronic lesions and related to disease duration and severity
In accordance with previous studies on axonal damage and neuronal loss in actively demyelinating MS lesions, we indeed found a significant number of APP+ axonal spheroids, indicative of axonal transport disturbances and axonal transections, in early WM lesions. In addition, however, axonal counts revealed a progressive decrease of axons in spinal WM MS lesions with decreasing macrophage/microglia density. Axonal densities measured by SMI312 IR and Bielschowsky silver impregnation gradually dropped from the Inactive I stage of lesion development (loss of approximately 55% of axons) to Inactive III lesions with a dramatic reduction of approximately 80% compared to controls (Table 3). This strong reduction was predominantly found in patients with advanced age and correlated with the disease duration of the patients. Thus, the progressive axonal loss in inactive WM lesions reflects both lesion chronicity and disease progression. Extensive reductions of axons in spinal MS lesions have been described earlier and were recently related to clinical findings 5, 22, 36, 54. Hence, our data point toward a chronic and progressive loss of axons over time that may contribute to the cumulative and irreversible disability of MS patients 6, 7, 40. Interestingly, the loss of SMI31+ axons in both acute and late inactive WM lesions was more severe than that detected by Bielschowsky silver impregnation and IR for SMI312, indicating that not only a total loss of axons but a selective loss of phosphorylated axonal neurofilaments took place. Similarly to the selective loss of neuronal SMI32 in MS spinal cord, the axonal reduction in SMI31 (P‐NF‐H) IR was not paralleled by a shift toward IR for unphosphorylated NF‐H (SMI32). However, we observed a remarkable 5‐ to 10‐fold increase in SMI32+ axons in WM lesions throughout all lesion stages in accordance to recent findings in EAE (27).
The observed loss of axons may be due to the local lesion formation as well as antero‐ and retrograde degeneration caused by distant lesions on multiple spinal levels. Accordingly, with time, compensatory pathways established by previous regenerative efforts may be lost 29, 48. In addition, an interruption of descending pathways with the resulting loss of synaptic inputs may lead to further damage and functional disturbance of spinal neurons (62). Axonal neurofilament dephosphorylation seems to be a feature predominantly in acute and late, inactive lesion stages. The observed selective axonal loss of phosphorylated neurofilaments (SMI31) may be due to both metabolic disturbances and—particularly in respect to the late stages—the chronic long‐standing demyelination. Mitochondrial changes have recently been described in acute and chronic MS lesions and were linked to neurofilament phosphorylation particularly in chronic lesions 30, 39, 40. In addition, signs of increased glutamate production leading to metabolic disturbances have been described in MS (63), and α‐amino‐3‐hydroxy‐5‐methyl‐4‐isoxazole‐propionic acid (AMPA) receptor antagonists have been shown to ameliorate symptoms and to reduce axonal damage in EAE 45, 51.
Loss of neuronal SMI32 and corticospinal tract degeneration are features of spinal ALS
In ALS, a paradigmatic motor neuron disease (MND), damage to and loss of spinal ventral horn neurons is a known and widely described feature 28, 48. In our ALS sample, the loss of nonphosphorylated neurofilaments in ventral horn neurons (around 30% of SMI32+ neuronal cell bodies) exceeded that observed in MS throughout all lesion stages. Similarly, this loss of neuronal SMI32 was not paralleled by an accumulation of phosphorylated neurofilaments in the somata. Neurofilament alterations are well documented in ALS and have been linked to chronic mitochondrial changes and detrimental effects of excitotoxicity(61).
CONCLUSION
In the present study, we provide evidence for a significant and progressive reduction of SMI32 IR in ventral spinal neurons. Furthermore, we detected a progressive axonal demise in chronic MS lesions that correlated with the disease duration of the patients. Moreover, in acute and late inactive lesions, a selective loss of axonal SMI31 was found. We propose that changes in neuronal metabolism, such as altered neurofilament phosphorylation occurring in the context of a chronic inflammatory demyelinating process, may result in cumulative neuronal dysfunction and axonal demise over time and serve as a putative substrate of clinical progression.
FUNDING
This work was in part supported by the Deutsche Forschungsgemeinschaft (DFG) transregional collaborative research center 43 “The brain as a target of inflammatory processes” and the Foundation of the Multiple Sclerosis Society of Canada. LS was supported by the DFG (GRK 632 “Neuroplasticity”).
ACKNOWLEDGMENTS
The authors wish to thank Brigitte Maruschak, Jasmin Held, Katja Schulz and Tatjana Pfander for expert technical assistance. ALS spinal cord tissue was kindly provided by Walter Schulz‐Schaeffer, MD.
Statement of conflict of interest: The authors do not report any conflict of interest.
REFERENCES
- 1. Agosta F, Absinta M, Sormani MP, Ghezzi A, Bertolotto A, Montanari E et al (2007) In vivo assessment of cervical cord damage in MS patients: a longitudinal diffusion tensor MRI study. Brain 130:2211–2219. [DOI] [PubMed] [Google Scholar]
- 2. Bannerman PG, Hahn A, Ramirez S, Morley M, Bonnemann C, Yu S et al (2005) Motor neuron pathology in experimental autoimmune encephalomyelitis: studies in THY1‐YFP transgenic mice. Brain 128:1877–1886. [DOI] [PubMed] [Google Scholar]
- 3. Barnett MH, Henderson AP, Prineas JW (2006) The macrophage in MS: just a scavenger after all? Pathology and pathogenesis of the acute MS lesion. Mult Scler 12:121–132. [DOI] [PubMed] [Google Scholar]
- 4. Bitsch A, Schuchardt J, Bunkowski S, Kuhlmann T, Bruck W (2000) Acute axonal injury in multiple sclerosis. Correlation with demyelination and inflammation. Brain 123(Pt 6):1174–1183. [DOI] [PubMed] [Google Scholar]
- 5. Bjartmar C, Kidd G, Mork S, Rudick R, Trapp BD (2000) Neurological disability correlates with spinal cord axonal loss and reduced N‐acetyl aspartate in chronic multiple sclerosis patients. Ann Neurol 48:893–901. [PubMed] [Google Scholar]
- 6. Bjartmar C, Wujek JR, Trapp BD (2003) Axonal loss in the pathology of MS: consequences for understanding the progressive phase of the disease. J Neurol Sci 206:165–171. [DOI] [PubMed] [Google Scholar]
- 7. Black JA, Newcombe J, Trapp BD, Waxman SG (2007) Sodium channel expression within chronic multiple sclerosis plaques. J Neuropathol Exp Neurol 66:828–837. [DOI] [PubMed] [Google Scholar]
- 8. Bruck W (2005) The pathology of multiple sclerosis is the result of focal inflammatory demyelination with axonal damage. J Neurol 252(Suppl. 5):v3–v9. [DOI] [PubMed] [Google Scholar]
- 9. Bruck W, Porada P, Poser S, Rieckmann P, Hanefeld F, Kretzschmar HA et al (1995) Monocyte/macrophage differentiation in early multiple sclerosis lesions. Ann Neurol 38:788–796. [DOI] [PubMed] [Google Scholar]
- 10. Bussiere T, Giannakopoulos P, Bouras C, Perl DP, Morrison JH, Hof PR (2003) Progressive degeneration of nonphosphorylated neurofilament protein‐enriched pyramidal neurons predicts cognitive impairment in Alzheimer's disease: stereologic analysis of prefrontal cortex area 9. J Comp Neurol 463:281–302. [DOI] [PubMed] [Google Scholar]
- 11. Charcot JM (1868) Histologie de la sclérose en plaque. Gaz Hop Civils Militaires 41:554–555, 557–558, 566. [Google Scholar]
- 12. Cifelli A, Arridge M, Jezzard P, Esiri MM, Palace J, Matthews PM (2002) Thalamic neurodegeneration in multiple sclerosis. Ann Neurol 52:650–653. [DOI] [PubMed] [Google Scholar]
- 13. Davie CA, Barker GJ, Webb S, Tofts PS, Thompson AJ, Harding AE et al (1995) Persistent functional deficit in multiple sclerosis and autosomal dominant cerebellar ataxia is associated with axon loss. Brain 118(Pt 6):1583–1592. [DOI] [PubMed] [Google Scholar]
- 14. De Stefano N, Matthews PM, Fu L, Narayanan S, Stanley J, Francis GS et al (1998) Axonal damage correlates with disability in patients with relapsing‐remitting multiple sclerosis. Results of a longitudinal magnetic resonance spectroscopy study. Brain 121(Pt 8):1469–1477. [DOI] [PubMed] [Google Scholar]
- 15. DeLuca GC, Williams K, Evangelou N, Ebers GC, Esiri MM (2006) The contribution of demyelination to axonal loss in multiple sclerosis. Brain 129:1507–1516. [DOI] [PubMed] [Google Scholar]
- 16. Dutta R, McDonough J, Yin X, Peterson J, Chang A, Torres T et al (2006) Mitochondrial dysfunction as a cause of axonal degeneration in multiple sclerosis patients. Ann Neurol 59:478–489. [DOI] [PubMed] [Google Scholar]
- 17. Evangelou N, DeLuca GC, Owens T, Esiri MM (2005) Pathological study of spinal cord atrophy in multiple sclerosis suggests limited role of local lesions. Brain 128:29–34. [DOI] [PubMed] [Google Scholar]
- 18. Ferguson B, Matyszak MK, Esiri MM, Perry VH (1997) Axonal damage in acute multiple sclerosis lesions. Brain 120(Pt 3):393–399. [DOI] [PubMed] [Google Scholar]
- 19. Frischer JM, Bramow S, Dal‐Bianco A, Lucchinetti CF, Rauschka H, Schmidbauer M et al (2009) The relation between inflammation and neurodegeneration in multiple sclerosis brains. Brain 132:1175–1189. [DOI] [PMC free article] [PubMed] [Google Scholar]
- 20. Frohman EM, Racke MK, Raine CS (2006) Multiple sclerosis—the plaque and its pathogenesis. N Engl J Med 354:942–955. [DOI] [PubMed] [Google Scholar]
- 21. Gai WP, Vickers JC, Blumbergs PC, Blessing WW (1994) Loss of non‐phosphorylated neurofilament immunoreactivity, with preservation of tyrosine hydroxylase, in surviving substantia nigra neurons in Parkinson's disease. J Neurol Neurosurg Psychiatry 57:1039–1046. [DOI] [PMC free article] [PubMed] [Google Scholar]
- 22. Ganter P, Prince C, Esiri MM (1999) Spinal cord axonal loss in multiple sclerosis: a post‐mortem study. Neuropathol Appl Neurobiol 25:459–467. [DOI] [PubMed] [Google Scholar]
- 23. Gilmore CP, DeLuca GC, Bo L, Owens T, Lowe J, Esiri MM et al (2005) Spinal cord atrophy in multiple sclerosis caused by white matter volume loss. Arch Neurol 62:1859–1862. [DOI] [PubMed] [Google Scholar]
- 24. Gilmore CP, Bo L, Owens T, Lowe J, Esiri MM, Evangelou N (2006) Spinal cord gray matter demyelination in multiple sclerosis—a novel pattern of residual plaque morphology. Brain Pathol 16:202–208. [DOI] [PMC free article] [PubMed] [Google Scholar]
- 25. Gilmore CP, DeLuca GC, Bo L, Owens T, Lowe J, Esiri MM et al (2009) Spinal cord neuronal pathology in multiple sclerosis. Brain Pathol 19:642–649. [DOI] [PMC free article] [PubMed] [Google Scholar]
- 26. Henderson AP, Barnett MH, Parratt JD, Prineas JW (2009) Multiple sclerosis: distribution of inflammatory cells in newly forming lesions. Ann Neurol 66:739–753. [DOI] [PubMed] [Google Scholar]
- 27. Herrero‐Herranz E, Pardo LA, Gold R, Linker RA (2008) Pattern of axonal injury in murine myelin oligodendrocyte glycoprotein induced experimental autoimmune encephalomyelitis: implications for multiple sclerosis. Neurobiol Dis 30:162–173. [DOI] [PubMed] [Google Scholar]
- 28. Kato S (2008) Amyotrophic lateral sclerosis models and human neuropathology: similarities and differences. Acta Neuropathol 115:97–114. [DOI] [PubMed] [Google Scholar]
- 29. Kerschensteiner M, Bareyre FM, Buddeberg BS, Merkler D, Stadelmann C, Bruck W et al (2004) Remodeling of axonal connections contributes to recovery in an animal model of multiple sclerosis. J Exp Med 200:1027–1038. [DOI] [PMC free article] [PubMed] [Google Scholar]
- 30. Kim JY, Shen S, Dietz K, He Y, Howell O, Reynolds R et al (2010) HDAC1 nuclear export induced by pathological conditions is essential for the onset of axonal damage. Nat Neurosci 13:180–189. [DOI] [PMC free article] [PubMed] [Google Scholar]
- 31. Kuhlmann T, Lingfeld G, Bitsch A, Schuchardt J, Bruck W (2002) Acute axonal damage in multiple sclerosis is most extensive in early disease stages and decreases over time. Brain 125:2202–2212. [DOI] [PubMed] [Google Scholar]
- 32. Kurtzke JF (1983) Rating neurologic impairment in multiple sclerosis: an expanded disability status scale (EDSS). Neurology 33:1444–1452. [DOI] [PubMed] [Google Scholar]
- 33. Kutzelnigg A, Lucchinetti CF, Stadelmann C, Bruck W, Rauschka H, Bergmann M et al (2005) Cortical demyelination and diffuse white matter injury in multiple sclerosis. Brain 128:2705–2712. [DOI] [PubMed] [Google Scholar]
- 34. Lariviere RC, Julien JP (2004) Functions of intermediate filaments in neuronal development and disease. J Neurobiol 58:131–148. [DOI] [PubMed] [Google Scholar]
- 35. Losseff NA, Webb SL, O'Riordan JI, Page R, Wang L, Barker GJ et al (1996) Spinal cord atrophy and disability in multiple sclerosis. A new reproducible and sensitive MRI method with potential to monitor disease progression. Brain 119(Pt 3):701–708. [DOI] [PubMed] [Google Scholar]
- 36. Lovas G, Szilagyi N, Majtenyi K, Palkovits M, Komoly S (2000) Axonal changes in chronic demyelinated cervical spinal cord plaques. Brain 123(Pt 2):308–317. [DOI] [PubMed] [Google Scholar]
- 37. Lucchinetti C, Bruck W, Parisi J, Scheithauer B, Rodriguez M, Lassmann H (2000) Heterogeneity of multiple sclerosis lesions: implications for the pathogenesis of demyelination. Ann Neurol 47:707–717. [DOI] [PubMed] [Google Scholar]
- 38. Maekawa S, Al‐Sarraj S, Kibble M, Landau S, Parnavelas J, Cotter D et al (2004) Cortical selective vulnerability in motor neuron disease: a morphometric study. Brain 127:1237–1251. [DOI] [PubMed] [Google Scholar]
- 39. Mahad D, Ziabreva I, Lassmann H, Turnbull D (2008) Mitochondrial defects in acute multiple sclerosis lesions. Brain 131:1722–1735. [DOI] [PMC free article] [PubMed] [Google Scholar]
- 40. Mahad DJ, Ziabreva I, Campbell G, Lax N, White K, Hanson PS et al (2009) Mitochondrial changes within axons in multiple sclerosis. Brain 132:1161–1174. [DOI] [PMC free article] [PubMed] [Google Scholar]
- 41. Miller DH, Barkhof F, Frank JA, Parker GJ, Thompson AJ (2002) Measurement of atrophy in multiple sclerosis: pathological basis, methodological aspects and clinical relevance. Brain 125:1676–1695. [DOI] [PubMed] [Google Scholar]
- 42. Nieuwenhuys R, Voogd J, van Huijzen C (2008) The Human Central Nervous System, 4th edn. Springer: Berlin, Heidelberg, New York. [Google Scholar]
- 43. Papadopoulos D, Dukes S, Patel R, Nicholas R, Vora A, Reynolds R (2009) Substantial archaeocortical atrophy and neuronal loss in multiple sclerosis. Brain Pathol 19:238–253. [DOI] [PMC free article] [PubMed] [Google Scholar]
- 44. Petzold A, Gveric D, Groves M, Schmierer K, Grant D, Chapman M et al (2008) Phosphorylation and compactness of neurofilaments in multiple sclerosis: indicators of axonal pathology. Exp Neurol 213:326–335. [DOI] [PMC free article] [PubMed] [Google Scholar]
- 45. Pitt D, Werner P, Raine CS (2000) Glutamate excitotoxicity in a model of multiple sclerosis. Nat Med 6:67–70. [DOI] [PubMed] [Google Scholar]
- 46. Portiansky EL, Barbeito CG, Gimeno EJ, Zuccolilli GO, Goya RG (2006) Loss of NeuN immunoreactivity in rat spinal cord neurons during aging. Exp Neurol 202:519–521. [DOI] [PubMed] [Google Scholar]
- 47. Radzun HJ, Hansmann ML, Heidebrecht HJ, Bodewadt‐Radzun S, Wacker HH, Kreipe H et al (1991) Detection of a monocyte/macrophage differentiation antigen in routinely processed paraffin‐embedded tissues by monoclonal antibody Ki‐M1P. Lab Invest 65:306–315. [PubMed] [Google Scholar]
- 48. Schirmer L, Albert M, Buss A, Schulz‐Schaeffer WJ, Antel JP, Bruck W et al (2009) Substantial early, but nonprogressive neuronal loss in multiple sclerosis (MS) spinal cord. Ann Neurol 66:698–704. [DOI] [PubMed] [Google Scholar]
- 49. Shea TB, Jung C, Pant HC (2003) Does neurofilament phosphorylation regulate axonal transport. Trends Neurosci 26:397–400. [DOI] [PubMed] [Google Scholar]
- 50. Siffrin V, Vogt J, Radbruch H, Nitsch R, Zipp F (2010) Multiple sclerosis—candidate mechanisms underlying CNS atrophy. Trends Neurosci 33:202–210. [DOI] [PubMed] [Google Scholar]
- 51. Smith T, Groom A, Zhu B, Turski L (2000) Autoimmune encephalomyelitis ameliorated by AMPA antagonists. Nat Med 6:62–66. [DOI] [PubMed] [Google Scholar]
- 52. Stadelmann C, Kerschensteiner M, Misgeld T, Bruck W, Hohlfeld R, Lassmann H (2002) BDNF and gp145trkB in multiple sclerosis brain lesions: neuroprotective interactions between immune and neuronal cells. Brain 125:75–85. [DOI] [PubMed] [Google Scholar]
- 53. Sternberger LA, Sternberger NH (1983) Monoclonal antibodies distinguish phosphorylated and nonphosphorylated forms of neurofilaments in situ . Proc Natl Acad Sci U S A 80:6126–6130. [DOI] [PMC free article] [PubMed] [Google Scholar]
- 54. Tallantyre EC, Bo L, Al‐Rawashdeh O, Owens T, Polman CH, Lowe J et al (2009) Greater loss of axons in primary progressive multiple sclerosis plaques compared to secondary progressive disease. Brain 132:1190–1199. [DOI] [PubMed] [Google Scholar]
- 55. Tallantyre EC, Bo L, Al‐Rawashdeh O, Owens T, Polman CH, Lowe JS et al (2010) Clinico‐pathological evidence that axonal loss underlies disability in progressive multiple sclerosis. Mult Scler 16:406–411. [DOI] [PubMed] [Google Scholar]
- 56. Trapp BD, Peterson J, Ransohoff RM, Rudick R, Mork S, Bo L (1998) Axonal transection in the lesions of multiple sclerosis. N Engl J Med 338:278–285. [DOI] [PubMed] [Google Scholar]
- 57. Tsang YM, Chiong F, Kuznetsov D, Kasarskis E, Geula C (2000) Motor neurons are rich in non‐phosphorylated neurofilaments: cross‐species comparison and alterations in ALS. Brain Res 861:45–58. [DOI] [PubMed] [Google Scholar]
- 58. Veeranna, Yang DS, Lee JH, Vinod KY, Stavrides P, Amin ND et al (2009) Declining phosphatases underlie aging‐related hyperphosphorylation of neurofilaments. Neurobiol Aging (in press) doi:10.1016/j.neurobiolaging.2009.12.001. [DOI] [PMC free article] [PubMed] [Google Scholar]
- 59. Vercellino M, Plano F, Votta B, Mutani R, Giordana MT, Cavalla P (2005) Grey matter pathology in multiple sclerosis. J Neuropathol Exp Neurol 64:1101–1107. [DOI] [PubMed] [Google Scholar]
- 60. Vogt J, Paul F, Aktas O, Muller‐Wielsch K, Dorr J, Dorr S et al (2009) Lower motor neuron loss in multiple sclerosis and experimental autoimmune encephalomyelitis. Ann Neurol 66:310–322. [DOI] [PubMed] [Google Scholar]
- 61. Wagner OI, Lifshitz J, Janmey PA, Linden M, McIntosh TK, Leterrier JF (2003) Mechanisms of mitochondria‐neurofilament interactions. J Neurosci 23:9046–9058. [DOI] [PMC free article] [PubMed] [Google Scholar]
- 62. Wegner C, Esiri MM, Chance SA, Palace J, Matthews PM (2006) Neocortical neuronal, synaptic, and glial loss in multiple sclerosis. Neurology 67:960–967. [DOI] [PubMed] [Google Scholar]
- 63. Werner P, Pitt D, Raine CS (2001) Multiple sclerosis: altered glutamate homeostasis in lesions correlates with oligodendrocyte and axonal damage. Ann Neurol 50:169–180. [DOI] [PubMed] [Google Scholar]