

Abstract
Multiple Sclerosis (MS) is a neuroinflammatory disease mainly affecting young adults. A major pathological hallmark of MS is the presence of demyelinated lesions in the central nervous system. In the active phase of the disease, astrocytes become activated, migrate and contribute to local tissue remodeling that ultimately can result in an astroglial scar. This process is facilitated by extracellular matrix proteins, including fibronectin. Tissue Transglutaminase (TG2) is a multifunctional enzyme with a ubiquitous tissue distribution and it has been shown that inflammatory cytokines can induce TG2 activity. In addition, TG2 is known to mediate cell adhesion and migration. We therefore hypothesized that TG2 is present in MS lesions and plays a role in cell adhesion and/or migration. Our studies showed that TG2 immunoreactivity appeared in astrocytes in active and chronic active MS lesions. These TG2 positive astrocytes partly co‐localized with fibronectin. Additional in vitro studies showed that TG2 mediated astrocytoma adhesion to and migration on the extracellular matrix protein fibronectin. We therefore speculate that TG2 mediates the enhanced interaction of astrocytes with fibronectin in the extracellular matrix of MS lesions, thereby contributing to astrocyte adhesion and migration, and thus in tissue remodeling and possibly glial scarring.
Keywords: astrocytes, fibronectin, Multiple Sclerosis, tissue Transglutaminase
INTRODUCTION
Multiple Sclerosis (MS) is a neurological disease affecting mainly young adults. The patients suffer from loss of motor and sensory function, and even cognitive decline can be observed (15). A major pathological hallmark of MS is the presence of demyelinated lesions throughout the central nervous system (CNS) (24). During lesion development, immune cells infiltrate the CNS and, in parallel to inflammatory processes, local astrocytes become activated, migrate and eventually form a dense network of hypertrophic cells, the astroglial scar 18, 54. This reactivity of astrocytes is accompanied by changes in expression of, for example, adhesion molecules, cytokines, proteoglycans and proteases, thereby creating an environment that may impede tissue repair 31, 41, 42. Concomitantly, infiltrating leukocytes, astrocytes and endothelial cells are producers of extracellular matrix (ECM) proteins in MS lesions 46, 49, 51. These ECM molecules were shown to be involved in tissue remodeling during, for example, tissue repair (36). Excessive deposition of ECM proteins, including fibronectin (Fn), and their interaction with local cells, can be considered an important factor in the non‐permissive nature for repair of CNS lesions in MS patients 27, 40, 51.
Tissue Transglutaminase (TG2) is a ubiquitously expressed member of the family of transglutaminase enzymes. Although its complete functional role remains to be fully established, TG2 is well known for its ability to post‐translationally modify proteins in a calcium‐dependent manner. TG2 can cross‐link proteins, amidate or deamidate proteins, it can bind and hydrolyze GTP to mediate cell signaling, and it has isopeptidase activity (51). Of all TG isoforms, TG2 is expressed most clearly within the CNS (20), where it has been shown to be expressed in neurons 30, 48. Aggregation of huntingtin or α‐synuclein in the CNS of Huntington's or Parkinson's patients, respectively, has been ascribed to the protein cross‐linking activity of TG2 22, 25. In addition, a prominent role for TG2 in cell adhesion and migration has been put forward 1, 45. It has been shown that TG2 interacts with β‐integrins to enhance the affinity of these cell‐associated adhesion receptors for Fn (3). Indeed, TG2 has a Fn binding site located in its N‐terminal domain (16). Besides its interaction with Fn to stimulate cell adhesion, TG2 is involved in numerous other adhesion‐dependent phenomena, including cell migration, ECM assembly and cell signaling (53). Cell adhesion and migration requires cytoskeletal reorganization and focal adhesion dissolution 38, 39 which is coordinated by Rho GTPases (32). These processes can be influenced by TG2, as it has been shown that TG2 activates Rho GTPases (37).
In parallel with ECM protein production and deposition, various inflammatory mediators, including pro‐inflammatory cytokines, are produced in MS lesions 7, 8, 19. In vitro studies showed that the pro‐inflammatory cytokines tumor necrosis factor‐alpha (TNF‐α), interleukin‐1 (IL‐1) and interleukin‐6 (IL‐6) are able to increase cellular TG2 levels 23, 28. All together, various ingredients are present in MS lesions, that is, infiltrating and migrating immune cells, hypertrophic astrocytes, inflammatory cytokines and a disturbed ECM, on which we base our hypothesis that TG2 may be present in MS lesions and could play a role in cell adhesion and/or migration processes. By using well‐characterized human post‐mortem material containing various stages of MS lesions, we studied the presence of TG2 in MS lesions compared to that in control subjects. Because TG2 was clearly expressed by astrocytes, we subsequently used a human astrocytoma cell‐line to further determine whether TG2 mediates the interaction between astrocytes and Fn, a prominent ECM protein present in MS lesions (51).
MATERIALS AND METHODS
Human brain material
Sub‐cortical white matter from 14 patients with clinically diagnosed and neuropathologically confirmed MS was obtained at rapid autopsy and immediately frozen in liquid nitrogen (in collaboration with the Netherlands Brain Bank, coordinator Dr. I. Huitinga). Five subjects without neurological disease were incorporated as controls. White matter MS tissue samples were selected using post‐mortem magnetic resonance imaging, as published previously 10, 13. The age of the patients included in this study ranged from 52 to 80 years and the age of control subjects ranged from 52 to 88 years. Additional relevant information were retrieved from the medical records and summarized in Table 1. All patients and control subjects had given informed consent for autopsy and use of their brain tissue for research purposes.
Table 1.
Summary of MS patient details. Abbreviations: MS = multiple sclerosis; PMD = post‐mortem delay; NR = not relevant.
| Age | Gender | Type of MS lesion | Disease duration (years) | PMD (hours) | Cause of death |
|---|---|---|---|---|---|
| 78 | female | control | NR | 6:30 | decompensatio cordis |
| 82 | male | control | NR | 12:00 | heart failure |
| 81 | male | control | NR | 6:40 | euthanasia |
| 52 | female | control | NR | 6:00 | leiomyosarcoom |
| 88 | female | control | NR | 6:15 | aging |
| 52 | female | active | 13 | 8:25 | respiratory insufficience/pneumonia |
| 53 | female | active | 27 | 8:30 | euthanasia |
| 70 | male | active | unknown | 6:25 | unknown |
| 69 | female | active | 26 | 13:20 | viral infection |
| 76 | female | active | 53 | 14:15 | respiratory insufficience/pneumonia |
| 65 | male | chronic active | 21 | 6:38 | urosepsis |
| 57 | female | chronic active | 19 | 5:45 | sepsis |
| 72 | female | chronic active | 13 | 12:00 | pneumonia |
| 77 | male | chronic active | 26 | 4:15 | cerebrovascular accident |
| 66 | female | chronic active | 43 | 6:20 | liver failure caused by metastases |
| 72 | male | inactive | 44 | 8:30 | unknown |
| 64 | female | inactive | 25 | 7:45 | dehydration and pneumonia |
| 80 | female | inactive | 59 | 9:35 | acute leukemia |
| 75 | female | inactive | 42 | 8:00 | pneumonia |
Lesion classification
Classification of white matter lesions was based on standard histopathological stainings for myelin‐specific proteolipid protein (PLP) and inflammatory cells (LN3: anti‐major histocompatibility complex class II) as described before 9, 47, 50. Active lesions were characterized by abundant phagocytic, perivascular and parenchymal macrophage infiltration throughout the lesion area and ongoing demyelination, whereas chronic active lesions have a demyelinated gliotic center with a hypercellular rim containing macrophages. Inactive lesions have few infiltrating inflammatory cells throughout the lesion.
Immunohistochemistry
Cryosections (6 µm) were air‐dried and fixed in acetone for 10 minutes (min) (PLP, LN3) or in 4% paraformaldehyde (PFA) in 0.1 M phosphate buffer (pH 7.6) for 10 minutes (TG2). Subsequently, the sections were preincubated for 15 minutes with 2% normal donkey serum in Tris‐buffered saline (TBS) containing 0.5% Triton‐X100. Thereafter, sections were incubated overnight (o/n) at room temperature (RT) with one of the following primary antibodies: mouse anti‐PLP (Serotec, Oxford, UK; 1:1000), mouse anti‐MHC class II (HLA‐DR clone LN3, Labvision, Fremont, USA; 1:100), mouse anti‐TG2 (Ab3, Labvision, 1:250) or goat anti‐TG2 (Upstate, Charlottesville, USA; 1:3000). After washes in TBS, the sections were incubated for 2 hours (h) at RT with the following appropriate secondary antibodies: biotinylated donkey anti‐mouse IgG or biotinylated donkey anti‐goat IgG (Jackson Laboratories, Suffolk, UK; 1:400). Following washes in TBS, sections were incubated for another 60 minutes at RT with ABC‐HRP complex (Vectastain; Vector Laboratories, Burlingame, USA). Peroxidase activity was visualized by 3,3‐diaminobenzidine (Sigma‐Aldrich, St. Louis, MO, USA). Finally, sections were counterstained with hematoxylin. All antibodies were diluted in TBS containing 0.5% Triton‐X100 and 2% normal donkey serum. Omission of the primary antibodies for TG2 served as a negative control. Specificity of the anti TG2 antibodies was determined by preadsorption of the TG2 antibodies Ab3 and Upstate with at least 100‐fold (w/w) excess of guinea pig TG2 (Sigma). After 6 h of preadsorption, adjacent tissue sections were incubated with the preadsorbed or non‐adsorbed antibodies and further treated as a regular immunohistochemical staining.
Double immunolabeling
To determine co‐localization of TG2 with astrocytes, 4% PFA fixed cryosections containing active MS lesions were co‐incubated with rabbit anti‐GFAP (DAKO, Glostrup, Denmark; 1:1000) and mouse anti‐TG2 (Ab3; Labvision; 1:200) or goat anti‐TG2 (Upstate; 1:2000). For co‐localization of TG2 with the ECM protein Fn, cryosections containing active, chronic active or inactive lesions were co‐incubated with rabbit anti‐Fn (Sigma‐Aldrich; 1:400) and mouse anti‐TG2 (Ab3, Labvision; 1:200). Subsequently, sections were incubated with the following appropriate set of secondary antibodies: donkey anti‐rabbit Alexa Fluor 488 and donkey anti‐mouse Alexa Fluor 594 or donkey anti‐mouse Alexa Fluor 488 and donkey anti‐goat Alexa Fluor 594 (Invitrogen, Carlsbad, CA, USA; 1:400). Incubation procedures were performed as described above. Fluorescent double immunolabeling was identified by confocal laser scanning microscopy (Leica TCS‐SP2‐AOBS; Leica Microsystems, Wetzlar, Germany).
Cell culture
Human astrocytoma cells (U373 cells; ECACC 89081403) were cultured in Dulbecco's modified Eagle's medium (DMEM, Invitrogen) containing 10% fetal bovine serum (BioWhittaker) and penicillin/streptomycin (Invitrogen). The presence of TG2 was determined immunocytochemically, and by Western blot analysis. To determine the role of TG2 in adhesion and migration onto Fn, U373 cells were treated with 0.5 mM KCC009, an irreversible inhibitor of TG2 activity (12).
TG2 immunocytochemistry in cell culture
U373 cells were cultured in 8‐well chamber slides (Nunc) coated for 1 h with 2 µg/cm2 Fn (Sigma‐Aldrich) at 37°C. After 24 h, cells were fixed with 4% paraformaldehyde in 0.1 M phosphate buffer (pH 7.6) for 15 minutes and subsequently rinsed with PBS. The cells were incubated with mouse anti‐TG2 (Ab3, Labvision, 10 µg/mL or 4G3, gift from Dr. A. Belkin, Baltimore, MD, USA, 10 µg/mL) in PBS/2% bovine serum albumin (Sigma‐Aldrich) for 4 h at 4°C. After washes in PBS, the cells were incubated with biotinylated donkey anti mouse IgG's (Jackson Laboratories, 1:500) for 1 h at RT followed by 1 h incubation with Alexa Fluor 488‐coupled streptavidin (Invitrogen, 1:400) at RT. Cells were washed with PBS/0.1% tween and subsequently incubated for 1 h with rhodamine phalloidin (Invitrogen 1:300) at RT to visualize the actin cytoskeleton. Thereafter, cells were washed with PBS and slides were embedded in vectashield (Vector Laboratories Inc., Burlingame, CA, USA). Images were obtained using a confocal laser scanning microscope (Leica Microsystems).
TG2 down‐regulation in astrocytoma cells using siRNA
Human U373 cells were used to determine the role of TG2 in astrocyte‐fibronectin interaction. Therefore, TG2 siRNA (target sequence 5′‐AAGGCCCGTTTTCCACTAAGA‐3′) was designed and purchased from Qiagen (Hilden, Germany). A fluorescently labeled, commercially available nonsense siRNA served as a control (AllStars Neg. siRNA, Qiagen). For transfection, 4 × 10⁵ U373 cells were plated in each well of a six well plate and allowed to adhere for 24 h. On the day of transfection, 15 µL RNAiFect transfection reagent (Qiagen) was added to 19.2 µL siRNA (0.26 µg/µL) in 65.8 µL buffer EC‐R (Qiagen) to give a final volume of 100 µL. This siRNA transfection reagent mixture was left at RT for 15 minutes and added drop wise to the cells in serum‐containing medium. Three days after transfection, cells were used for cell adhesion experiments. Transfection efficiency was around 80% as determined microscopically of U373 cells transfected with fluorescently labeled nonsense siRNA (data not shown).
TG activity assay
To measure TG activity, U373 cells were treated for 4 and 8 h with 0.5 mM KCC009 in 0.2% DMSO or 0.2% DMSO only (vehicle) at 37°C. Subsequently, cells were homogenized in ice‐cold lysis buffer containing 10 mM Tris/HCl pH 7.5, 150 mM NaCl, 1 mM EDTA, 1 mM DTT, 100 µM PMSF, 10 µg/mL leupeptin, 10 µg/mL pepstatin and 10 µg/mL aprotinin (all from Sigma). Homogenates were centrifuged for 30 minutes at 14 000 rpm and 4°C, and protein concentrations in the supernatants were determined by the BCA method (Pierce Biotechnology, Perbio Science, Etten‐Leur, the Netherlands). TG activity was measured using the TG Covtest TCMA (Transglutaminase Colorimetric Microassay; Covalab, Villeurbanne, France) following the manufacturer's protocol (34). In short, immobilized CBZ‐Gln‐Gly was coated onto the wells as the first TG substrate. Subsequently, 10 µg of protein from each sample was added/well, followed by addition of biotinylated cadaverine as a TG second substrate. After 30 minutes incubation at 37°C, plates were washed with Tween‐20 buffered saline (TTBS) and streptavidin‐labeled peroxidase (HRP) diluted in TTBS was added to the wells for 15 minutes. After washing, peroxidase activity was revealed using 100 µL of 0.01% H2O2 as HRP substrate and (0.1 mg/mL) tetramethyl benzidine as electron acceptor (chromogen). The reaction was stopped by the addition of 50 µL of 2.5 N H2SO4. TG activity was detected by absorbance measurement of streptavidin‐labeled peroxidase activity in each well on a microplate reader (SpectraMax 250, Molecular Devices, Sunnyvale, CA, USA) at 450 nm. Purified guinea pig TG2 was used to prepare a standard curve.
Cell viability measurements
The effect of KCC009 treatment on cell viability was determined by propidium iodide (PI) exclusion assay. U373 cells were plated in a 96‐well plate (20 000 cells/well) and allowed to adhere for 24 h in serum free medium. Subsequently, the medium was replaced with PBS containing 0.5 mM MgCl2, 1.2 mM CaCl2, 0.1% glucose, 40 µg/mL PI (Sigma‐Aldrich) and 0.5 mM KCC009 in 0.2% DMSO or 0.2% DMSO only (vehicle). During the following incubation period of 16 h at 37°C, PI fluorescence was measured at 30‐minute intervals, using a Fluostar OPTIMA microplate reader with an excitation wavelength of 544 nm and an emission wavelength of 612 nm. Average slope/min was measured per 30‐minute interval and averaged to a slope/min per 24 h (F‐average). After 24 h, 160 µM digitonin was added for 20 minutes to permeabilize all cells and fluorescence measurements were performed to obtain a maximal fluorescent signal (Fmax). Percentage viability was calculated as 100‐(F‐average/Fmax) × 100% (35).
Astrocytoma adhesion onto Fn
Astrocyte adhesion was performed as described (14). In short, 96‐well plates were coated with 2 µg/cm2 Fn (Sigma‐Aldrich) for 1 h at 37°C. U373 cells treated with siRNA were detached with 2 mM EDTA, washed with PBS and plated onto the Fn‐coated wells (5 × 10⁴ cells/well) in serum free medium. Cells were allowed to adhere for 3 h at 37°C incubated in the presence of 0.5 mM KCC009 or vehicle, or incubated in serum free medium only (siRNA treated cells). After 3 h, cells were washed three times with PBS and fixed with 4% formalin in 0.1 M phosphate buffer for 1 h at RT. Cells were stained with 100 µL crystal violet solution (0.5 gr/100 mL 70% EtOH) for 40 minutes. Cells were then washed three times with PBS, and crystal violet was extracted from the cells with 100 µL 30% acetic acid. The absorbance was measured on a microplate reader (SpectraMax 250, Molecular Devices) at 540 nm.
Astrocytoma migration across Fn
Estimation of astrocyte migration was performed as described (21). In short, permanox chamberslides (4‐wells, Nunc) were coated with 2 µg/cm2 Fn (Sigma‐Aldrich) for 1 h at 37°C. U373 cells were plated onto the Fn‐coated wells (2 × 10⁵ cells/well) in serum free medium. After 24 h, medium was replaced with fresh serum free medium containing 0.5 mM KCC009 or vehicle, and a wound was made using a sterile 10 µL pipet‐tip (Corning) eliminating cells in each well locally. To determine the optimal time‐points to analyze the wound diameter, cells were fixed at 0, 4, 8 and 16 h with 4% PFA for 20 minutes. Cells were then washed with PBS and subsequently stained with rhodamine‐phalloidin (Invitrogen, 1:300) for 1 h at RT, washed with PBS and embedded in vectashield (Vector Laboratories). Pictures were taken using a Colorview II digital camera (Olympus Soft Imaging Solutions GmbH, Munster, Germany) and Cell*F software (Olympus Soft Imaging Solutions GmbH). For subsequent quantitative analysis of the effect of KCC009 treatment on the wound diameter, cells were treated with KCC009 as indicated above, and phase contrast pictures were made within each experimental chamber‐slide well at 0, 4 and 8 h after making the wound. The 16 h time‐point was not incorporated as no clear outlining of the wound could be identified anymore, and thus no appropriate measurement of the wound performed. Five random 20× fields per culture condition were captured, and mean wound diameter was assessed in each field.
Bromodeoxyuridine labeling assay
To determine the effect of KCC009 treatment on astrocytoma proliferation, U373 cells were plated on Fn‐coated (2 µg/cm2, Sigma‐Aldrich) chamberslides (4‐wells, Nunc). After 24 h, the medium was replaced with fresh serum free–medium‐containing vehicle or 0.5 mM KCC009 and a wound was made in each well. After 1 h, 10 µM bromodeoxyuridine (BrdU; Sigma, 10 µM/mL) was added for 7 h to label mitotic cells. Cultures were subsequently washed with PBS and fixed with 4% PFA for 20 minutes, permeabilized with 0.5% Triton X‐100 (Sigma‐Aldrich) in PBS for 10 minutes and blocked with 3% BSA in PBS for 1 h. To identify BrdU, astrocytes were incubated with mouse anti‐BrdU antibody (BD Biosciences, CA, USA, 1:200) in PBS containing 1% BSA overnight at 4°C, washed with PBS followed by incubation with donkey anti‐mouse Alexa Fluor 488 (Invitrogen, 1:1000) for 2 h. Cells were then again washed with PBS and embedded in Vectashield containing dapi, a nuclear dye (Vector Laboratories). Immunofluorescent staining was visualized using a Leica confocal laser scanning microscope (Leica Microsystems). The percentage of proliferative cells present per well was calculated as follows: number of BrdU positive cells/number of dapi positive nuclei × 100%.
Detection of F‐actin and vinculin
The effect of KCC009 on focal adhesion formation was visualized by detection of vinculin immunoreactivity. Furthermore, U373 cells were stained with rhodamine‐phalloidin to visualize the F‐actin cytoskeleton. Cells were plated on Fn‐coated (2 µg/cm2, Sigma‐Aldrich) eight‐well chamber slides (Labtek, Nalge Nunc International, 2 × 10⁴ cells/well) and left o/n at 37°C in serum free medium. The following day, the cells were incubated with 0.5 mM KCC009 or vehicle in serum free medium for 3 h and subsequently fixed for 20 min with 4% PFA, permeabilized with 0.5% Triton X‐100 (Sigma‐Aldrich) in PBS for 10 min and blocked with 3% BSA in PBS for 1 h. To identify focal adhesions, astrocytes were incubated with mouse anti‐vinculin antiserum (Abcam, 1:400) in PBS containing 1% BSA overnight at 4°C, then washed with PBS followed by incubation with donkey anti‐mouse Alexa Fluor 488 (Invitrogen, 1:1000). Slides were washed, and to identify F‐actin cytoskeleton filaments, the astrocytes were subsequently stained with rhodamine‐phalloidin (Invitrogen, 1:300) for 1 h at RT, washed with PBS again and embedded in Vectashield (Vector Laboratories). Immunofluorescent staining was visualized using a Leica confocal laser scanning microscope (Leica Microsystems).
Western blot
To determine TG2 protein expression levels in untreated and siRNA treated U373 cells and protein levels of vinculin after treatment with KCC009 or vehicle, cells were homogenized in ice‐cold lysis buffer containing 10 mM Tris/HCl pH 7.5, 150 mM NaCl, 1 mM EDTA, 1 mM DTT, 100 µM PMSF, 10 µg/mL leupeptin, 10 µg/mL pepstatin and 10 µg/mL aprotinin (all from Sigma). Homogenates were cleared by centrifugation (14 000 rpm for 30 min at 4°C) and protein concentrations in supernatants were determined by the BCA method (Pierce Biotechnology). Of each sample, 10 µg of protein was subjected to 10% SDS‐polyacrylamide gel electrophoresis (SDS‐PAGE) and transferred to a polyvinylidene difluoride membrane (Invitrogen). Membranes were incubated with mouse anti‐vinculin antibody (Abcam, 1:1000), mouse anti‐TG2 (Ab3, Labvision, 1:1000) or mouse anti‐β–actin (loading control) o/n at 4°C. For subsequent antigen detection, blots were incubated for 2 h at RT with corresponding goat anti‐mouse Immunoglobulins/HRP (Dako, Glostrup, Denmark, 1:10 000). Bands were visualized using the enhanced chemiluminescence (ECL) detection system SuperSignal West Dura (Pierce Biotechnology) and a Chemidoc image capture system (Bio‐Rad, Veenendaal, the Netherlands). Signal intensity of the bands was semi‐quantified and corrected for β‐actin using Quantity One software (Bio‐Rad).
Statistical analysis
Data were analyzed by one‐way ANOVA, followed by a t‐test for independent measurements (Fisher's LSD test). The statistical evaluation was carried out by using the NCSS 2001 statistical program (NCSS, Kaysville, UT, USA). Data are expressed as mean + standard error of the mean (SEM). P < 0.05 was considered significant.
RESULTS
TG2 immunoreactivity in astrocytes in human MS lesions
In control subjects, TG2 immunoreactivity was mainly restricted to brain endothelium (Figure 1A). In this subject group no demyelination (PLP staining) and mostly ramified MHC II positive microglial cells were observed (Figure 1B,C). When studying sections of MS patients containing the various types of lesions, TG2 immunoreactivity was present in cells with a glial‐like appearance (Figure 1D,G). Using double immunofluorescence, these cells were clearly identified as GFAP‐positive astrocytes (Figure 2A,B). In active MS lesions, TG2 immunopositive astrocytes were localized within the lesion (Figure 1D) where macrophages are present and demyelination is occurring (Figure 1E,F). In chronic active lesions, TG2 immunopositive astrocytes were present at the rim of the lesion (Figure 1G) and just outside the lesion (Figure 1G insert) where active demyelination is ongoing (Figure 1H,I). In fully demyelinated, inactive MS lesions where mostly ramified microglia are present (Figure 1K,L), hardly any TG2 positive cells were present (Figure 1J). Preadsorption of the anti‐TG2 antibody (as shown for Ab3) with guinea pig TG2 convincingly attenuated TG2 immunoreactivity in the astrocytes (Figure 2C,D). Omission of the anti‐TG2 antibodies did not show any immunoreactivity (data not shown).
Figure 1.
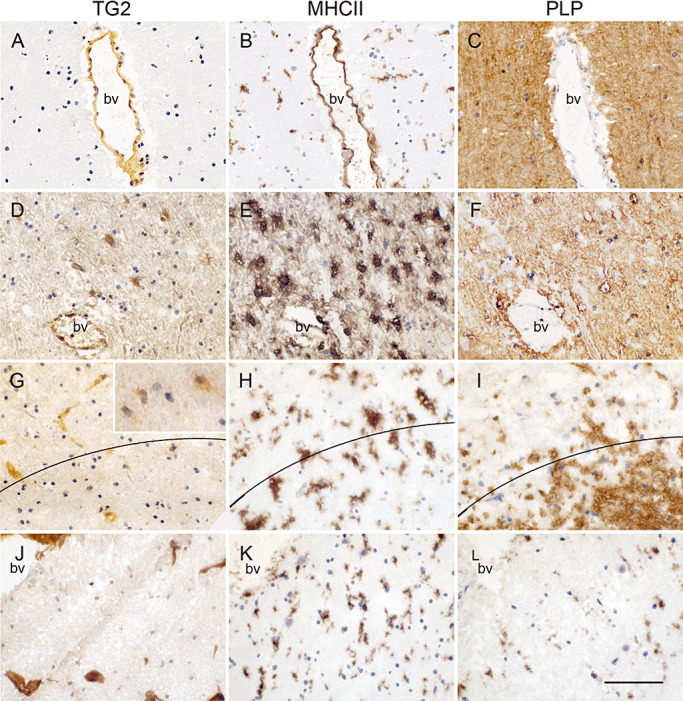
TG2 immunoreactivity in control subjects and various MS lesion types with corresponding MHC II (B,E,H,K) and PLP (C,F,I,L) immunoreactivity in adjacent tissue sections. In control subjects TG2 immunoreactivity is present in endothelium (A). In active MS lesions, TG2 immunoreactivity is additionally present in astrocyte‐like cells (D), at the rim of chronic active MS lesions, some sparse TG2 positive astrocyte‐like cells can be observed (G) but they are present to a larger extent just outside the lesion (insert). Hardly TG2 positive cells are found in inactive lesions (J) where demyelination is complete. Scale bar: 100 µm.
Figure 2.
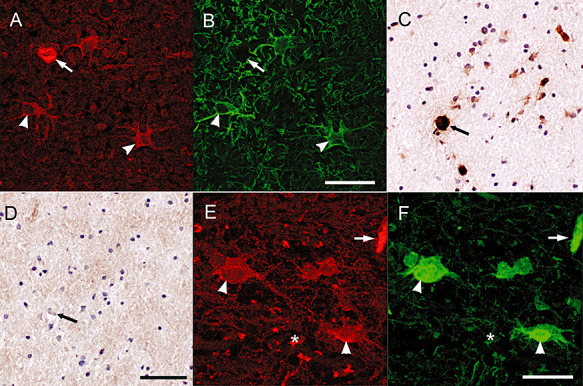
TG2 immunoreactivity in astrocytes. Double immunofluorescence staining showed the presence of TG2 immunoreactivity (A) in GFAP positive astrocytes (B). Scale bar: 40 µm. TG2 immunoreactivity in astrocytes (C) and endothelium is abolished after preadsorption of the anti‐TG2 antiserum with guinea pig TG2 (D). Scale bar: 100 µm. TG2 immunoreactivity in astrocytes, endothelium and extracellularly (D) co‐localized with Fn, an ECM protein (F). Scale bar: 40 µm. Arrow: blood vessel, arrowhead: astrocyte, asterisk: extracellular.
TG2 immunoreactivity co‐localizes with Fn
In and around MS lesions Fn is produced by various cell types, including endothelial cells and astrocytes, and deposited into the ECM (44). By using double immunofluorescence we observed co‐localization of TG2 and Fn in endothelial cells, which is well known (17). Of interest is the partial co‐localization of TG2 and Fn in cells with an astrocyte‐like appearance (Figure 2E,F). We also observed some TG2 immunoreactivity that was not clearly cell associated, but co‐expressed with extracellular Fn (Figure 2E,F).
TG2 in cultured human astrocytoma cells
TG2 protein expression was studied in human U373 cells to determine if these cells were able to produce TG2, and thus might serve as a representative model for TG2 positive astrocytes in MS lesions. TG2 protein expression and activity was clearly present in U373 cells as determined by Western blot (Figure 3A) and a TG Covtest to measure enzyme activity (Figure 3B). TG2 immunoreactivity (Figure 3C) was present in subsets of astrocytoma cells, reflecting the situation in MS lesions. TG2 immunoreactivity was detected mainly in the cytoplasm, often localized in a perinuclear fashion (arrow), but was also present at the edge of the cell, where it co‐localized with the actin cytoskeleton marker rhodamine‐phalloidin (arrowhead).
Figure 3.
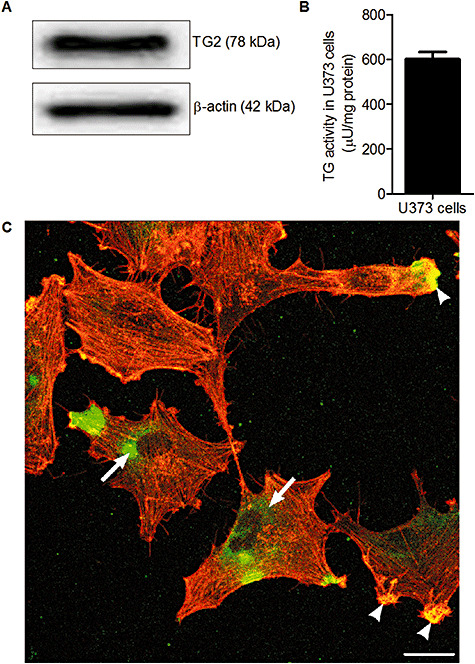
TG2 protein expression in U373 cells. A. TG2 protein expression in U373 cells, visualized using Western blot. B. TG activity in U373 cells. Data is expressed as mean (n = 8) + SEM. C. Immunoreactivity of TG2 (green) and F‐actin (red) in U373 cells. Scale bar: 100 µm.
TG2 is involved in adhesion of human astrocytoma cells onto Fn
To determine the role of TG2 in astrocyte adhesion, U373 cells were transfected with siRNA targeting TG2 or with nonsense siRNA (‐ control). Three days after transfection, cells were either used for adhesion experiments on fibronection or homogenized to detect TG2 protein levels by Western blotting. TG2 siRNA transfected U373 cells adhere to a significantly lesser extent onto Fn which is about 31% reduced compared to control nonsense siRNA transfected U373 cells (Figure 4A). Moreover, TG2 protein levels are clearly knocked down by 60% after transfection of the U373 cells with TG2 siRNA (Figure 4B). Thus, reduced adhesion of U373 cells onto the extracellular matrix protein Fn relates to less TG2 protein levels in these TG2 siRNA transfected U373 cells.
Figure 4.
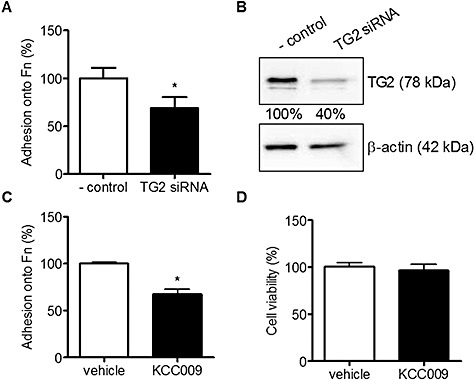
Adhesion of U373 cells onto Fn after reduction of TG2 protein expression or activity. A. Adhesion of U373 cells onto Fn coated wells in TG2 siRNA treated cells compared to nonsense siRNA treated cells (‐ control). B. TG2 protein expression levels after treatment with nonsense siRNA (‐ control) or TG2 siRNA, visualized using Western blot. Bands were semi‐quantified and corrected for β‐actin. C. Adhesion of U373 cells onto Fn coated wells after treatment with 0.5 mM KCC009 or vehicle. D. cell viability after treatment with 0.5 mM KCC009 or vehicle in U373 cells. Data are expressed as mean (n = 12) + SEM, *P < 0.05 compared to ‐ control or vehicle‐treated cells.
To study the effect of TG2 activity on astrocyte adhesion, U373 cells were treated with a specific TG2 inhibitor, KCC009, or vehicle, and allowed to adhere onto Fn for 3 h. Adhesion of KCC009‐treated U373 cells was reduced by 33% compared to adhesion of vehicle‐treated U373 cells (Figure 4C). Within a period of 24 h, KCC009 treatment was not toxic to the cells as determined by the propidium iodide assay (Figure 4D).
TG2 is involved in migration of human astrocytoma cells across Fn matrices
Subsequently, the role of TG2 activity in migration of astrocytes across Fn was determined. After plating the U373 cells on Fn, a wound was made and cells were allowed to migrate for 4, 8 and 16 h in the presence of KCC009 or vehicle. Cells were fixed and stained with rhodamine phalloidin to determine the optimal time‐points to visualize the effect of TG2 inhibition on the wound diameter. Vehicle‐treated cells migrated into the wound and time‐dependently formed a confluent layer within a time frame of 16 h. Interestingly, KCC009‐treated cells did not reach confluency within 16 h (Figure 5A). As the outline of the wound is almost undetectable at 16 h in the vehicle‐treated cells because of confluency, we subsequently quantified cell migration in an independent experiment at 0, 4 and 8 h after the wound was made. At the start of the experiment (0 h) no difference in wound diameter was observed between the KCC009‐treated and vehicle‐treated cells. However, whereas after 4 or 8 h the vehicle‐treated cells showed a large reduction of up to 45% in wound diameter, the KCC009‐treated cells at 8 h reached a reduction of maximally 25% in wound diameter (Figure 5B). This was not caused by drug‐induced change in cell division as after 8 h of KCC009 treatment, no effect on cell proliferation was found. In fact, BrdU incorporation in vehicle treated cells was 38% compared to 39% in KCC009 treated cells (data not shown). Treatment of U373 cells with KCC009 for 4 or 8 h significantly reduced the level of active TG by 33% or 22%, respectively (Figure 5C).
Figure 5.
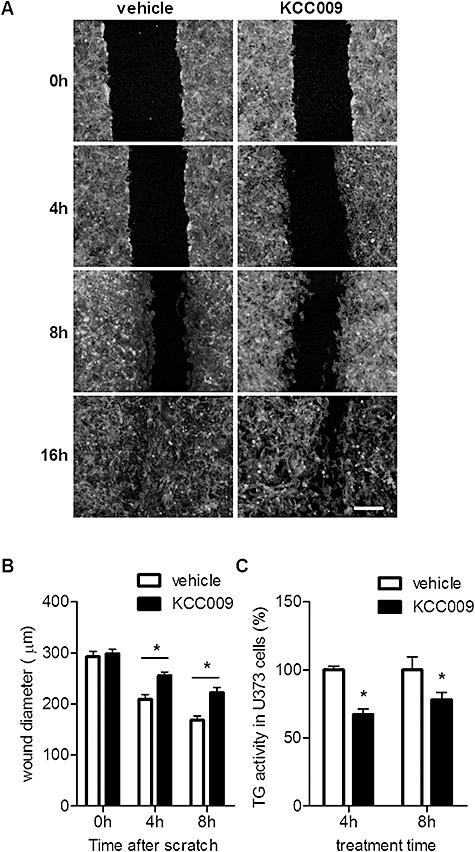
Migration of U373 cells across Fn matrices after reduction of TG2 activity. A wound was made in a confluent U373 cell layer plated onto Fn. A. U373 cells were allowed to migrate in the presence of vehicle or 0.5 mM KCC009. Cells were fixed after 0, 4, 8 and 16 h and stained with rhodamine‐phalloidin to visualize the cells and determine the wound diameter. Scale bar: 100 µm. B. U373 cells were allowed to migrate for maximally 8 h and the surface of the wound was quantified using phase‐contrast microscopy after 0, 4 and 8 h. C. TG2 activity was measured in U373 cells treated with vehicle or 0.5 mM KCC009 for 4 and 8 h using the TG Covtest. Data are expressed as mean (n = 6) + SEM, *P < 0.05.
Inhibition of TG2 activity redistributed vinculin immunoreactivity within U373 cells
Dissolution of focal adhesions is required for cell adhesion and migration processes. We thus examined the effect of KCC009 on vinculin expression in U373 cells. In addition, F‐actin stress fibers were stained to visualize the actin cytoskeleton of the human astrocytoma cells. In vehicle‐treated cells, vinculin immunoreactivity could be clearly observed spread throughout the cytoplasm (Figure 6A, asterisks). Furthermore, vinculin immunoreacitiy was observed in the membrane (Figure 6A, arrow) and also at the endings of F‐actin fibers (Figure 6A and insert, arrowhead). When U373 cells were treated with KCC009, cytoplasmic vinculin immunoreactivity was increased (Figure 6B, asterisks). At the same time, however, vinculin immunoreactivity at the cell membrane (Figure 6B, arrow) and associated with F‐actin fibers seemed decreased (Figure 6B and insert, arrowhead). When vinculin protein levels were analyzed by Western blot, the amount of vinculin protein was increased by 35% after treatment with KCC009 (Figure 6C).
Figure 6.
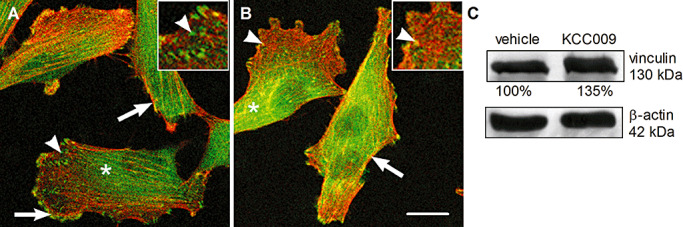
KCC009 treatment induces disruption of focal adhesions. Confocal images of U373 cells stained with phalloidin (red) to detect the F‐actin network and an antibody against vinculin (green). A. U373 treated with vehicle and B. U373 treated with 0.5 mM KCC009 for 4 h. Scale bar: 10 µm. C. U373 cells treated with 0.5 mM KCC009 or vehicle for 4 h were lysed and vinculin expression in the cell lysates was visualized on Western blot. Bands were quantified with Quantity One software.
DISCUSSION
The present study is the first to identify the appearance of TG2 immunoreactivity in astrocytes in active and chronic active MS lesions. In fact, the localization of TG2 in endothelial cells as observed in the present study is well documented (Bergamini 2005). We now demonstrate that, in active and chronic active MS lesions, TG2 immunoreactivity appeared in other cells located within and at the rim of the lesion. These cells had an astrocytic appearance. Indeed, the cellular identity was confirmed by double labeling of TG2 with the astrocyte marker GFAP. Morphologically, the TG2‐positive astrocytes appeared as large hypertrophic cells, indicating their reactive state which can be induced by local pro‐inflammatory cytokines and/or chemokines produced during lesion formation. In vitro studies have shown that certain pro‐inflammatory cytokines, including TNF‐α, that are known to be present in active MS lesions, can induce TG2 production in astrocytes (28). In inactive MS lesions, little TG2 immunoreactivity was found. This may be caused by a reduced inflammatory profile of these inactive lesions, resulting in corresponding lower TG2 expression. During MS lesion development, astroglial cells become hyperactive and increase their metabolic activity during the inflammatory phase, that is, when the active lesions occur. They remain active until the ECM has been remodeled, inflammation has ablated and the lesion has become inactive. Of importance during this process is the migration of astrocytes to the site of damage and their interaction with ECM proteins which all contribute to the complicated process of local tissue remodeling. Of note, also in HIV‐related neuropathology, induced in rhesus monkeys by infection with simian immunodeficiency virus, TG2 immunoreactivity has been observed in astrocytes in the vicinity of lesions (33). The authors suggest that under HIV conditions, astrocytic TG2 can either contribute to astrogliosis and/or be involved in apoptosis. Indeed, TG2 has been identified as an important regulator of apoptotic cell death in various cell types, including monocytes and neurons 26, 29. Moreover, in vitro studies have shown that excitotoxic stimuli induce TG2 production and activity in astroglial cells (11). Glutamate treatment of cells induces calcium influx into the cell, which is known to elevate TG2 activity, and may ultimately contribute to cell death. In contrast, also anti‐apoptotic effects of TG2 have been observed in vitro (5) as well as in vivo (56), where they have shown that inhibition of TG2 activity in a glioblastoma model renders the cells more sensitive to chemotherapy, and thus suggests that the presence of TG2 protects these cells from dying. Of particular interest in relation to the present study is the observation that TG2 mediates adhesion‐dependent cell survival signaling (52), in which the interaction between TG2 and Fn rescues cells from a form of cell death induced by loss of adhesion, known as anoikis.
Our immunohistochemical data show that TG2 co‐localized with Fn in astrocyte‐like cells in and at the rim of MS lesions. Moreover, extracellular Fn seems to co‐localize with extracellular TG2. It has been shown that astrocytes within MS lesions can produce Fn 40, 51. Our data suggest that both intracellular and cell surface associated/extracellular Fn can interact with TG2. In support of this, recent studies have indicated a prominent role for TG2 in the interaction between cells and the ECM protein Fn, playing a role in cell adhesion and migration 45, 58. In addition, it has been shown that inhibition of TG2 in glioblastomas blocked the remodeling of Fn in the ECM both in vitro and in vivo (57). Thus, the appearance of TG2 in astrocytes in MS lesions may suggest a role for TG2 in either cell survival/cell death and/or in cell adhesion/migration. The fact that the small molecule TG2 inhibitor KCC009 did not alter the viability of the cultured human U373 astrocytoma cells suggests that it is unlikely that astrocyte‐derived TG2 is involved in cell death/survival processes under the conditions studied. It does however not exclude the possibility that astrocyte‐derived TG2 in MS lesions is involved in such processes. Alternatively, we studied the role of astrocyte‐derived TG2 in the interaction with Fn, as a possible mechanism underlying astrocyte adhesion and migration as part of the tissue remodeling taking place during MS lesion formation. At first, the presence of TG2 protein and activity in the human astrocytoma cells used was identified, which is a prerequisite when studying its function. Furthermore, TG2 protein could be cellulary localized within the cytoplasm, and at the cell surface, as observed in other cell types, including monocytes (1). Subsequent inhibition of TG2 activity in human astrocytoma cells by using siRNA or KCC009 significantly reduced the adhesion of these cells onto Fn. These data support our immunocytochemical observation that astrocyte‐derived TG2 is, at least partly, present at the cell surface. Furthermore, it shows for the first time that TG2 plays a role in the interaction between astrocytes and the ECM protein Fn. As we do not know at this stage whether this effect is mediated by transamidating activity of TG2 solely, other studies have suggested that TG2‐Fn interactions can be performed independent of its transamidating activity 2, 16, 45.
Of subsequent interest is that inhibition of TG2 activity markedly reduced the migration of human astrocytoma cells across Fn in a time‐dependent way. Even 8 h after induction of a scratch wound on the culture plate, the partly reduced TG activity levels impaired migration of astrocytoma cells. Although effects of TG2 on cell proliferation have been mentioned 6, 58, we did not observe an effect of inhibition of TG2 activity on human astrocytoma proliferation, as measured by BrdU incorporation. Thus, our data indicate that TG2 is involved in astrocyte migration across Fn. This may be of importance during MS lesion formation, when local Fn, in addition to other ECM proteins, is essential for tissue remodeling, resulting in scar formation. This scar mainly consists of astrocytes that have migrated into the lesion. Cell adhesion and migration requires cytoskeletal reorganization, which can be visualized by F‐actin distribution and its interactions with focal adhesions (4). Recruitment of fine actin bundles into stress fibers is typically accompanied by the formation of focal adhesions, which link the ECM to the cytoskeleton via heterodimeric integrin receptors and adapter proteins including vinculin (55). In the present study, we observed that inhibition of TG2 activity increased cytoplasmic vinculin immunoreactivity, and simultaneously reduced vinculin immunoreactivity at the cell membrane. This suggests a relocation of vinculin from the cell surface into the cytoplasm. Moreover, an attenuated co‐localization of vinculin with F‐actin at the cell surface was found. Together, these data indicate that TG2 is involved in focal adhesion formation in astrocytes probably thereby mediating cell adhesion and migration. This is in line with a study where it was suggested that TG2 plays a role in integrin‐mediated adhesion of mesenchymal stem cells to Fn (43). Ultimately, the effect of TG2 on focal adhesion formation and cytoskeletal reorganization could be mediated by the small GTPase RhoA. Active RhoA is known to be involved in stress fiber and focal adhesion assembly (32), and TG2 can activate RhoA. Further studies are required to study the mechanisms underlying the effects of TG2 in astrocyte adhesion and migration in more detail.
In conclusion, our studies demonstrate that TG2 appears in astrocytes in active white matter lesions of MS patients. These astrocytes have a hypertrophic morphology, are reactive, and co‐localize with Fn. In that respect, additional in vitro data show that TG2 mediates the interaction between human astrocytoma cells and Fn, an ECM protein, present in MS lesions, and of importance for tissue remodeling. We therefore speculate that TG2 is an essential factor mediating the interaction between astrocytes and Fn in the ECM of MS lesions, thereby contributing to astrocyte migration and adhesion, finally resulting in tissue remodeling and glial scarring.
ACKNOWLEDGMENTS
The Netherlands Brain Bank (Dr I. Huitinga) is thanked for providing us with human brain material. We thank Alvine Pharmaceuticals (San Carlos, USA) for kindly providing KCC009. This work is supported by the Stichting MS Research.
REFERENCES
- 1. Akimov SS, Belkin AM (2001) Cell surface tissue transglutaminase is involved in adhesion and migration of monocytic cells on fibronectin. Blood 98:1567–1576. [DOI] [PubMed] [Google Scholar]
- 2. Akimov SS, Belkin AM (2001) Cell‐surface transglutaminase promotes fibronectin assembly via interaction with the gelatin‐binding domain of fibronectin: a role in TGFbeta‐dependent matrix deposition. J Cell Sci 114:2989–3000. [DOI] [PubMed] [Google Scholar]
- 3. Akimov SS, Krylov D, Fleischman LF, Belkin AM (2000) Tissue transglutaminase is an integrin‐binding adhesion coreceptor for fibronectin. J Cell Biol 148:825–838. [DOI] [PMC free article] [PubMed] [Google Scholar]
- 4. Amano M, Fukata Y, Kaibuchi K (2000) Regulation and functions of Rho‐associated kinase. Exp Cell Res 261:44–51. [DOI] [PubMed] [Google Scholar]
- 5. Antonyak MA, Singh US, Lee DA, Boehm JE, Combs C, Zgola MM et al (2001) Effects of tissue transglutaminase on retinoic acid‐induced cellular differentiation and protection against apoptosis. J Biol Chem 276:33582–33587. [DOI] [PubMed] [Google Scholar]
- 6. Barone MV, Caputo I, Ribecco MT, Maglio M, Marzari R, Sblattero D et al (2007) Humoral immune response to tissue transglutaminase is related to epithelial cell proliferation in celiac disease. Gastroenterology 132:1245–1253. [DOI] [PubMed] [Google Scholar]
- 7. Benveniste EN (1998) Cytokine actions in the central nervous system. Cytokine Growth Factor Rev 9:259–275. [DOI] [PubMed] [Google Scholar]
- 8. Bo L, Dawson TM, Wesselingh S, Mork S, Choi S, Kong PA et al (1994) Induction of nitric oxide synthase in demyelinating regions of multiple sclerosis brains. Ann Neurol 36:778–786. [DOI] [PubMed] [Google Scholar]
- 9. Bo L, Mork S, Kong PA, Nyland H, Pardo CA, Trapp BD (1994) Detection of MHC class II‐antigens on macrophages and microglia, but not on astrocytes and endothelia in active multiple sclerosis lesions. J Neuroimmunol 51:135–146. [DOI] [PubMed] [Google Scholar]
- 10. Bo L, Geurts JJ, Ravid R, Barkhof F (2004) Magnetic resonance imaging as a tool to examine the neuropathology of multiple sclerosis. Neuropathol Appl Neurobiol 30:106–117. [DOI] [PubMed] [Google Scholar]
- 11. Campisi A, Caccamo D, Raciti G, Cannavo G, Macaione V, Curro M et al (2003) Glutamate‐induced increases in transglutaminase activity in primary cultures of astroglial cells. Brain Res 978:24–30. [DOI] [PubMed] [Google Scholar]
- 12. Choi K, Siegel M, Piper JL, Yuan L, Cho E, Strnad P et al (2005) Chemistry and biology of dihydroisoxazole derivatives: selective inhibitors of human transglutaminase 2. Chem Biol 12:469–475. [DOI] [PubMed] [Google Scholar]
- 13. De Groot CJ, Bergers E, Kamphorst W, Ravid R, Polman CH, Barkhof F, Van Der Valk P (2001) Post‐mortem MRI‐guided sampling of multiple sclerosis brain lesions: increased yield of active demyelinating and (p)reactive lesions. Brain 124:1635–1645. [DOI] [PubMed] [Google Scholar]
- 14. Forsprecher J, Wang Z, Nelea V, Kaartinen MT (2009) Enhanced osteoblast adhesion on transglutaminase 2‐crosslinked fibronectin. Amino Acids 36:747–753. [DOI] [PubMed] [Google Scholar]
- 15. Frohman EM, Racke MK, Raine CS (2006) Multiple sclerosis—the plaque and its pathogenesis. N Engl J Med 354:942–955. [DOI] [PubMed] [Google Scholar]
- 16. Gaudry CA, Verderio E, Aeschlimann D, Cox A, Smith C, Griffin M (1999) Cell surface localization of tissue transglutaminase is dependent on a fibronectin‐binding site in its N‐terminal beta‐sandwich domain. J Biol Chem 274:30707–30714. [DOI] [PubMed] [Google Scholar]
- 17. Gaudry CA, Verderio E, Jones RA, Smith C, Griffin M (1999) Tissue transglutaminase is an important player at the surface of human endothelial cells: evidence for its externalization and its colocalization with the beta(1) integrin. Exp Cell Res 252:104–113. [DOI] [PubMed] [Google Scholar]
- 18. Holley JE, Gveric D, Newcombe J, Cuzner ML, Gutowski NJ (2003) Astrocyte characterization in the multiple sclerosis glial scar. Neuropathol Appl Neurobiol 29:434–444. [DOI] [PubMed] [Google Scholar]
- 19. Huang D, Han Y, Rani MR, Glabinski A, Trebst C, Sorensen T et al (2000) Chemokines and chemokine receptors in inflammation of the nervous system: manifold roles and exquisite regulation. Immunol Rev 177:52–67. [DOI] [PubMed] [Google Scholar]
- 20. Iismaa SE, Mearns BM, Lorand L, Graham RM (2009) Transglutaminases and disease: lessons from genetically engineered mouse models and inherited disorders. Physiol Rev 89:991–1023. [DOI] [PubMed] [Google Scholar]
- 21. John GR, Chen L, Rivieccio MA, Melendez‐Vasquez CV, Hartley A, Brosnan CF (2004) Interleukin‐1beta induces a reactive astroglial phenotype via deactivation of the Rho GTPase‐Rock axis. J Neurosci 24:2837–2845. [DOI] [PMC free article] [PubMed] [Google Scholar]
- 22. Junn E, Ronchetti RD, Quezado MM, Kim SY, Mouradian MM (2003) Tissue transglutaminase‐induced aggregation of alpha‐synuclein: Implications for Lewy body formation in Parkinson's disease and dementia with Lewy bodies. Proc Natl Acad Sci USA 100:2047–2052. [DOI] [PMC free article] [PubMed] [Google Scholar]
- 23. Kim SY, Grant P, Lee JH, Pant HC, Steinert PM (1999) Differential expression of multiple transglutaminases in human brain. Increased expression and cross‐linking by transglutaminases 1 and 2 in Alzheimer's disease. J Biol Chem 274:30715–30721. [DOI] [PubMed] [Google Scholar]
- 24. Kornek B, Lassmann H (2003) Neuropathology of multiple sclerosis‐new concepts. Brain Res Bull 61:321–326. [DOI] [PubMed] [Google Scholar]
- 25. Lesort M, Chun W, Tucholski J, Johnson GV (2002) Does tissue transglutaminase play a role in Huntington's disease? Neurochem Int 40:37–52. [DOI] [PubMed] [Google Scholar]
- 26. Mastroberardino PG, Farrace MG, Viti I, Pavone F, Fimia GM, Melino G et al (2006) “Tissue” transglutaminase contributes to the formation of disulphide bridges in proteins of mitochondrial respiratory complexes. Biochim Biophys Acta 1757:1357–1365. [DOI] [PubMed] [Google Scholar]
- 27. Milner R, Crocker SJ, Hung S, Wang X, Frausto RF, Del Zoppo GJ (2007) Fibronectin‐ and vitronectin‐induced microglial activation and matrix metalloproteinase‐9 expression is mediated by integrins alpha5beta1 and alphavbeta5. J Immunol 178:8158–8167. [DOI] [PubMed] [Google Scholar]
- 28. Monsonego A, Shani Y, Friedmann I, Paas Y, Eizenberg O, Schwartz M (1997) Expression of GTP‐dependent and GTP‐independent tissue‐type transglutaminase in cytokine‐treated rat brain astrocytes. J Biol Chem 272:3724–3732. [DOI] [PubMed] [Google Scholar]
- 29. Oliverio S, Amendola A, Rodolfo C, Spinedi A, Piacentini M (1999) Inhibition of “tissue” transglutaminase increases cell survival by preventing apoptosis. J Biol Chem 274:34123–34128. [DOI] [PubMed] [Google Scholar]
- 30. Perry MJ, Haynes LW (1993) Localization and activity of transglutaminase, a retinoid‐inducible protein, in developing rat spinal cord. Int J Dev Neurosci 11:325–337. [DOI] [PubMed] [Google Scholar]
- 31. Ridet JL, Malhotra SK, Privat A, Gage FH (1997) Reactive astrocytes: cellular and molecular cues to biological function. Trends Neurosci 20:570–577. [DOI] [PubMed] [Google Scholar]
- 32. Ridley AJ, Hall A (1992) The small GTP‐binding protein rho regulates the assembly of focal adhesions and actin stress fibers in response to growth factors. Cell 70:389–399. [DOI] [PubMed] [Google Scholar]
- 33. Roberts ES, Zandonatti MA, Watry DD, Madden LJ, Henriksen SJ, Taffe MA, Fox HS (2003) Induction of pathogenic sets of genes in macrophages and neurons in NeuroAIDS. Am J Pathol 162:2041–2057. [DOI] [PMC free article] [PubMed] [Google Scholar]
- 34. Sakly W, Thomas V, Quash G, El AS (2006) A role for tissue transglutaminase in alpha‐gliadin peptide cytotoxicity. Clin Exp Immunol 146:550–558. [DOI] [PMC free article] [PubMed] [Google Scholar]
- 35. Sarafian TA, Bredesen DE (1994) Is apoptosis mediated by reactive oxygen species? Free Radic Res 21:1–8. [DOI] [PubMed] [Google Scholar]
- 36. Shi F, Harman J, Fujiwara K, Sottile J (2010) Collagen I matrix turnover is regulated by fibronectin polymerization. Am J Physiol Cell Physiol 298:C1265–C1275. [DOI] [PMC free article] [PubMed] [Google Scholar]
- 37. Singh US, Pan J, Kao YL, Joshi S, Young KL, Baker KM (2003) Tissue transglutaminase mediates activation of RhoA and MAP kinase pathways during retinoic acid‐induced neuronal differentiation of SH‐SY5Y cells. J Biol Chem 278:391–399. [DOI] [PubMed] [Google Scholar]
- 38. Small JV, Rottner K, Kaverina I (1999) Functional design in the actin cytoskeleton. Curr Opin Cell Biol 11:54–60. [DOI] [PubMed] [Google Scholar]
- 39. Smilenov LB, Mikhailov A, Pelham RJ, Marcantonio EE, Gundersen GG (1999) Focal adhesion motility revealed in stationary fibroblasts. Science 286:1172–1174. [DOI] [PubMed] [Google Scholar]
- 40. Sobel RA, Mitchell ME (1989) Fibronectin in multiple sclerosis lesions. Am J Pathol 135:161–168. [PMC free article] [PubMed] [Google Scholar]
- 41. Sofroniew MV (2009) Molecular dissection of reactive astrogliosis and glial scar formation. Trends Neurosci 32:638–647. [DOI] [PMC free article] [PubMed] [Google Scholar]
- 42. Sofroniew MV, Vinters HV (2010) Astrocytes: biology and pathology. Acta Neuropathol 119:7–35. [DOI] [PMC free article] [PubMed] [Google Scholar]
- 43. Song H, Chang W, Lim S, Seo HS, Shim CY, Park S et al (2007) Tissue transglutaminase is essential for integrin‐mediated survival of bone marrow‐derived mesenchymal stem cells. Stem Cells 25:1431–1438. [DOI] [PubMed] [Google Scholar]
- 44. Stenman S, Vaheri A (1978) Distribution of a major connective tissue protein, fibronectin, in normal human tissues. J Exp Med 147:1054–1064. [DOI] [PMC free article] [PubMed] [Google Scholar]
- 45. Telci D, Wang Z, Li X, Verderio EA, Humphries MJ, Baccarini M et al (2008) Fibronectin‐tissue transglutaminase matrix rescues RGD‐impaired cell adhesion through syndecan‐4 and beta1 integrin co‐signaling. J Biol Chem 283:20937–20947. [DOI] [PMC free article] [PubMed] [Google Scholar]
- 46. Tilling T, Engelbertz C, Decker S, Korte D, Huwel S, Galla HJ (2002) Expression and adhesive properties of basement membrane proteins in cerebral capillary endothelial cell cultures. Cell Tissue Res 310:19–29. [DOI] [PubMed] [Google Scholar]
- 47. Trapp BD, Peterson J, Ransohoff RM, Rudick R, Mork S, Bo L (1998) Axonal transection in the lesions of multiple sclerosis. N Engl J Med 338:278–285. [DOI] [PubMed] [Google Scholar]
- 48. Tucholski J, Lesort M, Johnson GV (2001) Tissue transglutaminase is essential for neurite outgrowth in human neuroblastoma SH‐SY5Y cells. Neuroscience 102:481–491. [DOI] [PubMed] [Google Scholar]
- 49. Van Der Laan LJ, De Groot CJ, Elices MJ, Dijkstra CD (1997) Extracellular matrix proteins expressed by human adult astrocytes in vivo and in vitro: an astrocyte surface protein containing the CS1 domain contributes to binding of lymphoblasts. J Neurosci Res 50:539–548. [DOI] [PubMed] [Google Scholar]
- 50. Van Der Valk P, De Groot CJ (2000) Staging of multiple sclerosis (MS) lesions: pathology of the time frame of MS. Neuropathol Appl Neurobiol 26:2–10. [DOI] [PubMed] [Google Scholar]
- 51. Van Horssen J, Dijkstra CD, De Vries HE (2007) The extracellular matrix in multiple sclerosis pathology. J Neurochem 103:1293–1301. [DOI] [PubMed] [Google Scholar]
- 52. Verderio EA, Telci D, Okoye A, Melino G, Griffin M (2003) A novel RGD‐independent cel adhesion pathway mediated by fibronectin‐bound tissue transglutaminase rescues cells from anoikis. J Biol Chem 278:42604–42614. [DOI] [PubMed] [Google Scholar]
- 53. Verderio EA, Johnson T, Griffin M (2004) Tissue transglutaminase in normal and abnormal wound healing: review article. Amino Acids 26:387–404. [DOI] [PubMed] [Google Scholar]
- 54. Voskuhl RR, Peterson RS, Song B, Ao Y, Morales LB, Tiwari‐Woodruff S, Sofroniew MV (2009) Reactive astrocytes form scar‐like perivascular barriers to leukocytes during adaptive immune inflammation of the CNS. J Neurosci 29:11511–11522. [DOI] [PMC free article] [PubMed] [Google Scholar]
- 55. Wehrle‐Haller B, Imhof B (2002) The inner lives of focal adhesions. Trends Cell Biol 12:382–389. [DOI] [PubMed] [Google Scholar]
- 56. Yuan L, Choi K, Khosla C, Zheng X, Higashikubo R, Chicoine MR, Rich KM (2005) Tissue transglutaminase 2 inhibition promotes cell death and chemosensitivity in glioblastomas. Mol Cancer Ther 4:1293–1302. [DOI] [PubMed] [Google Scholar]
- 57. Yuan L, Siegel M, Choi K, Khosla C, Miller CR, Jackson EN et al (2007) Transglutaminase 2 inhibitor, KCC009, disrupts fibronectin assembly in the extracellular matrix and sensitizes orthotopic glioblastomas to chemotherapy. Oncogene 26:2563–2573. [DOI] [PubMed] [Google Scholar]
- 58. Zemskov EA, Loukinova E, Mikhailenko I, Coleman RA, Strickland DK, Belkin AM (2009) Regulation of platelet‐derived growth factor receptor function by integrin‐associated cell surface transglutaminase. J Biol Chem 284:16693–16703. [DOI] [PMC free article] [PubMed] [Google Scholar]