

Abstract
Background
A well‐functioning routine health information system (RHIS) can provide the information needed for health system management, for governance, accountability, planning, policy making, surveillance and quality improvement, but poor information support has been identified as a major obstacle for improving health system management.
Objectives
To assess the effects of interventions to improve routine health information systems in terms of RHIS performance, and also, in terms of improved health system management performance, and improved patient and population health outcomes.
Search methods
We searched the Cochrane Central Register of Controlled Trials (CENTRAL) in the Cochrane Library, MEDLINE Ovid and Embase Ovid in May 2019. We searched Global Health, Ovid and PsycInfo in April 2016. In January 2020 we searched for grey literature in the Grey Literature Report and in OpenGrey, and for ongoing trials using the International Clinical Trials Registry Platform (ICTRP) and ClinicalTrials.gov. In October 2019 we also did a cited reference search using Web of Science, and a ‘similar articles’ search in PubMed.
Selection criteria
Randomised and non‐randomised trials, controlled before‐after studies and time‐series studies comparing routine health information system interventions, with controls, in primary, hospital or community health care settings. Participants included clinical staff and management, district management and community health workers using routine information systems.
Data collection and analysis
Two authors independently reviewed records to identify studies for inclusion, extracted data from the included studies and assessed the risk of bias. Interventions and outcomes were too varied across studies to allow for pooled risk analysis. We present a 'Summary of findings' table for each intervention comparisons broadly categorised into Technical and Organisational (or a combination), and report outcomes on data quality and service quality. We used the GRADE approach to assess the certainty of the evidence.
Main results
We included six studies: four cluster randomised trials and two controlled before‐after studies, from Africa and South America. Three studies evaluated technical interventions, one study evaluated an organisational intervention, and two studies evaluated a combination of technical and organisational interventions. Four studies reported on data quality and six studies reported on service quality.
In terms of data quality, a web‐based electronic TB laboratory information system probably reduces the length of time to reporting of TB test results, and probably reduces the overall rate of recording errors of TB test results, compared to a paper‐based system (moderate certainty evidence). We are uncertain about the effect of the electronic laboratory information system on the recording rate of serious (misidentification) errors for TB test results compared to a paper‐based system (very low certainty evidence). Misidentification errors are inaccuracies in transferring test results between an electronic register and patients' clinical charts. We are also uncertain about the effect of the intervention on service quality (timeliness of starting or changing a patient's TB treatment) (very low certainty evidence).
A hand‐held electronic device probably improves the length of time to report TB test results, and probably reduces the total frequency of recording errors in TB test results between the laboratory notebook and the electronic information record system, compared to a paper‐based system (moderate‐certainty evidence). We are, however, uncertain about the effect of the intervention on the frequency of serious (misidentification) errors in recording between the laboratory notebook and the electronic information record, compared to a paper‐based system (very low certainty evidence).
We are uncertain about the effect of a hospital electronic health information system on service quality (length of time outpatients spend at hospital, length of hospital stay, and hospital revenue collection), compared to a paper‐based system (very low certainty evidence).
High‐intensity brief text messaging (SMS) may make little or no difference to data quality (in terms of completeness of documentation of pregnancy outcomes), compared to low‐intensity brief text messaging (low‐certainty evidence).
We are uncertain about the effect of electronic drug stock notification (with either data management support or product transfer support) on service quality (in terms of transporting stock and stock levels), compared to paper‐based stock notification (very low certainty evidence).
We are uncertain about the effect of health information strengthening (where it is part of comprehensive service quality improvement intervention) on service quality (health worker motivation, receipt of training by health workers, health information index scores, quality of clinical observation of children and adults) (very low certainty evidence).
Authors' conclusions
The review indicates mixed effects of mainly technical interventions to improve data quality, with gaps in evidence on interventions aimed at enhancing data‐informed health system management. There is a gap in interventions studying information support beyond clinical management, such as for human resources, finances, drug supply and governance. We need to have a better understanding of the causal mechanisms by which information support may affect change in management decision‐making, to inform robust intervention design and evaluation methods.
Keywords: Bias; Clinical Laboratory Information Systems; Clinical Laboratory Information Systems/organization & administration; Clinical Laboratory Information Systems/standards; Computers, Handheld; Data Collection; Data Collection/standards; Decision Making; Delivery of Health Care; Delivery of Health Care/organization & administration; Delivery of Health Care/standards; Drug Information Services; Drug Information Services/standards; Health Information Systems; Health Information Systems/standards; Hospital Information Systems; Hospital Information Systems/standards; Microbial Sensitivity Tests; Organizational Innovation; Organizational Policy; Pharmaceutical Preparations; Pharmaceutical Preparations/supply & distribution; Quality Improvement; Randomized Controlled Trials as Topic; Text Messaging; Text Messaging/standards; Tuberculosis; Tuberculosis/diagnosis; Tuberculosis/drug therapy
Plain language summary
Making improvements to routine health information systems to strengthen the management of health systems
For health services and systems to function well, managers need a routine information system that produces reliable information about how well these services are working and that supports the use of this information to improve services. The aim of this Cochrane Review was to see if different ways of improving the routine information system could improve the quality and use of this information and the quality and use of health services. The review authors collected and analysed all relevant studies to answer this question and found six studies.
Key messages
Moving from paper‐based information systems to electronic and digital systems probably allows staff at healthcare facilities to collect some types of routine health information faster and with fewer mistakes. But there are many evidence gaps, and we still need to know more about the effect of different approaches on information quality and use and on the quality of healthcare services and the broader health system.
What was studied in the review?
Staff at healthcare facilities usually routinely collect information about the services they provide. This often includes information about their patients’ health and the type of treatments and tests they receive. Managers at different levels of the health system also collect information, for instance about human resources, finances, medicines and supply systems. Managers can then use this information to make decisions about how to organise and improve the services. This is referred to as a “routine health information system”. It is often a paper‐based system, but information can also be gathered through electronic systems.
In many countries, these routine systems do not work well. This is often because the information is of poor quality or not that useful. Where good quality information is available, managers do not always use the information effectively to improve services. This may be because they have problems accessing the information, they lack the skills to use the information correctly, or they are not encouraged or supported in their use of the information.
In this review, we looked at different ways of improving routine health information systems and the effect this has on the quality and use of the information and the quality of healthcare services and the broader health system.
What are the main results of the review?
The review authors found six relevant studies from countries in Africa and South America. Some of the studies assessed whether electronic systems were better than paper‐based systems. Some of the studies also looked at other ways of improving the system, for instance by using SMS mobile‐phone systems to help health workers and other staff notify central systems about supply levels, register patients, or monitor patients’ health.
What effect do these types of systems have on the quality and use of the information that is collected and on health service and systems quality?
‐ When healthcare staff use electronic and digital information systems to document and communicate tuberculosis (TB) laboratory test results, compared to paper‐based systems, test results are probably reported faster and with fewer mistakes overall. But we do not know if these new systems lead to fewer serious mistakes (such as giving the wrong test results for a patient when moving information from the laboratory system to the clinic system), because the certainty of the evidence is very low.
‐ When community health workers are sent frequent text‐messages (SMS) motivating them to collect information about pregnancies, births and newborn deaths, this may make little or no difference to the quality of the information that is reported, compared to less frequent messages.
We do not know what the effects of other approaches to system improvements are on information quality and use or on the quality of the services because evidence is lacking or of very low certainty.
How up to date is this review?
The review authors searched for studies that had been published up to May 2019.
Summary of findings
Summary of findings 1. Web‐based electronic TB laboratory information system compared to a paper‐based system.
| Web‐based electronic TB laboratory information system compared to a paper‐based system for a TB control programme | ||||||
|
Patient or population: health‐district‐wide electronic TB laboratory information system for improving the timeliness of test results and treatment in the TB control programme
Setting: health centres in 2 district in Lima, Peru
Intervention: district‐wide e‐Chasqui, a web‐based electronic laboratory information system that communicates TB results to clinicians and public health administrators to monitor TB care services and health outcomes Comparison: district‐wide paper‐based TB laboratory information system | ||||||
| Outcomes | Anticipated absolute effects* (95% CI) | Relative effect (95% CI) | № of participants (studies) | Certainty of the evidence (GRADE) | Results in words | |
| Risk with control | Risk with web‐based electronic information system | |||||
| Data quality | ||||||
| Length of time to report TB culture test results | Median: 8 days | Median: 5 days | HR 0.68 (0.65 to 0.72) | 1671 patients (1 RCT)a |
⊕⊕⊕⊝ MODERATEb | A web‐based electronic TB laboratory information system probably reduces the length of time to reporting of TB culture test results compared to a paper‐based system.c |
| Length of time to report TB drug susceptibility test results | Median: 17 days | Median: 11 days | HR 0.67 (0.62 to 0.72) | 1671 patients (1 RCT)a |
⊕⊕⊕⊝ MODERATEb | A web‐based electronic TB laboratory information system probably reduces length of time to reporting of TB drug susceptibility test results compared with a paper‐based system. |
| Recording errors of TB culture test results (Overall) | 151 per 1000 | 23 per 1000 (12 to 41) | OR 0.13 (0.07 to 0.24) | 1195 records (1 RCT)a |
⊕⊕⊕⊝ MODERATEb | A web‐based electronic laboratory information system probably reduces the overall rate of recording errors of TB culture test results, compared to a paper‐based system.d |
| Recording errors of TB drug susceptibility test results (Overall) | 119 per 1000 | 23 per 1000 (12 to 42) | OR 0.17 (0.09 to 0.32) | 1270 records (1 RCT)a |
⊕⊕⊕⊝ MODERATEb | A web‐based electronic laboratory information system probably reduces the overall rate or recording errors of TB drug susceptibility test results compared to a paper‐based system.d |
| Recording errors: misidentification errors for TB culture test resultse | 18 per 1000 | 21 per 1000 (9 to 49) | OR 1.15 (0.47 to 2.81) | (1 RCT)a | ⊕⊝⊝⊝ VERY LOW b,f | We are uncertain about the effect of a web‐based electronic laboratory information system on the recording rate of misidentification errors for TB culture test results compared to a paper‐based system (that is, the accuracy of transferring TB culture test results between an electronic register and patients' clinical charts). |
| Recording errors: misidentification errors for TB drug susceptibility test resultse | 20 per 1000 | 22 per 1000 (9 to 50) | OR 1.10 (0.46 to 2.63) | (1 RCT)a | ⊕⊝⊝⊝ VERY LOW b,f | We are uncertain about the effect of a web‐based electronic laboratory information system on the recording rate of misidentification errors for TB drug susceptibility test results compared to the paper‐based system. |
| Service quality | ||||||
| Timeliness of starting or changing a patient's TB treatment | Median: 77 days | Median: 88 days | HR 0.82 (0.55 to 1.22) | 1671 patients (1 RCT)a |
⊕⊝⊝⊝ VERY LOW b,f | We are uncertain about the effects of a web‐based electronic laboratory information system on the timeliness of starting or changing a patient's TB treatment compared to a paper‐based system |
| Information use | ||||||
| The included study for this comparison did not report on this outcome | ||||||
| Functioning of the RHIS | ||||||
| The included study for this comparison did not report on this outcome | ||||||
| Utilisation and coverage of and access to health services | ||||||
| The included study for this comparison did not report on this outcome | ||||||
| Performance of components of the health systems | ||||||
| The included study for this comparison did not report on this outcome | ||||||
| Health provider outcomes | ||||||
| The included study for this comparison did not report on this outcome | ||||||
| *The risk in the intervention group (and its 95% CI) is based on the assumed risk in the comparison group and the relative effect of the intervention (and its 95% CI). CI: Confidence interval; RR: Risk ratio; OR: Odds ratio; HR: Hazard ratio | ||||||
| GRADE Working Group grades of evidence High certainty: we are very confident that the true effect lies close to that of the estimate of the effect Moderate certainty: we are moderately confident in the effect estimate: the true effect is likely to be close to the estimate of the effect, but there is a possibility that it is substantially different Low certainty: our confidence in the effect estimate is limited: the true effect may be substantially different from the estimate of the effect Very low certainty: we have very little confidence in the effect estimate: the true effect is likely to be substantially different from the estimate of effect | ||||||
aBlaya 2014 (availability and accuracy outcomes reported in additional secondary publications Blaya 2010 and Blaya 2011)
bDowngraded by 1 for indirectness: Since this is a single study conducted in 1 setting, it is likely that the effects are strongly influenced by the systems and other contextual arrangements in this setting
cWhen the results were stratified by HC type, the intervention effect was greater in point‐of‐care HCs (HR 0.55, 95% CI 0.49 to 0.61) than in peripheral HCs (HR 1.22, 95% CI 0.96 to 1.54).
d The overall error rate was measured by combining 3 types of errors: Error 1, 'missing' test results ‒ where results were not available for viewing at the time of assessment ‒ and 2 types of 'misidentification' errors: Error 2, inaccuracies in recording of the patient identifying details between the laboratory register and the patient clinical chart; and Error 3, inaccuracies in recording of the TB test result between the laboratory register and the patient clinical chart. Errors 2 and 3 are referred to as 'misidentification' errors. The biggest change was reducing 'missing' results due to staff being able to immediately view test results electronically in intervention sites, as compared to the control site without the point‐of‐care electronic system. The reduction in missing results (as opposed to inaccuracies in recording results) accounted for between 72% and 86% of all the difference found between intervention and control sites.
eThis is in relation to 2 types of 'misidentification errors' (considered serious errors) when comparing the data in the electronic laboratory register against the patient clinical chart (paper‐based); 1 error is in recording of patient identifying information, and the other is errors in recording the test result.
f Downgraded by 2 for serious imprecision: the confidence interval is wide with an unclear direction of effect.
Summary of findings 2. Hand‐held electronic device for collecting TB laboratory information compared to a paper‐based system.
| Hand‐held electronic device for collecting TB laboratory information compared to a paper‐based system for a TB control programme | ||||||
|
Patient or population: health district personnel using a hand‐held PDA electronic data collection tool to improve the quality and timeliness of collecting district‐wide TB test results. Settings: 4 health districts in Peru Intervention: a hand‐held personal digital assistant (PDA)‐based electronic information collection system for TB test result. They designed and implemented an electronic bacteriology collection system using low‐cost PDA‐based system as the initial point of data entry at the clinical site in an effort to decrease delay time and errors. Bacteriology team members using the new system visited a health centre or laboratory and copied data directly from the laboratory register or chart using the PDA. Comparison: paper‐based TB test result data collection system | ||||||
| Outcomes | Anticipated absolute effects* (95% CI) | Relative effect (95% CI) | № of participants (studies) | Certainty of the evidence (GRADE) | Results in words | |
| Risk with control | Risk with hand‐held electronic device | |||||
| Data quality | ||||||
| Length of time to report TB culture test results | The mean culture collection time was 35.1 days. | MD 25.2 days less (26.8 less to 23.6 less) | ‐ | 6153 cultures (1 RCT)a |
⊕⊕⊝⊝ MODERATEb,c | A hand‐held electronic device probably improves the length of time to report TB culture test results compared to a paper‐based test system. |
| Length of time to report TB smear test results | The mean smear collection time was 34.3 days. | MD 19.3 days less (20.7 less to 17.9 less) | ‐ | 6226 microscopies (1 RCT)a |
⊕⊕⊝⊝ MODERATEb,c | A hand‐held electronic device probably improves the length of time to report TB smear test results compared to a paper‐based test system. |
| Recording errorsd | 61 per 1000 | 26 per 1000 (17 to 40) |
OR 0.41 (0.26 to 0.65) |
2082 cultures and smears (1 RCT)a |
⊕⊕⊝⊝ MODERATEb,c | When collecting TB test results, a hand‐held electronic device probably reduces the total frequency of recording errors, compared to a paper‐based system. There was a 59% reduction in the total frequency of test result collection errors in intervention sites, as compared to the control sites. |
| Recording errors: misidentification errorse | 6 per 1000 | 1 per 1000 (0 to 7) |
OR 0.14 (0.02 to 1.20) |
2082 cultures and smears (1 RCT)a |
⊕⊝⊝⊝ VERY LOWb,c,f | We are uncertain about the effect of a hand‐held electronic device on the frequency of misidentification errors. |
| Service quality | ||||||
| The included study for this comparison did not report on this outcome. | ||||||
| Information use | ||||||
| The included study for this comparison did not report on this outcome | ||||||
| Functioning of the RHIS | ||||||
| The included study for this comparison did not report on this outcome | ||||||
| Utilisation and coverage of and access to health services | ||||||
| The included study for this comparison did not report on this outcome | ||||||
| Performance of components of the health systems | ||||||
| The included study for this comparison did not report on this outcome | ||||||
| Health provider outcomes | ||||||
| The included study for this comparison did not report on this outcome | ||||||
| *The risk in the intervention group (and its 95% CI) is based on the assumed risk in the comparison group and the relative effect of the intervention (and its 95% CI). CI: Confidence interval; RR: Risk ratio; OR: Odds ratio; MD: Mean difference | ||||||
| GRADE Working Group grades of evidence High certainty: we are very confident that the true effect lies close to that of the estimate of the effect Moderate certainty: we are moderately confident in the effect estimate: the true effect is likely to be close to the estimate of the effect, but there is a possibility that it is substantially different Low certainty: our confidence in the effect estimate is limited: the true effect may be substantially different from the estimate of the effect Very low certainty: we have very little confidence in the effect estimate: the true effect is likely to be substantially different from the estimate of effect | ||||||
bDowngraded by 1 for risk of bias: the risk of bias was unclear for several items due to poor reporting.
cDowngraded by 1 for indirectness: since this is a single study conducted in one setting, it is likely that the effects are strongly influenced by the systems and other contextual arrangements in this setting.
d A recording error was defined as an occurrence of information entered into the PIH‐EMR electronic information system, not matching the original laboratory notebook, with the laboratory notebook considered to be the gold standard for accuracy. This was for all types of errors, including result date, identity number, test result and if result was assigned to the wrong patient. Assigning the test result to the wrong patient is a 'misidentification' error, which was considered a serious error. Recording errors refers to all errors, including misidentification errors.
e 'Misidentification' error is a recording error when the test result is assigned to the wrong patient when entered into the PIH‐EMR electronic information system from the laboratory notebook, which is considered a serious error.
f Downgraded by 1 for imprecision: The confidence interval was wide with an unclear direction of effect.
Summary of findings 3. Electronic hospital health information system compared to a paper‐based health information system.
| Electronic hospital health information system compared to a paper‐based health information system | ||||||
|
Patient or population: electronic hospital health information to improve hospital functioning Settings: 23 hospitals in Limpopo province, South Africa Intervention: electronic hospital information system Comparison: paper‐based hospital information system | ||||||
| Outcomes | Anticipated absolute effects* (95% CI) | Relative effect (95% CI) | № of participants (studies) | Certainty of the evidence (GRADE) | Results in words | |
| Risk with control | Risk with electronic hospital information system | |||||
| Service quality | ||||||
| Length of time outpatients spend at hospital | The median time that outpatients spent in control hospitals increased from 1.31 hours to 1.34 hours (a change of 0.03 hours). | The median time that outpatients spent in intervention hospital increased from 1.25 hours to 1.39 hours (a change of 0.14 hours). | DID: 0.11 hours | 23 hospitals (1 CBA)a |
⊕⊝⊝⊝ VERY LOWb,c | We are uncertain about the effect of an electronic hospital information system on outpatient hospital time compared to a paper‐based system. |
| Length of hospital stay | The median length of stay in control hospitals increased from 5 days to 6.1 days (a change of 1.1 days). | The median length of stay in intervention hospitals decreased from 4.8 days to 4.5 days (a change of 0.3 days). | DID:−0.8 days | 23 hospitals (1 CBA)a |
⊕⊝⊝⊝ VERY LOWb,c | We are uncertain about the effect of an electronic hospital information system on the length of hospital stay for patients compared to a paper‐based system. |
| Revenue collection | The median revenue collected at control hospitals increased from ZAR 53,289.50 to ZAR 59,210.50 (a change of ZAR 5921.00). | The median revenue collected at intervention hospitals increased from ZAR 130,263.00 to ZAR 148,026.00 (a change of ZAR 17,763.00). | DID: ZAR 11,842.00 |
23 hospitals (1 CBA)a |
⊕⊝⊝⊝ VERY LOWb,c | We are uncertain about the effect of an electronic hospital information system on hospital revenue collection compared to a paper‐based system. |
| Data quality | ||||||
| The included study for this comparison did not report on this outcome. | ||||||
| Information use | ||||||
| The included study for this comparison did not report on this outcome | ||||||
| Functioning of the RHIS | ||||||
| The included study for this comparison did not report on this outcome | ||||||
| Utilisation and coverage of and access to health services | ||||||
| The included study for this comparison did not report on this outcome | ||||||
| Performance of components of the health systems | ||||||
| The included study for this comparison did not report on this outcome | ||||||
| Health provider outcomes | ||||||
| The included study for this comparison did not report on this outcome | ||||||
| *The risk in the intervention group (and its 95% CI) is based on the assumed risk in the comparison group and the relative effect of the intervention (and its 95% CI).CI: Confidence interval; RR: Risk ratio; OR: Odds ratio; DID: Difference‐in‐difference | ||||||
| GRADE Working Group grades of evidence High certainty: we are very confident that the true effect lies close to that of the estimate of the effect Moderate certainty: we are moderately confident in the effect estimate: the true effect is likely to be close to the estimate of the effect, but there is a possibility that it is substantially different Low certainty: our confidence in the effect estimate is limited: the true effect may be substantially different from the estimate of the effect Very low certainty: we have very little confidence in the effect estimate: the true effect is likely to be substantially different from the estimate of effect | ||||||
bDowngraded by 2 for risk of bias: this study did not provide enough study detail on several risk of bias items e.g. missing data, blinding, reporting bias, etc. The study did not test differences between arms except for one outcome (bed occupancy).
cDowngraded by 1 for indirectness: since this is a single study conducted in one setting, it is likely that the effects are strongly influenced by the systems and other contextual arrangements in this setting.
Summary of findings 4. High‐intensity brief text messaging (SMS) compared to low‐intensity brief text messaging.
| High‐intensity brief text messaging (SMS) compared to low‐intensity brief text messaging for community‐based surveillance of pregnancy outcomes | ||||||
|
Patient or population: Community health care workers, known as Health Surveillance Assistants (HSAs) (n = 156) associated with 30 health facilities. Settings: 2 districts, Balaka and Salima, in Malawi. Intervention: high‐intensity brief text messaging (SMS) included motivational content and data quality guidelines, was compared to less frequent, minimal‐intensity brief‐text messaging (that included only motivational content), as a job aid for HSAs to do community‐based documentation of vital events for pregnancy outcomes. Comparison: control group received minimal intensity brief‐text messaging with only motivational content. | ||||||
| Outcomes | Anticipated absolute effects* (95% CI) | Relative effect (95% CI) | № of participants (studies) | Certainty of the evidence (GRADE) | Results in words | |
| Risk with control | Risk with high‐intensity brief text messaging | |||||
| Data quality | ||||||
| Documenting of matched pregnancy outcome data | 694 per 1000 | 680 per 1000 (588 to 760) | OR 0.94 (0.63 to 1.38) | 10,934 records (1 RCT)a | ⊕⊕⊝⊝ LOWb,c | High‐intensity SMS brief text messaging (with motivational content and data quality guidelines) may make little or no difference to the completeness of documentation of matched pregnancy outcomes, compared to a lower intensity SMS intervention. |
| Service quality | ||||||
| The included study for this comparison did not report on this outcome | ||||||
| Information use | ||||||
| The included study for this comparison did not report on this outcome | ||||||
| Functioning of the RHIS | ||||||
| The included study for this comparison did not report on this outcome | ||||||
| Utilisation and coverage of and access to health services | ||||||
| The included study for this comparison did not report on this outcome | ||||||
| Performance of components of the health systems | ||||||
| The included study for this comparison did not report on this outcome | ||||||
| Health provider outcomes | ||||||
| The included study for this comparison did not report on this outcome | ||||||
| *The risk in the intervention group (and its 95% CI) is based on the assumed risk in the comparison group and the relative effect of the intervention (and its 95% CI). CI: Confidence interval; RR: Risk ratio; OR: Odds ratio | ||||||
| GRADE Working Group grades of evidence High certainty: we are very confident that the true effect lies close to that of the estimate of the effect Moderate certainty: we are moderately confident in the effect estimate: the true effect is likely to be close to the estimate of the effect, but there is a possibility that it is substantially different Low certainty: our confidence in the effect estimate is limited: the true effect may be substantially different from the estimate of the effect Very low certainty: we have very little confidence in the effect estimate: the true effect is likely to be substantially different from the estimate of effect | ||||||
bDowngraded by 1 for indirectness: Study assessed only a particular version of the intervention i.e. data reporting completion rates and provide a partial answer to the review question in terms of the effect on health system management.
cDowngraded by 1 for imprecision: The confidence interval was wide with an unclear direction of effect.
Summary of findings 5. Electronic drug stock notification system with data management support compared to paper‐based stock notification.
| Electronic drug stock notification system with data management support compared to a paper‐based system for community‐based health services | ||||||
|
Patient or population: community‐based health care workers, known in Malawi as Health Surveillance Assistants (HSAs) managing medicines and other medical products for community‐based treatment of common childhood illnesses.
Setting: 248 HSAs in 10 districts Malawi.
Intervention: cStock is an SMS and web‐based electronic drug stock notification system for monitoring drug supply for community‐based health care services. It calculates and reports drug re‐supply quantities to allow HSAs to notify and pick up the required amounts of drugs and other medical products from health facilities. The intervention had an Enhanced management (EM) component where quality improvement teams used the cStock data to make informed supply chain decisions. These interventions are aimed at improving data visibility and reducing stock outs of health products at the community level. Comparison: standard paper‐based stock notification processes (without any SMS‐based or additional management support). | ||||||
| Outcomes | Anticipated absolute effects* (95% CI) | Relative effect** (95% CI) | № of participants (studies) | Certainty of the evidence (GRADE) | Results in words | |
| Risk with control | Risk with electronic drug stock notification plus data management support | |||||
| Service quality | ||||||
| Functioning bicycles for transporting stock | 73% of bicycles were functioning | 70% of bicycles were functioning | Not estimable | 132 (1 CBA)a | ⊕⊝⊝⊝ VERY LOWb,c | We are uncertain about the effect of electronic stock notification plus data management support on the proportion of functioning bicycles for transporting stock compared to a paper‐based system. |
| Health surveillance assistants with all 3 products in stock | The proportion of HSAs with all 3 products in stock increased from 53% to 74% (a change of 21%). | The proportion of HSAs with all 3 products in stock increased from 36% to 73% (a change of 37%). | DID: 16% | 484 (1 CBA)a | ⊕⊝⊝⊝ VERY LOWb,c | We are uncertain about the effects of electronic stock notification plus data management support on the proportion of HSAs with all 3 products in stock compared to a paper‐based system. |
| Health surveillance assistants with all 4 products in stock | The proportion of HSAs with all 4 products in stock increased from 32% to 61% (a change of 29%). | The proportion of HSAs with all 4 products in stock increased from 28% to 63% (a change of 35%). | DID: 6% | 484 (1 CBA)a | ⊕⊝⊝⊝ VERY LOWb,c | We are uncertain about the effect of electronic stock notification plus data management support on the proportion of HSAs with all four products in stock compared to a paper‐based system. |
| Data quality | ||||||
| The included study for this comparison did not report on this outcome | ||||||
| Information use | ||||||
| The included study for this comparison did not report on this outcome | ||||||
| Functioning of the RHIS | ||||||
| The included study for this comparison did not report on this outcome | ||||||
| Utilisation and coverage of and access to health services | ||||||
| The included study for this comparison did not report on this outcome | ||||||
| Performance of components of the health systems | ||||||
| The included study for this comparison did not report on this outcome | ||||||
| Health provider outcomes | ||||||
| The included study for this comparison did not report on this outcome | ||||||
| *The risk in the intervention group (and its 95% CI) is based on the assumed risk in the comparison group and the relative effect of the intervention (and its 95% CI).
** Difference‐in‐difference (DID) is calculated as (Post‐Intervention% – Pre‐Intervention%) – (Post‐Control% – Pre‐Control%) CI: Confidence interval; RR: Risk ratio; OR: Odds ratio; DID: Difference‐in‐difference | ||||||
| GRADE Working Group grades of evidence High certainty: we are very confident that the true effect lies close to that of the estimate of the effect Moderate certainty: we are moderately confident in the effect estimate: the true effect is likely to be close to the estimate of the effect, but there is a possibility that it is substantially different Low certainty: our confidence in the effect estimate is limited: the true effect may be substantially different from the estimate of the effect Very low certainty: we have very little confidence in the effect estimate: the true effect is likely to be substantially different from the estimate of effect | ||||||
bDowngraded by 2 for risk of bias: key risk of bias items not reported and high risk for other items.
cDowngraded by 1 for indirectness: since this is a single study conducted in one setting, it is likely that the effects are strongly influenced by the systems and other contextual arrangements in this setting.
Summary of findings 6. Electronic drug stock notification system with product transport support compared to paper‐based stock notification.
| Electronic drug stock notification system with product transport support compared to a paper‐based system for community‐based health services | ||||||
|
Patient or population: community‐based health care workers, known in Malawi as Health Surveillance Assistants (HSAs) managing medicines and other medical products for community‐based treatment of common childhood illnesses
Setting: 248 HSAs in 10 districts Malawi
Intervention: cStock is a drug stock notification system that is SMS and web‐based, for monitoring drug supply. It calculates and reports drug re‐supply quantities to allow for HSAs to pick up the required amounts of drugs and other medical products from health facilities. This intervention had a Efficient product transport (EPT) component which provided HSAs with training and a toolkit for bicycle maintenance (for collecting medicines from nearby health facilities), and training in the use of a continues inventory control system. These interventions are aimed at improving data visibility and reducing stock outs of health products at the community level. Comparison: standard paper‐based stock notification processes (without any SMS‐based or additional intervention) | ||||||
| Outcomes | Anticipated absolute effects* (95% CI) | Relative effect** (95% CI) | № of participants (studies) | Certainty of the evidence (GRADE) | Results in words | |
| Risk with control | Risk with electronic stock notification plus product transport support | |||||
| Service quality | ||||||
| Functioning bicycles for transporting stock | 73% of bicycles were functioning | 77% of bicycles were functioning | Not estimable | 136 (1 CBA)a | ⊕⊝⊝⊝ VERY LOWb,c | We are uncertain about the effect of electronic stock notification plus product transport support on the proportion of functioning bicycles for transporting stock compared to a paper‐based system. |
| Health surveillance assistants with all 3 products in stock | The proportion of HSAs with all three products in stock increased from 53% to 80% (a change of 27%). | The proportion of HSAs with all three products in stock increased from 17% to 76% (a change of 59%). | DID: 32% | 326 (1 CBA)a | ⊕⊝⊝⊝ VERY LOWb,c | We are uncertain about the effect of electronic stock notification plus product transport support on the proportion of HSAs with all three products in stock compared to a paper‐based system. |
| Health surveillance assistants with all 4 products in stock | The proportion of HSAs with all four products in stock increased from 32% to 63% (a change of 31%). | The proportion of HSAs with all four products in stock increased from 39% to 61% (a change of 52%). | DID: 21% | 326 (1 CBA)a | ⊕⊝⊝⊝ VERY LOWb,c | We are uncertain about the effect of electronic stock notification plus product transport support on the proportion of HSAs with all four products in stock, compared to a paper‐based system. |
| Data quality | ||||||
| The included study for this comparison did not report on this outcome | ||||||
| Information use | ||||||
| The included study for this comparison did not report on this outcome | ||||||
| Functioning of the RHIS | ||||||
| The included study for this comparison did not report on this outcome | ||||||
| Utilisation and coverage of and access to health services | ||||||
| The included study for this comparison did not report on this outcome | ||||||
| Performance of components of the health systems | ||||||
| The included study for this comparison did not report on this outcome | ||||||
| Health provider outcomes | ||||||
| The included study for this comparison did not report on this outcome | ||||||
| *The risk in the intervention group (and its 95% CI) is based on the assumed risk in the comparison group and the relative effect of the intervention (and its 95% CI).
** Difference‐in‐difference (DID) is calculated as (Post‐Intervention% – Pre‐Intervention%) – (Post‐Control% – Pre‐Control%) CI: Confidence interval; RR: Risk ratio; OR: Odds ratio; DID: Difference‐in‐difference | ||||||
| GRADE Working Group grades of evidence High certainty: We are very confident that the true effect lies close to that of the estimate of the effect Moderate certainty: We are moderately confident in the effect estimate: The true effect is likely to be close to the estimate of the effect, but there is a possibility that it is substantially different Low certainty: Our confidence in the effect estimate is limited: The true effect may be substantially different from the estimate of the effect Very low certainty: We have very little confidence in the effect estimate: The true effect is likely to be substantially different from the estimate of effect | ||||||
bDowngraded by 2 for risk of bias: key risk of bias items not reported and high risk for other items.
cDowngraded by 1 for indirectness: since this is a single study conducted in one setting, it is likely that the effects are strongly influenced by the systems and other contextual arrangements in this setting.
Summary of findings 7. Health information strengthening as part of comprehensive quality improvement compared to no quality improvement.
| Health information strengthening intervention as part of comprehensive quality improvement (QI) compared to no quality improvement intervention | |||||||
| Patient or population: intervention health facilities (n = 24 health facilities) Setting: 3 rural districts in Zambia Intervention: Better Health Outcomes through Mentoring and Assessment (BHOMA), a multi‐component intervention aimed at reducing under‐five mortality, through clinical quality improvement (QI) activities. QI activities included strengthening routine data collection at facility and community level via an electronic health record system and introducing community‐based data collectors and "clinic supporters" for clinical and administrative support with record keeping. A Balanced score card (BSC) measurement was used to rank the performance of facilities using BSC domain scores. Comparison: Control sites (n = 8 health facilities), with no BHOMA intervention | |||||||
| Outcomes | Anticipated absolute effects* (95% CI) | Relative effect (95% CI) | № of participants (studies) | Certainty of the evidence (GRADE) | Results in words | ||
| Risk with control | Risk with health information strengthening intervention | ||||||
| Service quality | |||||||
| Health worker motivation a | The mean health worker motivation score was 77.2 %. | MD 1.2 lower (6.5 lower to 4.1 higher) | ‐ | (1 RCT)b | ⊕⊝⊝⊝ VERY LOW c,d,e | We are uncertain about the effect of health information strengthening intervention on health worker motivation compared to no intervention. | |
| Receipt of training by health workers f | The mean health worker training score was 61.1 %. | MD 23.3 higher (2.3 lower to 44.3 higher) | ‐ | (1 RCT)b | ⊕⊝⊝⊝ VERY LOW c,d,e | We are uncertain about the effect of health information strengthening intervention on health worker training, compared to no intervention. | |
| Health information indexg | The mean health information index was 56.8. | MD 7.3 higher (2.6 lower to 12 higher) | ‐ | (1 RCT)b | ⊕⊝⊝⊝ VERY LOW c,d,e | We are uncertain about the effect of health information strengthening intervention on health information index scores, compared to no intervention. | |
| Quality of clinical observation ‐ childrenh | The mean clinical observation index (children) was 65.6. | MD 9.6 higher (6.6 lower to 25.8 higher) | ‐ | (1 RCT)b | ⊕⊝⊝⊝ VERY LOW c,d,e | We are uncertain about the effect of health information strengthening intervention on the quality of clinical observation of children compared to no intervention. | |
| Quality of clinical observation ‐ adultsi | The mean clinical observation index (adults) was 58.0. | MD 10.9 higher (2.13 lower to 19.67 higher) | ‐ | (1 RCT)b | ⊕⊝⊝⊝ VERY LOW c,d,e | We are uncertain about the effect of health information strengthening intervention on the quality of clinical observation of adults, compared to no intervention. | |
| Data quality | |||||||
| The included study for this comparison did not report on this outcome | |||||||
| Information use | |||||||
| The included study for this comparison did not report on this outcome | |||||||
| Functioning of the RHIS | |||||||
| The included study for this comparison did not report on this outcome | |||||||
| Utilisation and coverage of and access to health services | |||||||
| The included study for this comparison did not report on this outcome | |||||||
| Performance of components of the health systems | |||||||
| The included study for this comparison did not report on this outcome | |||||||
| Health provider outcomes | |||||||
| The included study for this comparison did not report on this outcome | |||||||
| *The risk in the intervention group (and its 95% CI) is based on the assumed risk in the comparison group and the relative effect of the intervention (and its 95% CI). CI: Confidence interval; RR: Risk ratio; OR: Odds ratio; MD: Mean Difference | |||||||
| GRADE Working Group grades of evidence High certainty: we are very confident that the true effect lies close to that of the estimate of the effect Moderate certainty: we are moderately confident in the effect estimate: the true effect is likely to be close to the estimate of the effect, but there is a possibility that it is substantially different Low certainty: our confidence in the effect estimate is limited: the true effect may be substantially different from the estimate of the effect Very low certainty: we have very little confidence in the effect estimate: the true effect is likely to be substantially different from the estimate of effect | |||||||
aAs measured by questionnaire including factors like job satisfaction, burnout etc.
cDowngraded by 1 for risk of bias: There is insufficient evidence to assess several of the risk of bias items. There is also insufficient information on how certain outcomes were measured. This was an interim analysis of a step‐wedge design resulting in uneven intervention exposure between sites. There was no evidence that the measurement tools were validated.
d Downgraded by 1 for indirectness: Since this is a single study conducted in one setting, it is likely that the effects are strongly influenced by the systems and other contextual arrangements in this setting.
e Downgraded by 1 for imprecision since the CIs include both benefit and harm and thresholds for meaningful benefit or harm are not described.
f health worker training attended in the past 12 months
g as measured with a Health Information Index tool (but the tool was not provided, so we do not know the details of what it measured)
h as measured by a Children clinical observation checklist
i as measured by a Adult observation checklist
Background
Description of the condition
A well‐functioning routine health information system (RHIS) is required to provide the information needed for governance and management of health systems and services; to make decisions for planning, monitoring and evaluation, and quality improvement (Chaudhry 2006; Dixon‐Woods 2013; Leatherman 2010; Riley 2012; WHO 2008; Kebede 2010; Willis 2013). Yet, poor information support has been identified as a major health care management obstacle (Hotchkiss 2010; Hotchkiss 2012; Lau 2010; Mutale 2013; Rahimi 2009; Sligo 2017; Tursunbayeva 2017; Wagenaar 2017; WHO 2007; WHO 2008). Many countries, especially in low‐ and middle‐income settings, lack well‐functioning information sub‐systems within their wider health systems (Hotchkiss 2010; Hotchkiss 2012; Littlejohns 2003; Kebede 2010). Problems include production of poor data quality and poor applicability of data (for example, incomplete, inaccurate, irrelevant, or inaccessible data), that does not fulfil the needs of decision‐makers. Fragmentation, duplication, and excessive production of data can become a burden on health providers and managers, and a barrier to effective information use. Even where there is production of useable health information, there may still be a lack of data‐informed decision‐making. Problems may include poor feedback mechanisms or limited motivation, or capacity for using data in health system management decision‐making (Aqil 2009; Hotchkiss 2010; Hotchkiss 2012; Lippeveld 1997; Sligo 2017; Wagenaar 2017; Kebede 2010).
Given the centrality of routine information for management decision‐making, and the challenge to decision‐making when these systems are not optimal, we need to know what works in what settings, for routine health information systems (RHISs) to effectively support health system management decision‐making (Aqil 2009; Hotchkiss 2010; Hotchkiss 2012; Sligo 2017; Tursunbayeva 2017; WHO 2010). Synthesised evidence of research studies that evaluate interventions aimed at addressing this challenge, in part or in full, may assist in offering solutions for improving RHIS for strengthened health system management.
Description of the intervention
A health information system is a set of components (technical, organisational, behavioural) and procedures “organized with the objective of generating information which will improve health care management decisions at all levels of the health system” (Lippeveld 2000). For example, data on antenatal and postnatal care may be routinely collected by health care providers as part of patient records, and this anonymised data might then be fed into a district and national electronic information system by facility clerks, where the data may then be checked by higher level administrators for accuracy. Health service and systems managers may then use the cleaned data, presented in graphic or tabular format, to monitor national or sub‐national trends for antenatal and postnatal care, and may even use this to inform discussions with regional or global health bodies. By contrast, large scale surveys on prevalence of a disease would not be considered routine health information, as it is not collected routinely for operational management, even though the output may also be used for decision‐making. Routine health information can consist of a variety of data sources which may be collected over regular time periods (monthly, quarterly, annually), including information related to clinical service delivery (for example, clinical registers, laboratory, and other diagnostic services record systems), as well as routine administrative record systems (for example, staff time sheets). Routine data on health service delivery, utilisation and clinical outcomes are most commonly reported on, but an RHIS also includes routine data sets pertaining to other health system functions. The World Health Organization (WHO) health systems building blocks framework identifies information systems for management of human resources, finance, medicine and equipment supply chains, and governance and management (WHO 2010).
How the intervention might work
This review focuses on interventions to improve the RHIS for strengthened health system management. These interventions can occur anywhere on the continuum of information support, with the aim of data use for health system management and improvement. The continuum of informational support activities may include building capacity in the core data management and use competencies (collection, validation, synthesis, analysis and interpretation, critical review of data and data‐informed decision‐making), strengthening organisational culture and practice of monitoring and evaluation, and for communication on data use interventions (Hotchkiss 2010; Hotchkiss 2012; Nutley 2013; Nutley 2014; Wagenaar 2017). RHIS interventions can address any of the components outlined in the Performance of Routine Information System Management (PRISM) framework, which is a conceptual framework to assess, design, strengthen and evaluate the RHIS (Aqil 2009; Hotchkiss 2010). As illustrated in Figure 1, the PRISM framework identifies two main functions of an RHIS (one, production of quality data; and two, effective use of data for decision‐making), and identifies three key domains for strengthening RHIS interventions: technical; behavioural; and organisational. Table 8, outlines a range of possible interventions for each of these domains. Technical interventions to improve a RHIS are usually aimed at improving the technical design, infrastructure, and mechanisms such as formats for documentation, storing and transferring information, be it paper‐based or electronic systems. Behavioural interventions are aimed at enhancing the motivation and competence of personnel to collect, extract and use data effectively. Organisational interventions are aimed at strengthening the organisational rules, values and support practices aimed at building a culture of data use for decision‐making. Thus a strong RHIS can be achieved through improvement in either or both data production (quality and accessibility of data) and data use (the capacity and processes for effective data‐inform decision‐making).
1.

Components of RHISs (adapted from the PRISM Framework)
1. Interventions for improving RHISs.
| RHIS determinants | Interventions |
|
Technical Specialised technical infrastructure, knowledge, skills and procedures required to achieve good quality data. |
Technical infrastructure, processes and skills including:
|
|
Organisational Organisational rules, values and practices that influence the organisational context. |
Organisational culture and practice regarding the RHIS including:
|
|
Behavioural Behavioural factors influencing RHIS tasks, such as demand, confidence, motivation and competence to perform. |
Behavioural factors influencing the functioning and use of the RHIS including:
|
It must be noted that the development, maintenance, and use of a RHIS is not a linear or simply technical process. Instead, RHISs are embedded within complex adaptive health systems, and are sensitive to everything else that occurs in the system, and in turn impact on these systems (Arah 2003; Hotchkiss 2012; Nutley 2013; Sligo 2017; Wagenaar 2017). Furthermore, the components of the intervention may interact with each other. For example, to improve the quality of health service delivery, an RHIS strengthening intervention may involve streamlining data collection tools and data flow systems (technical and organisational components), introduction of new electronic data systems (technical component), combined with motivation, training, and support for clinic managers (behavioural and organisational components) to better use the data for service improvements. We recognise these complexities in this review (though they are not the focus), and will consider them in discussing the findings.
Why it is important to do this review
A number of RHIS studies and systematic reviews have been conducted on various elements of information systems, focusing mostly on electronic clinical information systems for supporting clinical management (including clinical decision‐support tools and computerised prescriber order entry (CPOE) systems), and most show mixed or inconclusive results (Aspry 2013; Bassi 2010; Bassi 2012; Bassi 2013; Black 2011; Boonstra 2010; Chaudhry 2006; DeLone 1992; Dixon‐Woods 2013; Lau 2010; Mutale 2013; Rahimi 2009). In Table 9, we provide a summary of systematic reviews on the effectiveness of health information systems, as well as scoping reviews relevant to our review topic. As shown in Table 9, systematic reviews of RHISs have more often focused on clinical information systems for supporting clinical decision‐making, with few examples of RHIS improvements for strengthening other health system management functions. Further, reviews have tended to focus on interventions for improving production and quality of information, and less on the data use end of the RHIS continuum. This has also meant more focus on assessing technical interventions and technology (for improved data production), as compared to behavioural and organisational interventions for enhancing the use of routine data for health service and system management decision‐making (Aqil 2009; DeLone 1992; Hotchkiss 2012; Rahimi 2009).
2. Summary of relevant systematic reviews on effectiveness of routine health information systems.
| Review ID | Title | Focus | Methods |
| HIS general | |||
| Bosch‐Caplanch 2018* | Effects of interventions to improve health information use systems | A systematic review to synthesise the evidence on interventions to improve information systems in LMICs. Focused on all types of information systems, not only RHIS, and not limited to health system management use. | Experimental, quasi‐experimental |
| Zuske 2017 | Health information use systems: framework synthesis | A systematic literature review and framework synthesis, to map empirical evidence from observational studies on health information, onto a framework of health decision‐making processes. Included studies on clinical, managerial as well as public health decisions, but with a strong focus on clinical decision making. A scoping review to better understand decision making in relation to the supportive function of HIS in the PHC system. | Studies identified as ‘observational’ (excluding experimental and quasi‐experimental) Qualitative studies, some single case studies and project reports |
| Sligo 2017 | A literature review for large‐scale health information system project planning, implementation and evaluation | The literature review focused on the potential challenges and benefits of implementing HIS and the difficulties in evaluating implementation of large scale HIS projects. | Quantitative and qualitative |
| Hotchkiss 2012* | How can routine health information systems improve health systems in low‐resource settings? Assessing the evidence base | The report describes the conceptual literature on the determinants of RHIS performance, discusses the evidence base on the effectiveness of strategies to improve RHIS performance. It provides an overview of RHIS evaluation challenges and makes suggestions to improve the evidence base for enhancing appropriate RHIS design and implementation and effective use. Mixed methods and focused on low‐resources settings. | Quantitative and qualitative |
| HIS with specific scope | |||
| Agarwal 2019* | Tracking health commodity inventory and notifying stock levels via mobile devices | To assess the effects of strategies for notifying stock levels and digital tracking of healthcare‐related commodities and inventory via mobile devices. Secondary objectives were to identify digital mobile strategies in use and identify factors influencing its implementation. Mixed methods. | Quantitative, qualitative and mixed methods |
| Tursunbayeva 2017* | Human resource information systems in health care: a systematic evidence review | This systematic review of literature aimed to determine the prevalence and scope of existing research on human resource information systems (HRIS) in health organizations, and analyse, classify and synthesise evidence on HRIS in health organizations. Mixed methods. | Quantitative, qualitative and mixed methods |
| Riley 2012 | Information systems in human resources for health: a global view | A systematic review of the literature to review national practices in HRIS implementation worldwide; identify the main areas of weakness in HRIS implementation (especially in countries facing acute health workforce shortages), and draw upon documented best practices to offer recommendations to ministries of health and global health policy makers. | Quantitative, qualitative and mixed methods |
| Electronic HIS** | |||
| Black 2011 | The impact of eHealth on the quality and safety of health care: a systematic overview | This is a systematic review of the pre‐existing systematic review literature, on eHealth technologies and their impact on the quality and safety of health care delivery. | Quantitative and mixed‐methods |
| Lau 2010 | A review on systematic reviews of health information system studies | The study consolidated existing evidence from systematic reviews on HIS evaluation studies; focusing on effect of HIS, the quality of HIS studies and the evaluation metrics used. | Quantitative |
| Blaya 2010b | E‐health technologies show promise in developing countries | The goal of this review was to survey evaluations performed on e‐health systems in developing countries, assess their potential impact, and guide future implementations and evaluations. | Quantitative, qualitative and mixed methods |
| Chaudhry 2006 | Systematic review: impact of health information technology on quality, efficiency, and costs of medical care | To systematically review evidence on the effect of health information technology on quality, efficiency, and costs of health care. | Quantitative |
| Electronic HIS with specific scope** | |||
| Aspry 2013 | Effect of health information technology interventions on lipid management in clinical practice: A systematic review of randomised controlled trials | To perform a qualitative review of the impact of health information technology (HIT) interventions on lipid management processes of care or clinical outcomes in outpatients with coronary heart disease or at increased risk. | Quantitative |
*These are the reviews most relevant to our review question, and where there is some overlap (as reported under Agreements and disagreements with other studies or reviews).
** This is not an exhaustive list as there are multiple reviews on electronic HIS with general and limited scope (disease‐specific information systems), with the emphasis on clinical informatics such as clinical support decision‐making tools, and physician order entry systems.
A few effectiveness reviews went beyond technical interventions and clinical informatics, to include information use for management more broadly. A literature review on RHIS interventions for health system management decision‐making, focused on low‐ and middle‐income countries (LMICs), and included a mix of study designs (Hotchkiss 2012). The authors noted limited evidence on which types of information system interventions work, and which do not. They concluded that "Research is needed on the technical, organisational, and behavioural determinants of enhanced demand for information, improved data quality, improved information use, and the role of RHIS in improving health systems functioning" (Hotchkiss 2012). More recently, a systematic literature review synthesised the effectiveness evidence on improving information systems for primary health care in LMICs, highlighting the need for careful intervention design and robust study designs (Bosch‐Caplanch 2018). Reviews of information systems for other health system building blocks (for example, human resources, finance, supply chain management), are rare. One mixed method systematic review on information systems for human resource in health, raised "unanswered questions" about the capacity of information systems to "improve quality and efficiency and enable learning health systems" (Tursunbayeva 2017). A recent systematic review currently in progress on effectiveness of digital tools for drug supply management found only one study to review and again highlighted the need for robust evaluation studies (Agarwal 2019).
Given the centrality of information support for health system management (Hotchkiss 2012) and little synthesised global evidence, we need a systematic review on the effectiveness of RHIS interventions aimed at strengthened health system management, across all settings (Aqil 2009; DeLone 1992; Hotchkiss 2012; Nutley 2014; Rahimi 2009). There are studies looking at strengthening RHISs and this review will identify and synthesise the findings of these studies, to provide an overview of what RHIS improvements work for strengthening health system management.
Objectives
To assess the effects of interventions to improve routine health information systems in terms of their performance, and also, in terms of improved health system management performance, and improved patient and population health outcomes.
Methods
Criteria for considering studies for this review
Types of studies
We included both randomised trials and non‐randomised studies in this Cochrane Review (EPOC 2017a). The following study types were considered.
Randomised trials (RCTs), cluster‐randomised trials and non‐randomised trials (NRCTs).
Controlled before‐after studies (CBAs), with at least two intervention sites and two control sites, or two intervention groups for each intervention type.
Interrupted time series (ITS), with a clearly defined point in time when the intervention occurred, and at least three data points before and three after the intervention.
Repeated measures studies (before‐after studies), wherein measurements of the same variable were made for the same individuals, and at least three data points before and three after the intervention.
We did not restrict the inclusion of studies by geographic region, publication status, date of publication or language.
Types of participants
We included both institutional level and staff level outcome measures because interventions may be implemented at an institutional level but operated by staff within the institution. For example, health information officers and district managers may implement a new data flow guideline within one or across several health facilities and district offices. Thus, both the institutional performance and the individual performance could be considered indicators of the effectiveness of the intervention. We included the following types of participants: health managers and health workers (for example nurses, doctors), including lay health workers (as defined by Lewin 2006), at all levels of the health system (for example clinic, hospital, district, regional, national levels).
Types of interventions
We included any intervention aimed at improving the RHIS as a part of the health system, compared to a control. In Table 8 we categorised the possible areas for RHIS interventions by drawing from the PRISM framework, in terms of technical, organisational and behavioural interventions (Aqil 2009). Comparison groups include:
no RHIS intervention;
no RHIS intervention for health systems management (for example, RHIS intervention limited to supporting clinical decision‐making);
different RHIS interventions compared to each other; and
pre‐post implementation.
Inclusions and exclusions
There are many systematic reviews of health information interventions, addressing a wide variety of intervention types, especially digital, focusing for the most part on clinical information systems, and aimed at improving identification and treatment of disease. Examples are digital tools for clinical decision support, computerised entry order systems, or targeted digital client communication. Our review excluded these types of clinical information system interventions, to focus on RHIS interventions that go beyond clinical management objectives. Interventions need to address health service and system management decisions on a broader health system level. Where there are indications that the clinic information system interventions were aimed at broader health system support, we considered these interventions. For example, where a clinical information system is tested district‐wide, the district‐wide scope is taken as an indication that the objective is to improve health‐system‐wide decision‐making and management (rather than only frontline clinician‐patient dyad clinical management). Clinical information system interventions aimed at public health surveillance are considered, as surveillance is a broader health system function. Population‐based surveillance data would be considered, while episodic surveillance surveys such as District Household Surveys (which are intermittent rather than ongoing and routine), are not considered part of the RHIS. We also excluded complex health systems strengthening and quality improvement interventions where the study authors or implementers have not named RHIS improvement as a key component of the intervention. We excluded economic evaluation studies.
Included
Any intervention targeting any component or dimension of the RHIS, with at least one component related to health services performance or management.
The information system has to be routine in nature.
Excluded
Clinical informatics aimed at clinical decision‐making support, without any reported effect on health service and systems management.
Interventions targeting non‐routine information systems.
Types of outcome measures
Recognising the complexity of a RHIS, we understood that there may not always be a direct causal pathway between the RHIS intervention and the more distal impact measures of health system functioning and population health outcomes. RHIS‐strengthening interventions may be aimed at intermediate outcomes that could be related to technical outcomes (for example, improved data quality), whilst others may aim to impact on more intermediate outcomes (such as service delivery efficiency and effectiveness), or more distal outcomes and impacts (such as patient and population health). We were interested in all outcome levels, as described in the protocol (Leon 2015). Drawing on the PRISM framework, explained in Aqil 2009, and Cochrane's Effective Practice and Organisation of Care (EPOC) recommendations for categorising outcomes (EPOC 2017b), we categorised the outcomes of interest from the included studies in terms of data quality (timeliness, availability, accuracy, completeness) and service quality (efficiency/timeliness and effectiveness).
Primary outcomes
Outcomes related to RHIS performance
Data quality (Information quality): content (completeness, relevance, accuracy, comprehensiveness and reliability) and availability (timeliness, accessibility and consistency).
Information use: data demand, motivation, confidence and competence regarding RHIS tasks.
Functioning of the RHIS (e.g. health information system quality and efficiency, knowledge about and attitudes towards the RHIS and staff satisfaction with the RHIS).
Outcomes related to health service and systems performance
Utilisation and coverage of and access to health services.
Service quality (quality of care of health service).
Performance of components of the health system: governance, human resource management, finance management, support services (e.g. drug supply chain management, laboratory and diagnostic services).
Health provider outcomes (including workload, morale and stress).
Secondary outcomes
Patient outcomes
Health status and well‐being (including physical, psychological and psychosocial health, and treatment outcomes including mortality, morbidity and surrogate physiological measures).
Health behaviour (e.g. adherence to treatment or care plans, healthcare‐seeking behaviour).
Equity
Differential effects across different target populations.
Adverse effects
Adverse effects or harms of RHIS interventions, including adverse effects on the following.
Health or health behaviours
Utilisation, coverage or access
Quality of care
Resource use
Health care providers (e.g. increased attrition, increased workload)
Social outcomes: equity (i.e. increased inequities)
Clinical adverse effects (e.g. hospital acquired infections, complications due to surgical error)
Health systems management and efficiency: including gate‐keeping behaviour (inappropriate regulation of services and access); gaming (changing activities for favourable measurement at the expense of effective organisational and care processes); and financial (inappropriate avoidance of spending, under‐ and over‐spending).
Search methods for identification of studies
Electronic searches
We searched the following databases.
Cochrane Central Register of Controlled Trials (CENTRAL; 2019, Issue 5), in the Cochrane Library www.cochranelibrary.com (searched 15 May 2019)
MEDLINE and Epub Ahead of Print, In‐Process & Other Non‐Indexed Citations and Daily 1946 to 14 May 2019, Ovid (searched 15 May 2019)
Embase 1974 to 2019 Week 19, Ovid (searched 15 May 2019)
Global Health 1973 to 2016 Week 15, Ovid (searched 26 April 2016) (No access in 2019)
PsycINFO 1806 to April Week 3 2016, Ovid (searched 26 April 2016) (found to be irrelevant and not rerun)
Searching other resources
Grey literature
Grey Literature Report: www.greylit.org (searched January 2020)
OpenGrey: www.opengrey.eu (searched January 2020)
Trial registries
ICTRP: apps.who.int/trialsearch (searched January 2020)
ClinicalTrials.go: ClinicalTrials.gov (searched January 2020)
We also:
did a cited reference search for relevant papers, including all included studies using Web of Science 1987 to present, Clarivate Analytics, and a ‘Similar articles’ search using PubMed, both searched 16 October 2019.
reviewed the reference lists for any relevant studies from the included studies and from systematic reviews covering related topic areas. Where we needed more information, we contacted the study authors. We received technical reports from two authors which allowed us to include the studies for data extraction (Mbananga 2002; SC4CCM 2013).
retrieved 47 additional records identified through: the Grey Literature Reports (19), OpenGrey (12), ICTRP (9), ClinicalTrials.gov (7). We identified no full‐text articles to be potentially eligible. At the end of the review, we contacted an expert in the field and identified 14 records for full‐text review, from a relevant review (Bosch‐Caplanch 2018), of which we included three articles as studies awaiting classification. We identified five additional full texts for screening from a relevant review (Tursunbayeva 2017), none of which were eligible for inclusion in our review.
Data collection and analysis
Selection of studies
A team comprising eight review authors (NL, KD, AH, WO, BS, YB, VZ, JAW) was responsible for study selection. We uploaded all records into Covidence, a systematic review information management tool that keeps track of the screening and data management processes (Covidence systematic review software, Veritas Health Innovation, Melbourne, Australia; www.covidence.org) (Covidence 2015). After removing duplicate records, two review authors independently screened titles and abstracts of studies for potential inclusion. Thereafter, we retrieved full‐text copies of potentially eligible articles; and two review authors independently evaluated each retrieved full‐text article for inclusion. We resolved disagreements through discussion and, where necessary, by consulting a third review author from the core team. The lead author, NL, was responsible for final conflict resolution where two reviewers were unable to agree. We report the screening process and results in a PRISMA flow chart in Figure 2 (Liberati 2009).
2.

PRISMA Flow diagram for RHIS systematic review
Data extraction and management
Two review authors independently extracted data from each included study, using the categories of the standardised Cochrane data extraction form to extract descriptive and outcome data (Higgins 2019). We resolved disagreements through discussion and, where necessary, by consulting a third review author from the core team. We contacted study authors in the case of missing data and received a response with data from one author. Two review authors (YB and NL) imported the data into Review Manager 5 (RevMan 5) (Review Manager 2014). In the Characteristics of included studies, we report the following identifying information on all included studies: methods (study type, country, setting, implementation period, intervention duration); participants (inclusion and exclusion criteria); intervention (the components of the intervention and description of the control); outcomes (key outcomes and definitions); and notes (additional information on ethical approval, informed consent, funding and conflict of interest). We extracted the same information for studies awaiting classification but in less detail (Characteristics of studies awaiting classification).
Assessment of risk of bias in included studies
Two review authors (YB and NL) independently assessed the risk of bias of each included study. We discussed and agreed on the final assessment. We followed the guidelines from both Cochrane's 'Risk of bias' assessment tool and the Cochrane EPOC Group, which include criteria for assessing each of the included study designs (EPOC 2017c; Higgins 2019). Judgement on the overall risk of bias took into account the likely magnitude and direction of the bias and whether we considered the bias impacted on the findings. We assessed studies to be at high risk of bias if we judged them to be at high risk in one or more of the following domains: sequence generation; allocation concealment; or selective outcome reporting (based on growing empirical evidence that these three factors are the most important in influencing risk of bias) (Higgins 2019). We assessed overall risk of bias as being low risk, unclear risk or high risk (EPOC 2017c).
Measures of treatment effect
Studies were too heterogeneous with regards to interventions and outcomes, and thus we were unable to conduct meta‐analysis. We report individual study results and discuss groups of similar outcomes. For dichotomous outcomes, we reported relative effects as odds ratios (ORs), hazard ratios (HRs) and percentage point differences with 95% confidence intervals (CIs). For continuous outcomes, we reported relative effects as mean differences (MDs) with 95% CIs or medians (with interquartile ranges if available). Where possible, we provide a P value for the effect (we considered P < 0.05 to be significant). For controlled before‐after studies, where provided, we reported both the absolute change between the experimental and control groups after the intervention and the absolute change from baseline to post‐intervention in both groups, together with the difference of the change between the two groups. We reported values as described by the study authors.
Unit of analysis issues
We did not encounter any unit of analysis issues. Clustering was adequately accounted for in all included cluster RCTs (Blaya 2009; Blaya 2014; Joos 2016; Mutale 2014).
Dealing with missing data
We attempted to obtain missing or additional data from study authors (Mbananga 2002; Mutale 2014; SC4CCM 2013); and received data from two studies (Mbananga 2002; SC4CCM 2013).
Assessment of heterogeneity
Studies were too heterogeneous and thus a meta‐analysis was not possible. We report individual study results and discuss groups of similar outcomes (EPOC 2017d).
Assessment of reporting biases
An assessment of reporting biases using a funnel plot was not possible as the included studies were few and too heterogeneous.
Data synthesis
Summary of findings
We created 'Summary of findings' tables for each of the seven intervention and comparison groups and included our primary outcomes, data quality and service quality (Table 1; Table 2; Table 3; Table 4; Table 5; Table 6; Table 7). Two review authors independently assessed the certainty of evidence (high, moderate, low and very low) using the five GRADE considerations (risk of bias; consistency of effect; imprecision; indirectness; and publication bias) for each key outcome using the GRADE approach and GRADEpro GDT software (GRADEpro GDT; Guyatt 2008; Higgins 2019). We resolved disagreements on certainty ratings by discussion and provided justification for decisions to down‐ or upgrade the ratings using footnotes in the table and made comments to aid readers' understanding of the review where necessary. We used plain language statements to report these findings in the review.
Subgroup analysis and investigation of heterogeneity
We were not able to conduct subgroup analyses of outcomes across different populations, interventions or settings due to the heterogeneity of interventions and outcomes across studies; we present the results within studies.
Sensitivity analysis
We did not perform a sensitivity analysis to examine the effects of removing studies at overall high risk of bias across domains (based on 'Risk of bias' assessment within studies) as we did not conduct a meta‐analysis.
Results
Description of studies
See Characteristics of included studies; Characteristics of studies awaiting classification; Characteristics of excluded studies.
Results of the search
As shown in the PRISMA diagram (Figure 2), we screened 16,685 records after duplicates were removed. We identified 420 records for full‐text review. Nineteen of those full texts were identified from other sources (14 from contacting an expert (Bosch‐Caplanch 2018); and 5 from a relevant systematic review (Tursunbayeva 2017)).
From 420 full‐text studies reviewed, we include and report on six eligible studies (in nine articles) in the structured analysis and synthesis. Two of the included studies (Mbananga 2002 and SC4CCM 2013) are technical reports (grey literature) that were accessed from writing to authors who had published related papers. Through our search and articles received from an expert in the field, we identified five eligible studies that we categorised as studies awaiting classification (He 2014; Monyarit 2014; O'Connor 2019; Singh 2012; Toda 2016). These studies will be analysed in the next update of this systematic review.
Included studies
Study design and setting
We identified six studies, based on nine papers that met the inclusion criteria for the review (Blaya 2009; Blaya 2014; Joos 2016; Mbananga 2002; Mutale 2014; SC4CCM 2013). Blaya 2014 had two secondary publications reporting results on the same intervention (Blaya 2010a; Blaya 2011); and SC4CCM 2013 had one secondary publication (Shieshia 2014). Four of the six included studies are cluster randomised trials (Blaya 2009; Blaya 2014; Joos 2016; Mutale 2014); and two studies are controlled before‐after studies (Mbananga 2002; SC4CCM 2013). All the studies were conducted in rural and peri‐urban settings, in low‐ and middle‐income countries. Four studies are from Africa: two from Malawi (Joos 2016; SC4CCM 2013), one from Zambia (Mutale 2014), and one from South Africa (Mbananga 2002). Two studies were conducted in Peru (Blaya 2009; Blaya 2014). Studies differed in terms of the type of intervention, the level of the health service, and the target population, as summarised below. For more study details, please see the Characteristics of included studies table.
Participants
Study populations included clinical, laboratory and administrative staff and managers in health facilities across districts (Blaya 2009; Blaya 2014; Mutale 2014), community‐based lay health workers (Joos 2016; SC4CCM 2013), and hospital‐based health workers (Mbananga 2002).
Interventions and comparisons
We categorised the intervention comparisons in terms of two of the three key components of the PRISM framework (Aqil 2009). We applied the 'technical' and 'organisational' categorisation based on the reported study intervention design. We did not find any studies with behavioural interventions. (See also Figure 1 for a simplified diagram of the PRISM framework).
Interventions included a variety of information systems, including a district‐wide information system for primary health care, which included TB laboratory information systems (Blaya 2009; Blaya 2014), a maternal and child health patient information system (Mutale 2014), a community‐based health care system for surveillance of pregnancy outcomes (Joos 2016), and a drug supply information system (SC4CCM 2013). One study focused on a province (region‐wide) hospital information system (Mbananga 2002).
Five studies mainly focused on technical, digital mechanisms for collecting and transmitting routine health information between different parts of the health system or services (Blaya 2009; Blaya 2014; Joos 2016; Mbananga 2002; SC4CCM 2013). Digital interventions included a hand‐held personal digital assistant (PDA) electronic data collection system (Blaya 2009), a web‐based electronic information system (Blaya 2014), an electronic hospital information system (Mbananga 2002), and mobile phone‐based SMS brief‐text messaging (Joos 2016; SC4CCM 2013).
Technical interventions
A web‐based electronic information system for documenting and communicating laboratory testing for TB
e‐Chasqui is an electronic TB laboratory information system that communicates TB results to clinicians and public health administrators in Peru. The electronic information system provides the ability to register patients, order medications, display chest x‐rays, generate monthly reports for funders, and predict future drug requirements. The central feature of e‐Chasqui interface is a single patient page with the history of all tests performed for the patient. In the intervention group, point of care health centres (HCs) had internet, which enabled them to have direct access to e‐Chasqui. These HCs could immediately view TB test results, print the results from e‐Chasqui to send to the peripheral HCs, or wait for the paper copy to arrive from the laboratory to send it on. All intervention HC staff were trained at their HC in an initial session for approximately one hour. The data administrator would then visit or call the HC at least twice a month and could be contacted via cell phone or email during business hours. In the control districts, TB test results were generated on paper by the National Research Laboratory and district laboratories and transported to health establishments. The purpose of the e‐Chasqui system was to reduce the time to communicate patients' test results, to enable quicker initiation of treatment and cure (as measured through sputum culture conversion testing, which is a clinical tool used to predict therapeutic efficacy in MDR‐TB patients) (Blaya 2014). Two secondary publications reported on reducing the error rate of reporting and recording laboratory test results (Blaya 2011; Blaya 2010a).
Hand‐held electronic device for data collection on TB
A personal digital assistant (PDA)‐based electronic information device was used to collect TB test results in Peru (Blaya 2009). The PDA was used at the initial point of data entry at the clinical site to decrease delay time and errors, compared to the standard paper‐based data collection system. In the new system, bacteriology team members would visit a health centre or laboratory and copy the data directly from the laboratory register or chart using the PDA device. When back in the central office, they would then upload the data from the PDA to the open source Partners In Health Electronic Medical Record (PIH‐EMR) The PIH‐EMR is a web‐based system designed for TB and MDR‐TB treatment in resource‐poor settings. It allowed for the automated processing of data and data quality checks and used web pages that displayed information. The aims of this study were: "(1) to compare the processing time using the electronic system to the paper‐based system; (2) to compare the frequency of errors entered with and without the electronic system; and (3) to assess the system’s usability and its acceptability by users." (p.2)
An electronic health information system for hospitals
As part of a provincial restructuring of health services in 1998, the Northern Province (now Limpopo province) of South Africa started to implement a computerised, electronic health information system in 42 hospitals. Control sites used the standard paper‐based hospital information system. The purpose of the electronic Hospital Information System (HIS) was (1) to improve patient care by providing patient information within and between hospitals; (2) to improve the delivery of services across the hospital departments (e.g. through improved patient administration and service performance evaluation systems); and (3) to improve the efficiency of hospital management health (e.g. improve financial management and revenue collection, aid management decision‐making by identifying primary cost drivers, and to provide accessible information for management at all levels of the health system) (Mbananga 2002).
Technical plus organisational interventions
Two studies included specific components that went beyond technical interventions, including various organisational supports aimed at data management and use, such as motivational content and data quality advice contained in one‐way SMS text messaging (Joos 2016), enhanced management support for drug supply monitoring, and logistical support for transporting the drug supplies (SC4CCM 2013).
Short messaging service (SMS) as a job aid for community‐based surveillance in relation to pregnancy outcomes
In Malawi, the Real‐time Mortality Monitoring (RMM) programme, used Health Surveillance Assistants (HSAs), who are government‐trained and paid community health workers, to improve a community‐based vital event documentation of pregnancies and pregnancy outcomes (e.g. births, neonatal deaths), using the Village Health Registers (VHRs). They used a mobile‐phone‐based SMS system as a job aid; one‐way short SMSes were sent to HSAs by the mobile health (mHealth) coordinator at the Malawi National Statistical Office (NSO), with motivational SMSes and SMSes with advice on improving data quality. The HSAs in the control group received minimal‐intensity SMS with basic motivational content. The study tested the effectiveness of SMS intervention in improving the complete documentation of pregnancies and pregnancy outcomes. The primary outcome measure was the improvement in documentation of pregnancy outcomes between groups during the intervention period. Possible pregnancy outcomes included adverse events (abortion, miscarriage, stillbirth), live birth, and out‐migration of the pregnant mother. Pregnancies and outcomes were matched using the six‐digit HSA code and the woman’s unique 11‐digit ID. Matching results analysed for this study were (1) pregnancies matched to an outcome and (2) pregnancies without a matched outcome, to analyse the change in documentation of matched pregnancies between groups and over time (Joos 2016).
A SMS and web–based stock notification system (cStock), with organisational support and logistical support, for monitoring and re‐supply of community‐based drug supply
cStock is an SMS and web–based stock reporting and resupply system that for community health care workers, or Health Surveillance Assistants (HSAs) in community‐based health services in Malawi, to report stock data via SMS through their personal mobile phones. cStock calculates HSA resupply quantities and sends this to health facility‐based staff, who use the information to select and pack products for HSAs and notify them about a collection time. The SC4CCM 2013 project, using a controlled before‐after design, tested the effect of the two interventions where the cStock system was combined with two different forms of organisational support, as compared to control sites, where there was no intervention. For intervention 1, the cStock notification system was combined with Enhanced Management (EM), which used a District Product Availability Team to address challenges of data availability and visibility, and low motivation among HSAs. For intervention 2, the cStock notification system was combined with Efficient Product Transport (EPT), which focused on logistical support for transporting the drug supplies (such as bicycle maintenance skills and tools), and the use of a more flexible, continuous review inventory control system. In the control arm, the drug supply system was based on a paper‐based system and no additional organisational support systems were put in place.
This included study and a secondary publication reported on two different comparisons, and for this review, only the first comparison was relevant.
cStock interventions (one with enhanced management support and the other with logistical support for product transport), compared to a standard, paper‐based stock notification system (control).
cStock with logistical support for product transport compared to a standard, paper‐based stock notification system.
Organisational interventions
A multi‐modal, health‐system‐wide, quality improvement intervention to quality and utilisation of clinical care in maternal, child and reproductive health services
The Better Health Outcomes through Mentoring and Assessment (BHOMA) is a five‐year project that combined several quality improvement strategies to improve the quality and utilisation of clinical services, and health outcomes, for maternal and child health in 3 rural districts in Zambia. BHOMA is a multi‐component quality‐improvement health system intervention, with strategies for district, health facility and community health service levels. Strategies include the establishment of district‐based Quality Improvement (QI) teams, implementing clinical care guidelines, leadership training for health workers targeting governance, finance, supply chain and human resource management. One of the 5 objectives of the BHOMA project focused on information system support, through the introduction of an electronic patient record system, training and a new cadre of lay workers to support the registration of patients and maintaining the medical record system. Activities included strengthening routine data collection at facility and community level via the electronic health record system, community‐based data collectors and "clinic supporters" for clinical and administrative support with record keeping in the health facility. The impact of the BHOMA project is measured using Standardised Mortality Rate (for those under 5 years and under 60 years old) and other clinical indicators. The secondary objectives of the BHOMA intervention include (1) improved coverage of key primary health interventions, (2) improved overall coordination and effectiveness of the health system, and (3) implementation of a feasibility and cost‐effective intervention. However, this paper is focused on using a e Balanced Score Card (BSC) measurement tool, "with the aim of demonstration the utility of the balanced scorecard in evaluating multiple building blocks in a trial setting." (Blaya 2014) (p.1). It reports in interim findings and draws on health survey data on several health service and systems domains, at 12 months of implementation.
Outcomes
Table 10 provides a summary that maps the intervention, comparison and outcomes per study. The outcomes in the included studies were categorised in two main areas: (1) data quality (timeliness, availability, accuracy, completeness); and (2) service quality (efficiency/timeliness and effectiveness).
3. Summary of interventions, comparisons and outcomes in included studies.
| Type of intervention | Study ID | Intervention | Comparison | Outcome category |
| Technical | Blaya 2014 | 1. Web‐based electronic TB laboratory information system | Paper‐based TB laboratory information system | Data quality: timeliness, availability and accuracy. Service quality: efficiency (timeliness) |
| Blaya 2009 | 2. Hand‐held electronic device for collecting TB laboratory information for a TB Control programme | Paper‐based TB test result data collection system | Data quality: timeliness, accuracy | |
| Mbananga 2002 | 3. Electronic hospital health information system | Paper‐based hospital information system | Service quality: efficiency | |
| Technical plus Organisational | Joos 2016 | 4. High intensity SMS text‐messaging for community‐based surveillance of pregnancy outcomes | Low intensity SMS messaging | Data quality: completeness |
| SC4CCM 2013 | 5. Electronic drug stock notification with data management support | Paper‐based stock notification system (without any SMS‐based or additional intervention) | Service quality: effectiveness | |
| SC4CCM 2013 | 6. Electronic drug stock notification with support for transport of product | Paper‐based stock notification system (without any SMS‐based or additional intervention) | Service quality: effectiveness | |
| Organisational | Mutale 2014 | 7. Health information strengthening as part of comprehensive quality improvement (QI) | No quality improvement intervention | Service quality: effectiveness |
None of the included studies reported on the review secondary outcomes or any of the following primary outcomes.
RHIS performance
Information use: data demand, motivation, confidence and competence regarding RHIS tasks
Functioning of the RHIS (e.g. health information system quality and efficiency, knowledge about and attitudes towards the RHIS and staff satisfaction with the RHIS)
Health service and systems performance
Utilisation and coverage of and access to health services
Performance of components of the health systems: governance, human resource management, finance management, support services (e.g. drug supply chain management, laboratory and diagnostic services)
Health provider outcomes (including workload, morale and stress)
Excluded studies
We excluded 405 full text articles. The main reasons for exclusion of full texts were ineligible study design (n = 199) and ineligible type of intervention (n = 157). The Characteristics of excluded studies table lists our reasons for exclusion for a sample (60) of the most relevant full‐text studies.
Risk of bias in included studies
Risk of bias was mostly unclear for the included studies due to lack of reporting of essential study descriptors such as randomisation, allocation and attrition. The risk of bias summary in Figure 3 is a summary of the review authors' judgements about each risk of bias item for each included study, and the risk of bias graph in Figure 4 records the review authors' judgements about each risk of bias item presented as percentages across all included studies.
3.
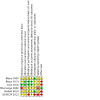
Risk of bias summary: review authors' judgements about each risk of bias item for each included study
4.

Risk of bias graph: review authors' judgements about each risk of bias item presented as percentages across all included studies
Random sequence generation (selection bias)
Four studies did not describe the method of randomisation and we judged them to have unclear risk of bias (Blaya 2009; Blaya 2014; Mutale 2014; SC4CCM 2013). One study was identified as low risk as it described a method of minimisation (Joos 2016). One study was identified as high risk as hospitals were allocated for logistical and policy‐related reasons (Mbananga 2002).
Allocation
Four studies did not report on allocation concealment and thus have an unclear risk of bias (Blaya 2009; Mbananga 2002; Mutale 2014; SC4CCM 2013). Allocation concealment was not done in Blaya 2014 but was classified as low risk as this was unlikely to affect the outcome. We classified Joos 2016 as low risk since participants were unaware of their treatment group.
Blinding
Due to the nature of the intervention, blinding of participants was not possible in most of the studies. As this was unlikely to affect the outcomes, we judged it to be a low risk of performance bias in two studies (Blaya 2014; Joos 2016). In three studies, it is likely that blinding was not possible and it was unclear if this could have affected the outcome, resulting in an unclear risk of bias judgement (Blaya 2009; Mbananga 2002; Mutale 2014). We judged one study to have high risk of performance bias as the lack of blinding may have influenced the outcome (SC4CCM 2013).
Low risk of detection bias was present in two studies since outcomes were clearly defined, objective, and were unlikely to be affected by no blinding (Blaya 2014; Joos 2016). Not enough information was reported for four studies regarding outcome assessment hence we judged them to have an unclear risk of bias (Blaya 2009; Mbananga 2002; Mutale 2014; SC4CCM 2013).
Incomplete outcome data
We found one study to be at high risk for attrition bias for reporting missing data but not providing a description of the type of missing data (SC4CCM 2013). We classified three studies as having unclear risk of bias as they did not report on missing data (Blaya 2014; Joos 2016; Mbananga 2002). We classified two studies as having low risk since they reported having no missing data (Blaya 2009; Mutale 2014).
Selective reporting
We classified Mbananga 2002 and SC4CCM 2013 as high risk since not all pre‐specified outcomes were reported. In SC4CCM 2013, control group results were not reported for most outcomes. The completeness of reporting of outcomes were uncertain in all other studies and we classified these studies as at uncertain risk for selective reporting.
Other potential sources of bias
We judged four studies to have a high risk of other biases (Blaya 2014; Joos 2016; Mutale 2014; SC4CCM 2013). Blaya 2014 reported a potential conflict of interest as the authors were the developers of the intervention. The implementers of the intervention in Joos 2016 were also the researchers and were involved in maintaining the intervention. Mutale 2014 reported the interim analysis of step‐wise implementation resulting in uneven intervention exposure between sites, and provided no information on the validation of measurement tools. We deemed one study to have unclear risk since the researchers were involved with the implementation of the intervention and the impact thereof is uncertain (Blaya 2009). We deemed one study to have low risk since no other biases were established for this study (Mbananga 2002).
Effects of interventions
See: Table 1; Table 2; Table 3; Table 4; Table 5; Table 6; Table 7
Due to the heterogeneity of the interventions and outcomes, we did not pool results and therefore present results per study for each comparison, in individual 'Summary of findings' tables (Table 1; Table 2; Table 3; Table 4; Table 5; Table 6; Table 7). We categorised the intervention comparisons in terms of the components of the PRISM framework (Aqil 2009) as, Technical and Organisational. The outcomes reported in the included studies addressed the following two primary outcomes: (1) Data quality (timeliness, completeness, availability and accuracy); and (2) Service quality (efficiency and effectiveness), as shown in Table 10, where we have mapped the intervention comparisons and outcomes. As noted above (Included studies), none of the included studies reported on the review secondary outcomes or any other primary outcomes.
Technical interventions
Comparison 1: Web‐based electronic TB laboratory information system compared to a paper‐based system
One cluster randomised trial tested a web‐based electronic Tuberculosis (TB) laboratory information system (e‐Chasqui) that communicates TB results to clinicians and public health administrators to improve TB information system quality, efficiency and use in Peru (Blaya 2014). The data is drawn from Blaya 2014, the primary study, as well as two supplementary publications (Blaya 2010a; Blaya 2011). The included study for this comparison reported data quality and service quality. See Table 1
RHIS performance: data quality
Length of time to report TB culture test results
A web‐based electronic TB laboratory information system probably reduces the time of reporting TB culture test results (also referred to as laboratory turn‐around time or TAT) compared to a paper‐based system (moderate‐certainty evidence). When the results were stratified by health centre (HC) type, the intervention effect (expressed as Hazard ratio or HR), was greater in facilities with point‐of‐care web‐based electronic systems (HR 0.55, 95% CI 0.49 to 0.61) than in peripheral HCs where clinicians were dependent on the point‐of‐care facilities passing on the TB test results to them (HR 1.22, 95% CI 0.96 to 1.54). The facilities with the web‐based electronic system had a laboratory turn‐around time for reporting of TB culture test results three days quicker compared to the paper‐based system (HR 0.68, 95% CI 0.65 to 0.71; moderate‐certainty evidence).
Length of time to report TB drug susceptibility test results
A web‐based electronic TB laboratory information system probably reduces time of reporting TB drug susceptibility test (DST) results compared with a paper‐based system (moderate‐certainty evidence). When the results were stratified by health centre type, the intervention effect was greater in health centres with point‐of‐care access to the web‐based electronic system (HR 0.56, 95% CI 0.49 to 0.64) than in peripheral health centres where clinicians were dependant on the point of care facilities passing on the TB test results to them (HR 1.18, 95% CI 0.87 to 1.62).The facilities with the web‐based electronic system had a laboratory turn‐around time six days quicker for reporting of DST results, as compared with facilities with a paper‐based system (HR 0.67, 95% CI 0.62 to 0.72; moderate‐certainty evidence)
Recording errors of TB culture test results (Overall)
A web‐based electronic laboratory information system probably reduces the overall rate of recording errors of TB culture test results (OR 0.13, 95% CI 0.07 to 0.24; moderate‐certainty evidence) compared to a paper‐based system. The overall error rate was measured by combining three types of errors: Error 1, 'missing' test results, where results were not available for viewing at the time of assessment; and two types of 'misidentification' errors. Error 2 is inaccuracies in recording of the patient identifying details between the laboratory register and the patient clinical chart; and Error 3 is inaccuracies in recording of the TB test result between the laboratory register and the patient clinical chart. The biggest change was reducing 'missing' results in intervention sites, due to staff in intervention sites being able to immediately view test results electronically. The reduction in missing results (as opposed to misidentification errors) accounted for between 72% and 86% of all the difference found between intervention and control sites.
Recording errors of TB drug susceptibility test results (Overall)
A web‐based electronic laboratory information system probably reduces the overall rate or recording errors of TB drug susceptibility test (DST) results (OR 0.17, 95% CI 0.09 to 0.32; moderate‐certainty evidence) compared to a paper‐based system. The overall error rate was measured by combining three types of errors: Error 1, 'missing' test results, where results were not available for viewing at the time of assessment; and two types of 'misidentification' errors. Error 2 is inaccuracies in recording of the patient identifying details between the laboratory register and the patient clinical chart; and Error 3 is inaccuracies in recording of the TB test result between the laboratory register and the patient clinical chart. The biggest change was reducing 'missing' results in intervention sites, due to staff being able to immediately view test results electronically. The reduction in missing results (as opposed to misidentification errors) accounted for between 72% and 86% of all the difference found between intervention and control sites.
Recording errors: misidentification errors for TB culture test results
In terms of the accuracy of data collection, we are uncertain about the effect of a web‐based electronic laboratory information system on the rate of misidentification (serious) errors for TB culture test results compared to a paper‐based system (OR 1.15, 95% CI 0.47 to 2.81), due to very low certainty evidence. Misidentification errors are inaccuracies in transferring TB culture test results between an electronic register and patients' clinical charts, and are considered as 'serious' errors. This suggests that the reduction in overall error rate between the intervention and control sites (reported above), was largely due to a reduction in 'missing' test result errors. As intervention sites were able to view test results immediately on their web‐based electronic system, it reduced the problem of missing results. As mentioned above, missing results (as opposed to inaccuracies due to misidentification in recording results) accounted for the largest proportion when all the errors were combined. In other words, control sites without the electronic system could not immediately view test results, and therefore had more 'missing' result errors at the time of assessment (as they had to wait till they received paper copies from the laboratory).
Recording errors: misidentification errors for TB drug susceptibility test results
We are uncertain about the effect of a web‐based electronic laboratory information system on the recording rate of misidentification (serious) errors for TB drug susceptibility test results compared to a paper‐based system (OR 1.10, 95% CI 0.46 to 2.63), due to very low certainty evidence.
Health service and systems performance: service quality
Timeliness of starting or changing a patient's TB treatment
We are uncertain about the effect of a web‐based electronic laboratory information system on the timeliness of starting or changing a patient's TB treatment (also known as treatment turn‐around time) compared to a paper‐based system (Ratio 0.82, 95% CI 0.55 to 1.22), due to very low certainty evidence.
Comparison 2: Hand‐held electronic device for collecting TB laboratory information compared to a paper‐based system
One cluster randomised trial tested the effectiveness of a hand‐held personal digital assistant (PDA)‐based system for collecting district‐wide TB test results compared to the paper‐based system (Blaya 2009). The included study for this comparison reported on data quality. See Table 2.
RHIS performance: data quality
Length of time to report TB culture and smear test results
A hand‐held electronic device probably improves the length of time to report TB culture test results (71.8 % reduction in time taken), and TB smear test results (56.3% reduction in time taken) compared to a paper‐based test system (moderate‐certainty evidence). TB culture test results in intervention sites took 7.7 days versus 22.5 days in control sites; and TB smear test results in intervention sites took 11.6 days versus 24.6 days in control sites (moderate‐certainty evidence).
Recording errors
When collecting TB test results, a hand‐held electronic device probably reduces the total frequency of recording errors, compared to a paper‐based system: intervention sites (OR 0.41, 95% CI 0.26 to 0.65), compared to control sites (OR 0.14, 95% CI 0.02 to 1.20) (moderate‐certainty evidence). A recording error was defined as an occurrence of information entered into the PIH‐EMR electronic information system not matching the original laboratory notebook, with the laboratory notebook considered to be the 'gold standard' for accuracy. This was for all types of errors, including result date, identity number, test result, including a 'misidentification' error (if result was assigned to the wrong patient, considered a 'serious' error). There was a 59% reduction in the total frequency of test result collection errors in intervention sites, as compared to the control sites (moderate‐certainty evidence).
Recording errors: misidentification errors
We are uncertain about the effect of a hand‐held electronic device on the frequency of misidentification (serious) errors, as the certainty of evidence is very low. A misidentification error is when the test result is assigned to the wrong patient when entered into the PIH‐EMR electronic information system from the laboratory notebook. Misidentification errors in the intervention sites totalled 0.09%, compared to 0.62% in the control sites (very low certainty evidence).
Comparison 3: Electronic hospital health information system compared to a paper‐based health information system
One controlled before‐after study looked at the effects of a hospital electronic information system compared to a paper‐based health information system, and reported on a range of service delivery outcomes (Mbananga 2002). The included study for this comparison reported on service quality. See Table 3.
Health service and systems performance: service quality
Length of time outpatients spend at hospital
We are uncertain about the effect of an electronic hospital information system on outpatient hospital time compared to a paper‐based system, as the certainty of evidence is very low. The median time outpatients spent at hospital increased by 8.4 minutes in the intervention group compared to 1.8 minutes in the control group.
Length of hospital stay
We are uncertain about the effect of an electronic hospital information system on the length of hospital stay for patients compared to a paper‐based system, as the certainty of evidence is very low. The median length of stay in the intervention group increased by 7.2 hours compared to 1.1 days in the control group.
Revenue collection
We are uncertain about the effect of an electronic hospital information system on hospital revenue collection compared to a paper‐based system, as the certainty of the evidence is very low. The median revenue collected in the intervention group increased by ZAR 17,763, compared to ZAR 5921 in the control group.
Technical plus organisational interventions
Comparison 4: High‐intensity brief text messaging (SMS) compared to low‐intensity brief text messaging
One cluster randomised trial evaluated the effects of high‐intensity brief text messaging compared to low‐intensity brief text messaging (Joos 2016). The included study for this comparison reported on data quality. See Table 4.
RHIS performance: data quality
Documenting of matched pregnancy outcome data
High‐intensity SMS brief text messaging (with motivational content and data quality guidelines) may make little or no difference to the completeness of documentation of matched pregnancy outcomes by health surveillance assistants (HSAs), compared to a lower‐intensity SMS intervention (with motivational content only) (OR 0.94, CI 0.63 to 1.38; P = 0.74; low‐certainty evidence). In other words, the high‐intensity text messaging did not improve the matching of pregnancies with their outcomes (such as live birth, still birth and miscarriage) within a vital registration system.
Comparison 5: Electronic drug stock notification with data management support compared to paper‐based stock notification
One controlled before‐after study evaluated the effect of electronic drug stock notification with data management support compared to paper‐based stock notification (SC4CCM 2013). The included study for this comparison reported on service quality. See Table 5
Health service and systems performance: service quality
Functioning bicycles for transporting stock
We are uncertain about the effect of electronic stock notification plus data management support on the proportion of functioning bicycles for transporting stock, compared to a paper‐based system, as the certainty of the evidence is very low. A functioning bicycle is an indicator of service quality as bicycles are the primary means through which HSAs transport stock, and the product support function provided training and tools for bicycle maintenance.
Health surveillance assistants with all three products in stock
We are uncertain about the effect of electronic stock notification plus data management support on the proportion of HSAs with all three products in stock compared to a paper‐based system, as the certainty of the evidence is very low.
Health surveillance assistants with all four products in stock
We are uncertain about the effect of electronic stock notification plus data management support on the proportion of HSAs with all four products in stock compared to a paper‐based system, as the certainty of the evidence is very low.
Comparison 6: Electronic drug stock notification with product transport support compared to paper‐based stock notification
One controlled before‐after study evaluated the effect of electronic drug notification with product transport support, compared to paper‐based stock notification (SC4CCM 2013). The included study for this comparison reported on service quality. See Table 6
Health service and systems performance: service quality
Functioning bicycles for transporting stock
We are uncertain about the effect of electronic stock notification plus product transport support on the proportion of functioning bicycles for transporting stock compared to a paper‐based system, as the certainty of the evidence is very low. Product transport support included bicycle maintenance training and tools, and an inventory control system, which was intended to improve the ability of HSAs to transport and manage their stock.
Health surveillance assistants with all three products in stock
We are uncertain about the effect of electronic stock notification plus product transport support on the proportion of HSAs with all three products in stock compared to a paper‐based system, as the certainty of the evidence is very low.
Health surveillance assistants with all four products in stock
We are uncertain about the effect of electronic stock notification plus product transport support on the proportion of HSAs with all four products in stock compared to a paper‐based system, as the certainty of the evidence is very low.
Organisational interventions
Comparison 7: Health information strengthening as part of comprehensive quality improvement compared to no quality improvement
One cluster randomised trial evaluated the effect of health information strengthening as part of comprehensive quality improvement intervention (Mutale 2014). The included study for this comparison reported on service quality. See Table 7.
Health service and systems performance: service quality
Health worker motivation
We are uncertain about the effect of health information strengthening, as part of a broader quality improvement intervention, on health worker motivation scores compared to no intervention, as the certainty of the evidence is very low. The study assessed health worker motivation using a questionnaire with items such as job satisfaction, job commitment, burnout and more. The estimate was a mean difference of 1.2 (6.5 lower to 4.5 higher).
Receipt of training by health workers
We are uncertain about the effect of health information strengthening, as part of a broader quality improvement intervention, on health worker training scores compared to no intervention, as the certainty of the evidence is very low. The score assessed whether the health workers received relevant training in the past 12 months. The estimate was a mean difference of 23.3 (2.3 lower to 44.3 higher).
Health information index
We are uncertain about the effect of health information strengthening, as part of a broader quality improvement intervention, on health information index scores compared to no intervention, as the certainty of the evidence is very low. No information was provided on what measurements contributed to the health information index. The estimate was a mean difference of 7.3 (2.6 lower to 12 higher).
Quality of clinical observation ‐ children
We are uncertain about the effect of health information strengthening as part of a broader quality improvement intervention on the quality of clinical observation of children compared to no intervention, as the certainty of the evidence is very low. The estimate was a mean difference of 9.6 (6.6 lower to 25.8 higher).
Quality of clinical observation ‐ adults
We are uncertain about the effect of health information strengthening as part of a broader quality improvement intervention on the quality of clinical observation of adults compared to no intervention, due to very low certainty evidence. The estimate was a mean difference of 10.9 (2.13 lower to 19.7 higher).
Discussion
Summary of main results
The review included six primary studies for analysis (Blaya 2009; Blaya 2014; Joos 2016; Mbananga 2002; Mutale 2014; SC4CCM 2013). Five studies are awaiting classification (He 2014; Monyarit 2014; O'Connor 2019; Singh 2012; Toda 2016). Four of the six included studies are randomised controlled trials (Blaya 2009; Blaya 2014; Joos 2016; Mutale 2014); and two studies are controlled before‐after studies (Mbananga 2002; SC4CCM 2013). Studies were conducted in low‐income or middle‐income countries (Africa and South America), mostly in rural and peri‐urban settings. Interventions included a TB laboratory information system (Blaya 2009; Blaya 2014), a community‐based pregnancy outcome surveillance system (Joos 2016), a community‐based drug supply monitoring system (Mutale 2014), a province‐wide hospital patient record system (Mbananga 2002), and a district‐wide primary care clinical and health service information system for maternal and child health care services (Mutale 2014). These information systems were based at different levels of the health services: hospital, primary health care and community‐based. Studies focused mostly on testing technical interventions such as electronic or digital technical interventions aimed at improving the quality of data (timeliness, completeness, availability and accuracy), and on improving service quality (effectiveness and efficiency); and some studies combined technical interventions with organisational support.
The findings from this review indicate a mixed picture of the effects of RHIS improvements to strengthen health system management. In terms of data quality, electronic information systems may make data more quickly available and easily accessible for health providers to view (Blaya 2009; Blaya 2014). For example, in Peru a web‐based electronic TB laboratory information system and a hand‐held electronic data collection system (Blaya 2014 and Blaya 2009 respectively) reduced the time of reporting TB test results. The electronic TB information systems probably improved access to TB test results, as they enabled health workers in intervention sites to immediately view test results (Blaya 2009; Blaya 2014). It is, however, uncertain if these electronic interventions made a difference to the accuracy of recording result with respect to the rate of serious recording errors (described as errors of "misidentification"), where the patient‐identifying data and test results did not match up between the laboratory records and other record systems (Blaya 2009; Blaya 2014).
There is also little evidence of effect in terms of data completeness. A mobile‐phone‐based brief text messaging (SMS) intervention may make little or no difference to the completeness of documentation of matched pregnancy data, for community‐based pregnancy surveillance (Joos 2016).
Service delivery outcomes can provide indirect evidence on use of data for decision‐making and management, as the underlying assumption is that managers used the more accessible and better‐quality information to inform decisions about service quality improvements. For instance, we are largely uncertain of the effect of electronic data collection systems on the efficiency and effectiveness of service delivery, as most of the evidence was of low to very low certainty. It is uncertain if a web‐based TB laboratory information system improved the timeliness of starting or changing a patient's TB treatment (treatment turn‐around time) (Blaya 2014), though this may be as a result of other factors that were not measured, such as challenges with scheduling patient visits, or patient adherence. It is also uncertain if a hospital patient electronic system affected hospital outpatient time, length of hospital stay or revenue collection (Mbananga 2002). The effects of the electronic stock notification system (with either data management, or transport support), are uncertain, as compared to a paper‐based system, in terms of availability of functioning bicycles for transporting stock and the proportion of HSAs with products in stock (SC4CCM 2013), as the certainty of evidence was very low. When evaluating health information strengthening as part of comprehensive quality improvement intervention, compared to no intervention, the effect was uncertain on a range of outcomes, as the certainty of the evidence was very low (Mutale 2014).
In sum, the review indicates mixed effects of mainly technical interventions to improve data quality, with gaps in evidence on the 'data use for decision‐making' component of RHIS. This finding of mixed effects is shared by two related systematic review reports (Bosch‐Caplanch 2018; Hotchkiss 2012). It may be that, as observed in other settings, technical interventions may improve timeliness and accessibility of data, but by themselves may not be sufficient to improve other elements of data quality and service quality, and that more organisational and behavioural support interventions are required (Aqil 2009; Hotchkiss 2010; Hotchkiss 2012; Nutley 2013; Nutley 2014; Sligo 2017; Wagenaar 2017). Nutley and colleagues, drawing on their previous work, developed a logic model to describe a pathway of how specific activities and interventions can strengthen the use of health data in decision‐making (Nutley 2013). They noted that failure to use data for decision‐making was "due primarily to the complex causal pathway between data collection, use of data, and improvement in health outcomes" (Nutley 2013). Intervention design may need to look at deliberate activities that “builds links between data collection and decision‐making processes”, such as identification of information needs, capacity building to analyse, synthesise and interpret data, and policies to support an organisational culture of data use (Nutley 2014).
The review identifies gaps in our understanding of the conceptual, methodological, intervention design and implementation challenges in the field of RHIS for strengthening health system management. The included studies provide an initial set of experimental evidence on the topic. The methodological and conceptual challenges (and possible solutions for studying the effects of routine information systems), are addressed under Implications for research below.
Overall completeness and applicability of evidence
Studies focused mostly on technical interventions to improve data quality and some included effects on service delivery quality. The review did not identify any studies with an explicit focus on strengthening capacity and processes for data use in health system management. In the data quality improvement studies included in this review, the data use component was implicit or described in other ways, thus providing indirect evidence to answer the review question. Examples are where data quality was improved for a public health purposes, such as community‐based surveillance (Joos 2016); or the intervention spans the health system, as in the case of district‐wide laboratory information systems (Blaya 2009; Blaya 2009), or a province‐wide hospital information system (Mbananga 2002).
There is a gap in studies that assess information support beyond clinical information systems—such as information systems for management of human resources, finance, medicine and equipment supply—and governance and general operational management systems. None of the analysed studies are from high‐income countries or from low and middle‐income countries in Asia. Studies awaiting classification include one study from Asia and one from North America.
Certainty of the evidence
We found the evidence to be mostly of low to very low certainty, largely due to methodological limitations and the indirect nature of the evidence. We downgraded findings mainly for risk of bias, imprecision, and indirectness. Interventions were too varied to allow for pooled risk analysis, resulting in outcomes being based on single studies. Imprecision was attributed to small sample sizes and low event rates. Reporting biases also contributed to imprecision as variances were not reported for some studies, leading to uncertain effect estimates. We downgraded most studies for indirectness as they did not explicitly address the data use component of the review question and thus provided partial evidence. Another reason for downgrading directness is that all results are from single studies conducted in one setting, and it is likely that the effects are strongly influenced by the systems and other contextual arrangements in this setting.
Potential biases in the review process
The PRISM framework highlights the socio‐technical nature of RHIS interventions, suggesting that the interdependence of technical, behavioural and organisational factors makes interventions complex to design, implement and evaluate (Aqil 2009; Hotchkiss 2010; Hotchkiss 2012; Zuske 2017). In the course of conducting this review, the complexity of our RHIS review question became more evident. Both RHIS strengthening and health system management are complex processes (because of multi‐dimensional and interdependent components), which makes them hard to define and measure accurately. The causal mechanisms by which health information support impacts on health system management decision‐making and actions, and in turn the impact of those decisions on health system and patient health outcomes, are not clear, and are still emerging (Hazel 2017; Hotchkiss 2010; Hotchkiss 2012; Nutley 2013; Sligo 2017). These conceptual complexities may also make indexing and identifying of such studies more challenging.
Despite the large number of records screened, we identified only a small number of studies meeting our methodological inclusion criteria. We did not find eligible studies that explicitly tested interventions to strengthen data use for decision‐making, thus providing only partial evidence of the effect of RHIS intervention improvements on health system management. Given the complexity of the RHIS terrain, inclusion of eligible studies often required difficult and sometimes contested judgements between the review authors. We debated many studies testing technical, electronic interventions to improve quality and use of clinical information systems. Inclusion was only considered if such interventions had some indications of broader health system‐wide, management components.
The searches for the main databases were done in May 2019. It is possible that some relevant studies published after the last search date have not been included in the review and the review authors acknowledge this limitation. In addition, some potentially relevant studies are listed as awaiting assessment as they were identified after completion of the analysis. However, we do not think that these limitations have a substantive impact on the reliability of the main findings and conclusions of the review.
Agreements and disagreements with other studies or reviews
When we started this review, there were no published systematic reviews on the effects of RHIS interventions for strengthened health system management. A grey literature report assessed the role of routine health information in LMICs, and concluded that there are knowledge gaps on the ability of RHIS to improve health system performance (Hotchkiss 2012). The Hotchkiss report did not exclude for study methods and it identified one study that was also eligible for inclusion in our review (Mbananga 2002). In the course of conducting our review, we became aware of three systematic literature reviews that had some overlap with our review. These were Bosch‐Caplanch 2018 (health information use for PHC management); Tursunbayeva 2017 (health information systems for human resources for health); and Agarwal 2019 (digital tracking of health commodities and stock levels). The Bosch‐Caplanch 2018 review differed from ours in that it included clinical management, and was limited to primary health care and LMIC settings. It captured two studies that were in our review (Blaya 2009 and Joos 2016), and we included three studies from their review ‒ these are awaiting classification (He 2014; Monyarit 2014; Toda 2016). The Tursunbayeva 2017 review did not produce any studies with eligible design for inclusion in our review. The Agarwal 2019 review on medical product supply reviewed only one study (Shieshia 2014), which is a supplementary study in our review, linked to the SC4CCM 2013 study.
Our findings of mixed effects on data quality are in line with the findings from the Bosch‐Caplanch 2018 review. We concur with the conclusions of the Tursunbayeva 2017 and Agarwal 2019 reviews that experimental and quasi‐experimental studies on information systems for human resource and drug supply chain management are rare.
Reviews suggested that more interdisciplinary research is needed, with more analysis of how socio‐technical complexities influence RHIS improvements for strengthening health system management. In particular, we need research in LMICs where health information systems do not always function optimally (Agarwal 2019; Bosch‐Caplanch 2018; Hazel 2017; Hotchkiss 2010; Hotchkiss 2012; Nutley 2013; Sligo 2017; Tursunbayeva 2017; Wagenaar 2017). The 2019 WHO recommendations on digital interventions for health system strengthening also highlighted challenges with implementation and use of digital information systems, and stressed the importance of an enabling organisational environment, and adaptation of interventions to local country settings (WHO 2019).
Authors' conclusions
Implications for practice.
Complex adaptive health care settings demand continuous monitoring and improvement (Jordan 2010), and one would assume that effective use of data for decision‐making and action, would therefore, also require ongoing monitoring and evaluation of informational support interventions (Nutley 2013; Sligo 2017). Studies tested mainly technical interventions for improving data quality, and to a lesser extent quality of health care service delivery. While these technical interventions may have had some success in improving the timeliness and accessibility of data, they appear to be mostly insufficient for improving data completeness and accuracy, or for improving efficiency or effectiveness of health service delivery. Health systems require availability of good‐quality data, but this may be insufficient for supporting the use of data in health system management decision‐making (Sligo 2017).Health authorities and practitioners may need to consider implementing interventions that explicitly focus on improving the link between routine data collection and use of data for decision‐making (Nutley 2013; Sligo 2017). Activities and policies may need to focus on building capacity in data management and data use competencies (analysis, synthesis, interpretation, critical review of data and data‐informed decision‐making), and organisational culture and practice of monitoring, evaluation and communication of data use interventions (Hotchkiss 2010; Hotchkiss 2012; Nutley 2013; Nutley 2014; Wagenaar 2017), and that encourages health managers, frontline health providers and users of health services, to take responsibility for using data to inform decision‐making (Zuske 2017).
Implications for research.
The scope and methodology of included studies indicate that routine information can be studied experimentally. This review included studies that tested interventions in operational settings at different levels of the health system (hospital, community‐based, primary‐care‐based, district‐ and province‐wide information systems), which shows that information interventions can be tested experimentally, in large‐scale operational settings.
There is a large and diverse body of literature on improving the quality and use of clinical information systems for clinical management (Aspry 2013; Bassi 2012; Bassi 2013; Black 2011; Chaudhry 2006; Lau 2010). However, there is a gap in studying information systems for enhancing management of other health system functions, such as those related to human resources, finances, drug supply systems, governance and general operational management (Sligo 2017).
The complex causal links between data collection and data use, and between data use and system impact, require that researchers develop more conceptual clarity on the role of routine information systems in data‐driven decision‐making (Hazel 2017; Hotchkiss 2012; Nutley 2013; Nutley 2014; Tursunbayeva 2017). This may require “more coherent terminology, theory and frameworks for analysis” (Tursunbayeva 2017). To guide intervention and study design, researchers and practitioners may benefit from synthesised conceptual frameworks that draw on theory and practice evidence, and that map the activities and processes of informational support for health management (see examples by Nutley 2013 and Zuske 2017),
We need to identify what components are needed for the design and evaluation of a RHIS, so that it can effectively support health system management decision‐making. We especially need to identify the factors influencing the demand for and use of data (Hotchkiss 2012; Nutley 2013; Nutley 2014; Tursunbayeva 2017). An underlying causal assumption may be that positive experiences of using data, may in turn lead to demand for additional, improved health information systems (Nutley 2013). Future research questions to consider include the following.
How does one measure and quantify decision making based on data received?
What are the behavioural and organisational factors that determine the purpose and value of routine health information?
What factors affect how staff and managers view and engage with routine data? What motivates or de‐motivates their use of routine data?
How does capacity (such as health information literacy, ability to analyse, synthesise, interpret and critically reflect on routine information) influence their use of data?
What are the organisational processes and dynamics of management decision‐making? (For example, issues of autonomy in decision‐making) (Hotchkiss 2012; Tursunbayeva 2017).
We need innovative methods to study these questions, including qualitative, exploratory work prior to designing interventions for testing, and conceptual frameworks that can account for the complexity. Formative qualitative research and process evaluations can provide important insights on why and how things work and the role of organisational and other contextual factors (Hotchkiss 2012; Nutley 2013; Sligo 2017). We included several trials in this review, which shows it is possible to study large‐scale RHIS interventions experimentally. We need to have a better understanding of the causal mechanisms by which information support may affect change in management decision‐making, to inform robust intervention design and evaluation methods. These should include large‐scale, health‐system‐wide, experimental and quasi‐experimental methods, using a longitudinal approach (including interrupted time‐series design or controlled before‐after designs) (Bosch‐Caplanch 2018; Hotchkiss 2012; Nutley 2013; Rahimi 2007; Ramsay 2003; Sligo 2017;). Longitudinal and interdisciplinary study approaches are needed that account for the multi‐component, multi‐level, interdependent and long‐term nature of complex information systems (Hotchkiss 2012; Nutley 2013; Sligo 2017). Implementation research approaches may also be helpful for understanding data‐driven decision‐making mechanisms in operational settings (Hotchkiss 2012; Nutley 2013; Sligo 2017).
We know that there are many operational research studies on strengthening health information systems, as well as global efforts like the National Health Workforce Accounts initiative, led by the World Health Organization (WHO 2017), and studies funded by international aid agencies. It is unclear how these are being evaluated, however, or what evidence informed their design. There are also large‐scale studies emerging that focus explicitly on improving data‐driven decision‐making. One example is an intervention to strengthen the use of health data in decision‐making in Côte d'Ivoire that consisted of eight core activities, including identifying information and data needs, improving data quality and accessibility, building core data management and data use competencies, and ongoing monitoring and evaluation of data‐use interventions (Nutley 2014). In Malawi, a data use intervention used simple wall charts by community and facility health workers to collect and visualise data to monitor and make decisions about improving community‐based drug supply and other systems (Hazel 2017). Both studies used a before‐after study design without comparative control sites; control sites would have enhanced the robustness of the study design and therefore of the findings.
History
Protocol first published: Issue 12, 2015 Review first published: Issue 8, 2020
Acknowledgements
We gratefully acknowledge the following individuals and institutions who all played an important part in this review.
Nandi Siegfried, from the South African Medical Research Council (SAMRC), who assisted with conceptualising the presentation of 'Summary of findings' (SoF) tables, gave assistance with creation of the SoF tables, and reviewed a draft of the report findings.
Anthony Hawkridge from the Western Cape Provincial Department of Health, who provided early advice on improving the usefulness of the review for policy makers, and who reviewed an early draft of the report.
The review was supported by the Norwegian Satellite of Cochrane Effective Practice and Organisation of Care (EPOC), who receives funding from the Norwegian Agency for Development Cooperation (NORAD), via the Norwegian Institute of Public Health, to support review authors in the production of their reviews. Without this support to the novice review authors, the review would not have been possible. We are grateful to the following staff from the Norwegian Satellite of the EPOC Group.
Simon Lewin provided guidance throughout the review (including for the protocol, presentation of findings and review of the report), including management and technical expertise as well as moral support throughout the review process.
Marit Johansen developed the search strategy, ran the searches, and drafted the text for the search results.
Elizabeth Paulsen provided guidance throughout the review and especially during the editing of the manuscript.
Gabriel Rada was the editor for the protocol and provided editorial support in the early stage of the review.
Claire Glenton provided editorial assistance with the Abstract and Plain Language Summary.
Xavier Bosch‐Caplanch provided expert editorial guidance and shared key resources.
We acknowledge the valuable guidance received from the peer reviewers, Wilbroad Mutale and Manish Kumar. We also thank the study authors for addressing our questions and requests for information and the Cochrane Copy Edit Support team for copy‐editing the protocol.
This review was funded by Alliance for Health Policy and Systems Research, an international partnership hosted by the World Health Organization, with support from the Norwegian Government Agency for Development Cooperation (NORAD), the Swedish International Development Cooperation Agency (SIDA) and the UK Department for International Development (DFID) (WHO Reference 2014/446658‐1). NL, AH, WO and YB are supported by funding from SAMRC (www.mrc.ac.za). Towards the end of the review, NL was supported by funding from NORAD, via the Norwegian Institute of Public Health. KD was previously funded by SAMRC. BS was funded by the University of Cape Town and later by SAMRC. VZ was funded by the University of Cape Town and the Western Cape Provincial Department of Health. JAW was funded by the University of Warwick, UK. NL, KD, and WO attended a 3‐day fellowship offered by Cochrane South Africa, at SAMRC, funded by the Effective Health Care Research Consortium (a consortium receiving UK Government aid, for the benefit of developing countries (Grant: 5242); (the views expressed in this publication do not necessarily reflect UK government policy). We acknowledge the Health Systems Research Unit at SAMRC for the administrative support of Sylvia Louw and the support of the Director, Catherine Mathews.
Appendices
Appendix 1. Routine health information system definition and data sources
A health information system is "a set of components and procedures organized with the objective of generating information which will improve health care management decisions at all levels of the health system” (Lippeveld 2000). Routine health information system (RHIS) information is usually drawn from data on provision and use of services and health impact. Routine health information can consist of a variety of data sources which may be collected over regular time periods (e.g. monthly, quarterly, annually) including information related to clinical service delivery (e.g. clinical registers) and medicine, laboratory and other diagnostic services record systems. It can also include routine administrative record systems (e.g. time sheets) (Riley 2012); and human resource and financial management information systems.
The health services themselves may not routinely collect some data, such as population‐based surveillance data indicating birth and mortality rates, but may still form part of the RHIS for producing meaningful health indicators. On the other hand, episodic surveillance surveys such as District Household Surveys, which are intermittent rather than ongoing and routine, are not considered as part of the routine health information system.
Appendix 2. Search strategies
CENTRAL, Cochrane Library (searched 15 May 2019)
| ID | Search | Hits |
| #1 | MeSH descriptor: [Health Information Systems] this term only | 10 |
| #2 | MeSH descriptor: [Hospital Information Systems] this term only | 42 |
| #3 | MeSH descriptor: [Management Information Systems] this term only | 9 |
| #4 | MeSH descriptor: [Ambulatory Care Information Systems] this term only | 25 |
| #5 | MeSH descriptor: [Clinical Laboratory Information Systems] this term only | 8 |
| #6 | MeSH descriptor: [Clinical Pharmacy Information Systems] this term only | 21 |
| #7 | MeSH descriptor: [Radiology Information Systems] this term only | 25 |
| #8 | MeSH descriptor: [Medical Order Entry Systems] this term only | 61 |
| #9 | MeSH descriptor: [Personnel Staffing and Scheduling Information Systems] this term only | 1 |
| #10 | MeSH descriptor: [Health Information Management] this term only | 6 |
| #11 | MeSH descriptor: [Decision Support Systems, Management] this term only | 8 |
| #12 | MeSH descriptor: [Health Information Exchange] this term only | 5 |
| #13 | MeSH descriptor: [Information Management] this term only | 16 |
| #14 | routin* near/3 (health* next info* or "health care" next info* or health* next data or "health care" next data or medical next info* or "medical data" or clinical next info* or "clinical data" or management next info*):ti,ab,kw | 109 |
| #15 | ((manage or management) near/3 (health* next info* or "health care" next info* or health* next data or "health care" next data or medical next info* or "medical data" or clinical next info* or "clinical data" or management next info*)):ti,ab,kw | 203 |
| #16 | (health* next system* or "health care" next system*):ti,ab,kw and (health* next info* or "health care" next info* or medical next info*):ti,ab,kw | 169 |
| #17 | ((health* or management or admin* or "human resources" or HR or personnel or staff or financial or medical or clinical or hospital or pharmacy or laboratory or radiology) next (info* next system*)):ti,ab,kw | 602 |
| #18 | (info* next management next system*):ti,ab,kw | 34 |
| #19 | (health* next info* next exchange or "health care" next info* next exchange):ti,ab,kw | 25 |
| #20 | (decision next support next system*):ti,ab,kw and (health* next info* or "health care" next info* or medical next info*):ti,ab,kw | 76 |
| #21 | (decision next support next tool*):ti,ab,kw and (health* next info* or "health care" next info* or medical next info*):ti,ab,kw | 12 |
| #22 | (computer near/2 system*):ti,ab,kw and (paper near/2 system* or manual near/2 system*):ti,ab,kw | 16 |
| #23 | #1 or #2 or #3 or #4 or #5 or #6 or #7 or #8 or #9 or #10 or #11 or #12 or #13 or #14 or #15 or #16 or #17 or #18 or #19 or #20 or #21 or #22 in Trials | 1169 |
MEDLINE and Epub Ahead of Print, In‐Process & Other Non‐Indexed Citations and Daily 1946 to 14 May 2019, Ovid (searched 15 May 2019)
| # | Searches | Results |
| 1 | Health Information Systems/ | 1099 |
| 2 | Hospital Information Systems/ | 10817 |
| 3 | Management Information Systems/ | 3679 |
| 4 | Ambulatory Care Information Systems/ | 1166 |
| 5 | Clinical Laboratory Information Systems/ | 2026 |
| 6 | Clinical Pharmacy Information Systems/ | 1177 |
| 7 | Radiology Information Systems/ | 5555 |
| 8 | Medical Order Entry Systems/ | 2098 |
| 9 | "Personnel Staffing and Scheduling Information Systems"/ | 425 |
| 10 | Health Information Management/ | 745 |
| 11 | Decision Support Systems, Management/ | 946 |
| 12 | Health Information Exchange/ | 696 |
| 13 | or/1‐12 | 28441 |
| 14 | Health Records, Personal/ | 1389 |
| 15 | Medical Records/ | 64765 |
| 16 | Dental Records/ | 3195 |
| 17 | Hospital Records/ | 3304 |
| 18 | Nursing Records/ | 6570 |
| 19 | Medical Records Systems, Computerized/ | 18912 |
| 20 | Electronic Health Records/ | 16344 |
| 21 | Health Smart Cards/ | 44 |
| 22 | Registries/ | 80134 |
| 23 | Computer Communication Networks/ | 13458 |
| 24 | Decision Support Systems, Clinical/ | 7187 |
| 25 | Medical Informatics/ | 11059 |
| 26 | Dental Informatics/ | 167 |
| 27 | Nursing Informatics/ | 1462 |
| 28 | Public Health Informatics/ | 1134 |
| 29 | Medical Informatics Applications/ | 2405 |
| 30 | Medical Record Linkage/ | 4498 |
| 31 | or/14‐30 | 219461 |
| 32 | Information Systems/ | 18754 |
| 33 | Information Management/ | 3466 |
| 34 | Information Dissemination/ | 15326 |
| 35 | or/32‐34 | 37069 |
| 36 | 31 and 35 | 7261 |
| 37 | ((routin* adj3 health* info*) or (routin* adj3 health care info*) or (routin* adj3 health* data) or (routin* adj3 health care data) or (routin* adj3 medical info*) or (routin* adj3 medical data) or (routin* adj3 clinical info*) or (routin* adj3 clinical data) or (routin* adj3 management info*)).ti,ab,kf. | 1029 |
| 38 | ((manage* adj3 health* info*) or (manage* adj3 health care info*) or (manage* adj3 health* data) or (manage* adj3 health care data) or (manage* adj3 medical info*) or (manage* adj3 medical data) or (manage* adj3 clinical info*) or (manage* adj3 clinical data) or (manage* adj3 management info*)).ti,ab,kf. | 3909 |
| 39 | ((health* system? or health care system?) and (health* info* or health care info* or medical info*)).ti,ab,kf. | 2453 |
| 40 | (health* info* system? or health care info* system?).ti,ab,kf. | 3825 |
| 41 | management info* system?.ti,ab,kf. | 975 |
| 42 | admin* info* system?.ti,ab,kf. | 26 |
| 43 | ((human resources or HR or personnel or staff) adj info* system?).ti,ab,kf. | 27 |
| 44 | financial info* system?.ti,ab,kf. | 33 |
| 45 | medical info* system?.ti,ab,kf. | 878 |
| 46 | clinical info* system?.ti,ab,kf. | 1573 |
| 47 | hospital info* system?.ti,ab,kf. | 2497 |
| 48 | pharmacy info* system?.ti,ab,kf. | 109 |
| 49 | laboratory info* system?.ti,ab,kf. | 942 |
| 50 | radiology info* system?.ti,ab,kf. | 549 |
| 51 | info* management system?.ti,ab,kf. | 1251 |
| 52 | (health* info* exchange or health care info* exchange).ti,ab,kf. | 904 |
| 53 | (decision support system? and (health* info* or health care info* or medical info*)).ti,ab,kf. | 380 |
| 54 | (decision support tool? and (health* info* or health care info* or medical info*)).ti,ab,kf. | 90 |
| 55 | ((computer adj2 system?) and (paper adj2 system?)).ti,ab,kf. | 45 |
| 56 | ((computer adj2 system?) and (manual adj2 system?)).ti,ab,kf. | 48 |
| 57 | or/37‐56 | 18359 |
| 58 | 13 or 36 or 57 | 48140 |
| 59 | randomised controlled trial.pt. | 482050 |
| 60 | controlled clinical trial.pt. | 93069 |
| 61 | multicenter study.pt. | 250148 |
| 62 | pragmatic clinical trial.pt. | 1052 |
| 63 | non‐randomized controlled trials as topic/ | 492 |
| 64 | interrupted time series analysis/ | 576 |
| 65 | controlled before‐after studies/ | 391 |
| 66 | (randomis* or randomiz* or randomly).ti,ab. | 828787 |
| 67 | groups.ab. | 1913283 |
| 68 | (intervention? or effect? or impact? or trial or multicenter or multi center or multicentre or multi centre).ti. | 2205656 |
| 69 | (controlled or control group? or (before adj5 after) or (pre adj5 post) or ((pretest or pre test) and (posttest or post test)) or quasiexperiment* or quasi experiment* or evaluat* or time series or time point? or repeated measur*).ti,ab. | 4383382 |
| 70 | or/59‐69 | 7278095 |
| 71 | exp Animals/ | 22309732 |
| 72 | Humans/ | 17729800 |
| 73 | 71 not (71 and 72) | 4579932 |
| 74 | review.pt. | 2512650 |
| 75 | meta analysis.pt. | 100849 |
| 76 | news.pt. | 195126 |
| 77 | comment.pt. | 774092 |
| 78 | editorial.pt. | 490818 |
| 79 | cochrane database of systematic reviews.jn. | 14157 |
| 80 | comment on.cm. | 774036 |
| 81 | (systematic review or literature review).ti. | 131254 |
| 82 | or/73‐81 | 8242826 |
| 83 | 70 not 82 | 5336390 |
| 84 | 58 and 83 | 10915 |
Embase 1974 to 2019 Week 19, Ovid (searched 15 May 2019)
| # | Searches | Results |
| 1 | ((routin* adj3 health* info*) or (routin* adj3 health care info*) or (routin* adj3 health* data) or (routin* adj3 health care data) or (routin* adj3 medical info*) or (routin* adj3 medical data) or (routin* adj3 clinical info*) or (routin* adj3 clinical data) or (routin* adj3 management info*)).ti,ab. | 1422 |
| 2 | (manage* health* info* or manage* health care info* or manage* health* data or manage* health care data or manage* medical info* or manage* medical data or manage* clinical info* or manage* clinical data or manage* management info*).ti,ab. | 123 |
| 3 | (health* info* system? or health care info* system?).ti,ab. | 4419 |
| 4 | management info* system?.ti,ab. | 1216 |
| 5 | admin* info* system?.ti,ab. | 30 |
| 6 | ((human resources or HR or personnel or staff) adj info* system?).ti,ab. | 29 |
| 7 | financial info* system?.ti,ab. | 35 |
| 8 | medical info* system?.ti,ab. | 1115 |
| 9 | clinical info* system?.ti,ab. | 1934 |
| 10 | hospital info* system?.ti,ab. | 3303 |
| 11 | pharmacy info* system?.ti,ab. | 150 |
| 12 | laboratory info* system?.ti,ab. | 2063 |
| 13 | radiology info* system?.ti,ab. | 811 |
| 14 | info* management system?.ti,ab. | 1835 |
| 15 | (health* info* exchange or health care info* exchange).ti,ab. | 915 |
| 16 | (decision support system? and (health* info* or health care info* or medical info*)).ti,ab. | 308 |
| 17 | (decision support tool? and (health* info* or health care info* or medical info*)).ti,ab. | 89 |
| 18 | ((computer adj2 system?) and (paper adj2 system?)).ti,ab. | 53 |
| 19 | ((computer adj2 system?) and (manual adj2 system?)).ti,ab. | 68 |
| 20 | or/1‐19 | 18928 |
| 21 | Randomized Controlled Trial/ | 547790 |
| 22 | Controlled Clinical Trial/ | 462464 |
| 23 | Quasi Experimental Study/ | 5562 |
| 24 | Pretest Posttest Control Group Design/ | 385 |
| 25 | Time Series Analysis/ | 22958 |
| 26 | Experimental Design/ | 16902 |
| 27 | Multicenter Study/ | 214799 |
| 28 | (randomis* or randomiz* or randomly).ti,ab. | 1152922 |
| 29 | groups.ab. | 2631469 |
| 30 | (intervention? or effect? or impact? or trial or multicenter or multi center or multicentre or multi centre).ti. | 2547390 |
| 31 | (controlled or control group? or (before adj5 after) or (pre adj5 post) or ((pretest or pre test) and (posttest or post test)) or quasiexperiment* or quasi experiment* or evaluat* or time series or time point? or repeated measur*).ti,ab. | 5995570 |
| 32 | or/21‐31 | 9375082 |
| 33 | exp animals/ or exp invertebrate/ or animal experiment/ or animal model/ or animal tissue/ or animal cell/ or nonhuman/ | 25820137 |
| 34 | human/ or normal human/ or human cell/ | 19690575 |
| 35 | 33 and 34 | 19635827 |
| 36 | 33 not 35 | 6184310 |
| 37 | 32 not 36 | 7485781 |
| 38 | 20 and 37 | 7233 |
| 39 | limit 38 to embase | 3330 |
Global Health 1973 to 2016 Week 15, Ovid (searched 26 April 2016)
| # | Searches | Results |
| 1 | ((routin* adj3 health* info*) or (routin* adj3 health care info*) or (routin* adj3 health* data) or (routin* adj3 health care data) or (routin* adj3 medical info*) or (routin* adj3 medical data) or (routin* adj3 clinical info*) or (routin* adj3 clinical data) or (routin* adj3 management info*)).af. | 169 |
| 2 | ((manage* adj3 health* info*) or (manage* adj3 health care info*) or (manage* adj3 health* data) or (manage* adj3 health care data) or (manage* adj3 medical info*) or (manage* adj3 medical data) or (manage* adj3 clinical info*) or (manage* adj3 clinical data) or (manage* adj3 management info*)).af. | 619 |
| 3 | ((health* system? or health care system?) and (health* info* or health care info* or medical info*)).af. | 502 |
| 4 | (health* info* system? or health care info* system?).af. | 737 |
| 5 | management info* system?.af. | 271 |
| 6 | admin* info* system?.af. | 5 |
| 7 | ((human resources or HR or personnel or staff) adj info* system?).af. | 55 |
| 8 | financial info* system?.af. | 4 |
| 9 | medical info* system?.af. | 43 |
| 10 | clinical info* system?.af. | 47 |
| 11 | hospital info* system?.af. | 267 |
| 12 | pharmacy info* system?.af. | 3 |
| 13 | laboratory info* system?.af. | 107 |
| 14 | radiology info* system?.af. | 6 |
| 15 | info* management system?.af. | 245 |
| 16 | (health* info* exchange or health care info* exchange).af. | 61 |
| 17 | (decision support system? and (health* info* or health care info* or medical info*)).af. | 28 |
| 18 | (decision support tool? and (health* info* or health care info* or medical info*)).af. | 4 |
| 19 | ((computer adj2 system?) and (paper adj2 system?)).af. | 1 |
| 20 | ((computer adj2 system?) and (manual adj2 system?)).af. | 0 |
| 21 | or/1‐20 | 2502 |
| 22 | (randomis* or randomiz* or randomly or trial or intervention? or effect? or impact? or multicenter or multi center or multicentre or multi centre or controlled or control group? or (before adj5 after) or (pre adj5 post) or ((pretest or pre test) and (posttest or post test)) or quasiexperiment* or quasi experiment* or evaluat* or time series or time point? or repeated measur* or groups).af. | 1314214 |
| 23 | 21 and 22 | 1398 |
| 24 | (randomis* or randomiz* or randomly or groups or trial).af. | 415936 |
| 25 | 21 and 24 | 401 |
| 26 | 23 not 25 | 997 |
PsycINFO 1806 to April Week 3 2016, Ovid (searched 26 April 2016)
| # | Searches | Results |
| 1 | ((routin* adj3 health* info*) or (routin* adj3 health care info*) or (routin* adj3 health* data) or (routin* adj3 health care data) or (routin* adj3 medical info*) or (routin* adj3 medical data) or (routin* adj3 clinical info*) or (routin* adj3 clinical data) or (routin* adj3 management info*)).ti,ab. | 70 |
| 2 | (manage* health* info* or manage* health care info* or manage* health* data or manage* health care data or manage* medical info* or manage* medical data or manage* clinical info* or manage* clinical data or manage* management info*).ti,ab. | 12 |
| 3 | (health* info* system? or health care info* system?).ti,ab. | 206 |
| 4 | management info* system?.ti,ab. | 401 |
| 5 | admin* info* system?.ti,ab. | 8 |
| 6 | ((human resources or HR or personnel or staff) adj info* system?).ti,ab. | 18 |
| 7 | financial info* system?.ti,ab. | 4 |
| 8 | medical info* system?.ti,ab. | 56 |
| 9 | clinical info* system?.ti,ab. | 101 |
| 10 | hospital info* system?.ti,ab. | 55 |
| 11 | pharmacy info* system?.ti,ab. | 4 |
| 12 | laboratory info* system?.ti,ab. | 7 |
| 13 | radiology info* system?.ti,ab. | 2 |
| 14 | info* management system?.ti,ab. | 112 |
| 15 | (health* info* exchange or health care info* exchange).ti,ab. | 63 |
| 16 | (decision support system? and (health* info* or health care info* or medical info*)).ti,ab. | 27 |
| 17 | (decision support tool? and (health* info* or health care info* or medical info*)).ti,ab. | 11 |
| 18 | ((computer adj2 system?) and (paper adj2 system?)).ti,ab. | 5 |
| 19 | ((computer adj2 system?) and (manual adj2 system?)).ti,ab. | 1 |
| 20 | or/1‐19 | 1130 |
| 21 | "Treatment Outcome/Clinical Trial".md. | 32651 |
| 22 | Empirical Study.md. | 1977080 |
| 23 | Prospective Study.md. | 32070 |
| 24 | Quantitative Study.md. | 1121969 |
| 25 | experimental design/ | 10150 |
| 26 | between groups design/ | 105 |
| 27 | quantitative methods/ | 2775 |
| 28 | quasi experimental methods/ | 142 |
| 29 | pretesting/ | 231 |
| 30 | posttesting/ | 133 |
| 31 | repeated measures/ | 620 |
| 32 | time series/ | 1612 |
| 33 | (posttest or posttests or post test or post tests or pretest or pretests or pre test or pre tests or "pretest/posttest" or quasi experimental or repeated measure or repeated measurement or repeated measurements or repeated measures or time series).id. | 2958 |
| 34 | (randomis* or randomiz* or randomly or trial or intervention? or effect? or impact? or multicenter or multi center or multicentre or multi centre or controlled or control group? or (before adj5 after) or (pre adj5 post) or ((pretest or pre test) and (posttest or post test)) or quasiexperiment* or quasi experiment* or evaluat* or time series or time point? or repeated measur* or groups).ti,ab. | 1792246 |
| 35 | or/21‐34 | 2680355 |
| 36 | 20 and 35 | 846 |
| 37 | "Treatment Outcome/Clinical Trial".md. | 32651 |
| 38 | (randomis* or randomiz* or randomly).ti,ab. or trial.ti. or groups.ab. | 489163 |
| 39 | or/37‐38 | 500197 |
| 40 | 20 and 39 | 129 |
| 41 | 36 not 40 | 717 |
The Grey Literature Report:http://www.greylit.org (searched January 2020)
1. "health information system"
2. "health information systems"
3. "health information management system"
4. "health information management systems"
5. "health management information system"
6. "health management information systems"
OpenGrey:http://www.opengrey.eu (searched January 2020)
1. "health information system" OR "health information systems" OR "health information management system" OR "health information management systems" OR "health management information system" OR "health management information systems"
International Clinical Trials Registry Platform (ICTRP):www.who.int/ictrp/en (searched January 2020)
Standard search:
1. health Information system OR health Information systems OR health Information management system OR health Information management systems OR health management information system OR health management information systems
Advanced search:
1. health Information system OR health Information systems OR health Information management system OR health Information management systems OR health management information system OR health management information systems in Title
OR
health Information system OR health Information systems OR health Information management system OR health Information management systems OR health management information system OR health management information systems in Condition
+ Recruiting: All
ClinicalTrials.gov:ClinicalTrials.gov (searched January 2020)
Advanced search:
1. In Condition or disease:
"health information system" OR "health information systems" OR "health information management system" OR "health information management systems" OR "health management information system" OR "health management information systems"
Web of Science Core Collection, Clarivate Analytics (searched 16 October 2019)
Citation search for included studies and relevant papers:
Blaya 2009; Blaya 2010; Blaya 2014; Joos 2016; Mutale 2014; Shiesha 2014
PubMed, NLM
‘Similar articles’ search for included studies and relevant papers (searched 16 October 2019)
Blaya 2009; Blaya 2010; Blaya 2014; Joos 2016; Mutale 2014; Shiesha 2014
Data and analyses
Comparison 1. Web‐based electronic TB laboratory information system compared to paper‐based system (Blaya 2014).
| Outcome or subgroup title | No. of studies | No. of participants | Statistical method | Effect size |
|---|---|---|---|---|
| 1.1 Length of time to report TB culture test results | 1 | 1671 | Hazard Ratio (IV, Fixed, 95% CI) | 0.68 [0.65, 0.71] |
| 1.2 Length of time to report TB drug susceptibility test results | 1 | 1671 | Hazard Ratio (IV, Fixed, 95% CI) | 0.67 [0.62, 0.72] |
| 1.3 Recording errors of TB culture test results (Overall) | 1 | 1195 | Odds Ratio (IV, Fixed, 95% CI) | 0.13 [0.07, 0.24] |
| 1.4 Recording errors of TB drug susceptibility test results (Overall) | 1 | 1270 | Odds Ratio (IV, Fixed, 95% CI) | 0.17 [0.09, 0.32] |
| 1.5 Recording errors: misidentification errors for TB culture test results | 1 | Odds Ratio (IV, Fixed, 95% CI) | 1.15 [0.47, 2.81] | |
| 1.6 Recording errors: misidentification errors for TB drug susceptibility test results | 1 | Odds Ratio (IV, Fixed, 95% CI) | 1.10 [0.46, 2.63] | |
| 1.7 Timeliness of starting or changing a patient's TB treatment | 1 | 1671 | Hazard Ratio (IV, Fixed, 95% CI) | 0.82 [0.55, 1.22] |
1.1. Analysis.

Comparison 1: Web‐based electronic TB laboratory information system compared to paper‐based system (Blaya 2014), Outcome 1: Length of time to report TB culture test results
1.2. Analysis.

Comparison 1: Web‐based electronic TB laboratory information system compared to paper‐based system (Blaya 2014), Outcome 2: Length of time to report TB drug susceptibility test results
1.3. Analysis.

Comparison 1: Web‐based electronic TB laboratory information system compared to paper‐based system (Blaya 2014), Outcome 3: Recording errors of TB culture test results (Overall)
1.4. Analysis.

Comparison 1: Web‐based electronic TB laboratory information system compared to paper‐based system (Blaya 2014), Outcome 4: Recording errors of TB drug susceptibility test results (Overall)
1.5. Analysis.

Comparison 1: Web‐based electronic TB laboratory information system compared to paper‐based system (Blaya 2014), Outcome 5: Recording errors: misidentification errors for TB culture test results
1.6. Analysis.

Comparison 1: Web‐based electronic TB laboratory information system compared to paper‐based system (Blaya 2014), Outcome 6: Recording errors: misidentification errors for TB drug susceptibility test results
1.7. Analysis.

Comparison 1: Web‐based electronic TB laboratory information system compared to paper‐based system (Blaya 2014), Outcome 7: Timeliness of starting or changing a patient's TB treatment
Comparison 2. Hand‐held electronic device for collecting TB laboratory information compared to a paper‐based system (Blaya 2009).
| Outcome or subgroup title | No. of studies | No. of participants | Statistical method | Effect size |
|---|---|---|---|---|
| 2.1 Length of time to report TB culture test results | 1 | 6153 | Mean Difference (IV, Fixed, 95% CI) | ‐25.20 [‐26.80, ‐23.60] |
| 2.2 Length of time to report TB smear test results | 1 | 6226 | Mean Difference (IV, Fixed, 95% CI) | ‐19.30 [‐20.70, ‐17.90] |
| 2.3 Recording errors | 1 | 2082 | Odds Ratio (IV, Fixed, 95% CI) | 0.41 [0.26, 0.65] |
| 2.4 Recording errors: misidentification errors | 1 | 2082 | Odds Ratio (IV, Fixed, 95% CI) | 0.14 [0.02, 1.20] |
2.1. Analysis.

Comparison 2: Hand‐held electronic device for collecting TB laboratory information compared to a paper‐based system (Blaya 2009), Outcome 1: Length of time to report TB culture test results
2.2. Analysis.

Comparison 2: Hand‐held electronic device for collecting TB laboratory information compared to a paper‐based system (Blaya 2009), Outcome 2: Length of time to report TB smear test results
2.3. Analysis.

Comparison 2: Hand‐held electronic device for collecting TB laboratory information compared to a paper‐based system (Blaya 2009), Outcome 3: Recording errors
2.4. Analysis.

Comparison 2: Hand‐held electronic device for collecting TB laboratory information compared to a paper‐based system (Blaya 2009), Outcome 4: Recording errors: misidentification errors
Comparison 3. Electronic hospital health information system compared to a paper‐based health information system (Mbananga 2002).
| Outcome or subgroup title | No. of studies | No. of participants | Statistical method | Effect size |
|---|---|---|---|---|
| 3.1 Length of time outpatients spend at hospital | 1 | Other data | No numeric data | |
| 3.2 Length of hospital stay | 1 | Other data | No numeric data | |
| 3.3 Revenue collection | 1 | Other data | No numeric data |
3.1. Analysis.
Comparison 3: Electronic hospital health information system compared to a paper‐based health information system (Mbananga 2002), Outcome 1: Length of time outpatients spend at hospital
| Length of time outpatients spend at hospital | |
| Study | Comment |
| Mbananga 2002 | Control: The median time that outpatients spent in control hospitals increased from 1.31 hours to 1.34 hours (a change of 0.03 hours). Intervention: The median time that outpatients spent in intervention hospital increased from 1.25 hours to 1.39 hours (a change of 0.14 hours). DID: 0.11 hours |
3.2. Analysis.
Comparison 3: Electronic hospital health information system compared to a paper‐based health information system (Mbananga 2002), Outcome 2: Length of hospital stay
| Length of hospital stay | |
| Study | Comment |
| Mbananga 2002 | Control: The median length of stay in control hospitals increased from 5 days to 6.1 days (a change of 1.1 days). Intervention: The median length of stay in intervention hospitals decreased from 4.8 days to 4.5 days (a change of 0.3 days). DID: ‐ 0.8 days |
3.3. Analysis.
Comparison 3: Electronic hospital health information system compared to a paper‐based health information system (Mbananga 2002), Outcome 3: Revenue collection
| Revenue collection | |
| Study | Comment |
| Mbananga 2002 | Control: The median revenue collected at control hospitals increased from R53 289.50 to R59 210.50 (a change of R5 921.00). Interevntion: The median revenue collected at intervention hospitals increased from R130 263.00 to R148 026.00 (a change of R17 763.00). DID: R11 842.00 |
Comparison 4. Brief text messaging (SMS) compared to low‐intensity brief text messaging for community based surveillance of pregnancy outcomes (Joos 2016).
| Outcome or subgroup title | No. of studies | No. of participants | Statistical method | Effect size |
|---|---|---|---|---|
| 4.1 Documentation of matched pregnancy outcome data | 1 | 10934 | Odds Ratio (IV, Fixed, 95% CI) | 0.94 [0.63, 1.40] |
4.1. Analysis.

Comparison 4: Brief text messaging (SMS) compared to low‐intensity brief text messaging for community based surveillance of pregnancy outcomes (Joos 2016), Outcome 1: Documentation of matched pregnancy outcome data
Comparison 5. Electronic drug stock notification with data management support compared to paper‐based stock notification (SC4CCM 2013).
| Outcome or subgroup title | No. of studies | No. of participants | Statistical method | Effect size |
|---|---|---|---|---|
| 5.1 Functioning bicycles for transporting stock | 1 | Other data | No numeric data | |
| 5.2 Health surveillance assistants with all 3 products in stock | 1 | Other data | No numeric data | |
| 5.3 Health surveillance assistants with all 4 products in stock | 1 | Other data | No numeric data |
5.1. Analysis.
Comparison 5: Electronic drug stock notification with data management support compared to paper‐based stock notification (SC4CCM 2013), Outcome 1: Functioning bicycles for transporting stock
| Functioning bicycles for transporting stock | |
| Study | Comment |
| SC4CCM 2013 | The proportion of functioning bicycles was 73% in the control group and 70% in the intervention group. |
5.2. Analysis.
Comparison 5: Electronic drug stock notification with data management support compared to paper‐based stock notification (SC4CCM 2013), Outcome 2: Health surveillance assistants with all 3 products in stock
| Health surveillance assistants with all 3 products in stock | |
| Study | Comment |
| SC4CCM 2013 | Control: The proportion of control HSAs with all three products in stock increased from 53% to 74% (a change of 21%). Intervention: The proportion of intervention HSAs with all three products in stock increased from 36% to 73% (a change of 37%). DID: 16% |
5.3. Analysis.
Comparison 5: Electronic drug stock notification with data management support compared to paper‐based stock notification (SC4CCM 2013), Outcome 3: Health surveillance assistants with all 4 products in stock
| Health surveillance assistants with all 4 products in stock | |
| Study | Comment |
| SC4CCM 2013 | Control: The proportion of HSAs with all four products in stock increased from 32% to 61% (a change of 29%). Intervention: The proportion of HSAs with all four products in stock increased from 28% to 63% (a change of 35%). DID: 6% |
Comparison 6. Electronic drug stock notification with support for transport of products (SC4CCM 2013).
| Outcome or subgroup title | No. of studies | No. of participants | Statistical method | Effect size |
|---|---|---|---|---|
| 6.1 Functioning bicycles for transporting stock | 1 | Other data | No numeric data | |
| 6.2 Health surveillance assistants with all 3 products in stock | 1 | Other data | No numeric data | |
| 6.3 Health surveillance assistants with all 4 products in stock | 1 | Other data | No numeric data |
6.1. Analysis.
Comparison 6: Electronic drug stock notification with support for transport of products (SC4CCM 2013), Outcome 1: Functioning bicycles for transporting stock
| Functioning bicycles for transporting stock | |
| Study | Comment |
| SC4CCM 2013 | The proportion of functioning bicycles was 73% in the control group and 77% in the intervention group. |
6.2. Analysis.
Comparison 6: Electronic drug stock notification with support for transport of products (SC4CCM 2013), Outcome 2: Health surveillance assistants with all 3 products in stock
| Health surveillance assistants with all 3 products in stock | |
| Study | Comment |
| SC4CCM 2013 | Control: The percent of HSAs with all three products in stock increased from 53% to 80% (a change of 27%). Intervention: The percent of HSAs with all three products in stock increased from 17% to 76% (a change of 59%). DID: 32% |
6.3. Analysis.
Comparison 6: Electronic drug stock notification with support for transport of products (SC4CCM 2013), Outcome 3: Health surveillance assistants with all 4 products in stock
| Health surveillance assistants with all 4 products in stock | |
| Study | Comment |
| SC4CCM 2013 | Control: The proportion of HSAs with all four products in stock increased from 32% to 63% (a change of 31%). Intervention: The proportion of HSAs with all four products in stock increased from 39% to 61% (a change of 52%). DID: 21% |
Comparison 7. Health information strengthening as part of comprehensive quality improvement compared to no quality improvement (Mutale 2014).
| Outcome or subgroup title | No. of studies | No. of participants | Statistical method | Effect size |
|---|---|---|---|---|
| 7.1 Health worker motivation | 1 | Mean Difference (IV, Fixed, 95% CI) | ‐1.20 [‐6.50, 4.10] | |
| 7.2 Health worker training | 1 | Mean Difference (IV, Fixed, 95% CI) | 23.30 [2.30, 44.30] | |
| 7.3 Health information index | 1 | Mean Difference (IV, Fixed, 95% CI) | 7.30 [2.60, 12.00] | |
| 7.4 Clinical observation index ‐ children | 1 | Mean Difference (IV, Fixed, 95% CI) | 9.60 [‐6.60, 25.80] | |
| 7.5 Clinical observation index ‐ adults | 1 | Mean Difference (IV, Fixed, 95% CI) | 10.90 [2.13, 19.67] |
7.1. Analysis.

Comparison 7: Health information strengthening as part of comprehensive quality improvement compared to no quality improvement (Mutale 2014), Outcome 1: Health worker motivation
7.2. Analysis.

Comparison 7: Health information strengthening as part of comprehensive quality improvement compared to no quality improvement (Mutale 2014), Outcome 2: Health worker training
7.3. Analysis.

Comparison 7: Health information strengthening as part of comprehensive quality improvement compared to no quality improvement (Mutale 2014), Outcome 3: Health information index
7.4. Analysis.

Comparison 7: Health information strengthening as part of comprehensive quality improvement compared to no quality improvement (Mutale 2014), Outcome 4: Clinical observation index ‐ children
7.5. Analysis.

Comparison 7: Health information strengthening as part of comprehensive quality improvement compared to no quality improvement (Mutale 2014), Outcome 5: Clinical observation index ‐ adults
Characteristics of studies
Characteristics of included studies [ordered by study ID]
Blaya 2009.
| Study characteristics | ||
| Methods | STUDY TYPE: Cluster randomised trial COUNTRY: Peru SETTING: a TB laboratory monitoring system in Lima Peru. START DATE: Between‐district comparison = 24 March 24 2006 Within‐district comparison = 1 January 2004 END DATE: Between‐district comparison = 24 September 2006 Within‐district comparison = 31 July 2005 DURATION OF INTERVENTION: 6 months (24 March to 24 September 2006). FOLLOW UP: September 2006 |
|
| Participants | INCLUSION CRITERIA: Health establishment in 4 (out of the 5) health districts in Lima, Peru. No details given of names or whether urban or rural 2 districts were intervention arm sites and 2 districts were control arm sites EXCLUSION CRITERIA: None recorded |
|
| Interventions | INTERVENTION: This intervention aimed to improve RHIS by introducing digital data collection and management. A personal digital assistant (PDA)‐based electronic information device was used to collect TB test results in Peru (Blaya 2009). The PDA was used at the initial point of data entry at the clinical site to decrease delay time and errors, compared to the standard paper‐based data collection system. In the new system, bacteriology team members would visit a health centre or laboratory and copy the data directly from the laboratory register or chart using the PDA device. When back in the central office, they would then upload the data from the PDA to the open source Partners In Health Electronic Medical Record (PIH‐EMR). The PIH‐EMR is a web‐based system designed for TB and MDR‐TB treatment in resource‐poor settings. It allowed for the automated processing of data and data quality checks and used web pages that displayed information. The aims of this study were: "(1) to compare the processing time using the electronic system to the paper‐based system; (2) to compare the frequency of errors entered with and without the electronic system; and (3) to assess the system’s usability and its acceptability by users." (p.2). CONTROL: The standard paper‐based information collection system for TB test results. |
|
| Outcomes | Processing time was defined as "the number of days from the bacteriology result date to its entry into the PIH‐EMR." (p.4). This included TB culture and TB smear test results processing time. A collection error was defined as "an occurrence of information entered into the PIH‐EMR not matching the original laboratory notebook (gold standard). Collection errors included errors in result date, identification number, result, and if the result was assigned to the wrong patient (which was considered a misidentification error). |
|
| Notes | ETHICS: This study was approved by the Partners Human Research Committee and the Peruvian National Institute of Health. INFORMED CONSENT: Not reported FUNDING: Not reported in full. In the Acknowledgement they note: "We thank the Gates Foundation for their support in the development of the PIH‐EMR and the MIT Graduate Students Office for the Albert Memorial Fellowship to JAB" COMPETING INTERESTS: Recorded as "No conflict of interest to declare". It would appear that the authors were both the implementers and the evaluators of the study. |
|
| Risk of bias | ||
| Bias | Authors' judgement | Support for judgement |
| Random sequence generation (selection bias) | Unclear risk | Method of randomisation not specified |
| Allocation concealment (selection bias) | Unclear risk | Not stated if this was part of implementing the randomisation process |
| Blinding of participants and personnel (performance bias) All outcomes | Unclear risk | Blinding not possible but unclear as to how this may affect the outcome |
| Blinding of outcome assessment (detection bias) All outcomes | Unclear risk | Unclear how the outcome assessment will be affected |
| Incomplete outcome data (attrition bias) All outcomes | Low risk | Data was collected from the same number of HCs before and after the intervention |
| Selective reporting (reporting bias) | Unclear risk | Unclear if all pre‐specified outcomes are reported |
| Other bias | Unclear risk | Researchers were involved with implementation of new PDA system and the impact thereof is unclear. |
Blaya 2014.
| Study characteristics | ||
| Methods | STUDY TYPE: Cluster randomised trial. 2 sets of outcomes of the same intervention was reported in 3 papers, Blaya 2014, Blaya 2010a, and Blaya 2011. COUNTRY: Peru SETTING: This study was carried out in 2 health districts of Lima, Peru: Lima Ciudad and Lima Este. Lima Ciudad has 45 health establishments that include 24 health centres (HCs), 9 health posts, and 12 hospitals serving a population of 1,577,090 in an area of approximately 100 square km. Lima Este has 134 health establishments that include 42 HCs, 87 health posts, and 5 hospitals, serving a population of 1,088,515 in an area of approximately 6340 square km. START DATE OF IMPLEMENTATION: March 2006 END DATE OF TRIAL: 31 August 2008 DURATION OF TRIAL: 2 years, 5 months FOLLOW‐UP: Trial end (2 years, 5 months) |
|
| Participants | INCLUSION CRITERIA: In 2006, E‐Chasqui electronic TB information system was first implemented in the National Reference Laboratory (NRL) and 2 district laboratories of Lima, as part of the TB diagnostic services of the National TB Programme (NTP). After full implementation in the labs, they randomly assigned 6 HCs from each health district (12 in total) to the intervention. The intervention arm consisted of altogether 29 health facilities and the control arm consisted of 49 health facilities. "All individuals who lived within the catchment area of participating health centres and had at least 1 MDR‐TB risk factor as defined by the Peruvian NTP Norms were included in this study. Eligible subjects were identified when sputum samples were submitted to the district laboratory for DST, and eligibility criteria were confirmed by chart review. In Lima Ciudad, the 20 highest TB incidence HCs were randomly assigned, 6 to e‐Chasqui and 14 to controls. Only 6 were assigned to e‐Chasqui due to the limited implementation resources. In Lima Este, the 12 micro‐networks within Lima city limits were randomly assigned, 6 to e‐Chasqui and six to control. The 6 micro‐networks assigned to e‐Chasqui consisted of 6 point‐of‐care HCs with 17 peripheral HCs; the 6 control micro‐networks comprised 6 point‐of‐care HCs with 27 peripheral HCs." (p.3). In total, 49 HCs (781 patients) were assigned to the intervention arm and 29 HCs (890 patients) to the control arm. Intervention HCs had access to the Internet, so could receive results directly from the e‐Chasqui system, print results and send to the peripheral HCs or wait for paper copy to arrive from TB Laboratory and then send it to peripheral HCs. EXCLUSION CRITERIA: On an individual patient level, there were no exclusion criteria. On a District level, only 2 districts were included (due to different methods of dealing with paper results). On an HC level, only the 20 HCs with the highest TB incidence were included. BASELINE DATA: (Blaya 2014) "Baseline data were collected 15 months prior to the implementation of e‐Chasqui (1 January 2005 to 30 March 2006 for Lima Ciudad; 1 May 2005 to 18 August 2006 for Lima Este). However, the Lima Este district laboratory did not perform DST before the implementation of e‐Chasqui, hence there are no pre‐implementation data on DSTs for that district." (p.3). There were no significant differences between intervention and control HCs on a number of measures. There was no significant difference in the total number of cultures and DSTs between the intervention and control HCs. There was a significantly higher number of clinician changes and a lower baseline culture error rate in the intervention HCs, although the baseline DST error rate and all other characteristics were similar. |
|
| Interventions | INTERVENTION: This intervention aimed to improve RHIS by introducing digital data collection and management. e‐Chasqui is an electronic TB laboratory information system that communicates TB results to clinicians and public health administrators in Peru. The electronic information system provides the ability to register patients, order medications, display chest x‐rays, generate monthly reports for funders, and predict future drug requirements. The central feature of e‐Chasqui interface is a single patient page with the history of all tests performed for the patient. In the intervention group, point of care health centres (HCs) had Internet, which enabled them to have direct access to e‐Chasqui. These HCs could immediately view TB test results, print the results from e‐Chasqui to send to the peripheral HCs, or wait for the paper copy to arrive from the laboratory to send it on. All intervention HC staff were trained at their HC in an initial session for approximately one hour. The data administrator would then visit or call the HC at least twice a month and could be contacted via cell phone or email during business hours. In the control districts, TB test results were generated on paper by the National Research Laboratory and district laboratories and transported to health establishments. The purpose of the e‐Chasqui system was to reduce the time to communicate patients' test results, to enable quicker initiation of treatment and cure (as measured through sputum culture conversion testing, which is a clinical tool used to predict therapeutic efficacy in MDR‐TB patients) (Blaya 2014). Two secondary publications reported on reducing the error rate of reporting and recording laboratory test results (Blaya 2011; Blaya 2010a). CONTROL: The standard system where "paper results are generated by the NRL and district laboratories and transported to health establishments." (p.2). |
|
| Outcomes | PRIMARY OUTCOMES: (Blaya 2014) For both TB culture test (TB Culture) and Drug Susceptibility Test (DST) results
(Blaya 2010a)
SECONDARY OUTCOMES: (Extracted from Table 1, in Blaya 2014) For both TB culture test (TB culture) and Drug Susceptibility Test (DST) results
(Blaya 2010a)
|
|
| Notes | This study tests the efficiency and effectiveness of laboratory information systems in terms of how it supports data‐driven management decision‐making on planning, organising and TB care service improvement and health status outcomes on a district‐wide level. ETHICS, INFORMED CONSENT: The authors reported that the study was approved by the Partners Healthcare Human Research Committee and the Peruvian National Institute of Health, and that it had been registered in ClinicalTrials.gov with identifier NCT01201941. The institutional review boards waived the need for written informed consent from the participants because this was part of routine clinical care and the study was secondary use of clinical data. The protocol for this trial and supporting CONSORT checklist was available as supporting information. FUNDING: Harvard Global Infectious Diseases Program and David Rockefeller Center for Latin American Studies. COMPETING INTERESTS: "JAB is cofounder of eHealth Systems, a Chile‐based company providing health informatics consulting and implementation work" (Blaya 2011) (p.5). |
|
| Risk of bias | ||
| Bias | Authors' judgement | Support for judgement |
| Random sequence generation (selection bias) | Unclear risk | Not reported how randomisation was done |
| Allocation concealment (selection bias) | Low risk | Not done but unlikely to have affected the outcome. |
| Blinding of participants and personnel (performance bias) All outcomes | Low risk | Not possible to blind participants but outcome unlikely to be affected. |
| Blinding of outcome assessment (detection bias) All outcomes | Low risk | Assessors were not blinded but outcome measure unlikely to be affected |
| Incomplete outcome data (attrition bias) All outcomes | Unclear risk | No report of missing data provided |
| Selective reporting (reporting bias) | Unclear risk | Unclear if all prespecified outcomes reported |
| Other bias | High risk | Possible conflict of interest as the authors were also the developers of the E‐Chasqui Possible contamination bias due to crossover of some HCs between intervention and control. This is reported as potentially diluting the effect of the intervention. |
Joos 2016.
| Study characteristics | ||
| Methods | STUDY TYPE: Cluster randomised trial This trial tested whether supportive short messaging services (SMS), as a job aid, could improve reporting of pregnancies and pregnancy outcomes among community health worker or Health Surveillance Assistants (HSAs), as they are called in Malawi. COUNTRY: Malawi SETTING: The Institute for International Programs (IIP) at Johns Hopkins University and the Malawi National Statistical Office (NSO) collaborated to implement a community‐based vital event documentation system ('Real‐time Mortality Monitoring', RMM) using HSAs, government‐trained and paid CHWs with a scope of work set by the Malawi Ministry of Health. They implemented the RMM project in 2 districts in Malawi, the Balaka and Salima districts, to assess the completeness and accuracy of under‐5 mortality reporting by HSAs. START DATE: Phase 1: November 2012 Phase 2: June 2013 IMPLEMENTATION PERIOD: Phase 1: June 2013 Phase 2: November 2013 DURATION OF INTERVENTION 12 months The mHealth intervention had a 3‐week pilot phase; and a 12‐month implementation phase divided into two phases. The study team modified the intervention after 8 months of implementation to incorporate feedback from the HSAs suggesting that the variety of SMS and their frequency should be increased. FOLLOW UP: November 2013 |
|
| Participants | INCLUSION CRITERIA: Health facilities in 2 districts in Malawi, Balaka and Salima They randomised at the level of the cluster, health facilities (n = 30) and 156 HSAs consisting of 15 Intervention facilities (76 HSAs) and 15 control facilities (80 HSAs) They randomly selected 160 catchment areas: 80 from among 280 catchment areas in Balaka and 80 from among 355 catchment areas in Salima. Among the selected catchment areas, the average number of HSAs affiliated with a health facility was 5.2 (range: 1 to 19). The selected HSAs were associated with a total of 30 health facilities. All HSAs assigned to RMM catchment areas were eligible for inclusion in the mHealth intervention catchment areas: 80 from among 280 catchment areas in Balaka and 80 from among 355 catchment areas in Salima. The districts in the RMM project were selected for their high under‐5 mortality, high fertility, ease of access for the study team, average population size relative to other districts in the country, and full coverage by HSAs deployed in the district. Each HSA in Malawi is assigned to a catchment area of approximately 1000 inhabitants and its associated health facility, covering a radius of 8 kilometres except in district‐defined hard‐to‐reach catchment areas. They reported that they randomised at the level of the cluster, health facilities (n = 30) and not individual‐level randomisation, to prevent contamination from HSA collaboration and interaction at their associated health facility. EXCLUSION CRITERIA None stated |
|
| Interventions | INTERVENTION This intervention aimed to improve RHIS by introducing digital data collection and management. In Malawi, the Real‐time Mortality Monitoring (RMM) programme, used Health Surveillance Assistants (HSAs), who are government‐trained and paid community health workers, to improve a community‐based vital event documentation of pregnancies and pregnancy outcomes (e.g. births, neonatal deaths), using the Village Health Registers (VHRs). They used a mobile‐phone‐based SMS system as a job aid; one‐way short SMSes were sent to HSAs by the mobile health (mHealth) coordinator at the Malawi National Statistical Office (NSO), with motivational SMSes and SMSes with advice on improving data quality. The HSAs in the control group received minimal‐intensity SMS with basic motivational content. The study tested the effectiveness of SMS intervention in improving the complete documentation of pregnancies and pregnancy outcomes. |
|
| Outcomes | PRIMARY: Completeness of matched pregnancy documentation."The primary outcome measure was the improvement in matched pregnancy documentation between groups during the intervention period. Possible pregnancy outcomes included adverse events (abortion, miscarriage, stillbirth), live birth, and out‐migration of the pregnant mother. Pregnancies and outcomes were matched using the six‐digit HSA code and the woman’s unique 11‐digit ID. Matching results analysed for this study were (1) pregnancies matched to an outcome and (2) pregnancies without a matched outcome, to analyse the change in documentation of matched pregnancies between groups and over time." (p.7). SECONDARY: The secondary outcome measures were the improvements in matched pregnancy documentation by group between baseline and intervention periods. |
|
| Notes | ETHICS: "We obtained ethical approval in the USA from the Institutional Review Board (IRB) at the Johns Hopkins University Bloomberg School of Public Health, and in Malawi from the National Health Sciences Research Committee.." (p.7). INFORMED CONSENT: They obtained a waiver of written consent from the IRB. FUNDING: "Jennifer Bryce, the PI, received grant 7056791 from Foreign Affairs, Trade, and Development Canada." (p.1). They note that the funder had "no role in study design, data collection and analysis, decision to publish, or preparation of the manuscript" (p.1). They authors reported on funding of the Real‐time Monitoring project noting: "We are also grateful to Foreign Affairs, Trade and Development Canada for their generous financial support of the Real‐Time Monitoring of Under‐Five Mortality project" (p.14). COMPETING INTERESTS: None reported. One of the co‐authors, JP, is the PI for the RMM Project that is being studied, and both the author and the project is funded by one agency. |
|
| Risk of bias | ||
| Bias | Authors' judgement | Support for judgement |
| Random sequence generation (selection bias) | Low risk | A method of randomisation is described |
| Allocation concealment (selection bias) | Low risk | HSAs were masked to their treatment group allocation |
| Blinding of participants and personnel (performance bias) All outcomes | Low risk | Outcome is not likely to be influenced |
| Blinding of outcome assessment (detection bias) All outcomes | Low risk | Outcome is not likely to be influenced |
| Incomplete outcome data (attrition bias) All outcomes | Unclear risk | Not reported |
| Selective reporting (reporting bias) | Unclear risk | Unclear if all pre‐specified outcomes of interest are reported |
| Other bias | High risk | Researchers were also the implementers. Assessors were also responsible for maintaining an updated contact list of participants |
Mbananga 2002.
| Study characteristics | ||
| Methods | STUDY TYPE Controlled before‐after study The aim of the study was to evaluate the effectiveness of the computerised Hospital Information System (HIS) to the health care services overall and to provide lessons that can be learned from this evaluation process. COUNTRY: South Africa SETTING: The 42 public sector hospital in the Northern Province of South Africa, in 1998 (now known as the Limpopo Province). START DATE: April to June 2000 IMPLEMENTATION PERIOD: July 2000 to June 2001 DURATION OF INTERVENTION: 6 months FOLLOW UP: June 2001 |
|
| Participants | INCLUSION: 24 hospitals in the Northern Province of South Africa, of which 8 were in the intervention arm and 15 were in the control arm. Inclusion criteria not described. EXCLUSION: Not described |
|
| Interventions | INTERVENTION: This intervention aimed to improve RHIS by introducing digital data collection and management. A computerised hospital information system. The purpose of the HIS was (1) to improve patient care by providing patient information within and between hospitals; (2) to improve the delivery of services across the hospital departments (e.g. through improved patient administration and service performance evaluation systems); and (3) to improve the efficiency of hospital management health (e.g. improve financial management and revenue collection, aid management decision‐making by identifying primary cost drivers, and to provide accessible information for management at all levels of the health system. (see p.19). The report does not provide details of the HIS, though an associated paper describes the HIS as including the following functions (Littlejohns 2003).
CONTROL: The standard paper‐based hospital information system |
|
| Outcomes | PRIMARY:
SECONDARY: None described |
|
| Notes | The report had missing information. For instance, 2 pre‐specified outcomes were not reported on, there was no statistical comparison of differences between intervention and control sites and there was insufficient data to allow for recalculation and statistical comparisons all outcomes reported. ETHICS: Not reported INFORMED CONSENT: The authors reported that most participants in the study signed consent forms and that in some cases consent was verbal because the study was well known as it was advocated by the provincial office prior to implementation. FUNDING: Not reported COMPETING INTEREST: Not reported |
|
| Risk of bias | ||
| Bias | Authors' judgement | Support for judgement |
| Random sequence generation (selection bias) | High risk | Hospitals were allocated for logistical and policy related reasons |
| Allocation concealment (selection bias) | Unclear risk | Allocation concealment not possible and not enough detail to make a judgement |
| Blinding of participants and personnel (performance bias) All outcomes | Unclear risk | Not enough information to make a judgement |
| Blinding of outcome assessment (detection bias) All outcomes | Unclear risk | Not enough information to make a judgement |
| Incomplete outcome data (attrition bias) All outcomes | Unclear risk | No report of missing data is provided |
| Selective reporting (reporting bias) | High risk | Two prespecified outcomes are not reported |
| Other bias | Low risk | No other biases described |
Mutale 2014.
| Study characteristics | ||
| Methods | (Note page numbers are from Mutale 2014 unless otherwise indicated). STUDY TYPE: Cluster randomised trial The Better Health Outcomes through Mentoring and Assessment (BHOMA) study is a cluster randomised community and health facility‐based intervention to strengthen the clinical service delivery, utilisation and impact of services for maternal and child health, using multiple quality improvement strategies. The unit of randomisation is the health facility and its catchment population. However this paper does not report on the overall BHOMA study, but rather on the application of a Balanced Score Card measurement tool, based on interim results at 12 months: "This paper focuses on the results of the health facility survey conducted in 2012 when 24 clusters were in the intervention phase of the intervention and 18 in the control phase." (p.2). COUNTRY: Zambia SETTING: The BHOMA project was a five‐year health service quality improvement project in 3 rural districts of Zambia, in sub‐Sharan Africa. It aimed to "improve the quality of clinical service delivery and restore community confidence in the health system" (Stringer 2013) (p.2). START DATE: April 2011 END DATE: September 2012 IMPLEMENTATION PERIOD: 12 months DURATION OF INTERVENTION: 12 months Data based on facilities with variable duration of Intervention (3 to 12 months). Of the facilities that had received the intervention, 12 had been in the intervention phase for between 3 to 6 months and 12 for between 9 to 12 months. FOLLOW UP: 12‐month follow‐up surveys were conduced between May and September 2012 |
|
| Participants | INCLUSION CRITERIA: Health care facilities (HCs) within 3 rural health districts of Zambia, covering 42 health facilities in Zambia with a total population of 306,000. "The 42 health facilities were randomised in the order of receiving the intervention in a step‐wedge fashion until all receive the intervention. The impact of the interventions was measured through an evaluation of the interventions using selected endpoints including Standardised Mortality Rate in the population less than 60 years and under‐5 mortality. The evaluation data was collected through community and health facility surveys. This paper focuses on the results of the health facility survey conducted in 2012 when 24 clusters were in the intervention phase of the intervention and 18 in the control phase." (p.2). EXCLUSION CRITERIA: 6 of the 48 eligible health facilities were used as pilot sites and excluded from the study population |
|
| Interventions | BHOMA, a multi‐component health system intervention INTERVENTION: This intervention aimed to improve RHIS by introducing digital data collection and management, as well as introducing a support cadre of health care worker, and streamlining of registries. The BHOMA project proposed to improve the quality of clinical care and to improve utilisation of that care, through a targeted quality improvement (QI) intervention delivered at the facility and community level. "Specifically, BHOMA’s core objectives are to: (1) create a set of clear expectations for primary care through protocols and forms that guide providers at each visit; (2) ensure providers have the tools they need (equipment, supplies, diagnostics, and drugs) to deliver on what is asked of them; (3) monitor the care that is provided through an on‐site electronic record that comprehensively and constantly measures clinical care quality; (4) improve performance of key indicators of clinical care quality by providing ongoing, on‐site mentoring to develop better clinical skills and practices; and (5) increase community engagement with the health system through active patient referral and follow‐up." (Stringer 2013) (p.3). One of the 5 objectives of the BHOMA project is focused on information system support, through the introduction of an electronic patient record system, and the introduction of a new cadere of lay worker to support the registration of patients and maintaining the medical record system. "The third objective is to monitor the care that is provided through an on‐site electronic record that comprehensively and constantly measures clinical care quality and patient outcomes. During the third and fourth week of facility implementation, we establish an organized medical records system in which patients are assigned unique ID numbers where regular, organized, legible charts are kept at the facility for each patient. A new cadre of lay workers, known as 'clinic support workers', supports the medical record system. The project employs two to three clinic support workers per facility, and they are responsible for variety of tasks, including obtaining vital signs, checking in patients, collecting basic background information, and organizing and maintaining the clinic’s medical record system. Clinic support workers ensure the relevant clinical forms are completed and filed in the patient’s medical chart at the end of the clinical visit. Clinic support workers ensure the relevant clinical forms are completed and filed in the patient’s medical chart at the end of the clinical visit." (Stringer 2013) (p.5). Following is a summary description of the BHOMA strategies: The District level In each of the 3 districts, 1 Quality Improvement (QI) team is introduced that implements the intervention in target health facilities. The order of implementation was determined at randomisation and the QI teams follow this order when introducing intervention in target heath facilities. Each QI team consists of 2 nurses and 1 clinical officer. The teams work closely with the Ministry of Health. The Health Facility level The health‐facility‐based intervention aims to improve clinical care quality by implementing practical tools that establish clear clinical care standards, providing essential resources to meet these standards and communicating standards through intensive clinic implementations. Each clinic generates self‐assessment reports that help identify areas of weakness for further improvement with support from the quality improvement team. Leadership training is provided to the health workers targeting governance, finance, supply chain and human resource management. Staffing support consists of lay workers trained as 'Clinic Supporters'. These lay workers are trained to assume as many non‐clinical duties as possible. These include registration of patients, filing, triaging, recording vital signs, fast‐tracking urgent cases and routing patients through services. The Community level The BHOMA project engaged community health workers on a part‐time basis. They are trained in providing preventive services and tracking missed clinic appointments. They work in collaboration with community health units known as Neighbourhood Health Committees (NHCs) and Traditional Birth Attendants (TBAs). The community health workers were trained in capturing and recording local health data and sending it to health facilities via mobile phones or physically. The community strategy was expected to drive the demand for health services while the health facility strategy was expected to improve health worker skills, service quality and other health system building blocks. The overall aim of the intervention was to improve health outcomes. "The secondary objectives of the BHOMA intervention include (1) improved coverage of key primary health interventions; (2) improved overall coordination and effectiveness of the health system; and (3) implementation of a feasibility and cost‐effective intervention" (Stringer 2013) (p.7). CONTROL: 18 clusters in the control phase did not receive the BHOMA intervention. However, the study used a step‐wedge design where the intervention was rolled out gradually until all 42 health facilities received it within the 5‐year study period |
|
| Outcomes | For the main BHOMA study, the impact of the interventions was measured "through an evaluation of the interventions using selected endpoints including Standardised Mortality Rate in the population less than 60 years and under‐5 mortality (pg 2).This includes other clinical markers such as rates of priority illnesses (e.g. TB, HIV, malaria, pneumonia) and coverage of preventive services. The evaluation data is being collected through community and health facility surveys" (pg 2). However, in this paper, the study reports on outcomes related to a secondary objective, which is to use the Balanced Score Card (BSC) tool to measure impact after 12 months of the intervention."We present the quantitative results of the 12 months follow‐up study applying the balanced scorecard approach in the BHOMA intervention with the aim of demonstrating the utility of the balanced scorecard in evaluating multiple building blocks in a trial setting." (p.1). This paper draws on data from the health facility survey that was conducted in 2012, when 24 clusters were in the intervention phase of the intervention and 18 in the control phase. The BSC domains reported on in this study are 7 health systems domains/areas, each with a number of indicators. BSC domains are: patient satisfaction, human resources, service capacity, finance, governance, heath information, service provision. Domain descriptions are: A: Patients and Community (Patient satisfaction children index; Patient satisfaction adult index) B: Human resources (Health worker motivation scores; Training in the past 12 months C: Service Delivery (Basic infrastructure index; Basic equipment index, Laboratory capacity index, Tracer drugs index, Infection control index) D: Finance (Finance index) E: Governance (Governance index) F: Health Information (Health information index). No supporting information provided G: Service Provision (Service readiness index; Clinical Observation index‐Children; Clinical observation index‐Adults) The paper provided supporting information in the form of electronic links to 'Tools' that measured the BSC domain. The tools contained a set of questions asked under that domain that was then used to calculate a score for that domain. Supporting documentation was provided for Domain A (Service satisfaction), Domain B (Only for Health worker motivation), Domain D (Finance), Domain E (Governance), Domain G (Clinical observation index for children and adults only). No supporting information/ tool was provided for Domain F (Health information). Enquiries from the lead author for the information was not successful. |
|
| Notes | The authors provided supporting information on the measurement tool used in the BSC approach, but this was not provided for the Health Information Index, which is an index more closely related to the outcomes for our review. ETHICS: The study was approved by the University of Zambia Bioethics Committee and the London School of Hygiene and Tropical Medicine Ethics Committee. INFORMED CONSENT: All participants were informed about the purpose of the survey and were asked to sign a consent form before taking part in the study. Parents/guardians signed consent forms on behalf of their children. Those who could not write were asked to thumb print the consent form in the presence of an independent observer. Confidentiality was ensured during data collection and subsequent publication of the results. FUNDING: The study was funded by Doris Duke Charitable foundation, www.ddcf.org. The funders had no role in study design, data collection and analysis, decision to publish, or preparation of the manuscript. COMPETING INTERESTS: The authors have declared that no competing interests exist. The BHOMA intervention is part of the African Health Initiative, and the implementation was done by a CDC‐linked team, while the evaluation of the intervention is conducted by different team, the ZAMBART Team. From the author affiliation list, it would seem the authors are from both the implementation and evaluation team, but this is not clarified in the protocol paper or this paper. |
|
| Risk of bias | ||
| Bias | Authors' judgement | Support for judgement |
| Random sequence generation (selection bias) | Unclear risk | Not described |
| Allocation concealment (selection bias) | Unclear risk | Not described |
| Blinding of participants and personnel (performance bias) All outcomes | Unclear risk | Likely that blinding was not possible hence it is unclear how this may have affected the outcome |
| Blinding of outcome assessment (detection bias) All outcomes | Unclear risk | Assessing governance was a self‐reported questionnaire. The health information (HI) index was interviewer administered |
| Incomplete outcome data (attrition bias) All outcomes | Low risk | Analysis was at the level of health facility and all randomised facilities appear to be accounted for in the tables |
| Selective reporting (reporting bias) | Unclear risk | Unclear if all pre‐specified outcomes reported |
| Other bias | High risk | This is an interim analysis (analysis after 1 year of exposure; final follow‐up at 3 years) of a stepped wedge design resulting in bias from uneven intervention exposure between sites. Results need to be interpreted with caution. In addition, no details of the tools were provided so meaningfulness of the results is uncertain. The authors did not describe whether the tools used to measure the outcome were validated or not. |
SC4CCM 2013.
| Study characteristics | ||
| Methods | STUDY TYPE: Controlled before‐after study The study reported on an evaluation of the Improving Supply Chains for Community Case Management of Pneumonia and other Common Disease of Childhood project (SC4CCM 2013), that evaluated the effect of the cStock mobile phone SMS and web‐based intervention, together with organisational support components, aimed at supporting community‐based drug supply systems. The study reports on the same intervention in 2 different papers, SC4CCM 2013 and Shieshia 2014, but the control comparisons differ between the 2 reports. In the SC4CCM 2013 report, the authors compared the 2 intervention arms to a control arm with no intervention. In the Shieshia 2014 report, the authors compared the 2 intervention arms with each other. Both intervention arms have a digital health component (cStock), but this is combined with 2 different types of organisational support. The one intervention is cStock with Enhanced management (EM), and the other is cStock with Efficient Product Transport (EPT). We report on the effect of these two combinations of cStock interventions, as compared to the control (no intervention) COUNTRY: Malawi SETTING: In 2008, the Government of Malawi (GoM) initiated the Integrated Community Child illness Management (iCCM) as a strategy to reduce child mortality. The program entailed training an existing cadre of HSAs, known as Health Surveillance Assistants (HSAs) to treat children in the community. HSAs are posted nationwide to serve communities at a ratio of 1:1000 population. START DATE: January 2012. Routine monitoring data on HSA drug stock level reports, submitted using cStock, were utilized to study supply chain performance trends over time between the EM and EPT groups. These data were retrieved for the 18–month period. END DATE: June 2013 DURATION OF THE TRIAL: 18 months FOLLOW‐UP: February 2013 |
|
| Participants | INCLUSION CRITERIA: "Selection criteria for the districts included the existence of a functioning iCCM program, a balance of iCCM partner support, and a relatively balanced geographical coverage across the 3 administrative regions of the country." (Shieshia 2014) (p.3). After the formative assessment, the project formed 3 groups from the 10 districts by matching geographical and demographic characteristics, and other external dimensions including iCCM partner coverage, prevalence of diarrhoea, malaria, and cough, as well as baseline HSA iCCM product availability, to create comparable groups. The 3 groups were randomly assigned to 3 districts receiving the EPT intervention, three districts receiving the EM intervention, and 4 control districts received no intervention. The cStock sample of HSAs registered in each group as of June 2014, was n = 393 HSAs in EM, and n = 253 HSAs in EPT (total n = 646). EXCLUSION CRITERIA: None described |
|
| Interventions | INTERVENTION: This intervention aimed to improve RHIS by introducing digital data collection and management, together with enhanced data management support and support for the efficient transport of stocks. To address the identified constraints related to data visibility, motivation and transport for HSAs, SC4CCM designed and piloted cStock, a mHealth tool for community‐level reporting of stock on hand data and resupply of 19 health products managed by HSAs. The aim was to provide evidence about cStock as an effective system for making community supply chain data more visible and identify evidence for successful supply chain practices, to support the MoH of Malawi decision‐making and action around improving community‐based supply chain management. cStock was nested within two broader interventions, namely EM and EPT (described below), to address challenges in motivation of HSAs and transport to the health facilities, respectively. cStock is an SMS and web‐based reporting and resupply system that is used by HSAs to report stock data via SMS through their personal mobile phones. cStock calculates HSA resupply quantities and sends this information to health facility staff to use to pick and pack products for HSAs and notify them about a collection time. cStock is a key component of both the EM and EPT intervention packages. Enhanced Management (EM), which focused on developing a team‐based, goal‐focused approach to managing community level supply chain using performance reports from cStock, and Efficient Product Transport (EPT), which focused on improving efficiency of product collection by imparting bicycle maintenance skills to HSAs to be able to fix minor problems on their bicycles to facilitate mobility and prolong overall bicycle useful life span and flexible inventory control system. The EM intervention addresses challenges related to data availability and visibility, as well as low motivation among HSAs; while the EPT intervention addresses challenges of transport in addition to data visibility. The additional component of the EM intervention was District Product Availability Teams (DPATs). These are multilevel quality improvement teams that use data supplied by cStock to monitor performance of the supply chain and make informed supply chain decisions. In contrast, the additional component of the EPT intervention consisted of training all HSAs on bicycle maintenance, provision of a basic tool kit, and the use of a continuous review inventory control system. HSAs and health facility staff in 6 districts where the project was piloted were trained on the use of cStock for reporting and resupply and used their own phones to register with cStock. In SC4CCM 2013, the study compared 2 interventions to a control arm with no intervention. cStock, a digital (SMS‐based) drug supply monitoring system plus enhanced management (EM) support teams (Intervention arm 1) and cStock plus mechanisms for efficient product transport (EPT) (Intervention arm 2). CONTROL: In SC4CCM 2013, the control arm is no intervention. In the control arm, the drug supply system was based on a paper‐based system and no additional organisational support systems were put in place. In the Shieshia 2014 report, the 2 intervention arms are compared with each other. The cStock system is common to both Intervention 1 and Intervention 2, but they differ on the organisational components (EM and EPT). This comparison was not relevant to the review question. |
|
| Outcomes | Availability of products (stock) of tracer drugs, rates of reporting and completeness, and collection of stocks. PRIMARY: SC4CCM 2013
Shieshia 2014
SECONDARY: None described |
|
| Notes | The study reports on an interim period of implementation, which is up to 12‐month analysis, for an intervention which is longer term (4 years). The intervention period for exposure to the intervention differed amongst sites. ETHICS: Ethics approval was waived after review by Malawi’s National Health Sciences Research Committee. INFORMED CONSENT: Not reported FUNDING: This work was funded as part of SC4CCM project activities. SC4CCM is implemented by JSI Research & Training Institute with funding from The Bill & Melinda Gates Foundation. COMPETING INTEREST: All authors have completed the Unified Competing Interest form atwww.ic‐mje.org/coi_disclosure.pdf (available on request from the corresponding author). The authors declare no financial relationships with any organizations that might have interest in the submitted work and no other relationships or activities that could appear to have influenced the submitted work; apart from that declared under Funding declaration. |
|
| Risk of bias | ||
| Bias | Authors' judgement | Support for judgement |
| Random sequence generation (selection bias) | Unclear risk | Not reported |
| Allocation concealment (selection bias) | Unclear risk | Not reported |
| Blinding of participants and personnel (performance bias) All outcomes | High risk | Blinding was not possible and the outcome is likely to be influenced by a lack of blinding |
| Blinding of outcome assessment (detection bias) All outcomes | Unclear risk | Not reported |
| Incomplete outcome data (attrition bias) All outcomes | High risk | There is acknowledgement of missing data but the type of data missing and implications is not clearly reported |
| Selective reporting (reporting bias) | High risk | Not all listed outcomes are reported for the control group |
| Other bias | High risk | Control results are not reported for most outcomes |
Characteristics of excluded studies [ordered by study ID]
| Study | Reason for exclusion |
|---|---|
| Agrawal 2009 | Ineligible study design |
| Ammenwerth 2001 | Ineligible intervention |
| Andersson 2013 | Ineligible intervention |
| Boockvar 2017 | Ineligible intervention |
| Brugha 1996 | Ineligible intervention |
| Cawsey 2000 | Ineligible intervention |
| Chang 2011 | Ineligible intervention |
| Chen 2007 | Ineligible intervention |
| Choi 2004 | Ineligible intervention |
| Chrischilles 2014 | Ineligible intervention |
| de Lusignan 2004 | Ineligible study design |
| Dixon 2017 | Ineligible intervention |
| Dowding 2012 | Ineligible intervention |
| Dreischulte 2016 | Ineligible intervention |
| Ekwueme 2008 | Ineligible intervention |
| Escobar‐Perez 2016 | Ineligible study design |
| Eurlings 1997 | Ineligible study design |
| Fidahussein 2011 | Ineligible study design |
| Field 2009 | Ineligible intervention |
| Filler 2017 | Ineligible study design |
| Frame 1994 | Ineligible intervention |
| Freundlich 2013 | Ineligible intervention |
| Gernant 2018 | Ineligible intervention |
| Gisore 2012 | Ineligible intervention |
| Gong 2016 | Ineligible intervention |
| Grandville 2006 | Ineligible intervention |
| Grischott 2018 | Ineligible intervention |
| Guiriguet‐Capdevila 2014 | Ineligible intervention |
| Gustafson 1999 | Ineligible intervention |
| Hammond 1990 | Ineligible intervention |
| Haskew 2015 | Ineligible intervention |
| Hassink 2013 | Ineligible study design |
| Hebel 2012 | Ineligible study design |
| Heidarizadeh 2017 | Ineligible study design |
| Hendriks 2016 | Ineligible intervention |
| Hooper 2012 | Ineligible intervention |
| Hunt 2009 | Ineligible study design |
| Ir 2015 | Ineligible intervention |
| Iyer 2015 | Ineligible study design |
| Iyer 2017 | Ineligible intervention |
| Ji 2018 | Ineligible intervention |
| Johnson 2016 | Ineligible study design |
| Lamanna, 2019 | Ineligible study design |
| Lester 2006 | Ineligible intervention |
| Lester 2010 | Ineligible intervention |
| Lin 2010 | Ineligible method |
| Pop‐Eleches 2011 | Ineligible intervention |
| Rauhala 2008 | Ineligible method |
| Riley 2007 | Ineligible method |
| Ruton 2018 | Ineligible intervention |
| Spero 2011 | Ineligible method |
| Stengel 2004 | Ineligible intervention |
| Usman 2008 | Ineligible intervention |
| Valadez 2014 | Ineligible intervention |
| Venkateswaren 2018 | Ineligible intervention |
| Waters 2013 | Ineligible method |
| Were 2010 | Ineligible method |
| Yen 2005 | Ineligible intervention |
| Zurovac 2011 | Ineligible intervention |
Characteristics of studies awaiting classification [ordered by study ID]
He 2014.
| Methods | Randomised trial |
| Participants | Residents living within 20 Community Health Service Stations in the Chongyi county, China |
| Interventions | "The intervention included three aspects: 1. Supervision and checking the quality of village doctor’s use of the EHR including data entry and retrieval of information for follow up care 2. Technical support about how to use EHR tailored to the village doctors circumstances and needs including solving problems that they encountered in the process of using EHR. 3. Face to face education about EHR policies and benefits, including hands on training in the proactive and timely use of EHR. The control group did not receive the intervention but was observed in parallel." (He 2014) (p. 2). |
| Outcomes | Completeness of recording of record about basic health information, health examination, health education, vaccination, child health management and elderly health care. |
| Notes |
Monyarit 2014.
| Methods | A randomised cross‐over design was employed for this study. |
| Participants | "Data were collected using both the developed EDC tool and QNN from 120 households by 30 community health volunteers (CHVs) in two villages in Thailand. All of participants live in the study area and they mostly use Karen language in their daily lives. A simple random sampling technique was used to select the 30 CHVs from the list of all CHVs working in the study areas." (Monyarit 2014) (p.3). |
| Interventions | "The CHVs were randomly allocated to two groups with different sequences of the two data‐collection methods. Each CHV collected the same data using either the Electronic Data Capture (EDC) tool application before the Paper‐based Questionnaire (QNN) tool, or vice versa." (p.3). " By using each method, each of CHVs collected data from four different Karen participants." (p.3). |
| Outcomes | "To compare the quality of data collection via electronic data capture (EDC) with voiced questionnaire (QNN) and data image capture features using a tablet versus standard paper‐based QNN, to assess the user’s perception of using the EDC tool, and to compare user satisfaction with the two methods." (p.1). "Therefore, the main outcomes of interest were data discrepancy, user perception, and user satisfaction with the data‐collection methods. Data discrepancy was identified from comparisons between self‐reporting information (through QNN) regarding brand names of bed nets and numbers of IRS against captured images (via EDC tool) of the bed nets and spraying records in the house‐holds." (pg 5). |
| Notes |
O'Connor 2019.
| Methods | Cluster randomised trial |
| Participants | Ten urban communities in Freetown, Sierra Leone |
| Interventions | A participatory community‐based health information system (PCBHIS) that consists of two activities: "1) Implementation of meetings every two months to support HMCs, WDCs, and Peer Supervisors to review household‐level data collected by CHWs and determine actions in response to this data. These meetings are referred to as Community Health Data Review (CHDR) meetings. 2) Verbal autopsies (VAs) for deaths of under‐5 children which had been registered by CHWs." (O'Connor 2019) (p.4). |
| Outcomes | Household health‐related behaviours and care‐seeking behaviours: 1) Indicators of the capacity of community committees to engage with the local health system: the Health Institution Capacity Assessment Process (HICAP) 2) Indicators of effective health system functioning: functionality of the CHW program as determined by rate of CHW reporting 3) Indicators of effective health system functioning: health system utilization and household behaviours as determined from household surveys (see p.6‐7). |
| Notes |
Singh 2012.
| Methods | Randomised trial |
| Participants | "All practices in the current IT‐facilitated study were part of the Upstate New York Practice Based Research Network and had electronic medical records in place for at least 12 months prior to the start of the study. Both groups contained a variety of practice types including safety net practices. Urban, suburban, and rural practices of various sizes and with various ownership structures were represented." (Singh 2012)(p.3). All staff at the above sites, including physicians, physician extenders, nurses, medical assistants, administrative staff (secretarial and management), and all others (e.g. dieticians and social workers if present) were invited to participate in surveys and team discussions. |
| Interventions | "The objectives of this study were to develop and pilot‐test an information technology (IT)–based team resource management (TRM) system, based on SEMI‐P, aimed at improving medication safety in primary care. We examined (1) the ability of this intervention to reduce selected ADEs among geriatric patients, (2) the ability of this intervention to improve monitoring of geriatric patients taking selected chronic medications, and (3) how office staff used and applied this IT‐basedTRM tool for improving geriatric medication safety." (p.3). |
| Outcomes | "Primary outcome was adverse drug events (ADEs) in older adults, ascertained using a trigger tool chart review at two 12‐month periods (before and after the intervention). A secondary outcome was compliance with Healthcare Effectiveness Data and Information Set (HEDIS) guidelines for laboratory monitoring for patients who were prescribed certain medications chronically (meaning that they were prescribed the medication for 6 or more months out of a 12‐month period). Both of these outcomes were for older adults (aged >65 years) since these patients are known to be at higher risk of adverse events." (p.4). |
| Notes |
Toda 2016.
| Methods | Randomised trial |
| Participants | 135 health facilities in 2 counties in Kenya |
| Interventions | To "test the effectiveness of a mobile short‐message‐service (SMS)–based disease outbreak alert system (mSOS) for reporting immediately notifiable diseases. "(Toda 2016) (p.1). " mSOS is a formatted text‐messaging system that enables communications between healthcare facility workers and Ministry of Health managers and uses a Web‐based portal to monitor disease notifications and response actions taken by health managers." (p.1). Health workers "used mSOS for 6 months to send information about suspected cases or health events that required notification within 24 hours." (p.1). "Paper‐based reporting continued throughout the study period for both groups, so the intervention group would report cases 2 ways." (p.1). |
| Outcomes | The "primary outcome was determining how many of the cases that required immediate notification were reported within the time specified." (p.1). The "secondary outcome was determining, from among the cases for which notifications were sent, the proportion for which response actions were taken." (p.1). |
| Notes |
Differences between protocol and review
To highlight the health systems management focus of the review more clearly, we changed the protocol title "Routine Health Information System (RHIS) interventions to improve health system management", to the new title "Routine Health Information System (RHIS) improvements for strengthened health system management". The way we report outcomes differ from the protocol. We report on two main outcomes (data quality and service quality), and did not report on other outcomes listed in the protocol as none were reported in the studies. None of the studies reported on data use as a distinct outcome, though this is addressed indirectly, under the service quality outcomes. Due to the heterogeneity of the study interventions and outcomes and the lack of pooled analysis, we reported findings per study. We stated in the protocol, Leon 2015, our intention to analyse qualitative studies associated with the included studies (to better understand and interpret the context of effectiveness studies), but were unable to do this due to limited time and resources. We will consider the addition of associated qualitative studies in future when updating this review. In the protocol we had planned to exclude studies on complex, quality improvement interventions if the RHIS strengthening component was not the primary focus of the intervention, but we applied this flexibly. Given we found so few experimental studies, we included the study on the multi‐modal BHOMA intervention (Mutale 2014), as they explicitly identified RHIS strengthening as one of the four objectives of their quality improvement study.
While assessing eligibility for inclusion of studies, the reviewers realised that the review may have benefited from a narrower scope, focusing more explicitly on RHIS interventions for improving data use for decision‐making. The bulk of studies reviewed were about improving data quality, and the review authors struggled to judge which of this myriad of studies demonstrated the data use for decision‐making component, either directly or indirectly. As mentioned earlier, we made the judgement based on assessing the scope and level of the routine information system, and the aim of the study. For example, where information system change was aimed at surveillance or district or regional co‐ordination (such as community‐based surveillance of pregnancy outcomes and district‐wide laboratory and drug supply information systems), we assumed these were aimed at system‐wide management.
The review author team differs from the author team of the protocol. The lead author (NL) and senior author (KB) remained in the same roles and the other two protocol authors (Lee‐Anne Brady and Aku Kwamie) did not participate in the review process. We expanded the review protocol team membership to increase capacity, including adding a policy maker (VZ) and a statistician (YB).
Contributions of authors
We conceived this Cochrane Review initially through a process of priority setting with policy makers and researchers in South Africa. NL and KD, together with the protocol authors (Lee‐Anne Brady and Aku Kwamie), refined the research question. The review was led by NL who, together with the senior author, KD, coordinated the review process. All co‐authors participated in the search and selection of studies for inclusion. NL, AH, YB, WO, BS, JAW and KD participated in data collection. YB provided the statistical analysis support. YB and NL did the assessment of bias in the included studies, analysis of data, assessment of uncertainty in the body of evidence and interpretation of data. NL wrote the draft of the review report and all co‐authors reviewed and commented on drafts of the report, with KD, YB and AH assisting with the revisions for the final draft. VZ reviewed the report from the perspective of a government policy maker, commenting on the readability and usefulness of the findings. All authors approved the final version of the review report.
Sources of support
Internal sources
-
South African Medical Research Council, South Africa
Partial researcher salary for the lead author (NL) and the senior author (KD), as well as salary support for coauthors (AH, YB, BS), as these authors, for the most part, conducted the review while employed on SAMRC baseline or contract funding.
External sources
-
World Health Organization, Alliance for Health Policy and Systems Research, Switzerland
Funding to conduct this Cochrane review
Norwegian Agency for Development Cooperation (NORAD), Norway
Declarations of interest
Natalie Leon: no known conflicts of interest.
Yusentha Balakrishna: no known conflicts of interest.
Ameer Hohlfield: no known conflicts of interest.
Willem Odendaal: no known conflicts of interest.
Bey‐Marrié Schmidt: no known conflicts of interest.
Virginia Zweigenthal: no known conflicts of interest,
Jocelyn Anstey Watkins: no known conflict of interest.
Karen Daniels: no known conflicts of interest.
New
References
References to studies included in this review
Blaya 2009 {published data only}
- Blaya JA, Cohen T, Rodriguez P, Kim J, Fraser HS. Personal digital assistants to collect tuberculosis bacteriology data in Peru reduce delays, errors, and workload, and are acceptable to users: cluster randomized controlled trial. International Journal of Infectious Diseases 2009;13(3):410-8. [DOI: ] [PMID: ] [DOI] [PMC free article] [PubMed] [Google Scholar]
Blaya 2014 {published data only}
- *.Blaya J, Shin S, Yagui M, Contreras C, Cegielski P, Yale G, et al. Reducing communication delays and improving quality of care with a tuberculosis laboratory information system in resource poor environments: a cluster randomized controlled trial. PloS One 2014;9(4):e90110. [DOI: ] [DOI] [PMC free article] [PubMed] [Google Scholar]
- Blaya J, Shin S, Yale G, Suarez C, Asencios L, Contreras C, et al. Electronic laboratory system reduces errors in National Tuberculosis Program: a cluster randomized controlled trial. International Journal of Tuberculosis and Lung Disease 2010;2214(8):1009-15. [PMC free article] [PubMed] [Google Scholar]
- Blaya J, Shin S, Yale G, Suarez C, Asencios L, Contreras C, et al. Full impact of laboratory information system requires direct use by clinical staff: cluster randomized controlled trial. Journal of the American Medical Informatics Association 2011;18(1):11-6. [DOI: 10.1136/jamia.2010.005280] [DOI] [PMC free article] [PubMed] [Google Scholar]
Joos 2016 {published data only}
- Joos O, Silva R, Amouzou A, Moulton LH, Perin J, Bryce J, et al. Evaluation of a mhealth data quality intervention to improve documentation of pregnancy outcomes by health surveillance assistants in Malawi: a cluster randomized trial. PloS One 2016;11(1):e0145238. [DOI: ] [PMID: ] [DOI] [PMC free article] [PubMed] [Google Scholar]
Mbananga 2002 {unpublished data only}
- *.Mbananga N, Madale R, Becker P. Evaluation of hospital information system in the Northern Province in South Africa: “Using Outcome Measures”. Available at pdfs.semanticscholar.org/ab97/8903cb3089607cedc1c72343e9d144938807.pdf.
Mutale 2014 {published data only (unpublished sought but not used)}
- *.Mutale W, Stringer J, Chintu N, Chilengi R, Mwanamwenge MT, Kasese N, et al. Application of balanced scorecard in the evaluation of a complex health system intervention: 12 months post intervention findings from the BHOMA intervention: a cluster randomised trial in Zambia. PLOS One 2014;9(4):e93977. [DOI: 10.1371/journal.pone.0093977] [DOI] [PMC free article] [PubMed] [Google Scholar]
SC4CCM 2013 {published and unpublished data}
- *.SC4CCM. Malawi Community Health Supply Chain Midline Assessment Report 2013. 1rqxbs47ujl4rdy6q3nzf554.wpengine.netdna-cdn.com/wp-content/uploads/2016/07/Malawi-Midline-Report_FINAL.pdf.
- Shieshia M, Noel M, Andersson S, Felling B, Alva S, Agarwal S, et al. Strengthening community health supply chain performance through an integrated approach: using mHealth technology and multilevel teams in Malawi. Journal of Global Health 2014;4(2):020406. [DOI: 10.7189/jogh.04.020406] [DOI] [PMC free article] [PubMed] [Google Scholar]
References to studies excluded from this review
Agrawal 2009 {published data only}
- Agrawal A, Wu W. Reducing medication errors and improving systems reliability using an electronic medication reconciliation system. Joint Commission Journal on Quality and Patient Safety 2009;35(2):106-14. [DOI: ] [DOI] [PubMed] [Google Scholar]
Ammenwerth 2001 {published data only}
- Ammenwerth E, Eichstadter R, Haux R, Pohl U, Rebel S, Ziegler S. A randomized evaluation of a computer-based nursing documentation system. Methods of Information in Medicine 2001;40(2):61-8. [DOI: 10.1055/s-0038-1634465] [DOI] [PubMed] [Google Scholar]
Andersson 2013 {published data only}
- Andersson ML, Bottiger Y, Lindh JD, Wettermark B, Eiermann B. Impact of the drug-drug interaction database SFINX on prevalence of potentially serious drug-drug interactions in primary health care. European Journal of Clinical Pharmacology 2013;69(3):565-71. [DOI: ] [DOI] [PubMed] [Google Scholar]
Boockvar 2017 {published data only}
- Boockvar KS, Ho W, Pruskowski J, DiPalo KE, Wong JJ, Patel J, et al. Effect of health information exchange on recognition of medication discrepancies is interrupted when data charges are introduced: results of a cluster-randomized controlled trial. Journal of the American Medical Informatics Association 2017;24(6):1095-101. [DOI: ] [DOI] [PMC free article] [PubMed] [Google Scholar]
Brugha 1996 {published data only}
- Brugha RF, Kevany JP. Maximizing immunization coverage through home visits: a controlled trial in an urban area of Ghana. Bulletin of the World Health Organization 1996;74(5):517-24. [PMC free article] [PubMed] [Google Scholar]
Cawsey 2000 {published data only}
- Cawsey AJ, Jones RB, Pearson J. The evaluation of a personalised health information system for patients with cancer. User Modeling and User-adapted Interaction 2000;10(1):47-72. [DOI: ] [Google Scholar]
Chang 2011 {published data only}
- Chang LW, Kagaayi J, Arem H, Nakigozi G, Ssempijja V, Serwadda D, et al. Impact of a mHealth intervention for peer health workers on AIDS care in rural Uganda: a mixed methods evaluation of a cluster-randomized trial. AIDS and Behavior 2011;15(8):1776-84. [DOI: ] [DOI] [PMC free article] [PubMed] [Google Scholar]
Chen 2007 {published data only}
- Chen T-H, Li L, Sigle JM, Du Y-P, Wang H-M, Lei J. Crossover randomized controlled trial of the electronic version of the Chinese SF-36. Journal of Zhejiang University Science B 2007;8(8):604-8. [DOI: ] [DOI] [PMC free article] [PubMed] [Google Scholar]
Choi 2004 {published data only}
- Choi SS, Jazayeri DG, Mitnick CD, Chalco K, Bayona J, Fraser HS. Implementation and initial evaluation of a web-based nurse order entry system for multidrug-resistant tuberculosis patients in Peru. Studies in Health Technology and Informatics 2004;107(Pt1):202-6. [DOI: 10.3233/978-1-60750-949-3-202] [DOI] [PubMed] [Google Scholar]
Chrischilles 2014 {published data only}
- Chrischilles EA, Hourcade JP, Doucette W, Eichmann D, Gryzlak B, Lorentzen R, et al. Personal health records: a randomized trial of effects on elder medication safety. Journal of the American Medical Informatics Association 2014;21(4):679-86. [DOI: ] [DOI] [PMC free article] [PubMed] [Google Scholar]
de Lusignan 2004 {published data only}
- Lusignan S, Hague N, Brown A, Majeed A. An educational intervention to improve data recording in the management of ischaemic heart disease in primary care. Journal of Public Health 2004;26(1):34-7. [DOI: ] [DOI] [PubMed] [Google Scholar]
Dixon 2017 {published data only}
- Dixon BE, Barboza K, Jensen AE, Bennett KJ, Sherman SE, Schwartz MD. Measuring practicing clinicians' information literacy. An exploratory analysis in the context of panel management. Applied Clinical Informatics 2017;8(1):149-61. [DOI: 10.4338/ACI-2016-06-RA-0083.] [DOI] [PMC free article] [PubMed] [Google Scholar]
Dowding 2012 {published data only}
- Dowding DW, Turley M, Garrido T. The impact of an electronic health record on nurse sensitive patient outcomes: an interrupted time series analysis. Journal of the American Medical Informatics Association 2012;19(4):615-20. [DOI: ] [DOI] [PMC free article] [PubMed] [Google Scholar]
Dreischulte 2016 {published data only}
- Dreischulte T, Donnan P, Grant A, Hapca A, McCowan C, Guthrie B. Safer Prescribing — A Trial of Education, Informatics, and Financial Incentives. The New England Journal of Medicine 2016;374(11):1053-64. [DOI] [PubMed] [Google Scholar]
Ekwueme 2008 {published data only}
- Ekwueme OC, Aghaji MN. Can retraining enhance the knowledge and attitude of primary health workers towards health management information system in Enugu State, Nigeria? International Journal of Medicine and Health Development 2008;13(2):71-7. [Google Scholar]
Escobar‐Perez 2016 {published data only}
- Escobar-Perez B, Escobar-Rodriguez T, Bartual-Sopena L. Integration of healthcare and financial information: evaluation in a public hospital using a comprehensive approach. Health Informatics Journal 2016;22(4):878-96. [DOI: 10.1177/1460458215595259] [DOI] [PubMed] [Google Scholar]
Eurlings 1997 {published data only}
- Eurlings F, Asten A, Cozijn H, Klaassen K, Stokman R, Valkenburg R, et al. Effects of a nursing information system in 5 Dutch hospitals. Studies in Health Technology and Informatics 1997;46:50-5. [DOI: 10.3233/978-1-60750-890-8-50] [DOI] [PubMed] [Google Scholar]
Fidahussein 2011 {unpublished data only}
- Fidahussein M, Hook J, Kesterson J, Were M. Using a regional health information exchange to improve identification of post-discharge follow-up providers. In: Society of General Internal Medicine, 34th Annual Meeting, Phoenix, Arizona, May 4–7, 2011. 2011:S163-4.
Field 2009 {published data only}
- Field TS, Rochon P, Lee M, Gavendo L, Baril JL, Gurwitz JH. Computerized clinical decision support during medication ordering for long-term care residents with renal insufficiency. Journal of the American Medical Informatics Association : JAMIA 2009;16(4):480-5. [DOI: ] [DOI] [PMC free article] [PubMed] [Google Scholar]
Filler 2017 {published data only}
- Filler S. Strengthening routine health information systems to target malaria control implementation and optimize evaluation of impact. American Journal of Tropical Medicine and Hygiene 2017;97(3 Suppl):2. [DOI: 10.4269/ajtmh.17-0581] [DOI] [PMC free article] [PubMed] [Google Scholar]
Frame 1994 {published data only}
- Frame PS, Zimmer JG, Werth PL, Hall WJ, Eberly SW. Computer-based vs manual health maintenance tracking. A controlled trial. Archives of Family Medicine 1994;3(7):581-8. [DOI: ] [DOI] [PubMed] [Google Scholar]
Freundlich 2013 {published data only}
- Freundlich RE, Barnet CS, Mathis MR, Shanks AM, Tremper KK, Kheterpal S. A randomized trial of automated electronic alerts demonstrating improved reimbursable anesthesia time documentation. Journal of Clinical Anesthesia 2013;25(2):110-4. [DOI: 10.1016/j.jclinane.2012.06.020] [DOI] [PubMed] [Google Scholar]
Gernant 2018 {published data only}
- Gernant SA, Zillich AJ, Snyder ME. Access to medical records' impact on community pharmacist-delivered medication therapy management: a pilot from the Medication Safety Research Network of Indiana (Rx-SafeNet). Journal of Pharmacy Practice 2018;31(6):642-50. [DOI: 10.1177/0897190017735422] [DOI] [PubMed] [Google Scholar]
Gisore 2012 {published data only}
- Gisore P, Shipala E, Otieno K, Rono B, Marete I, Tenge C et al. Community based weighing of newborns and use of mobile phones by village elders in rural settings in Kenya: a decentralised approach to health care provision. BMC Pregnancy and Childbirth 2012;12(15):1-10. [DOI: 10.1186/1471-2393-12-15] [DOI] [PMC free article] [PubMed] [Google Scholar]
Gong 2016 {published data only}
- Gong Y, Hua L, Wang S. Leveraging user's performance in reporting patient safety events by utilizing text prediction in narrative data entry. Computer Methods and Programs in Biomedicine 2016;131:181-9. [DOI: 10.1016/j.cmpb.2016.03.031] [DOI] [PMC free article] [PubMed] [Google Scholar]
Grandville 2006 {published data only}
- Grandville T, Molinari A, Campbell S, Dwyer C, Scocozza K. Effect of CPOE on medication errors. American Journal of Health-system Pharmacy 2006;63(5):409. [DOI: ] [DOI] [PubMed] [Google Scholar]
Grischott 2018 {published data only}
- Grischott T, Zechmann S, Rachamin Y, Markun S, Chmiel C, Senn O, et al. Improving inappropriate medication and information transfer at hospital discharge: study protocol for a cluster RCT. Implementation Science 2018;13(1):155. [DOI: ] [DOI] [PMC free article] [PubMed] [Google Scholar]
Guiriguet‐Capdevila 2014 {published data only}
- Guiriguet-Capdevila C, Munoz-Ortiz L, Rivero-Franco I, Vela-Vallespin C, Vilarrubi-Estrella M, Torres-Salinas M, et al. Can an alert in primary care electronic medical records increase participation in a population-based screening programme for colorectal cancer? COLO-ALERT, a randomised clinical trial. BMC Cancer 2014;14:232. [DOI: ] [DOI] [PMC free article] [PubMed] [Google Scholar]
Gustafson 1999 {published data only}
- Gustafson DH, Hawkins R, Boberg E, Pingree S, Serlin RE, Graziano F, et al. Impact of a patient-centered, computer-based health information/support system. American Journal of Preventive Medicine 1999;16(1):1-9. [DOI: ] [DOI] [PubMed] [Google Scholar]
Hammond 1990 {published data only}
- Hammond KW, Prather RJ, Date VV, King CA. A provider-interactive medical record system can favorably influence costs and quality of medical care. Computers in Biology and Medicine 1990;20(4):267-79. [DOI: ] [DOI] [PubMed] [Google Scholar]
Haskew 2015 {published data only}
- Haskew J, Ro G, Saito K, Turner K, Odhiambo G, Wamae A, et al. Implementation of a cloud-based electronic medical record for maternal and child health in rural Kenya. International Journal of Medical Informatics 2015;84(5):349-54. [DOI: ] [DOI] [PubMed] [Google Scholar]
Hassink 2013 {published data only}
- Hassink JJ, Essenberg MD, Roukema JA, den Bemt PM. Effect of bar-code-assisted medication administration on medication administration errors. American Journal of Health-system Pharmacy 2013;70(7):572-3. [DOI: ] [DOI] [PubMed] [Google Scholar]
Hebel 2012 {published data only}
- Hebel E, Middleton B, Shubina M, Turchin A. Bridging the chasm: effect of health information exchange on volume of laboratory testing. Archives of Internal Medicine 2012;172(6):517-9. [DOI: 10.1001/archinternmed.2011.2104] [DOI] [PubMed] [Google Scholar]
Heidarizadeh 2017 {published data only}
- Heidarizadeh K, Rassouli M, Manoochehri H, Tafreshi MZ, Ghorbanpour RK. Effect of electronic report writing on the quality of nursing report recording. Electronic Physician 2017;9(10):5439-45. [DOI: 10.19082/5439] [DOI] [PMC free article] [PubMed] [Google Scholar]
Hendriks 2016 {published data only}
- Hendriks PH, Ligthart PE, Schouteten RL. Knowledge management, health information technology and nurses' work engagement. Health Care Management Review 2016;41(3):256-66. [DOI: 10.1097/HMR.0000000000000075] [DOI] [PubMed] [Google Scholar]
Hooper 2012 {published data only}
- Hooper MH, Weavind L, Wheeler AP, Martin JB, Gowda SS, Semler MW, et al. Randomized trial of automated, electronic monitoring to facilitate early detection of sepsis in the intensive care unit. Critical Care Medicine 2012;40(7):2096-101. [DOI: 10.1097/CCM.0b013e318250a887] [DOI] [PMC free article] [PubMed] [Google Scholar]
Hunt 2009 {published data only}
- Hunt JS, Siemienczuk J, Gillanders W, LeBlanc BH, Rozenfeld Y, Bonin K, et al. The impact of a physician-directed health information technology system on diabetes outcomes in primary care: a pre- and post-implementation study. Informatics in Primary Care 2009;17(3):165-74. [DOI: ] [DOI] [PubMed] [Google Scholar]
Ir 2015 {published data only}
- Ir P, Korachais C, Chheng K, Horemans D, Damme W, Meessen B. Boosting facility deliveries with results-based financing: a mixed-methods evaluation of the government midwifery incentive scheme in Cambodia. BMC Pregnancy and Childbirth 2015;15:170. [DOI: ] [DOI] [PMC free article] [PubMed] [Google Scholar]
Iyer 2015 {published data only}
- Iyer H, Hirschhorn L, Kamanzi E, Drobac P, Cyamatare F, Nahimana E, et al. Impact of a district-wide health center strengthening intervention on healthcare utilization in rural Rwanda: An interrupted time series analysis. Annals of Global Health 2015;81(1):181. [DOI: 10.1016/j.aogh.2015.02.915] [DOI] [Google Scholar]
Iyer 2017 {published data only}
- Iyer HS, Hirschhorn LR, Nisingizwe MP, Kamanzi E, Drobac PC, Rwabukwisi FC, et al. Impact of a district-wide health center strengthening intervention on healthcare utilization in rural Rwanda: Use of interrupted time series analysis. PloS One 2017;12(8):e0182418. [DOI: ] [DOI] [PMC free article] [PubMed] [Google Scholar]
Ji 2018 {published data only}
- Ji C, Quinn T, Gavalova L, Lall R, Scomparin C, Horton J, et al. Feasibility of data linkage in the PARAMEDIC trial: a cluster randomised trial of mechanical chest compression in out-of-hospital cardiac arrest. BMJ Open 2018;8(7):e021519. [DOI: ] [DOI] [PMC free article] [PubMed] [Google Scholar]
Johnson 2016 {published data only}
- Johnson M, Sanchez P, Zheng C. Reducing patient clinical management errors using structured content and electronic nursing handover. Journal of Nursing Care Quality 2016;31(3):245-53. [DOI: 10.1097/NCQ.0000000000000167] [DOI] [PubMed] [Google Scholar]
Lamanna, 2019 {published data only}
- Lamanna C, Byrne L. A pilot study of a novel, incentivised mHealth technology to monitor the vaccine supply chain in rural Zambia. Pan African Medical Journal 2019;33(50):1-8. [DOI: 10.11604/pamj.2019.33.50.16318] [DOI] [PMC free article] [PubMed] [Google Scholar]
Lester 2006 {published data only}
- Lester WT, Grant RW, Barnett GO, Chueh HC. Randomized controlled trial of an informatics-based intervention to increase statin prescription for secondary prevention of coronary disease. Journal of General Internal Medicine 2006;21(1):22-9. [DOI: ] [DOI] [PMC free article] [PubMed] [Google Scholar]
Lester 2010 {published data only}
- Lester RT, Ritvo P, Mills EJ, Kariri A, Karanja S, Chung MH, et al. Effects of a mobile phone short message service on antiretroviral treatment adherence in Kenya (WelTel Kenya1): a randomised trial. Lancet 2010;376(9755):1838-45. [DOI: 10.1016/S0140-6736(10)61997-6] [DOI] [PubMed] [Google Scholar]
Lin 2010 {published data only}
- Lin IC, Hou YH, Huang HL, Chu TB, Chang TE. Managing nursing assistants with a web-based system: an empirical investigation of the mixed-staff strategy. Journal of Medical Systems 2010;34(3):341-8. [DOI: ] [DOI] [PubMed] [Google Scholar]
Pop‐Eleches 2011 {published data only}
- Pop-Eleches C, Tirumurthy H, Habyarimana JP, Zivin JG, Goldstein MP, Walque D, et al. Mobile phone technologies improve adherence to antiretroviral treatment in a resource-limited setting: a randomized controlled trial of text message reminders. AIDS (London, England) 2011;25(6):825-34. [DOI: 10.1097/QAD.0b013e32834380c1] [DOI] [PMC free article] [PubMed] [Google Scholar]
Rauhala 2008 {unpublished data only}
- Rauhala, A. The Validity and Feasibility of Measurement Tools for Human Resources Management in Nursing Case of the RAFAELA System. Available at epublications.uef.fi/pub/urn_isbn_978-951-27-1069-0/urn_isbn_978-951-27-1069-0.pdf.
Riley 2007 {published data only}
- Riley P, Vindigni S. Developing a nursing database system in Kenya. Health Services Research 2007;42(3p2):1389-405. [DOI: 10.1111/j.1475-6773.2007.00715.x] [DOI] [PMC free article] [PubMed] [Google Scholar]
Ruton 2018 {published data only}
- Ruton H, Musabyimana A, Gaju E, Berhe A, Grépin KA, Ngenzi J, et al. The impact of an mHealth monitoring system on health care utilization by mothers and children: an evaluation using routine health information in Rwanda. Health Policy and Planning 2018;33(8):920-7. [DOI: ] [DOI] [PMC free article] [PubMed] [Google Scholar]
Spero 2011 {published data only}
- Spero JC, McQuide PA, Matte R. Tracking and monitoring the health workforce: a new human resources information system (HRIS) in Uganda. Human Resources for Health 2011;9(6):1-10. [DOI: ] [DOI] [PMC free article] [PubMed] [Google Scholar]
Stengel 2004 {published data only}
- Stengel D, Bauwens K, Walter M, Kopfer T, Ekkernkamp A. Comparison of handheld computer-assisted and conventional paper chart documentation of medical records. A randomized, controlled trial. Journal of Bone and Joint Surgery. American Volume 2004;86-a(3):553-60. [DOI] [PubMed] [Google Scholar]
Usman 2008 {published data only}
- Usman HR, Akhtar S, Habib F, Jehan I. Redesigned immunization card and center-based education to reduce childhood immunization dropouts in urban Pakistan: a randomized controlled trial. Vaccine 2009;27(3):467-72. [DOI: ] [DOI] [PubMed] [Google Scholar]
Valadez 2014 {published data only}
- Valadez JJ, Devkota B, Pradhan MM, Meherde P, Sonal GS, Dhariwal S, et al. Improving malaria treatment and prevention in India by aiding district managers to manage their programmes with local information: a trial assessing the impact of Lot Quality Assurance Sampling on programme outcomes. Tropical Medicine & International Health 2014;19(10):1226-36. [DOI: 10.1111/tmi.12354] [DOI] [PubMed] [Google Scholar]
Venkateswaren 2018 {published data only}
- Venkateswaran M, Mørkrid K, Ghanem B, Abbas E, Abuward I, Baniode M, et al. eRegQual—an electronic health registry with interactive checklists and clinical decision support for improving quality of antenatal care: study protocol for a cluster randomized trial. Trials 2018;19(54):1-12. [DOI: ] [DOI] [PMC free article] [PubMed] [Google Scholar]
Waters 2013 {published data only}
- Waters KP, Zuber A, Willy RM, Kiriinya RN, Waudo AN, Oluoch T, et al. Kenya’s Health Workforce Information System: A model of impact on strategic human resources policy, planning and management. International Journal of Medical Informatics 2013;82(9):895-902. [DOI: ] [DOI] [PubMed] [Google Scholar]
Were 2010 {published data only}
- Were MC, Emenyonu N, Achieng M, Shen C, Ssali J, Mashaba JB, et al. Evaluating a scalable model for implementing electronic health records in resource-limited settings. Journal of the American Medical Informatics Association 2010;17(3):237-44. [DOI: https://doi.org/10.1136/jamia.2009.002303] [DOI] [PMC free article] [PubMed] [Google Scholar]
Yen 2005 {unpublished data only}
- Yen PY, Gorman PN. Usability testing of digital pen and paper system in nursing documentation. AMIA Annual Symposium Proceeding Archive 2005;2005:844-8. [PMC free article] [PubMed] [Google Scholar]
Zurovac 2011 {published data only}
- Zurovac D, Sudoi RK, Akhwale WS, Ndiritu M, Hamer DH, Rowe AK, et al. The effect of mobile phone text-message reminders on Kenyan health workers' adherence to malaria treatment guidelines: a cluster randomised trial. Lancet 2011;378(9793):795-803. [DOI: ] [DOI] [PMC free article] [PubMed] [Google Scholar]
References to studies awaiting assessment
He 2014 {published data only}
- He P, Yuan Z, Liu Y, Li G, Lv H, Yu H, et al. An evaluation of a tailored intervention on village doctors use of electronic health records. BMC Health Services Research 2014;14:217. [DOI: ] [DOI] [PMC free article] [PubMed] [Google Scholar]
Monyarit 2014 {published data only}
- Monyarit S, Pan-ngum W, Lawpoolsri S, Yimsamran S, Pongnumkul S, Kaewkungwal J, et al. Advantages of using voiced questionnaire and image capture application for data collection from a minority group in rural areas along the Thailand-Myanmar border. Journal of Innovation in Health Informatics 2014;21(4):179-88. [DOI: ] [DOI] [PubMed] [Google Scholar]
O'Connor 2019 {published data only}
- O'Connor EC, Hutain J, Christensen M, Kamara MS, Conteh A, Sarriot E, et al. Piloting a participatory, community-based health information system for strengthening community-based health services: findings of a cluster-randomized controlled trial in the slums of Freetown, Sierra Leone. Journal of Global Health 2019;9(1):010418. [DOI: 10.7189/jogh.09.010418] [DOI] [PMC free article] [PubMed] [Google Scholar]
Singh 2012 {published data only}
- Singh R, Anderson D, McLean-Plunkett E, Brooks R, Wisniewski A, Satchidanand N, et al. IT-enabled systems engineering approach to monitoring and reducing ADEs. American Journal of Managed Care 2012;18:169-75. [PubMed] [Google Scholar]
Toda 2016 {published data only}
- Toda M, Njeru I, Zurovac D, Tipo SO, Kareko D, Mwau M, et al. Effectiveness of a mobile short-message-service-based disease outbreak alert system in Kenya. Emerging Infectious Diseases 2016;22(4):711-715. [DOI: 10.3201/eid2204.151459] [DOI] [PMC free article] [PubMed] [Google Scholar]
Additional references
Agarwal 2019
- Agarwal S, Glenton C, Henschke N, Fonhus M, Lewin S Bergman H etal. Web Annex D: Tracking health commodity inventory and notifying stock levels via mobile devices (unpublished review). WHO guideline: Digital health recommendations for health system strengthening 2019.
Aqil 2009
- Aqil A, Lippeveld T, Hozumi D. PRISM framework: a paradigm shift for designing, strengthening and evaluating routine health information systems. Health Policy and Planning 2009;24(3):217-28. [DOI: ] [DOI] [PMC free article] [PubMed] [Google Scholar]
Arah 2003
- Arah OA, Klazinga NS, Delnoij DM, ten Asbroek AH, Custers T. Conceptual frameworks for health systems performance: a quest for effectiveness, quality, and improvement. International Journal for Quality in Health Care 2003;15(5):377-98. [DOI: ] [DOI] [PubMed] [Google Scholar]
Aspry 2013
- Aspry KE, Furman R, Karalis DG, Jacobson TA, Zhang AM, Liptak GS, et al. Effect of health information technology interventions on lipid management in clinical practice: a systematic review of randomized controlled trials. Journal of Clinical Lipidology 2013;7(6):546-60. [DOI: ] [DOI] [PubMed] [Google Scholar]
Bassi 2010
- Bassi J, Lau F, Bardal S. Use of information technology in medication reconciliation: a scoping review. The Annals of Pharmacotherapy 2010;44(5):885-97. [DOI: ] [DOI] [PubMed] [Google Scholar]
Bassi 2012
- Bassi J, Lau F, Lesperance M. Perceived impact of electronic medical records in physician office practices: a review of survey-based research. Interactive Journal of Medical Research 2012;1(2):e3. [DOI: 10.2196/ijmr.2113] [DOI] [PMC free article] [PubMed] [Google Scholar]
Bassi 2013
- Bassi J, Lau F. Measuring value for money: a scoping review on economic value of health information systems. Journal of the American Medical Informatics Association 2013;20(4):792-801. [DOI: ] [DOI] [PMC free article] [PubMed] [Google Scholar]
Black 2011
- Black AD, Car J, Pagliari C, Anandan C, Cresswell K, Bokun T, et al. The impact of eHealth on the quality and safety of health care: a systematic overview. PLoS Medicine 2011;8(1):e1000387. [DOI: 10.1371/journal.pmed.1000387] [DOI] [PMC free article] [PubMed] [Google Scholar]
Blaya 2010a
- Blaya J, Shin S, Yale G, Suarez C, Asencios L, Contreras C, et al. Electronic laboratory system reduces errors in National Tuberculosis Program: a cluster randomized controlled trial. International Journal of Tuberculosis and Lung Disease 2010;2214(8):1009–15. [PMC free article] [PubMed] [Google Scholar]
Blaya 2010b
- Blaya JA, Fraser HS, Holt B. E-health technologies show promise in developing countries. Health Affairs 2010;29(2):244-51. [DOI: ] [DOI] [PubMed] [Google Scholar]
Blaya 2011
- Blaya J, Shin S, Contreras C, Yale G, Suarez C, Asencios L, et al. Full impact of laboratory information system requires direct use by clinical staff: cluster randomized controlled trial. Journal of the American Medical Informatics Association 2011;18(1):11-6. [DOI: ] [DOI] [PMC free article] [PubMed] [Google Scholar]
Boonstra 2010
- Boonstra A, Broekhuis M. Barriers to the acceptance of electronic medical records by physicians from systematic review to taxonomy and interventions. BMC Health Services Research 2010;10:231. [DOI: ] [DOI] [PMC free article] [PubMed] [Google Scholar]
Bosch‐Caplanch 2018
- Bosch-Caplanch X, Zuske M, Auer C. Effects of interventions to improve Health Information use Systems (draft). Swiss Tropical and Public Health Institute, Swiss Centre for International Health 2018.
Chaudhry 2006
- Chaudhry B, Wang J, Wu S, Maglione M, Mojica W, Roth E, et al. Systematic review: impact of health information technology on quality, efficiency, and costs of medical care. Annals of Internal Medicine 2006;144(10):742-52. [DOI: ] [DOI] [PubMed] [Google Scholar]
Covidence 2015 [Computer program]
- Covidence systematic review software https://www.covidence.org. Melbourne, Australia: Veritas Health Innovation, 2015.
DeLone 1992
- DeLone WH, McLean ER. Information system success: the quest for the dependent variable. Information Systems Research 1992;3(1):60-95. [DOI: ] [Google Scholar]
Dixon‐Woods 2013
- Dixon-Woods M, Redwood S, Leslie M, Minion J, Martin GP, Coleman JJ. Improving quality and safety of care using "techno-vigilance": an ethnographic case study of secondary data from an electronic prescribing and decision support system. Milbank Quarterly 2013;91(3):424-54. [10.1111/1468-0009.12021] [DOI] [PMC free article] [PubMed] [Google Scholar]
EPOC 2017a
- Effective Practice and Organisation of Care (EPOC). What study designs should be included in an EPOC review and what should they be called? EPOC-specific resources for review authors. Oslo: Norwegian Knowledge Centre for the Health Services; 2017. https://epoc.cochrane.org/sites/epoc.cochrane.org/files/public/uploads/Resources-for-authors2017/what_study_designs_should_be_included_in_an_epoc_review.pdf (accessed 16 December 2015).
EPOC 2017b
- Effective Practice and Organisation of Care (EPOC). What outcomes should be reported in EPOC reviews? EPOC resources for review authors. Oslo: Norwegian Knowledge Centre for the Health Services; 2017. https://epoc.cochrane.org/sites/epoc.cochrane.org/files/public/uploads/Resources-for-authors2017/what_outcomes_should_be_reported_in_epoc_reviews.pdf (accessed 16 December 2015).
EPOC 2017c
- Effective Practice and Organisation of Care (EPOC). Suggested risk of bias criteria for EPOC reviews. EPOC Resources for review authors. Oslo: Norwegian Knowledge Centre for the Health Services; 2017. https://epoc.cochrane.org/sites/epoc.cochrane.org/files/public/uploads/Resources-for-authors2017/suggested_risk_of_bias_criteria_for_epoc_reviews.pdf (accessed 16 December 2015).
EPOC 2017d
- Effective Practice and Organisation of Care (EPOC). Synthesising results when it does not make sense to do a meta-analysis. EPOC Resources for review authors. Oslo: Norwegian Knowledge Centre for the Health Services; 2017. https://epoc.cochrane.org/sites/epoc.cochrane.org/files/public/uploads/Resources-for-authors2017/synthesising_results_when_meta-analysis_does_not_make_sense.pdf (accessed 16 December 2015).
GRADEpro GDT [Computer program]
- GRADEpro Guideline Development Tool. McMaster University (developed by Evidence Prime, Inc.). Available from www.gradepro.org, 2015.
Guyatt 2008
- Guyatt GH, Oxman AD, Kunz R, Vist GE, Falck-Ytter Y, Schünemann HJ, GRADE Working Group. What is "quality of evidence" and why is it important to clinicians? British Medical Journal 2008;336(7651):995-8. [DOI: 10.1136/bmj.39490.551019.BE] [DOI] [PMC free article] [PubMed] [Google Scholar]
Hazel 2017
- Hazel E, Chimbalanga E, Chimuna T, Nsona H, Mtimuni A, Kaludzu E, et al. Using data to improve programs: assessment of a data quality and use intervention package for Integrated Community Case Management in Malawi. Global Health: Science and Practice 2017;5(3):355-66. [DOI: ] [DOI] [PMC free article] [PubMed] [Google Scholar]
Higgins 2019
- Higgins JPT, Thomas J, Chandler J, Cumpston M, Li T, Page MJ, Welch VA (editors). Cochrane Handbook for Systematic Reviews of Interventions version 6.0 (updated July 2019). Available from www.training.cochrane.org/handbook.org 2019. [DOI] [PMC free article] [PubMed]
Hotchkiss 2010
- Hotchkiss DR, Aqil A, Lippeveld T, Mukooyo E. Evaluation of the Performance of Routine Information System Management (PRISM) framework: evidence from Uganda. BMC Health Services Research 2010;10(188):1-17. [DOI: ] [DOI] [PMC free article] [PubMed] [Google Scholar]
Hotchkiss 2012
- Hotchkiss D, Diana M, Foreit K. How can routine health information systems improve health systems in low-resource settings? Assessing the evidence base. Measure Evaluation Special Report. Carolina Population Center, University of North Carolina at Chapel Hill. http://www.hrhresourcecenter.org/node/4089 (accessed 16 December 2015):1-50.
Jordan 2010
- Jordan M, Jordon Lanham H, Anderson RA, McDaniel RR Jr. Implications of complex adaptive systems theory for interpreting research about health care organization. Journal of Evaluation in Clinical Practice 2010;16(1):228-31. [DOI: 10.1111/j.1365-2753.2009.01359.x] [DOI] [PMC free article] [PubMed] [Google Scholar]
Kebede 2010
- Kebede D, Zielinski C, Ebongue Mbondji P, Sanou I, Asamoah-Odei E, Soumbey-Alley EW, et al. Improving the availability, quality and use of health information, research evidence and knowledge to strengthen health systems. African Health Monitor, World Health Organization Regional Office for Africa 2010;(12):53-64. [https://www.afro.who.int/sites/default/files/2017-06/Improving_Availability_and_Use_of_IEK2010.pdf] [Google Scholar]
Lau 2010
- Lau F, Kuziemsky C, Price M, Gardner J. A review on systematic reviews of health information system studies. Journal of the American Medical Informatics Association 2010;17(6):637-45. [DOI: ] [DOI] [PMC free article] [PubMed] [Google Scholar]
Leatherman 2010
- Leatherman S, Ferris T, Berwick D, Omaswa F, Crisp N. The role of quality improvement in strengthening health systems in developing countries. International Journal for Quality in Health Care 2010;22(4):237-43. [DOI: ] [DOI] [PubMed] [Google Scholar]
Lewin 2006
- Lewin SA, Dick J, Pond P, Zwarenstein M, Aja G, Wyk B, et al. Lay health workers in primary and community health care. Cochrane Database of Systematic Reviews 2006, Issue 1. Art. No: CD004015. [DOI: 10.1002/14651858.CD004015.pub2] [DOI] [PubMed] [Google Scholar]
Liberati 2009
- Liberati A, Altman DG, Tetzlaff J, Mulrow C, Gøtzsche PC, Ioannidis JP, et al. The PRISMA statement for reporting systematic reviews and meta-analyses of studies that evaluate health care interventions: explanation and elaboration. Journal of Clinical Epidemiology 2009;62(10):e1-e34. [DOI: ] [DOI] [PubMed] [Google Scholar]
Lippeveld 1997
- Lippeveld T, Sauerborn R, Sapirie S. Health information systems: Making them work. World Health Forum, World Health Organization 1997;18(2):176-84. [PubMed] [Google Scholar]
Lippeveld 2000
- Lippeveld T, Sauerborn R, Bodart C. Design and Implementation of Health Information Systems. Geneva: World Health Organization, 2000. [://scholar.google.com/scholar?hl=en&as_sdt=0%2C47&q=Design+and+Implementation+of+Health] [Google Scholar]
Littlejohns 2003
- Littlejohns P, Wyatt JC, Garvican L. Evaluating computerised health information systems: hard lessons still to be learnt. British Medical Journal 2003;326:860-3. [DOI: https://doi.org/10.1136/bmj.326.7394.860 ] [DOI] [PMC free article] [PubMed] [Google Scholar]
Mutale 2013
- Mutale W, Chintu N, Amoroso C, Awoonor-Williams K, Phillips J, Baynes C, et al. Improving health information systems for decision making across five sub-Saharan African countries: implementation strategies from the African Health Initiative. BMC Health Services Research 2013;13(Suppl 2):S9. [DOI: ] [DOI] [PMC free article] [PubMed] [Google Scholar]
Nutley 2013
- Nutley T, Reynolds HW. Improving the use of health data for health system strengthening. Global Health Action 2013;6(1):1-10. [DOI: ] [DOI] [PMC free article] [PubMed] [Google Scholar]
Nutley 2014
- Nutley T, Gnassou L, Traore M, Bosso AE, Mullen S. Moving data off the shelf and into action: an intervention to improve data-informed decision making in Cote d'Ivoire. Global Health Action 2014;7:25035. [PMID: ] [DOI] [PMC free article] [PubMed] [Google Scholar]
Rahimi 2007
- Rahimi B, Vimarlund V. Methods to evaluate health information systems in healthcare settings: a literature review. Journal of Medical Systems 2007;31(5):397-432. [DOI: ] [DOI] [PubMed] [Google Scholar]
Rahimi 2009
- Rahimi B, Vimarlund V, Timpka T. Health information system implementation: a qualitative meta-analysis. Journal of Medical Systems 2009;33(5):359-68. [DOI] [PubMed] [Google Scholar]
Ramsay 2003
- Ramsay CR, Matowe L, Grilli R, Grimshaw JM, Thomas RE. Interrupted time series designs in health technology assessment: lessons from two systematic reviews of behavior change strategies. International Journal of Technology Assessment in Health Care 2003;19(4):613-23. [DOI: https://doi.org/10.1017/S0266462303000576] [DOI] [PubMed] [Google Scholar]
Review Manager 2014 [Computer program]
- Review Manager 5 (RevMan 5). Version 5.3. Copenhagen: Nordic Cochrane Centre, The Cochrane Collaboration, 2014.
Riley 2012
- Riley PL, Zuber A, Vindigni SM, Gupta N, Verani AR, Sunderland NL, et al. Information systems in human resources for health: a global view. Human Resources for Health 2012;10:7. [DOI: ] [DOI] [PMC free article] [PubMed] [Google Scholar]
Shieshia 2014
- Shieshia M, Noel M, Andersson S, Felling B, Alva S, Agarwal S, et al. Strengthening community health supply chain performance through an integrated approach: using mHealth technology and multilevel teams in Malawi. Journal of Global Health 2014;4(2):1-12. [DOI: 10.7189/jogh.04.020406] [DOI] [PMC free article] [PubMed] [Google Scholar]
Sligo 2017
- Sligo J, Gauld R, Roberts V, Villa L. A literature review for large-scale health information system project planning, implementation and evaluation. International Journal of Medical Informatics 2017;97:86-97. [DOI: ] [DOI] [PubMed] [Google Scholar]
Stringer 2013
- Stringer JA, Chisembele-Taylor A, Chibwesha CJ, Chi HF, Ayles H, Manda, H, et al. Protocol-driven primary care and community linkages to improve population health in rural Zambia: the Better Health Outcomes through Mentoring and Assessment (BHOMA) project. BMC Health Services Research 2013;13(2):S7. [DOI: ] [DOI] [PMC free article] [PubMed] [Google Scholar]
Tursunbayeva 2017
- Tursunbayeva A, Bunduchi R, Franco M, Pagliari C. Human resource information systems in health care: a systematic evidence review. Journal of the American Medical Informatics Association : JAMIA 2017;24(3):633-54. [DOI: ] [DOI] [PMC free article] [PubMed] [Google Scholar]
Wagenaar 2017
- Wagenaar BH, Hirschhorn LR, Henley C, Gremu A, Sindano N, Chilengi R, the AHI PHIT Partnership Collaborative. Data-driven quality improvement in low-and middle-income country health systems: lessons from seven years of implementation experience across Mozambique, Rwanda, and Zambia. BMC Health Services Research 2017;17(3):830. [DOI: 10.1186/s12913-017-2661-x] [DOI] [PMC free article] [PubMed] [Google Scholar]
WHO 2007
- World Health Organization. Everybody's business. Strengthening health systems to improve health outcomes: WHO’s framework for action. World Health Organization 2015. [https://apps.who.int/iris/bitstream/handle/10665/43918/9789241596077_eng.pdf]
WHO 2008
- World Health Organization. Framework and standards for country health information systems (Second edition). Health Metrics Network, World Health Organization 2008:https://apps.who.int/iris/bitstream/handle/10665/43872/9789244595947_rus.pdf.
WHO 2010
- World Health Organization. Monitoring the building blocks of health systems: a handbook of indicators and their measurement strategies. World Health Organisation 2010:http://www.who.int/healthinfo/systems/monitoring/en/. [http://www.who.int/healthinfo/systems/monitoring/en/]
WHO 2017
- World Health Organization. National health workforce accounts: a handbook. World Health Organisation 2017. [https://apps.who.int/iris/bitstream/handle/10665/259360/9789241513111-eng.pdf]
WHO 2019
- World Health Organization. WHO Guideline: recommendations on digital interventions for health system strengthening. World Health Organisation 2019:https://www.who.int/reproductivehealth/publications/digital-interventions-health-system-strengthening/en/. [https://www.who.int/reproductivehealth/publications/digital-interventions-health-system-strengthening/en/] [PubMed]
Willis 2013
- Willis CD, Riley BL, Herbert CP, Best A. Networks to strengthen health systems for chronic disease prevention. American Journal of Public Health 2013;103(11):e39-48. [DOI: ] [DOI] [PMC free article] [PubMed] [Google Scholar]
Zuske 2017
- Zuske M, Jarrett C, Christian Auer C, Bosch-Capblanch X. Health information use systems: framework synthesis (draft). Swiss Tropical and Public Health Institute, Swiss Centre for International Health 2017.
References to other published versions of this review
Leon 2015
- Leon N, Brady L, Kwamie A, Daniels K. Routine Health Information System (RHIS) interventions to improve health systems management. Cochrane Database of Systematic Reviews 2015, Issue 12. Art. No: CD012012. [DOI: 10.1002/14651858.CD012012] [DOI] [PMC free article] [PubMed] [Google Scholar]