

Abstract
Mental retardation, the hallmark of Down syndrome (DS), has been attributed to the reduced number of neurons populating the DS brain. The Ts65Dn mouse model of DS displays several anomalies analogous to those in individuals with DS, including neurogenesis impairment. The goal of the current study was to determine whether cell cycle alterations underlie neurogenesis impairment in the cerebellum of the Ts65Dn mouse and to identify the molecular mechanisms responsible for this defect. In neonatal (2‐day old) Ts65Dn mice, cerebellar granule cell precursors exhibited a reduced proliferation rate (−40%) and a notable elongation (+45%) of the cell cycle. Alteration of cell cycle rate was due to elongation of the G2 and G1 phases. Microarray screening of cell cycle regulatory genes showed that Ts65Dn mice had a decreased expression of Cyclin B1 and Skp2, two key regulators of G2/M and G1/S transition. Results point at cell cycle elongation as major determinant of neurogenesis reduction in the cerebellum of Ts65Dn mice and suggest that this defect is specifically linked to an altered expression of two cell‐cycle regulatory genes, Cyclin B1 and Skp2. These findings may establish the basis for a therapeutic approach aimed at restoring neurogenesis in the DS brain.
Keywords: cell cycle, cerebellum, Down syndrome, neurogenesis, Skp2
INTRODUCTION
Down syndrome (DS) is due to triplication of human chromosome 21 (HSA21) and is the most prevalent genetically defined cause of intellectual disability, with an incidence of 1 in 700 live births (21, 47). Although most systems are affected to some degree in DS, impaired cognitive function is the most debilitating and important problem. The major determinant of mental retardation is considered to be the characteristically decreased brain size of individuals with DS. In trisomy 21 there is an overall reduction in brain volume, with particularly prominent hypotrophy of the cerebral hemispheres, frontal lobe, temporal cortex, hippocampus and cerebellum (3, 4, 12, 29, 42, 50, 53, 55, 57, 62, 63). The reduced brain volume arises early in development, as it is seen in children and even fetuses with DS (42, 53, 55, 62), suggesting that atrophy of the adult DS brain may be related to developmental defects in the processes of neurogenesis. How trisomy 21 interferes in neurogenic processes, thus altering brain size and function, remains still unknown.
Investigation of central nervous system abnormalities and cognitive dysfunction in DS has been greatly facilitated by the development of three trisomic DS mouse models: Ts16 (44), Ts65Dn (11) and Ts1Cje (52). These mice are trisomic for all (Ts16) or segments (Ts65Dn, Ts1Cje) of mouse chromosome 16 (Mmu16), highly homologous to the long arm of HSA21 (1). Several phenotypes analogous to those in DS have been established in mouse genetic models. The Ts65Dn mouse, one of the animal models most comparable to DS, both in terms of triplicated genes and phenotype (11, 45), exhibits small body size (49); alterations in the craniofacial skeleton (46) and cognitive impairment, especially in tasks mediated by the hippocampus (13, 14, 24, 45). Motor dysfunction is widespread among children and adults of individuals with DS. Recent evidence shows that the Ts65Dn mouse model is also characterized by gait defects similar to the trisomic condition of humans (19). Finally, the Ts65Dn mouse exhibits some anatomical changes in the brain that parallel those in DS; such as hypocellularity in hippocampal structures (26, 34), reduced cerebellar volume and reduced granule cell and Purkinje cell density (5).
Recent work in subjects with DS and DS mouse models has explored the hypothesis that brain hypoplasia and reduction in neuron number may be due to defective neurogenesis during critical phases of brain building. In the developing cerebellum of Ts65Dn mice, it has been shown that the reduced cerebellar size is associated to failure to generate sufficient progeny from the cerebellar granule cell precursors (48). Developmental reduction in cell proliferation has been characterized in another model for DS, the Ts16 mouse (44). The neocortex of this DS mouse model is characterized by a transient delay in radial expansion and reduction in cortical wall, due to reduction of cortical precursors and altered rate of proliferation. Defects in embryonic neurogenesis have been recently documented also in the Ts65Dn mouse model for DS (6). In addition, evidence has been provided for reduced cell proliferation in the hippocampus of adult and aged Ts65Dn mice (7, 51). We recently showed neurogenesis impairment in the developing hippocampal dentate gyrus of the neonate Ts65Dn mouse (9) and in the same work we demonstrated, for the first time, a comparable neurogenesis impairment in the human dentate gyrus of fetuses with DS (9, 17). From our findings, in addition, it appeared that both fetuses with DS and Ts65Dn mice had a higher proportion of proliferating cells in the G2 phase of cell cycle with respect to the M phase, suggesting that the reduced proliferation rate of the DS brain may be causally related to defects in cell cycle progression. Cell cycle defects have been recently demonstrated in the embryonic ventricular zone and hippocampus (6). While in the ventricular zone defects in cell cycle ameliorate with time, the same does not occur in the developing hippocampus (6).
In rodents, cerebellar granule cells mainly proliferate during the first two postnatal weeks. Evidence in mice shows that Ts65Dn and euploid mice are born with a similar number of cerebellar granule cell precursors but that Ts65Dn mice have a reduced number of mitoses and that, by postnatal day six, Ts65Dn mice have less granule cell precursors than euploid mice (48). The goals of the current study were (i) to establish whether an elongation of the cell cycle may underlie the reduced proliferation rate of granule cell precursors in the developing cerebellum of the Ts65Dn mouse; (ii) to assess the dynamics of different phases of cell cycle in the Ts65Dn and normogenic mouse and (iii) to identify the molecular mechanisms underlying possible alterations of the cell cycle in the Ts65Dn mouse.
MATERIALS AND METHODS
Ts65Dn mice colony
Female Ts65Dn mice carrying a partial trisomy of chromosome 16 (45) were obtained from Jackson Laboratories (Bar Harbor, ME, USA) and maintained on the original genetic background by mating them to C57BL/6JEi × C3SnHeSnJ (B6EiC3) F1 males. Animals were karyotyped by fluorescent in situ hybridization (FISH), as previously described (8) or by real‐time quantitative Polymerase Chain Reaction (qPCR) as previously described (33). The day of birth was designed as postnatal day (P) zero and animals with 24 h of age were considered as one‐day‐old animals (P1). The animal health and comfort were veterinary controlled. The animals had access to water and food ad libitum and lived in a room with a 12:12‐hdark/light cycle. Experiments were performed in accordance with the Italian and European Community law for the use of experimental animals and were approved by Bologna University Bioethical Committee. In this study all efforts were made to minimize animal suffering and to keep to a minimum the number of animals used.
Experimental protocol
To determine the amount of proliferating cells, P2 mice (six control and six Ts65Dn mice) received a single subcutaneous injection (100 µg/g body weight) of 5‐bromo‐2‐deoxyuridine (BrdU; Sigma, St. Louis, MO, USA), a marker of proliferating cells and their progeny (40) in 0.9% NaCl solution. Animals were sacrificed 2 h after the BrdU injection. Some of these animals (four control and four Ts65Dn mice) were used also for Phospho‐(Ser10)‐Histone H3 immunohistochemistry. For in vivo cell cycle analysis, an additional group of animals (seven control and seven Ts65Dn mice) received multiple (two or three) BrdU injections spaced 2 h and were sacrificed 2 h after the last injection. All treatments started at 10:00 h. For cell fate experiments, animals (five control and five Ts65Dn mice) received a single BrdU injection on P2 and were sacrificed 28 days after the injection (on P30).
Histological procedures
Brains of P2 animals were fixed by immersion in Glyo‐Fixx (Thermo Electron Corp., Waltham, MA, USA) and brains of P30 animals were fixed by perfusion with 4% paraphormaldehyde, as previously described (9). Brains of P2 and P30 animals were embedded in paraffin or stored at −80°C respectively. Cerebella were sagittally cut in 8‐µm‐thick (paraffin) or 30‐µm‐thick (freezing microtome) sections.
BrdU immunohistochemistry
One out of 12 sections, in P2 animals, and one out of six sections, in P30 animals, was processed for BrdU immunohistochemistry. BrdU immunohistochemistry was performed as previously described (9) with anti‐BrdU mouse monoclonal antibody (dilution 1:100, Roche Applied Science, Mannheim, Germany). Detection was performed with Horseradish peroxidase (HRP)‐conjugated anti‐mouse antibody (dilution 1:100, Amersham Biosciences, Uppsala, Sweden) and Diaminobenzidine (DAB) kit (Vector Laboratories, Burlingame, CA, USA). Sections were counterstained with Toluidine Blue. In some P2 cases, fluorescent BrdU immunohistochemistry was performed in one out of 12 sections with a fluorescent Cy3‐conjugated anti‐mouse secondary antibody (dilution 1:100, Sigma), together with Hoechst‐33258 counterstaining.
Phospho‐(Ser10)‐Histone H3 (pHH3) immunohistochemistry
One out of 12 sections from P2 animals was processed for antigen retrieval by incubation in 10 mM Tris, pH 8.6 at 95°C for 40 minutes and then incubated with anti‐pHH3 rabbit polyclonal antibody (dilution 1:100, Upstate Biotechnology, Lake Placid, NY, USA). Sections were then incubated with HRP‐conjugated anti‐rabbit secondary antibody (dilution 1:100, Amersham Biosciences). HRP detection was performed with DAB kit (Vector Laboratories). Sections were counterstained with Toluidine Blue.
Double‐fluorescence immunohistochemistry
For BrdU and pHH3 double immunofluorescence, one out of 12 sections from P2 animals was processed for antigen retrieval as described above. Detection was performed with Cy3‐conjugated anti‐mouse or Fluorescein (FITC)‐conjugated anti‐rabbit (dilution 1:100, Sigma) secondary antibodies. To characterize the cell fate of the mitotic population, in P30 animals that had received one BrdU injection on P2, one out of 12 sections was processed for double‐fluorescence immunohistochemistry as previously described (9) with an anti‐BrdU rat monoclonal antibody (Biotechnology, Kidlington, UK) and an antibody either for the neuronal marker neuron‐specific nuclear protein (NeuN, Chemicon, Temecula, CA, USA) or the glial marker glial fibrillary acidic protein (GFAP; Sigma). Sections were incubated with Cy3 conjugated anti‐rat (dilution 1:200, Jackson Immunoresearch, West Grove, PA, USA) or FITC conjugated anti‐mouse (dilution 1:200, Sigma) secondary antibodies.
Nissl‐method
In P2 animals (six control and six Ts65Dn mice), one out of 12 sections was stained with Toluidine Blue, according to the Nissl method.
Image acquisition and analysis
Bright field images were taken with a Leitz Diaplan microscope equipped with a motorized stage and a Coolsnap‐Pro™ color digital camera (Media Cybernetics, Silver Spring, MD, USA). Fluorescence images were taken with a Leica TCS™ confocal microscope (Leica Microsystems, Wetzlar, Germany) or an Eclipse TE 2000‐S™ (Nikon Corp., Kawasaki, Japan) microscope, equipped with an AxioCam MRm (Zeiss, Oberkochen, Germany) digital camera. Measurements were carried out with the sofware Image Pro Plus™ (Media Cybernetics, Silver Spring, MD 20910, USA).
Measurements
Number of BrdU‐labeled cells and labeling index
BrdU‐positive cells were counted in one out of 12 sections in P2 animals or one out of six sections in P30 animals, in a series of sections covering the complete latero‐lateral extent of the cerebellum. In P2 animals that were sacrificed 2 h after one BrdU injection, cell count was done in the external granular layer (EGL; Figure 1), the site of proliferation of cerebellar granule cell precursors (GCP) prior to their migration to their final destination, the inner granular layer (IGL). In P30 animals that had received one BrdU injection on P2 and survived for additional 28 days, BrdU‐positive cells were counted in IGL. In P2 animals BrdU‐positive GCP were counted within randomly traced areas (1200–1400 µm2) in the outer (oEGL) and inner (iEGL) portions of the EGL (Figure 2A–F) of all cerebellar lobuli. Due to the small section thickness after histological processing (5.5–6.5 µm), all BrdU‐stained nuclei could be seen in a single plane of focus. Therefore, we counted BrdU‐positive cells in single images, taken at the best plane of focus. In the traced areas, we counted also the number of unlabeled GCP. The volume of the sampled regions was obtained by multiplying the traced areas times the nominal section thickness (8 µm). Density of BrdU‐positive cells was obtained by dividing the number of counted cells times the volume of the sampled region. Total number of BrdU‐positive cells in the EGL was estimated by multiplying the mean density of BrdU‐positive cells in this layer times the volume of the EGL. The volume was estimated by tracing the area of the EGL in each section and by multiplying it times the inverse of the section sampling frequency (1/12) (see also below). As Ts65Dn mice had less GCP than control mice (see Table 1), in each sampled area we evaluated the labeling index (LI), by expressing the number of BrdU‐positive GCP as percentage of total number of GCP (labeled plus unlabeled GCP). The LI was evaluated separately in the oEGL and iEGL. In view of the relatively small number of BrdU‐positive cells in P30 animals, we counted BrdU‐positive cells across the whole extent of the IGL, in each sampled section. Due to the small thickness of processed sections (7.0–8.5 µm) BrdU‐positive cells were counted in single images, taken at the best plane of focus. Total number of BrdU‐positive cells was estimated by multiplying the number counted in the series of sampled sections times the inverse of the section sampling fraction (SSF = 1/6).
Figure 1.
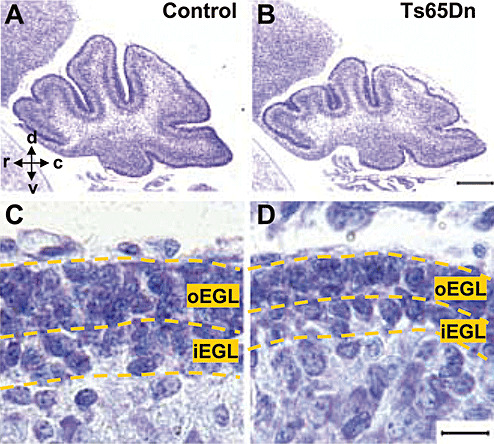
Examples of Nissl‐stained sections across the cerebellar midline of a P2 control (A) and a P2 Ts65Dn mouse (B). The scale bar (200 µm) in (B) applies to (A) and (B). Note the smaller size of the cerebellum in the Ts65Dn mouse. High‐magnification photomicrographs of sagittal sections across the cerebellum of a P2 control (C) and a P2 Ts65Dn mouse (D) showing the external granular layer (EGL). The scale bar (25 µm) in (D) applies to (C) and (D). Abbreviations: c = caudal; d = dorsal; iEGL = inner external granular layer; oEGL = outer external granular layer; r = rostral; v = ventral.
Figure 2.
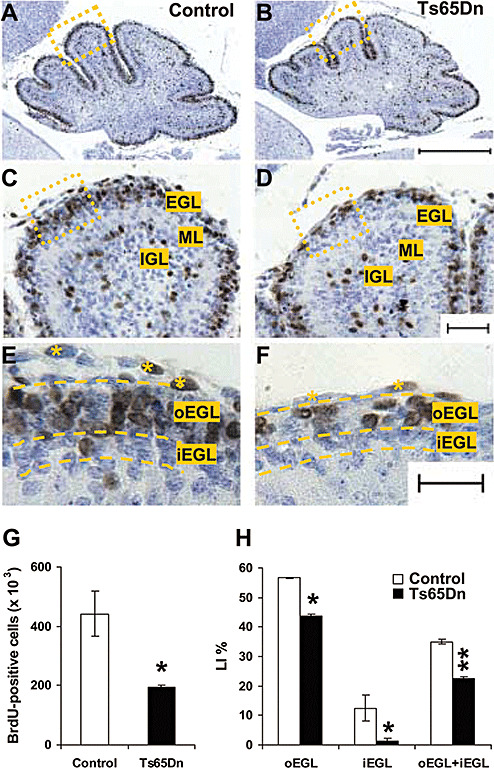
Cell proliferation in the cerebellum of Ts65Dn mice. A,B: Low magnification photomicrographs of sagittal sections across the cerebellum of a P2 control (A) and a P2 Ts65Dn mouse (B). Sections were taken at the level of the midline. Note the smaller size of the cerebellum in the Ts65Dn mouse. These animals received one BrdU injections on P2 and were sacrificed after 2 h. Sections were immunostained for BrdU and counterstained with Toluidine Blue. The scale bar (400 µm) in (B) applies to (A) and (B). C, D: Medium magnification photomicrographs of the areas enclosed by a rectangle in (A) and (B) are shown in (C) and (D), respectively. The borders of the cerebellar layers are indicated in (C). The cells with brown nuclei are BrdU‐positive cells. The scale bar (50 µm) in (D) applies to (C) and (D). E, F: High magnification photomicrographs of the areas enclosed by a rectangle in (C) and (D) are shown in (E) and (F), respectively. The dashed lines indicate the borders of the oEGL and iEGL. The asterisks mark cells belonging to the pia mater. The scale bar (25 µm) in (F) applies to (E) and (F). G, H: Quantification of BrdU‐positive cells in the cerebellum of control (n = 6) and Ts65Dn mice (n = 6). Animals received one BrdU injection on P2 and were sacrificed after 2 h. BrdU‐positive cells were counted separately in the oEGL and in the iEGL and were expressed as percentage of total number of GCP present in these layers (G) (labeling index: see Methods) or as total number of BrdU‐positive cells in the EGL (H). Values are means ± SEM. Abbreviations: EGL, external granular layer; oEGL, outer external granular layer; iEGL, inner external granular layer; IGL, inner granular layer; LI, labeling index; ML, molecular layer. *P < 0.05; **P < 0.01 (Student's two tailed t‐test).
Table 1.
Stereological data for the cerebellum of P2 control and Ts65Dn mice.
| Cerebellum (P2) | Volume (mm3) | Thickness (µm) | GCP density (cell/mm3) (1 × 10⁶) | Total GCP number (1 × 10⁶) | Total pyknotic cell number | |
|---|---|---|---|---|---|---|
| EGL | Control | 0.340 ± 0.010 | 21.408 ± 2.569 | 6.407 ± 0.396 | 2.203 ± 0.496 | 321.3 ± 12.5 |
| Ts65Dn | 0.229 ± 0.016** | 15.767 ± 1.865** | 5.510 ± 0.359* | 1.246 ± 0.251* | 1632 ± 98.0** | |
| oEGL | Control | 0.187 ± 0.021 | 13.109 ± 1.336 | 6.596 ± 0.487 | 1.232 ± 0.482 | 139.2 ± 9.84 |
| Ts65Dn | 0.153 ± 0.024* | 10.466 ± 1.004** | 5.658 ± 0.413* | 0.865 ± 0.478* | 994.1 ± 69.4** | |
| iEGL | Control | 0.153 ± 0.019 | 8.299 ± 1.496 | 6.345 ± 0.406 | 0.970 ± 0.321 | 183.1 ± 19.2 |
| Ts65Dn | 0.076 ± 0.011** | 5.509 ± 1.299** | 5.008 ± 0.481* | 0.380 ± 0.125** | 637.7 ± 51.7** | |
| ML | Control | 0.284 ± 0.010 | N/A | N/A | N/A | N/A |
| Ts65Dn | 0.254 ± 0.027 | |||||
| IGL | Control | 0.633 ± 0.027 | N/A | N/A | N/A | N/A |
| Ts65Dn | 0.531 ± 0.022* | |||||
Abbreviations: EGL = external granular layer; oEGL = outer external granular layer; iEGL = inner external granular layer; ML = molecular layer; IGL = inner granular layer; GCP = granular cell precursors; N/A = not available. Measurement of inner granular layer includes the layer of the Purkinje cells. The numbers are mean ± SEM (n = 6 control mice; n = 6 Ts65Dn mice). *P < 0.05; **P < 0.01 (Student's two tailed t‐test).
Evaluation of pyknotic cells
In Nissl‐stained sections from P2 animals, apoptotic cells were recognized based on their morphology, characterized by a pyknotic darkly stained nucleus and light or absent cytoplasm. We traced the areas of the oEGL and iEGL of two lobules (II and III) and counted all pyknotic nuclei present in the traced areas. Volume of each layer was evaluated from the area and section thickness (8 µm). Pyknotic cell density was estimated by dividing total number of counted cells times the volume (see above). Total number of pyknotic cell in each layer was calculated from the estimated cell density and total volume.
Quantification of pHH3‐labeleld cells
Immunohistochemistry for pHH3 staining allows one to discriminate cells in G2 or M phases of cell cycle (23). Cells in G2 exhibit punctate pHH3 nuclear staining, which turns to a homogeneously condensed pattern once they enter M phase. Cells in the late M phase exhibit the mitotic spindle (see Figure 5A). pHH3‐positive cells were counted at the top of lobules II and III in the oEGL. The number of cells in either G2 or M phase (early plus late M phase) of cell cycle cells was expressed as ratio over total number of GCP in the sampled area and indicated as G2 index (G2I) or M index (MI).
Figure 5.
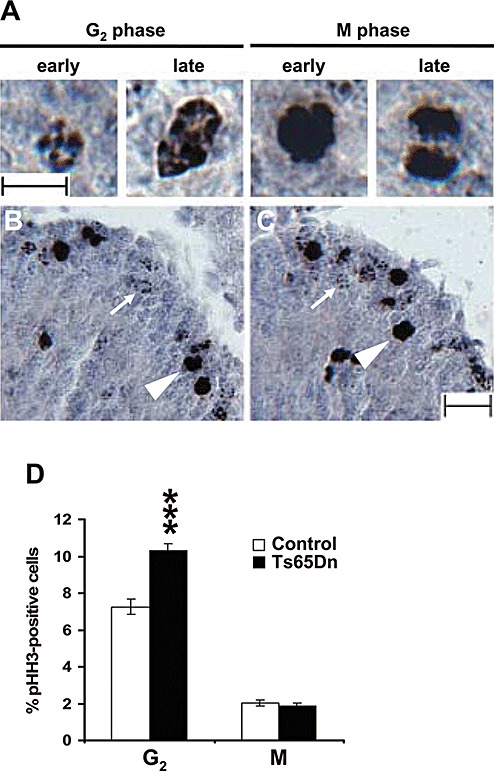
Percentage of cells in G2 and M phases of cell cycle in Ts65Dn mice. A: Images of pHH3 positive cells in the EGL of a P2 control mouse, showing a cell in early and late G2 phase, early M phase and mitotic division in late M phase. Cells in G2 exhibit a discontinuous pHH3 nuclear staining, cells in early M phase exhibit a homogeneously condensed pattern and cells approaching division (late M phase) exhibit mitotic spindles. Scale bar (10 µm) applies to all images in (A). B, C: Sections immunostained for pHH3 from the cerebellum of a P2 control (B) and a P2 Ts65Dn mouse (C). The white arrows indicate cells in G2 and the arrowheads indicate cells in M phase. Scale bar (25 µm) in (B) applies to (B) and (C). D: Number of cells in G2 and M phases of cell cycle, expressed as percentage of total number of GCP in the cerebellum of P2 control (n = 4) and Ts65Dn (n = 4) mice. Values are means ± SEM. ***P < 0.001 (Student's two tailed t‐test).
Cell cycle analysis
For determination of cell cycle of GCP an abridged version (31) of the BrdU cumulative labeling method (15, 36) was used. P2 mice received 1, 2 or 3 BrdU injections (100 µg/g body weight) spaced 2 h and were sacrificed 2 h after the last injection (corresponding to a labeling time of 2 h, 4 h and 6 h respectively). A total of 26 mice were used (13 controls and 13 Ts65Dn). The number of BrdU‐positive cells vs. total number of GCP (LI) was determined in the oEGL within an area (1200–1400 µm2) at the top of lobules II and III. LI values for control and Ts65Dn mice obtained at different time points were plotted as a function of time after the first BrdU injection. Using a linear regression analysis, a least‐squares line was best fitted to data points for each group. The y‐intercept and the x‐values for y = 1 extrapolated from the equation
were used to calculate the total length of the cell cycle (TC) and the length of the S phase (TS) as previously described (15). The y‐intercept (the b parameter of the equation above, ie, the LI at x = 0) represents the length of the S phase over total cell cycle length (Figure 4):
Figure 4.
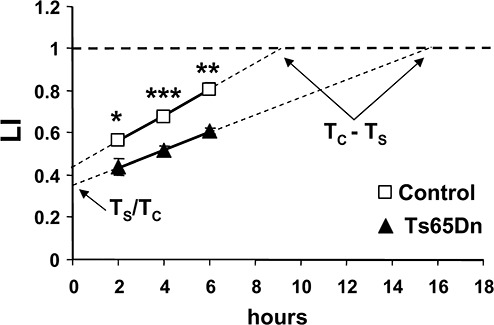
Measurement of cell cycle and S phase duration in Ts65Dn mice. Cumulative labeling indexes in control and Ts65Dn mice as function of time. Time is expressed as hours after the first BrdU injection (time 0). Animals received 1 (n = 6 control and 6 Ts65Dn mice), 2 (n = 4 control and 4 Ts65Dn mice) or 3 (n = 3 control and 3 Ts65Dn mice) BrdU injections each 2 h and were sacrificed 2 h after the last injection. Total duration of cell cycle (Tc) and of the S phase (Ts) were calculated as explained in Methods. Values are means ± SEM. *P < 0.05; **P < 0.01, ***P < 0.001 (Student's two tailed t‐test).
and the time at which all cells are labeled (y = 1) represents the interval TC–TS (Figure 4):
By solving the system of the two equations above, TC and TS can be calculated:
The number of cells in G2 or M phase of cell cycle over total cell number is proportional to the length of G2 (TG2) or M (TM) phase over total cycle length. Therefore, TG2 and TM were estimated from the G2I and MI obtained with pHH3 immunohistochemistry and total length of cell cycle (TG2 / TC = G2I; TM / TC = MI):
Finally, the length of the G1 phase was obtained by subtracting from the total length of the cell cycle the length of the other phases:
Volume measurement
In Nissl‐stained section from P2 animals the areas of the oEGL, iEGL, IGL and molecular layer were measured by tracing their contours. Volumes were determined based on Cavalieri's principle (18, 61) by multiplying the area measured in the series of sections and the distance (T) between sections. The latter was obtained by multiplying the number of sections interposed between the analyzed sections (12) times the section thickness (8 µm); T = 8 × 12 = 96 µm.
Total number of CGP
The number of GCP in the oEGL and iEGL was estimated by multiplying the density of GCP in each layer for the volume of the layer. GCP were counted within randomly traced areas (1200–1400 µm2) in the oEGL and iEGL of all cerebellar lobuli. Due to the small section thickness after histological processing GCP nuclei could be seen in a single plane of focus. GCP were counted in single images, taken at the best plane of focus. The volume of the sampled regions was obtained by multiplying the traced areas times the nominal section thickness (8 µm). Density of GCP was obtained by dividing the number of counted cells by the volume of the sampled region. Total number of GCP in the oEGL and iEGL was estimated by multiplying the mean density of GCP in each layer times the volume of the layer. Total number of GCP was obtained by adding the number in the oEGL and iEGL.
Gene expression analysis
RNA purification
Cerebella from P2 Ts65Dn and control mice were homogenized in TRIzol (Invitrogen, Carlsbad, CA, USA) and total RNA was extracted according to the manufacturer instructions. RNA concentration was determined at 260 nm with a NanoDrop‐1000 spectrophotometer (NanoDrop Technologies, Wilmington, DE, USA). RNA purity was also determined spectrophotometrically by 260/280 nm and 260/230 nm absorbance ratios. RNA integrity was evaluated by denaturing agarose gel electrophoresis.
Microarray analysis
Total RNA was further purified with Total RNA isolation kit (SuperArray Bioscience Corporation, Frederick, MD, USA) according to the manufacturer instructions. Biotin‐labeled probes were synthesized with TrueLabeling‐AMP kit and purified with ArrayGrade cRNA Cleanup kit (SuperArray), according to the manufacturer instructions. Probes (3 µg each) from 3 control and 3 Ts65Dn mice were then hybridized to individual arrays (OMM‐020 “Mouse Cell Cycle oligo GEArrays”; SuperArray). After stringent washing of the arrays and chemiluminescent detection of the signals, spot intensity from digitized images was evaluated with GEArray Expression Analysis Suite (GEASuite) software (SuperArray). Mean intensity values from empty and PUC18 plasmid spots on the array were used for background subtraction. Background subtracted intensity values for each spot were then normalized to the signal of the internal control gene Glyceraldehyde‐3‐phosphate dehydrogenase (GAPDH). The normalized mean expression of each spotted gene was expressed as the ratio Ts65Dn/control.
Real‐time reverse transcriptase quantitative PCR (RT‐qPCR)
For reverse transcription 5 µg of total RNA (six control and six Ts65Dn mice) were first digested with 10 units of RNAse‐free DNAse (Promega, Madison, WI, USA) for 30 minutes at 37°C After DNAse inactivation, RNA was retro transcribed with an oligo(dT)16 primer (0.5 µM) and 200 units of Moloney murine leukemia virus (M‐MLV) reverse transcriptase (Invitrogen) according to the manufacturer instructions. Real‐time qPCR was performed in triplicate with 10 ng of template using SYBR Premix Ex Taq (Takara, Shiga, Japan) on an iCycler iQ real‐time PCR detection system (Bio‐Rad, Hercules, CA, USA). Real‐time qPCR was done under the following universal conditions: 3 min at 95°C, 40 cycles of denaturation for 30 s at 95°C, annealing for 15 s at 60°C and extension for 30 s at 72°C. Product specificity and absence of primer dimers were verified by melting curve analysis and agarose gel electrophoresis. Primer pair sequences and product melting temperature (Tm) are listed in Supplementary Materials (Table S2). Given the high sensibility of real‐time qPCR, the requirement for a robust method for normalization of data has arisen in the last years. To this purpose we used the multiple internal control gene approach (60), one of the most widely accepted methods for RT‐qPCR data normalization (25, 39). This method employs a set of multiple internal control genes that are ranked by pair‐wise comparison for their expression stability across the samples with the geNorm software [(60); freely available at: http://medgen.ugent.be/~jvdesomp/genorm/]. The most stably expressed control genes are then geometrically averaged to determine an accurate normalization factor for data analysis (60). To this purpose we tested eight internal control genes: GAPDH, β‐Actin (ACTB), Peptidylprolyl isomerase A (PPIA), Hypoxanthine guanine phosphoribosyl transferase 1 (HPRT1), 18S ribosomal RNA (18S‐rRNA), Beta‐2 microglobulin (B2M), Glucuronidase beta (GusB) and Ribosomal protein S27a (Rps27a). GAPDH and ACTB showed the most stable expression and were used to calculate the normalization factor. The other tested control genes showed variable expression stability (from the most to the less stable: HPRT1 > PPIA > 18S‐rRNA > B2M > GusB > Rps27a). Relative expression data are given as the ratio Ts65Dn/control normalized mean expression.
Western blot
P2 cerebella (six control and six Ts65Dn mice) were homogenized in ice‐cold lysis buffer (1% Triton‐X100, 150 mM NaCl, 1 mM EDTA and 20 mM Tris pH 7.4) supplemented with 1mM phenylmethanesulphonylfluoride (PMSF) and 1% proteases and phosphatases inhibitors cocktail (Sigma). Samples were then incubated in ice for 10 minutes and clarified by centrifugation at 10 000 × g for 10 minutes at 4°C Protein concentration was determined by the Lowry method (35). Equivalent amounts (30 µg) of protein were subjected to electrophoresis on an SDS‐polyacrylamide gel (32). The gel was then blotted (59) onto a nitrocellulose membrane (Amersham Biosciences), and equal loading of protein in each lane was assessed by brief staining of the blot with 0.1% Ponceau S. Membranes were blocked for 1 h in 5% milk, 0.1% Tween‐20 in Tris‐buffered saline (150 mM NaCl, 10 mM Tris‐HCl, pH 8.0) and incubated overnight at 4°C with primary antibodies: anti‐Cyclin B1 mouse monoclonal (Cell Signaling Technologies, Beverly, MA, USA; dilution 1:2000), anti‐App mouse monoclonal (Chemicon; dilution 1:2000), anti‐Skp2 rabbit polyclonal (Santa Cruz Biotechnology, Santa Cruz, CA, USA; dilution 1:1000) and anti‐β‐Actin rabbit polyclonal (Sigma; dilution 1:10,000). Membranes were washed, incubated with HRP‐conjugated anti‐rabbit or anti‐mouse secondary antibodies (1:1000 dilution; Amersham Biosciences) and specific reactions revealed with the enhanced chemiluminescent (ECL) Western blotting detection reagent (Amersham Biosciences). Densitometry analysis on digitized images was performed with Scion Image software (Scion Corporation, Frederick, MD, USA) and intensity for each band was normalized to the intensity of the corresponding β‐Actin band. Results are expressed as the ratio Ts65Dn/control normalized mean expression.
Statistical analysis
Results are presented as the mean ± SEM. The subject means were statistically analyzed with two‐tailed Student's t‐test. A probability level of P < 0.05 was considered to be statistically significant.
RESULTS
Proliferation, death and fate of GCP in the Ts65Dn mouse cerebellum
In mice cerebellum, the production of granule neurons lasts from birth to the second postnatal week, with a peak during the first postnatal week (2). Newborn cells derive from GCP located in the EGL. The EGL can be subdivided into two morphologically distinct zones (Figure 1), the oEGL, which consists of proliferating cells, and the iEGL, which mainly contains premigratory post‐mitotic cells (30, 36). The cells that are born in the EGL leave this layer to reach the future IGL. In euploid P2 mice, the EGL was composed of four to five rows of cells. In contrast, the EGL of Ts65Dn mice was composed of three to four rows of cells only (Figure 1C,D). Stereological evaluation of the cerebellum of P2 animals showed that, the volume of the EGL and total number of GCP in the EGL were smaller compared to euploid mice (Table 1).
It was previously shown that in neonate (P0) mice, proliferation of granule cell precursors, assessed by evaluating the number of mitotic figures in the EGL, was smaller in Ts65Dn compared to control mice (48). In the current study we evaluated cell proliferation in P2 animals by using BrdU immunohistochemistry. Two hours after BrdU injection, most of the BrdU‐positive cells were located in the oEGL and only scattered BrdU‐positive cells were present in the iEGL (Figure 2E,F). Estimate of total number of BrdU‐positive cells in the EGL (oEGL + iEGL) showed that Ts65Dn mice had less (−55%) BrdU‐positive cells than control mice (Figure 2G). As Ts65Dn mice had less GCP than control mice, we expressed the number of BrdU‐positive cells as percentage of total number of GCP (labeling index, LI). Results showed that in the EGL of control mice BrdU‐positive cells represented 35% of total number of GCP, whereas in Ts65Dn mice they were only 22% (Figure 2H). Evaluation of the LI separately in the oEGL and iEGL showed that in the oEGL of control mice BrdU‐positive cells represented 57% of total number of GCP, whereas in Ts65Dn mice they were only 44% (Figure 2H). In the iEGL, BrdU‐positive cells were 12.5% of total number of GCP, in control mice, and in Ts65Dn mice BrdU positive cells were practically absent (1.4%) (Figure 2H).
Apoptotic cell death is an important phenomenon that, during brain development, contributes to regulate the final number of neurons (28). As there is evidence for increased apoptosis during development of the DS brain (20), we counted the number of apoptotic cells in the cerebellum of P2 mice. Apoptotic cells were recognized based on the pyknotic appearance of their nucleus. At this stage of development, there were very few pyknotic cells in both control and Ts65Dn mice. Estimate of total number of apoptotic cells in the EGL showed that while control mice had approximately 320 apoptotic cells per cerebellum, Ts65Dn mice had five times more apoptotic cells than controls (Table 1). Evaluation of the ratio between the number of pyknotic cells and the number of GCP (pyknotic index) in the EGL gave a value of 0.015 ± 0.002% in control mice and 0.13 ± 0.018% in Ts65Dn mice (P < 0.001, Student's two tailed t‐test).
We examined the fate of GCP in mice injected with BrdU on P2 and sacrificed 28 days later (on P30). As GCP stop proliferating by P15, the EGL is no longer recognizable in the cerebellum of P30 animals. In P30 mice, we found BrdU‐positive cells in the IGL and in the molecular layer (Figure 3D–G). The BrdU‐positive cells in IGL derive from GCP that migrated from the EGL to the IGL, their final destination (2), whereas cells in the molecular layer very likely derive from the white matter of the cerebellar cortex (66). Comparison of the number of BrdU‐positive cells in the IGL of Ts65Dn and control P30 animals showed that Ts65Dn mice had significantly less (−40%) labeled cells than controls (Figure 3A). By examining the phenotype of these cells by double‐labeling with BrdU and either NeuN, a marker of mature neurons, or GFAP, a marker of astrocytes, we found that most of the BrdU‐labeled cells in the IGL of both control and Ts65Dn mice had neuronal phenotype and very few cells had astrocytic phenotype (Figure 3B,F,G) or were of undetermined phenotype (Figure 3B). Since GCP give origin solely to cells with neuronal phenotype (cerebellar granule cells) (65, 66), the few BrdU‐positive cells with astrocytic phenotype found in IGL are likely to derive from precursors located in the IGL itself or in the underneath white matter (16). The presence of BrdU‐positive cells in the IGL 2 h after a BrdU injection (see Figure 2C,D) is consistent with the possibility that these cells (and their progeny) represent the cells co‐labeled with BrdU and GFAP found at P30 in the IGL. Alternatively, the cells co‐labeled with BrdU and GFAP in the IGL may be cells born in the white matter of the cerebellar cortex (65) and migrated to this layer.
Figure 3.
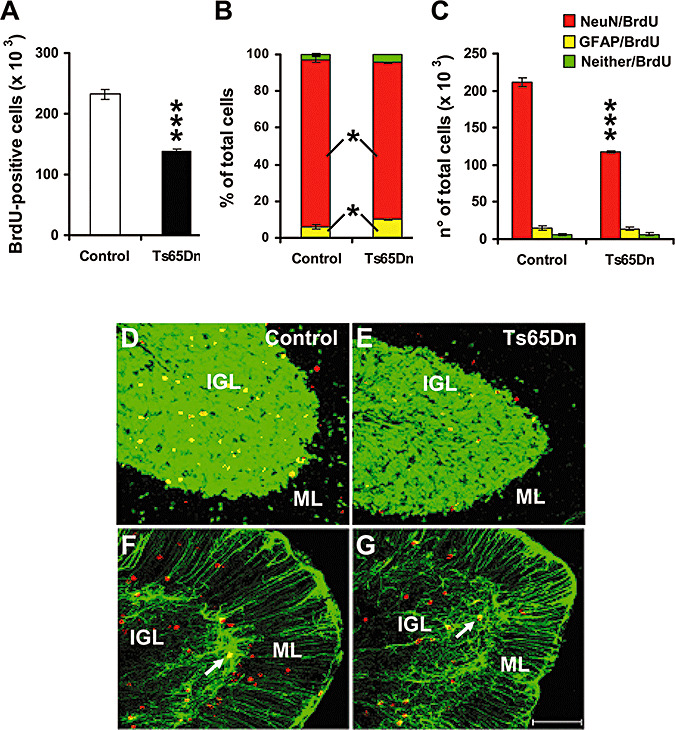
Fate of proliferating cells in the cerebellum of Ts65Dn mice. A: Total number of BrdU‐positive cells in IGL of the cerebellum of control (n = 5) and Ts65Dn (n = 5) mice that had received on P2 one BrdU injection and were sacrificed after 28 days. B, C: Percentage (B) and absolute number (C) of surviving cells with neuronal phenotype (NeuN/BrdU), astrocytic phenotype (GFAP/BrdU) and undetermined phenotype (Neither/BrdU) in the IGL in the same animals as in (A). Values are means ± SEM. D, E, F, G: Confocal microscopy images of sagittal sections across the cerebellum, showing BrdU‐ (red), NeuN‐ (green), and BrdU+NeuN‐ (yellow) labeled cells in a control (D) and a Ts65Dn (E) mouse and BrdU‐ (red), GFAP‐ (green) and BrdU+GFAP‐ (yellow, arrows) labeled cells in a control (F) and a Ts65Dn (G) mouse. These animals received one BrdU injection on P2 and were sacrificed after 28 days. The scale bar (75 µm) applies to all the figures. Abbreviations: IGL, internal granular layer; ML, molecular layer. *P < 0.05; ***P < 0.001 (Student's two tailed t‐test).
Comparison of control and Ts65Dn mice showed that the percentage of cells that were co‐labeled with BrdU and NeuN was significantly smaller in Ts65Dn mice compared to controls (Figure 3B). By contrast, the percentage of BrdU‐positive cells that were co‐labeled with GFAP was larger in Ts65Dn mice, that had about twice more GFAP‐positive cells than controls (Figure 3B,F,G). From the total number of surviving cells and the percent distribution of phenotypes we calculated the absolute number of surviving cells of each phenotype (Figure 3C). We found that in Ts65Dn mice the number of new granule neurons that were added to the IGL was smaller (about one half) compared to controls (Figure 3C). In contrast, the absolute number of GFAP‐positive cells present in IGL of Ts65Dn mice was similar to that of controls. These findings clearly indicate that in the developing cerebellum of Ts65Dn mice the formation of new granule neurons is impaired compared to controls, while astrocyte proliferation does not appear to be affected.
Evaluation of cell cycle in Ts65Dn mice
The findings reported above indicated that in the cerebellum of P2 Ts65Dn mice the proliferation of GCP was impaired compared to normogenic ones. As a second step, we examined the dynamics of the cell cycle of GCP, to establish whether elongation of the cell cycle may underlie the reduced proliferation rate in Ts65Dn mice.
The total duration of the cell cycle (Tc) and the duration of the S phase (Ts) can be estimated by BrdU‐cumulative LI (31). According to this protocol, successive cohorts of cells entering the S phase are labeled with BrdU at consecutive time intervals (typically, each 2 h). Maximum LI corresponds to the growth fraction (GF; 100% for GCP located in the oEGL) and the time at which the LI reaches a maximum corresponds to Tc–Ts (15). P2 mice received 1, 2 or 3 BrdU injections spaced 2 h and were sacrificed 2 h after the last injection. We found that in control mice the length of the cell cycle of the GCP was 16.25 h (Figure 4, Table 2), a value of the same magnitude as that reported by other studies (36). In contrast, in Ts65Dn mice the cell cycle length was 23.51 h, which corresponds to a difference of +45% (Figure 4, Table 2). Evaluation of the length of S phase showed no significant differences between control and Ts65Dn mice (Table 2). Consequently, elongation of total cell cycle should be due to elongation of one or more of the remaining phases (G1, G2, M).
Table 2.
Cell cycle kinetics of P2 control and Ts65Dn mice.
| TC | TG1 | TS | TG2 | TM | |
|---|---|---|---|---|---|
| Control | 16.25 ± 1.28 | 7.63 ± 1.45 | 7.11 ± 0.66 | 1.18 ± 0.12 | 0.33 ± 0.04 |
| Ts65Dn | 23.51 ± 0.76*** | 12.37 ± 0.83* | 8.28 ± 0.30 | 2.42 ± 0.12*** | 0.44 ± 0.04 |
Duration (hours) of the cell cycle (Tc), G1 phase (TG1), S phase (Ts), G2 phase (TG2) and M phase (TM):of granule cell precursors in control (n = 13) and Ts65Dn (n = 13) P2 mice. The numbers are mean ± SEM. *P < 0.05; ***P < 0.001 (Student's two tailed t‐test).
By using an antibody against phosphorylated‐(Ser10)‐histone‐H3 (pHH3), it is possible to discriminate cells in the G2 or M phases of the cell cycle, based on the nuclear pattern of the marker (Figure 5A; see Methods) (23). We found that Ts65Dn mice had a significantly larger percentage of cells in G2 (10% of total GCP) compared to controls (7% of total GCP) (Figure 5B–D). On the other hand, no difference was observed for the percentage of cells in the M phase (Figure 5B–D). Evaluation of the length of the G2 and M phases, based on the LI of cells in G2 and M phases (see Methods), indicated that there was a notable elongation (+100%) of the G2 phase in Ts65Dn mice (TG2 = 2.42 h) with respect to controls (TG2 = 1.18 h), while the length of the M phase was unchanged (Table 2). As there are no specific markers for the G1 phase of the cell cycle, its length was estimated by subtracting from the total length of the cell cycle the length of S + G2 + M phases. We found that in Ts65Dn mice the duration of the G1 phase was significantly larger (+62%) than controls (Table 2).
We sought to obtain further evidence for elongation of the G2 phase in Ts65Dn mice with two other approaches. It is possible to estimate the length of the G2 + 1/2M phases of the cell cycle based of the first appearance of BrdU‐positive cell that exhibit mitotic figures after a single BrdU injection (22). The time of appearance of BrdU‐mitotic figures indicates that the cells that had incorporated BrdU during the S phase have accomplished their G2 and early M phase and, consequently, this time provides an estimate of the length of the G2 + 1/2M phases. We found that in Ts65Dn mice no BrdU‐mitotic figures were present 2 h after a single BrdU injection (Figure 6B), while in control mice more than 60% of the mitotic figures were BrdU‐positive (Figure 6A). These findings indicate that the length of the G2 + 1/2M phases in Ts65Dn mice was longer than 2 h while in control mice it was shorter, which is in line with the length of the G2 and M phases estimated with pHH3 immunohistochemistry. To obtain further evidence, we performed double immunohistochemistry for BrdU and pHH3 in animals injected with BrdU and sacrificed 2 h later. The presence of cells double‐labeled with BrdU and condensed pHH3 (which marks the early M‐phase) indicates that these cells have accomplished the G2 phase. We found that in control mice all the pHH3‐positive cells that were in G2 or M‐phase (Figure 6C) were also BrdU‐positive, while in Ts65Dn mice only a few BrdU‐positive cells were in G2 and none of the BrdU‐positive cell was in M‐phase (Figure 6D). This again confirms that the G2 phase was shorter than 2 h in control mice, but lasted more than 2 h in Ts65Dn mice.
Figure 6.
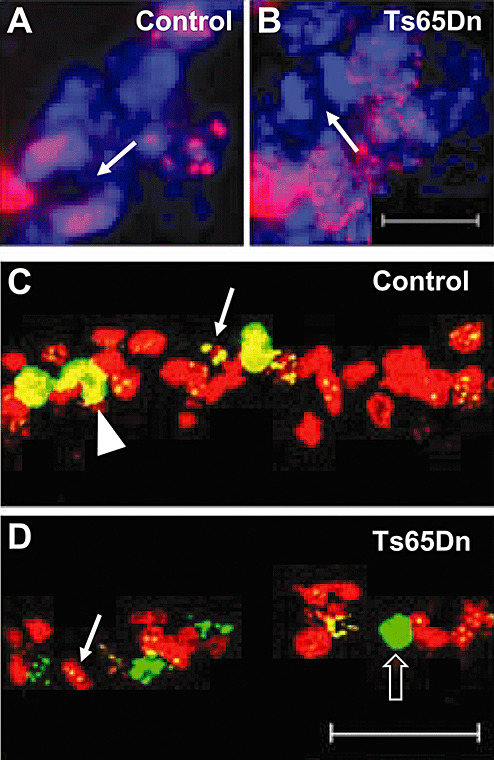
Estimate of G2 phase duration in Ts65Dn mice. A: Fluorescent images of GCP labeled with BrdU (red) and Hoechst nuclear staining (blue) in a P2 control (A) and a P2 Ts65Dn (B) mouse. Animals were injected with BrdU and sacrificed after 2 h. The arrows in (A) and (B) indicate a mitotic figure. Note that the mitotic figure in the Ts65Dn mouse is not labeled with BrdU. The scale bar (10 µm) in (B) applies to (A) and (B). C, D: Confocal images of GCP labeled with BrdU (red) and pHH3 (green) in a P2 control (C) and a P2 Ts65Dn (D) mouse. Animals were injected with BrdU and sacrificed 2 h later. Cells double‐labeled with BrdU and pHH3 have yellow nuclei, with either punctate or condensed pattern: cells with punctate pHH3 (arrows) are cells in G2 phase and cells with condensed pHH3 (arrowheads) are cells in early M phase. The empty arrowhead in (D) indicates a cell in M phase that is not labeled with BrdU. The scale bar (75 µm) in (D) applies to (C) and (D).
Analysis of genes involved in the cell cycle
The observed elongation of the G2 and G1 phases in Ts65Dn mice suggests an alteration in the molecular mechanisms that regulate cell cycle progression. As a next step, we performed a gene expression study with microarrays carrying genes that regulate the cell cycle (see Methods), to establish whether and which of these genes exhibited an altered expression in Ts65Dn mice. A complete list of the arrayed genes and their relative levels of expression is provided in Supplementary Table S1. Complete microarray data have also been submitted to Gene Expression Omnibus database (http://www.ncbi.nlm.nih.gov/geo/) under accession number GSE9216. We found that, among the 112 genes present on the cell cycle microarray, 81 genes (72.3%) were expressed to some extent in the cerebellum of P2 mice. Overall no significant differences were observed in the expression of this set of expressed genes between control and Ts65Dn cerebella, except for two genes, Cyclin B1 and Skp2, which showed a significant down‐regulation (−15% and −30%, respectively) in Ts65Dn samples (Table 3).
Table 3.
Expression of genes regulating the cell cycle in the cerebellum of P2 Ts65Dn mice.
| Symbol | Description | Accession number | Fold expression (Ts65Dn/Control) | |
|---|---|---|---|---|
| Array | RT‐qPCR | |||
| CcnB1 | Cyclin B1 | NM_172301 | 0.852 ± 0.054* | 0.780 ± 0.083* |
| Skp2 | S‐phase kinase‐associated protein 2 (p45) | NM_013787 | 0.691 ± 0.131* | 0.725 ± 0.125* |
| Cdkn1a | Cyclin‐dependent kinase inhibitor 1A (p21Cip1) | NM_007669 | 1.026 ± 0.099 | 0.997 ± 0.171 |
| Cdkn1b | Cyclin‐dependent kinase inhibitor 1B (p27Kip1) | NM_009875 | 0.820 ± 0.582 | 0.923 ± 0.208 |
| CcnA2 | Cyclin A2 | NM_009828 | 0.922 ± 0.172 | 0.945 ± 0.219 |
| CcnD1 | Cyclin D1 | NM_007631 | 1.193 ± 0.381 | 0.934 ± 0.120 |
| CcnD2 | Cyclin D2 | NM_009829 | 1.040 ± 0.172 | 0.947 ± 0.148 |
| App | Amyloid precursor protein | NM_007471 | N/A | 1.512 ± 0.254* |
Numbers are normalized fold expression of Ts65Dn versus control mice. App, which is one of the triplicated genes in Ts65Dn mice, has been used as control gene. The numbers are mean ± SEM. For array analysis: n = 3 control and 3 Ts65Dn mice. For RTqPCR analysis: n = 6 control and 6 Ts65Dn mice. *P < 0.05 (Student's two tailed t‐test).
To confirm the results obtained by using the cell cycle microarray, we quantified the RNA of Cyclin B1 and Skp2 by quantitative RT‐PCR. We also quantified the RNAs of some cyclins and cyclin‐dependent kinase inhibitors (see Table 3), the expression of which resulted unchanged in the microarray analysis. Confirming the results obtained with microarrays, RT‐qPCR showed that both Cyclin B1 and Skp2 had a significantly lower expression in Ts65Dn mice, whereas the other investigated genes had a similar expression in Ts65Dn and control mice (Table 3). Quantification of the RNA of App, a trisomic gene, showed that, as expected, its expression was approximately 1.5 higher in Ts65Dn mice compared to controls.
We performed Western blot analysis, to check whether Cyclin B1 and Skp2 had a lower expression in Ts65Dn mice also at the protein level. Results showed that both Cyclin B1 and Skp2 had a lower expression (−35% and −41%, respectively) in Ts65Dn mice (Figure 7A,B). In contrast, App showed a significantly increased expression (+46%) in Ts65Dn cerebella, very close to the theoretical 1.5 fold increase expected from the presence of one extra copy of the gene (Figure 7A,B).
Figure 7.
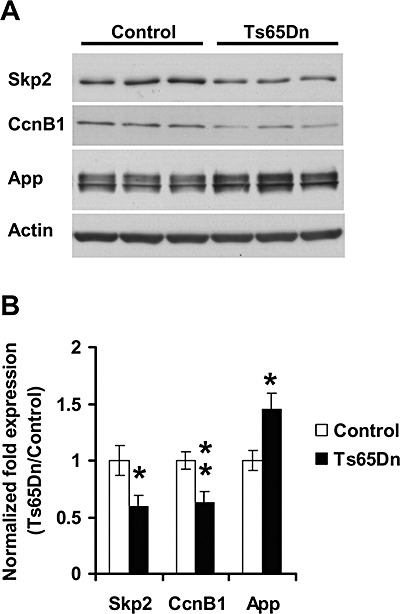
Expression of Cyclin B1 and Skp2 in Ts65Dn mice. Evaluation of the expression of Cyclin B1 (CcnB1) and Skp2 by western blot analysis in the cerebellum of P2 control (n = 6) and Ts65Dn (n = 6) mice. A: Examples of western blots of control (left) and Ts65Dn (right) mice. B: Quantification of the expression of Cyclin B1 and Skp2 normalized to actin levels. Note that Ts65Dn mice have a lower expression of Cyclin B1 and Skp2 with respect to controls. In contrast, Ts65Dn mice have a 1.5 fold higher expression of the triplicated gene App. Values are means ± SEM. *P < 0.05; **P < 0.01 (Student's two tailed t‐test).
DISCUSSION
The present study provides novel evidence for cell cycle elongation in the developing cerebellum of Ts65Dn mice and suggests that this derangement may be a key factor underlying reduced granule cell formation.
A slow proliferation rate is the major determinant of reduced granule cell formation in Ts65Dn mice
Previous observations in the cerebellum of P0 mice, (48) showed that Ts65Dn mice had a reduced number of mitotic cells in the EGL compared to euploid mice. On the day of birth, however, the trisomic cerebellum had the same size and a similar number of GCP as that of euploid mice (48). We found here that in the EGL of P2 Ts65Dn mice the rate of GCP proliferation, assessed based on BrdU incorporation, was notably reduced, which is in line with the reduced number of mitoses observed in P0 mice (48). Our data, however, showed that on P2 Ts65Dn mice had significantly less (−45%) GCP than Ts65Dn mice. Evaluation of the cell cycle of GCP in P2 animals showed that in trisomic mice it was notably elongated compared to euploid mice. These findings strongly suggest that the prolonged cell cycle of GCP underlies the reduced proliferation rate found in P2 Ts65Dn mice. The reduced number of mitotic cells found in P0 Ts65Dn mice (48) cannot be ascribed to the smaller size of their population of GCP, since at P0 euploid and trisomic mice had a similar number of GCP. The ensemble of these observations suggests that the alteration of the cell cycle observed by us in trisomic mice at P2 should have started at earlier developmental stages (very likely at P0), thus leading to a reduction in the number of GCP by P2. The disparity between Ts65Dn and euploid mice in the number of GCP appears to be retained at older ages, as demonstrated by the fact that at P6 trisomic mice have significantly less (−30%) GCP than trisomic mice (48).
In all neurogenic regions, precursors may divide several times, though many of the newborn cells are committed to death. The final number of new neurons depends on the number of times precursors can divide, their proliferation rate and rate of cell death. As during brain development the length of the cell cycle changes with time (31), it is theoretically possible that at some postnatal stage a reduction in the cell cycle length improves GCP proliferation in Ts65Dn mice. We counted the number of BrdU‐positive cells in animals injected at P2 and sacrificed at P30. We found that, as expected, P30 animals of either group had less BrdU‐positive cells but that Ts65Dn mice still had less BrdU‐positive cells than controls. These data may suggest that in the period intervening between P2 and P30 a compensatory increase in proliferation rate had not occurred in Ts65Dn mice and that the defect in cell cycle progression had been retained across this period.
Roper et al (48) found very few apoptotic cells, evaluated with the terminal uridine deoxynucleotidyl transferase dUTP nick end labeling (TUNEL) method, in the cerebellum of P6 Ts65Dn mice with respect to controls. In our study we evaluated apoptotic cell death based on the pyknotic appearance of their nuclei. Though the absolute number of apoptotic cells was very small both in control and Ts65Dn mice, we found that Ts65Dn mice had more apoptotic cells than controls. This is in agreement with evidence for increased apoptosis during embryogenesis in the developing cortex of the Ts16 mouse model for DS (20). The small number of apoptotic cells found by Roper et al (48) could be due to the to the fact that they evaluated apoptosis with the TUNEL method. TUNEL‐positive cells have a faster clearance (2 h) (58, 64) than pyknotic cells (6.5 h) (30). This may account for the small number of apoptotic cells found by Roper et al (48) in comparison with that found by us. Our finding that in Ts65Dn mice there was a higher incidence of apoptotic cell death suggests that this may be an additional factor that contributes to further reduce final granule cell number. This contribution, however, should be relatively small, considering that apoptotic cells represented a very small fraction (less than 0.5%) compared to total number of GCP.
Cell cycle elongation due to G2/M and G1/S regulatory failure in Ts65Dn mice
Current finding show that cerebellar CGP exhibit an abnormal length of the cell cycle in the neonate Ts65Dn mouse. We previously found that precursors in the hippocampal dentate gyrus and ventricular germinal matrix of human fetuses with DS exhibit alterations in cell cycle dynamics, with elongation of the G2 phase (9). Recent evidence in the embryonic brain (6) shows that precursors in the ventricular zone and hippocampus have a longer cell cycle in Ts65Dn compared to control mice. The ensemble of all these data suggest that cell cycle elongation may be a widespread feature of the trisomic condition that leads to abnormal brain development.
While in the precursors of the ventricular zone and hippocampus of Ts65Dn fetuses elongation of the cell cycle appears to be due to elongation of the S phase, current study shows that in Ts65Dn mice the slower cell cycle of cerebellar GCP was due to elongation of the G2 and G1 phases. The phase most affected was the G2, which in Ts65Dn mice was more than twice longer than that of controls. The highly ordered progression of the cell cycle is achieved by a series of elaborate mechanisms that control the periodic expression of many regulatory proteins. At each checkpoint different groups of cyclin/cyclin dependent kinase (Cdk) complexes and Cdk inhibitors (CdkIs) ensure that the cell responds adequately to the extra‐ and intra‐cellular factors, which support either cell division or differentiation. Screening of genes that regulate the cell cycle by microarray analysis showed that among 112 genes only two, Cyclin B1 and Skp2, were significantly affected (down regulated) by the trisomic condition. Recent studies (10, 43) analyzed a number of genes, including cell cycle regulatory genes, in the cerebellum of another model of DS, the Ts1Cje mouse. Consistent with our data, no differences were found between neonatal Ts1Cje and euploid mice in the expression of the same cell cycle regulatory genes analyzed by us, with the exception of Cyclin B1, that, unlike in Ts65Dn mice is not down regulated in the Ts1Cje mouse. This discrepancy may be due to the strain, as Ts1Cje mice are trisomic for less genes than Ts65Dn mice and exhibit a different phenotype, with relatively mild cerebellar abnormalities. As in the study by Dauphinot et al (10) the levels of Skp2 were undetectable, it is not possible to compare our results in the Ts65Dn mouse with those in the Ts1Cje mouse.
Both Cyclin B1 and Skp2 favor the transition from the G2 to M phase of cell cycle. Thus, their down‐regulation in Ts65Dn mice is consistent with our observations, based on pHH3 immunohistochemistry, that Ts65Dn mice had a disproportionate number of dividing cells in the G2 phase and a prolonged G2 phase. Cyclin B1 is the regulatory subunit of Cdk1, the key controller of mitosis entry (56), hence, down regulation of Cyclin B1 is expected to induce a lengthening of the G2 phase. In addition, the cytoplasmic/nucelar subcellular localization of Cyclin B1 has been shown to be regulated by the Sonic hedgehog (Shh) pathway, which allows Cyclin B1 to localize to the nucleus. As this pathway appears to be disrupted in Ts65Dn mice (48), the transfer of Cyclin B1 to the nucleus may be compromised and this would worsen the consequences of the reduced expression of Cyclin B1 in trisomic mice. Skp2 favours G1/S and G2/M transition by promoting the degradation of the cyclin‐dependent kinase inhibitor p27Kip1 (38). It has been shown that Skp2 deficient cells demonstrate a reduced capacity to accomplish mitosis as a result of p27Kip1 accumulation and consequent Cdk inhibition (38). The concentration of p27Kip1 is relatively high in quiescent (G0) cells and decreases on entry into the cell cycle, due to an increased rate of p27Kip1 degradation (41, 54). Mice lacking p27Kip1 are viable but are bigger than wild‐type littermates, with increased cellularity of all tissues (27). The degradation of p27Kip1 appears to require Skp2 (37, 38), as it is impaired in Skp2‐/‐ mice. This suggests that the primary function of Skp2 is to prevent the accumulation of p27Kip1 and, thus, the inhibition exerted by p27Kip1 on cyclin‐Cdk complexes. Skp2 promotes the degradation also of Cyclin E and Skp2‐/‐ animals exhibit increased accumulation of both p27Kip1 and of Cyclin E (37). This accumulation, however, does not increase Cdk2 activity, possibly due to the abundance of p27Kip1, a potent inhibitor of Cdk2 activity (37). While the role of Cyclin E in dysregulation of cell proliferation in Ts65Dn mice remains to be established, it seems likely that dysregulation of the Skp2/p27Kip1 system is a major mechanism that underlies the observed elongation of the G1 and G2 phases of the cell cycle in Ts65Dn mice (Figure 8). The detailed molecular pathways through which Skp2 is down regulated in DS need further investigations.
Figure 8.
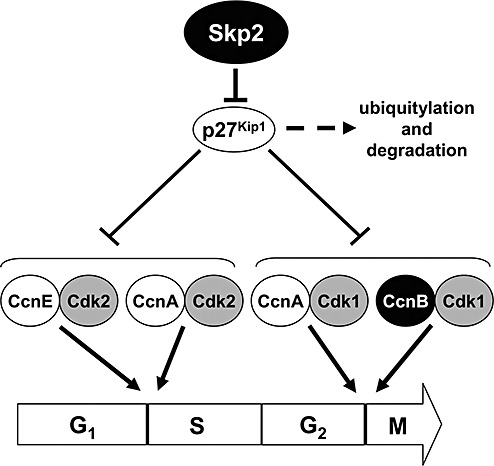
Putative pathway underlying cell cycle elongation in the Ts65Dn mouse. Scheme of complexes cyclins/cyclin dependent kinases that regulate critical steps of the cell cycle. Skp2 may regulate both G1/S and G2/M transition by promoting p27Kip1 degradation by ubiquitylation. The complex CcnB/Cdk1 specifically regulates the G2/M transition. Skp2 and the CcnB (black circles) are down‐ regulated in Ts65Dm mice. Accordingly, an elongation of G1 and G2 is expected. Abbreviations: Ccn, cyclin; Cdk, cyclin dependent kinase.
CONCLUSION
The main cause of behavioral impairment in DS has been attributed to the reduced number of neurons forming the DS brain. Recent data suggested that the reduced number of neurons in patients with DS was due to reduced cell proliferation during early phases of fetal development (9, 17) but the pathogenic mechanisms of the reduced neurogenesis in DS were scarcely understood so far. The current study provides evidence that in the trisomic cerebellum there is an elongation of the cell cycle of GCP and that this dysregulation underlies reduced neuron formation. The current study additionally provides for the first time evidence about the molecular mechanisms involved in cell cycle dysregulation, showing that changes of the cell cycle of the GCP are linked to a reduced expression of two genes, Skp2 and Cyclin B1. Studies targeted at these genes will shed light on possible means to improve the neurogenesis impairment linked to the trisomic condition.
Supporting information
Table S1. Summary table listing the genes present on the array (OMM‐020 “Mouse Cell Cycle oligo GEArrays”; SuperArray), the mean Ts65Dn/euploid ratio and statistical significance (Student's two tailed t‐test).
Table S2. Table listing the sequence of the primers and references of the genes that were used for quantitative RT‐PCR experiments.
This material is available as part of the online article from: http://www.blackwellsynergy.com
Please note: Blackwell Publishing is not responsible for the content or functionality of any supplementary materials supplied by the authors. Any queries (other than missing material) should be directed to the corresponding author for the article.
Supporting info item
Supporting info item
ACKNOWLEDGEMENTS
This work was supported by the research project 1/397 granted by the Fondation Jerome Lejeune to E. Ciani and by the CARISBO foundation to R. Bartesaghi.
REFERENCES
- 1. Akeson EC, Lambert JP, Narayanswami S, Gardiner K, Bechtel LJ, Davisson MT (2001) Ts65dn—localization of the translocation breakpoint and trisomic gene content in a mouse model for Down syndrome. Cytogenet Cell Genet 93:270–276. [DOI] [PubMed] [Google Scholar]
- 2. Altman J (1982) Morphological development of the rat cerebellum and some of its mechanisms. Exp Brain Res 6(Suppl.):8–49. [Google Scholar]
- 3. Aylward EH, Habbak R, Warren AC, Pulsifer MB, Barta PE, Jerram M, Pearlson GD (1997) Cerebellar volume in adults with Down syndrome. Arch Neurol 54:209–212. [DOI] [PubMed] [Google Scholar]
- 4. Aylward EH, Li Q, Honeycutt NA, Warren AC, Pulsifer MB, Barta PE et al (1999) MRI volumes of the hippocampus and amygdala in adults with Down's syndrome with and without dementia. Am J Psychiatry 156:564–568. [DOI] [PubMed] [Google Scholar]
- 5. Baxter LL, Moran TH, Richtsmeier JT, Troncoso J, Reeves RH (2000) Discovery and genetic localization of Down syndrome cerebellar phenotypes using the Ts65Dn mouse. Hum Mol Genet 9:195–202. [DOI] [PubMed] [Google Scholar]
- 6. Chakrabarti L, Galdzicki Z, Haydar TF (2007) Defects in embryonic neurogenesis and initial synapse formation in the forebrain of the Ts65Dn mouse model of Down syndrome. J Neurosci 27:11483–11495. [DOI] [PMC free article] [PubMed] [Google Scholar]
- 7. Clark S, Schwalbe J, Stasko MR, Yarowsky PJ, Costa AC (2006) Fluoxetine rescues deficient neurogenesis in hippocampus of the Ts65Dn mouse model for Down syndrome. Exp Neurol 200:256–261. [DOI] [PubMed] [Google Scholar]
- 8. Contestabile A, Fila T, Bartesaghi R, Ciani E (2006) Choline acetyltransferase activity at different ages in brain of Ts65Dn mice, an animal model for Down's syndrome and related neurodegenerative diseases. J Neurochem 97:515–526. [DOI] [PubMed] [Google Scholar]
- 9. Contestabile A, Fila T, Ceccarelli C, Bonasoni P, Bonapace L, Santini D et al (2007) Cell cycle alteration and decreased cell proliferation in the hippocampal dentate gyrus and in the neocortical germinal matrix of fetuses with Down syndrome and in Ts65Dn mice. Hippocampus 17:665–678. [DOI] [PubMed] [Google Scholar]
- 10. Dauphinot L, Lyle R, Rivals I, Dang MT, Moldrich RX, Golfier G et al (2005) The cerebellar transcriptome during postnatal development of the Ts1Cje mouse, a segmental trisomy model for Down syndrome. Hum Mol Genet 14:373–384. [DOI] [PubMed] [Google Scholar]
- 11. Davisson MT, Schmidt C, Akeson EC (1990) Segmental trisomy of murine chromosome 16: a new model system for studying Down syndrome. Prog Clin Biol Res 360:263–280. [PubMed] [Google Scholar]
- 12. De La Monte SM, Hedley‐Whyte ET (1990) Small cerebral hemispheres in adults with Down's syndrome: contributions of developmental arrest and lesions of Alzheimer's disease. J Neuropathol Exp Neurol 49:509–520. [DOI] [PubMed] [Google Scholar]
- 13. Demas GE, Nelson RJ, Krueger BK, Yarowsky PJ (1996) Spatial memory deficits in segmental trisomic Ts65Dn mice. Behav Brain Res 82:85–92. [DOI] [PubMed] [Google Scholar]
- 14. Escorihuela RM, Fernandez‐Teruel A, Vallina IF, Baamonde C, Lumbreras MA, Dierssen M et al (1995) A behavioral assessment of Ts65Dn mice: A putative down syndrome model. Neurosci Lett 199:143–146. [DOI] [PubMed] [Google Scholar]
- 15. Fujita S (1967) Quantitative analysis of cell proliferation and differentiation in the cortex of the postnatal mouse cerebellum. J Cell Biol 32:277–287. [DOI] [PMC free article] [PubMed] [Google Scholar]
- 16. Goldowitz D, Hamre K (1998) The cells and molecules that make a cerebellum. Trends Neurosci 21:375–382. [DOI] [PubMed] [Google Scholar]
- 17. Guidi S, Bonasoni P, Caccarelli C, Santini D, Gualtieri F, Ciani E, Bartesaghi R (2008) Neurogenesis impairment and increased cell death reduce total neuron number in the hippocampal region of fetuses with Down syndrome. Brain Phatol 18:180–197. [DOI] [PMC free article] [PubMed] [Google Scholar]
- 18. Gundersen HJ, Jensen EB (1987) The efficiency of systematic sampling in stereology and its prediction. J Microsc 147:229–263. [DOI] [PubMed] [Google Scholar]
- 19. Hampton TG, Stasko MR, Kale A, Amende I, Costa AC (2004) Gait dynamics in trisomic mice: Quantitative neurological traits of Down syndrome. Physiol Behav 82:381–389. [DOI] [PubMed] [Google Scholar]
- 20. Haydar TF, Nowakowski RS, Yarowsky PJ, Krueger BK (2000) Role of founder cell deficit and delayed neuronogenesis in microencephaly of the trisomy 16 mouse. J Neurosci 20:4156–4164. [DOI] [PMC free article] [PubMed] [Google Scholar]
- 21. Hayes A, Batshaw ML (1993) Down syndrome. Pediatr Clin North Am 40:523–535. [DOI] [PubMed] [Google Scholar]
- 22. Hayes NL, Nowakowski RS (2002) Dynamics of cell proliferation in the adult dentate gyrus of two inbred strains of mice. Brain Res Dev Brain Res 134:77–85. [DOI] [PubMed] [Google Scholar]
- 23. Hendzel MJ, Wei Y, Mancini MA, Van Hooser A, Ranalli T, Brinkley BR et al (1997) Mitosis‐specific phosphorylation of histone H3 initiates primarily within pericentromeric heterochromatin during G2 and spreads in an ordered fashion coincident with mitotic chromosome condensation. Chromosoma 106:348–360. [DOI] [PubMed] [Google Scholar]
- 24. Holtzman DM, Santucci D, Kilbridge J, Chua‐Couzens J, Fontana DJ, Daniels SE et al (1996) Developmental abnormalities and age‐related neurodegeneration in a mouse model of Down syndrome. Proc Natl Acad Sci USA 93:13333–13338. [DOI] [PMC free article] [PubMed] [Google Scholar]
- 25. Huggett J, Dheda K, Bustin S, Zumla A (2005) Real‐time RT‐PCR normalisation; strategies and considerations. Genes Immun 6:279–284. [DOI] [PubMed] [Google Scholar]
- 26. Insausti AM, Megias M, Crespo D, Cruz‐Orive LM, Dierssen M, Vallina IF et al (1998) Hippocampal volume and neuronal number in Ts65Dn mice: A murine model of Down syndrome. Neurosci Lett 253:175–178. [DOI] [PubMed] [Google Scholar]
- 27. Ishizaki Y (2006) Control of proliferation and differentiation of neural precursor cells: Focusing on the developing cerebellum. J Pharmacol Sci 101:183–188. [DOI] [PubMed] [Google Scholar]
- 28. Janowsky JS, Finlay BL (1983) Cell degeneration in early development of the forebrain and cerebellum. Anat Embryol (Berl) 167:439–447. [DOI] [PubMed] [Google Scholar]
- 29. Jernigan TL, Bellugi U, Sowell E, Doherty S, Hesselink JR (1993) Cerebral morphologic distinctions between Williams and Down syndromes. Arch Neurol 50:186–191. [DOI] [PubMed] [Google Scholar]
- 30. Koppel H, Lewis PD (1983) Cell proliferation and DNA‐synthesis in the external granular layer of the postnatal rat cerebellum: A quantitative study. Neuropathol Appl Neurobiol 9:207–214. [DOI] [PubMed] [Google Scholar]
- 31. Kornack DR, Rakic P (1998) Changes in cell‐cycle kinetics during the development and evolution of primate neocortex. Proc Natl Acad Sci USA 95:1242–1246. [DOI] [PMC free article] [PubMed] [Google Scholar]
- 32. Laemmli UK (1970) Cleavage of structural proteins during the assembly of the head of bacteriophage T4. Nature 227:680–685. [DOI] [PubMed] [Google Scholar]
- 33. Liu DP, Schmidt C, Billings T, Davisson MT (2003) Quantitative PCR genotyping assay for the Ts65Dn mouse model of Down syndrome. Biotechniques 35:1170–1174, 1176, 1178 passim. [DOI] [PubMed] [Google Scholar]
- 34. Lorenzi HA, Reeves RH (2006) Hippocampal hypocellularity in the Ts65Dn mouse originates early in development. Brain Res 1104:153–159. [DOI] [PubMed] [Google Scholar]
- 35. Lowry OH, Rosebrough NJ, Farr AL, Randall RJ (1951) Protein measurement with the Folin phenol reagent. J Biol Chem 193:265–275. [PubMed] [Google Scholar]
- 36. Mares V, Lodin Z (1970) The cellular kinetics of the developing mouse cerebellum. II. The function of the external granular layer in the process of gyrification. Brain Res 23:343–352. [DOI] [PubMed] [Google Scholar]
- 37. Nakayama K, Nagahama H, Minamishima YA, Matsumoto M, Nakamichi I, Kitagawa K et al (2000) Targeted disruption of Skp2 results in accumulation of cyclin E and p27(Kip1), polyploidy and centrosome overduplication. EMBO J 19:2069–2081. [DOI] [PMC free article] [PubMed] [Google Scholar]
- 38. Nakayama K, Nagahama H, Minamishima YA, Miyake S, Ishida N, Hatakeyama S et al (2004) Skp2‐mediated degradation of p27 regulates progression into mitosis. Dev Cell 6:661–672. [DOI] [PubMed] [Google Scholar]
- 39. Nolan T, Hands RE, Bustin SA (2006) Quantification of mRNA using real‐time RT‐PCR. Nat Protoc 1:1559–1582. [DOI] [PubMed] [Google Scholar]
- 40. Nowakowski RS, Lewin SB, Miller MW (1989) Bromodeoxyuridine immunohistochemical determination of the lengths of the cell cycle and the DNA‐synthetic phase for an anatomically defined population. J Neurocytol 18:311–318. [DOI] [PubMed] [Google Scholar]
- 41. Pagano M, Tam SW, Theodoras AM, Beer‐Romero P, Del Sal G, Chau V et al (1995) Role of the ubiquitin‐proteasome pathway in regulating abundance of the cyclin‐dependent kinase inhibitor p27. Science 269:682–685. [DOI] [PubMed] [Google Scholar]
- 42. Pinter JD, Eliez S, Schmitt JE, Capone GT, Reiss AL (2001) Neuroanatomy of Down's syndrome: a high‐resolution MRI study. Am J Psychiatry 158:1659–1665. [DOI] [PubMed] [Google Scholar]
- 43. Potier MC, Rivals I, Mercier G, Ettwiller L, Moldrich RX, Laffaire J et al (2006) Transcriptional disruptions in Down syndrome: A case study in the Ts1Cje mouse cerebellum during post‐natal development. J Neurochem 97:104–109. [DOI] [PubMed] [Google Scholar]
- 44. Reeves RH, Gearhart JD, Littlefield JW (1986) Genetic basis for a mouse model of Down syndrome. Brain Res Bull 16:803–814. [DOI] [PubMed] [Google Scholar]
- 45. Reeves RH, Irving NG, Moran TH, Wohn A, Kitt C, Sisodia SS et al (1995) A mouse model for Down syndrome exhibits learning and behaviour deficits. Nat Genet 11:177–184. [DOI] [PubMed] [Google Scholar]
- 46. Richtsmeier JT, Zumwalt A, Carlson EJ, Epstein CJ, Reeves RH (2002) Craniofacial phenotypes in segmentally trisomic mouse models for Down syndrome. Am J Med Genet 107:317–324. [DOI] [PubMed] [Google Scholar]
- 47. Roizen NJ, Patterson D (2003) Down's syndrome. Lancet 361:1281–1289. [DOI] [PubMed] [Google Scholar]
- 48. Roper RJ, Baxter LL, Saran NG, Klinedinst DK, Beachy PA, Reeves RH (2006) Defective cerebellar response to mitogenic Hedgehog signaling in Down [corrected] syndrome mice. Proc Natl Acad Sci USA 103:1452–1456. [DOI] [PMC free article] [PubMed] [Google Scholar]
- 49. Roper RJ, St John HK, Philip J, Lawler A, Reeves RH (2006) Perinatal Loss of TS65DN “Down Syndrome” Mice. Genetics 172:437–443. [DOI] [PMC free article] [PubMed] [Google Scholar]
- 50. Rotmensch S, Goldstein I, Liberati M, Shalev J, Ben‐Rafael Z, Copel JA (1997) Fetal transcerebellar diameter in Down syndrome. Obstet Gynecol 89:534–537. [DOI] [PubMed] [Google Scholar]
- 51. Rueda N, Mostany R, Pazos A, Florez J, Martinez‐Cue C (2005) Cell proliferation is reduced in the dentate gyrus of aged but not young Ts65Dn mice, a model of Down syndrome. Neurosci Lett 380:197–201. [DOI] [PubMed] [Google Scholar]
- 52. Sago H, Carlson EJ, Smith DJ, Kilbridge J, Rubin EM, Mobley WC et al (1998) Ts1Cje, a partial trisomy 16 mouse model for Down syndrome, exhibits learning and behavioral abnormalities. Proc Natl Acad Sci USA 95:6256–6261. [DOI] [PMC free article] [PubMed] [Google Scholar]
- 53. Schmidt‐Sidor B, Wisniewski KE, Shepard TH, Sersen EA (1990) Brain growth in Down syndrome subjects 15 to 22 weeks of gestational age and birth to 60 months. Clin Neuropathol 9:181–190. [PubMed] [Google Scholar]
- 54. Shirane M, Harumiya Y, Ishida N, Hirai A, Miyamoto C, Hatakeyama S et al (1999) Down‐regulation of p27(Kip1) by two mechanisms, ubiquitin‐mediated degradation and proteolytic processing. J Biol Chem 274:13886–13893. [DOI] [PubMed] [Google Scholar]
- 55. Sylvester PE (1983) The hippocampus in Down's syndrome. J Ment Defic Res 27:227–236. [DOI] [PubMed] [Google Scholar]
- 56. Takizawa CG, Morgan DO (2000) Control of mitosis by changes in the subcellular location of cyclin‐B1‐Cdk1 and Cdc25C. Curr Opin Cell Biol 12:658–665. [DOI] [PubMed] [Google Scholar]
- 57. Teipel SJ, Schapiro MB, Alexander GE, Krasuski JS, Horwitz B, Hoehne C et al (2003) Relation of corpus callosum and hippocampal size to age in nondemented adults with Down's syndrome. Am J Psychiatry 160:1870–1878. [DOI] [PubMed] [Google Scholar]
- 58. Thomaidou D, Mione MC, Cavanagh JF, Parnavelas JG (1997) Apoptosis and its relation to the cell cycle in the developing cerebral cortex. J Neurosci 17:1075–1085. [DOI] [PMC free article] [PubMed] [Google Scholar]
- 59. Towbin H, Staehelin T, Gordon J (1979) Electrophoretic transfer of proteins from polyacrylamide gels to nitrocellulose sheets: procedure and some applications. Proc Natl Acad Sci USA 76:4350–4354. [DOI] [PMC free article] [PubMed] [Google Scholar]
- 60. Vandesompele J, De Preter K, Pattyn F, Poppe B, Van Roy N, De Paepe A, Speleman F (2002) Accurate normalization of real‐time quantitative RT‐PCR data by geometric averaging of multiple internal control genes. Genome Biol 3:RESEARCH0034. [DOI] [PMC free article] [PubMed] [Google Scholar]
- 61. West MJ, Gundersen HJ (1990) Unbiased stereological estimation of the number of neurons in the human hippocampus. J Comp Neurol 296:1–22. [DOI] [PubMed] [Google Scholar]
- 62. Winter TC, Ostrovsky AA, Komarniski CA, Uhrich SB (2000) Cerebellar and frontal lobe hypoplasia in fetuses with trisomy 21: Usefulness as combined US markers. Radiology 214:533–538. [DOI] [PubMed] [Google Scholar]
- 63. Wisniewski KE (1990) Down syndrome children often have brain with maturation delay, retardation of growth, and cortical dysgenesis. Am J Med Genet Suppl 7:274–281. [DOI] [PubMed] [Google Scholar]
- 64. Wong RO, Hughes A (1987) Role of cell death in the topogenesis of neuronal distributions in the developing cat retinal ganglion cell layer. J Comp Neurol 262:496–511. [DOI] [PubMed] [Google Scholar]
- 65. Zhang L, Goldman JE (1996) Developmental fates and migratory pathways of dividing progenitors in the postnatal rat cerebellum. J Comp Neurol 370:536–550. [DOI] [PubMed] [Google Scholar]
- 66. Zhang L, Goldman JE (1996) Generation of cerebellar interneurons from dividing progenitors in white matter. Neuron 16:47–54. [DOI] [PubMed] [Google Scholar]
Associated Data
This section collects any data citations, data availability statements, or supplementary materials included in this article.
Supplementary Materials
Table S1. Summary table listing the genes present on the array (OMM‐020 “Mouse Cell Cycle oligo GEArrays”; SuperArray), the mean Ts65Dn/euploid ratio and statistical significance (Student's two tailed t‐test).
Table S2. Table listing the sequence of the primers and references of the genes that were used for quantitative RT‐PCR experiments.
This material is available as part of the online article from: http://www.blackwellsynergy.com
Please note: Blackwell Publishing is not responsible for the content or functionality of any supplementary materials supplied by the authors. Any queries (other than missing material) should be directed to the corresponding author for the article.
Supporting info item
Supporting info item