

Abstract
Gangliogliomas (GGs) and dysembryoplastic neuroepithelial tumors (DNTs) represent the most frequent type of neoplasms in pediatric medically intractable epilepsy. Several data suggest a pathogenetic relationship between GGs and other glioneuronal malformations of cortical development (MCDs), including activation of the Pi3K‐mTOR signaling pathway. To further reveal these pathogenetic similarities, we investigated immunocytochemically the expression of phosphorylated (p)‐PDK1, p‐AKT, p‐mTOR, p‐4E‐BP1, p‐eIF4G, p‐p70S6K and p‐S6, the effector proteins ERM (ezrin/radixin/moesin) and the pathway regulator AMOG (adhesion molecule on glia) in both GGs and DNTs. Components of the Pi3K‐mTOR signaling pathway were observed in a higher percentage of neuronal cells in GGs compared with control cortex. In DNTs, the expression of these components was low and comparable with the expression in control samples. Strong immunoreactivity for ERM was observed in GGs, but not in DNTs. Additionally, AMOG was strongly expressed within GGs (but not in DNTs) in CD34‐positive precursor cells. These findings support the previously suggested pathogenic relationship between GG and MCDs concerning activation of the Pi3K‐mTOR signaling pathway and suggest a different pathogenetic origin for DNTs. The strong expression of AMOG within the precursor cells of GG may represent an additional marker for the diagnostic evaluation of these glioneuronal lesions.
Keywords: adhesion molecule on glia, dysembryoplastic neuroepithelial tumor, epilepsy, ganglioglioma, malformations of cortical development, mTOR
INTRODUCTION
Gangliogliomas (GGs) and dysembryoplastic neuroepithelial tumors (DNT) are well‐recognized low‐grade glioneuronal tumors (GNTs) associated with pediatric intractable epilepsy 11, 55. For both tumors, epilepsy surgery provides the best chance for curing epilepsy and preventing malignant transformation 1, 34, 40, 41. GGs consist of a mixture of dysplastic neurons and neoplastic astroglial cells, whereas DNTs contain a complex mixture of neuronal cells and oligodendroglia‐like elements 11, 32, 54. These characteristic histopathological features, together with the coexistence with cortical dysplasia, their focal nature and the expression of stem cell markers (such as CD34), suggest a developmental origin of these lesions 13, 14, 21, 51, 54. Accordingly, GNTs have been included among the malformations of cortical development (MCDs) in the group of disorders characterized by increased proliferation and the presence of abnormal cell types along with focal cortical dysplasia (FCD) and brain lesions of tuberous sclerosis complex (TSC) (5).
The malformative nature of GNTs is also supported by the detection of molecular alterations common to other developmental glioneuronal lesions (8). Gene expression studies in GG show differential expression of genes essential for neuronal cell cycle regulation and for brain development 3, 19. In particular, recent studies suggest a role for the phosphatidylinositol‐3 kinase‐mammalian target of rapamycin (Pi3K‐mTOR) signaling pathway (Figure 1) in the molecular pathogenesis of glioneuronal lesions 8, 47, 48. Increased Pi3K‐mTOR signaling results in abnormal cell growth and proliferation via activation of both the eukaryotic initiation factor 4E‐binding protein 1 (4E‐BP1) and the ribosomal protein S6 kinase (p70S6K) 24, 27. Furthermore, studies in mutant mice with loss of TSC1 expression in cortical neurons emphasize a critical role of Pi3K‐mTOR signaling in neuronal function and development (37). Recently, the adhesion molecule AMOG (adhesion molecule on glia; also known as Na+/K+‐ATPase β2) has been shown to increase cell size via activation of mTOR by phosphorylation of the upstream protein Akt (Figure 1, (46)). The phosphorylation of Akt and the subsequent downstream signaling occurs independently of Pi3K, indicating AMOG as a novel and additional activator of mTOR signaling.
Figure 1.
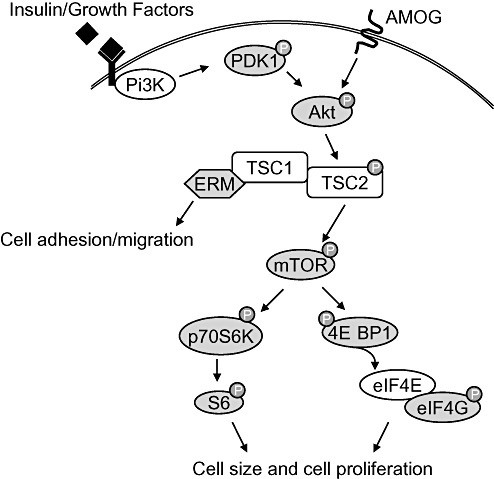
Schematic representation of the Pi3K‐mTOR signaling pathway. Ligand binding to insulin receptors or growth factor receptors trigger phosphatidylinositol‐3 kinase (Pi3K), which in turn activates the phosphoinositide‐dependent protein kinase 1 (PDK1) by phosphorylation. Akt is phosphorylated and activated by phosphorylated (p)‐PDK1 or by the adhesion molecule on glia (AMOG) independently of PDK1 and Pi3K. P‐Akt inactivates the tumor suppressor tuberin (TSC2) by phosphorylation which results in the indirect activation of the mammalian target of rapamycin (mTOR). Downstream phosphorylation of the eukaryotic initiation factor 4E binding protein 1 (4E‐BP1) releases the eukaryotic initiation factor 4E (eIF4E). eIF4E interacts with p‐eukaryotic initiation factor 4G (eIF4G) to activate cap‐dependent mRNA translation which enhances cell size and cell proliferation. Cell size and proliferation is also regulated by phosphorylation of the ribosomal protein S6 kinase (p70S6K) and its downstream effector ribosomal protein S6. The ERM proteins (ezrin, radixin and moesin) interact with hamartin (TSC1) and regulate cell adhesion and migration. Components of the pathway examined in this study are shaded in grey.
Ezrin, radixin and moesin (ERM) are actin‐binding proteins involved in cell adhesion and cell growth control (36) which interact with the Pi3K‐mTOR signaling component hamartin (TSC1) (Figure 1, (29)). Increased and aberrant expression of ERM has already been observed in glioneuronal lesions including GG, FCD and TSC 25, 33, 48 suggesting activation of the Pi3K‐mTOR signaling pathway.
Although several studies support a role for the Pi3K‐mTOR signaling in the development of MCDs, differences in regulation of this pathway in TSC and FCD has been described 6, 38, 47. In addition to ERM expression in GG, only the expression of the downstream effectors phosphorylated (p)‐p70S6K and p‐ribosomal S6 protein has been described in GG (45). It is still unclear which components of the Pi3K‐mTOR pathway are activated in GG and DNT, the origin of the signal responsible for the phosphorylation of S6, and to what extent this expression pattern resembles other MCDs. Therefore, we investigated the expression of different components of the Pi3K‐mTOR signaling pathway in both GG and DNT, as well as the effector proteins ERM and the pathway activator AMOG.
MATERIALS AND METHODS
Subjects
The GNT specimens included in this study were all obtained from the databases of the Departments of Neuropathology of the Academic Medical Center (University of Amsterdam) in Amsterdam and the University Medical Center in Utrecht. We examined a total of 18 temporal lobe specimens (9 GGs and 9 DNTs) removed from patients undergoing resection of GNT for medically intractable epilepsy. Informed consent was obtained for the use of brain tissue and for access to medical records for research purposes. Tissue was obtained and used in a manner compliant with the Declaration of Helsinki. We reviewed all cases and the diagnosis of GG or DNT was confirmed according to the revised World Health Organization classification of tumors of the nervous system (32).
The clinical features of the included patients, such as age at surgery, duration of epilepsy and seizure type, are summarized in Table 1. The predominant type of seizure pattern was that of complex partial seizures, which were resistant to maximal doses of anti‐epileptic drugs. The patients underwent pre‐surgical evaluation (53) and we classified the postoperative seizure outcome according to Engel (18). Patients who were free of habitual preoperative seizures were classified as class I, and patients in class II were almost seizure‐free or had rare or nocturnal seizures only. Follow‐up period ranged from 3 to 12 years.
Table 1.
Summary of clinical features of patients with GNTs (n = 18). Abbreviations: CPS = complex partial seizures; DNT = dysembryoplastic neuroepithelial tumor; GG = ganglioglioma; SGS = secondary generalized seizures.
| Patient/sex/age | Lesion type | Duration epilepsy (years) | Seizure type | Engel's class |
|---|---|---|---|---|
| 1/M/27 | GG | 27 | CPS/SGS | I |
| 2/M/16 | GG | 3 | CPS | I |
| 3/M/26 | GG | 18 | CPS | I |
| 4/M/10 | GG | 9 | CPS | I |
| 5/F/26 | GG | 25 | CPS/SGS | I |
| 6/F/25 | GG | 24 | CPS | I |
| 7/F/35 | GG | 18 | CPS/SGS | I |
| 8/F/17 | GG | 16 | CPS/SGS | II |
| 9/F/24 | GG | 18 | CPS | II |
| 10/M/14 | DNT | 4 | CPS | I |
| 11/M/39 | DNT | 35 | CPS | I |
| 12/M/24 | DNT | 9 | CPS | I |
| 13/M/18 | DNT | 10 | CPS | I |
| 14/F/32 | DNT | 15 | CPS | I |
| 15/F/26 | DNT | 22 | CPS | I |
| 16/F/37 | DNT | 18 | CPS | I |
| 17/F/19 | DNT | 9 | CPS | I |
| 18/F/34 | DNT | 19 | CPS | I |
Control cortex/white matter from the temporal region was obtained at autopsy from six adult control patients (male/female: 5/1; mean age: 53.5 years; range: 31–70 years) without history of neurological diseases. All autopsies were performed within 12 h after death. We also selected five GNT cases (three GG and two DNT) that contained a sufficient amount of peritumoral tissue (normal‐appearing cortex/white matter adjacent to the tumor) for comparison with the autopsy specimens. This material represents good disease control tissue, as it is exposed to the same seizure activity, drugs, fixation time, and age and gender are the same.
Tissue preparation
Formalin‐fixed, paraffin‐embedded tissue was sectioned at 6 µm and mounted on organosilane‐coated slides (Sigma, St. Louis, MO, USA). Representative sections of all specimens were processed for hematoxylin eosin stains as well as for immunocytochemical markers as described below.
Immunocytochemical analysis
To document the presence of a heterogeneous population of cells, we used antibodies directed against glial fibrillary acidic protein (GFAP; polyclonal rabbit, DAKO, Glostrup, Denmark; 1:4000), vimentin (mouse clone V9, DAKO; 1:1000), neuronal nuclear protein (NeuN; mouse clone MAB377, Chemicon, Temecula, CA, USA; 1:2000), microtubule‐associated protein (MAP2; mouse clone HM2, Sigma, St. Louis, MO, USA; 1:1000, polyclonal rabbit; Chemicon; 1:500), synaptophysin (mouse clone Sy38, DAKO; 1:200), CD34 (QBEnd10; mouse IgG1, 1:600; Immunotech, Marseille, Cedex, France) and human leukocyte antigen (HLA)‐DP, ‐DQ, ‐DR (CR3/43; monoclonal mouse, DAKO; 1:400) in the routine immunocytochemical analysis of GNT specimens.
Components of the Pi3K‐mTOR signaling pathway were detected with the following antibodies: phosphorylated (p)‐PDK1 (phosphoinositide‐dependent protein kinase 1; Ser241; polyclonal rabbit; 1:70), p‐AKT (Ser473; monoclonal rabbit; 1:20), p‐mTOR (mammalian target of rapamycin; Ser2448; polyclonal rabbit; 1:20), p‐4E‐BP1 (eukaryotic initiation factor 4E binding protein 1; Thr37/46; monoclonal rabbit; 1:50), p‐eIF4G (eukaryotic initiation factor 4G; Ser1108; polyclonal rabbit; 1:50), p‐p70S6K (ribosomal protein S6 kinase; Thr389; monoclonal mouse; 1:50, Thr229; polyclonal rabbit, Acris Antibodies, Hiddenhausen, Germany; 1:200) and p‐S6 (ribosomal protein S6; Ser235/236; monoclonal rabbit; 1:50), all from Cell Signaling Technology, Beverly, MA, USA, unless otherwise indicated. Additionally, we stained sections with an ERM antibody (polyclonal rabbit; Cell Signaling Technology; 1:50) and an AMOG antibody (Na+,K+ ATPase β2; monoclonal mouse, BD Transduction Laboratories, Franklin Lakes, NJ, USA; 1:100).
Parrafin‐embedded sections were deparaffinized, re‐hydrated and incubated for 20 minutes in 0.3% H2O2 diluted in methanol to quench the endogenous peroxidase activity. Antigen retrieval was performed by incubation for 10 minutes at 121°C in citrate buffer (0.01 M, pH 6.0); sections were washed with phosphate‐buffered saline (PBS) and incubated for 30 minutes in 10% of normal goat serum (Harlan Sera‐Lab, Loughborough, Leicestershire, UK). We incubated the sections with the primary antibodies overnight at 4°C. Hereafter, sections were washed in PBS and we used the ready‐for‐use PowerVision® peroxidase system (Immunologic, Duiven, The Netherlands) or a biotin‐labeled secondary antibody followed by the horseradish peroxidase (HRP)‐labeled StreptABComplex (DAKO). 3,3′‐Diaminobenzidine (Sigma or PowerDAB; Immunologic) was used as chromogen. Sections were counterstained with hematoxylin, dehydrated and coverslipped. Sections incubated without the primary antibody were essentially blank.
To study co‐localization of the expression of AMOG and CD34, we stained serial sections with AMOG (monoclonal mouse) and CD34 (monoclonal mouse) as described above and we double‐labeled sections with both antibodies. Therefore, we first developed the AMOG (first primary antibody) staining with the previously described method, followed by incubation at 121°C in citrate buffer (0.01 M, pH 6.0) for 10 minutes to remove the AMOG antibody. Again, the sections were blocked with 10% normal goat serum (Harlan Sera‐Lab, UK) and incubated for 1 h at room temperature with CD34 (second primary antibody). We visualized the CD34 antibody with a biotin‐labeled secondary antibody (DAKO), followed by the alkaline phosphatase (AP)‐labeled StreptABComplex (DAKO) and liquid permanent red (DAKO) as chromogen (2). Sections incubated with the first primary antibody and sections that were developed after citrate treatment were essentially blank.
In further double‐labeling experiments, we combined AMOG (monoclonal mouse) with MAP2, GFAP and p‐S6 (all rabbit antibodies). After incubation overnight at 4°C, sections were incubated for 2 h at room temperature with Alexa Fluor® 568‐conjugated anti‐rabbit IgG and Alexa Fluor® 488 anti‐mouse IgG (1:100, Molecular Probes, Leiden, The Netherlands). Sections were analyzed by means of a laser scanning confocal microscope (Bio‐Rad, Hercules, CA, USA; MRC1024) equipped with an argon‐ion laser.
Evaluation of immunoreactivity
All labeled sections were analyzed and for the components of the Pi3K‐mTOR signaling pathway we calculated the labeling index (LI) for neuronal cells. Neuronal cell bodies were differentiated from glia on the basis of morphology, and only neurons in which the nucleolus could be clearly identified were included. The LI was defined as the ratio of immunolabeled cells related to the entire neuronal cell population (47). We calculated the LI within a total microscopic area of 858.050 µm2 (by examining non‐overlapping 0.0655 mm × 0.0655 mm fields, using a square grid inserted into the high‐power eyepiece of an Olympus microscope). The LI for a specific antibody was expressed as a percentage for all GG or DNT specimens (Table 2).
Table 2.
Protein expression in neuronal component of GG and DNT. Abbreviations: DNT = dysembryoplastic neuroepithelial tumor; ERM = ezrin, radaxin, moesin; GG = ganglioglioma, PT = peritumoral; (p)‐PDK1 = phosphorylated phosphoinositide‐dependent protein kinase 1; p‐mTOR = phosphorylated‐mammalian target of rapamycin; p‐4E‐BP1 = phosphorylated‐eukaryotic initiation factor 4E binding protein 1; p‐eIF4G = phosphorylated‐eukaryotic initiation factor 4G; p‐p70S6K‐T389 = ribosomal protein S6 kinase phosphorylated at threonine 389; p‐p70S6K‐T229 = ribosomal protein S6 kinase phosphorylated at threonine 229; p‐S6 = phosphorylated‐ribosomal protein S6.
| Ab | Control (n = 6) | Control (n = 5) (PT) | DNT (n = 9) | GG (n = 9) |
|---|---|---|---|---|
| p‐PDK1 | 9 ± 5 | 11 ± 7 | 13 ± 7 | 27 ± 5 |
| p‐AKT | 2 ± 1 | 5 ± 2 | 2 ± 0.8 | 58 ± 7 |
| p‐mTOR | 4 ± 2 | 9 ± 4 | 1 ± 2 | 66 ± 18 |
| p‐4E‐BP1 | 1 ± 0.5 | 2 ± 0.3 | 1 ± 0.2 | 17 ± 6 |
| p‐elF4G | 1 ± 0.3 | 2 ± 0.4 | 1 ± 0.1 | 28 ± 8 |
| p‐S6 | 3 ± 1 | 6 ± 3 | 5 ± 3 | 33 ± 7 |
| p‐p70S6K‐T389 | 2 ± 1 | 6 ± 2 | 1 ± 0.3 | 28 ± 5 |
| p‐p70S6K‐T229 | 8 ± 3 | 10 ± 4 | 2 ± 0.1 | 25 ± 3 |
| ERM | 0.6 ± 0.3 | 0.5 ± 0.1 | 1 ± 0.2 | 57 ± 13 |
Data represent percentages of cells immunoreactive (cytoplasmic staining) for the different antibodies (Ab). Data are expressed as mean ± standard error of the mean.
Furthermore, the staining pattern for CD34 and AMOG in GG sections was classified using the three different immunoreactivity patterns (solitary, clustered/busy and diffuse) previously described by Blumcke et al. (12).
RESULTS
Case material and histological features
The patients included in this study (nine GG and nine DNT; Table 1) all had a history of chronic pharmacoresistant epilepsy. Postoperatively, 16 patients (89%) were completely seizure‐free. The remaining two cases (both GG) were almost seizure‐free or had rare or nocturnal seizures only (Engel's class II). The surgically removed GGs were composed of dysplastic neuronal cells lacking uniform orientation (Figure 2A and B) surrounded by neoplastic astrocytes (Figure 2C). Expression of the precursor cell marker, CD34, was observed in all GG specimens of our series (Figure 2D). The surgically removed DNTs were composed of a mixture of neuronal cells, few astrocytes and a prominent population of oligodendroglia‐like cells (Figure 2E and F). Isolated DNT (without associated cortical dysplasia) were all negative for CD34.
Figure 2.
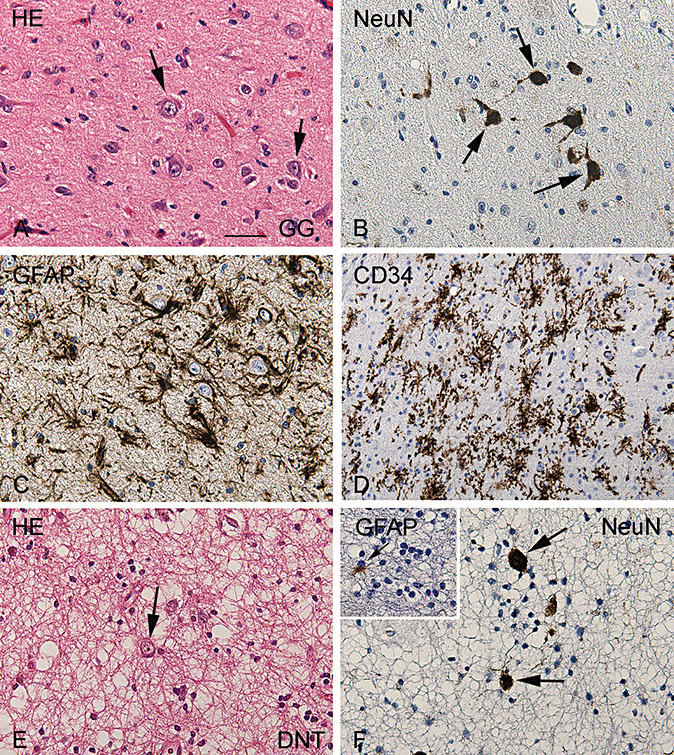
Histopathological features of glioneuronal tumors. Panels A–D: Representative photomicrographs of ganglioglioma (GG). A. Hematoxylin/Eosin (HE) staining of GG showing the mixture of neuronal cells, lacking uniform orientation (arrows) and glial cells. B. NeuN staining detects the neuronal component (nuclear staining) of GG. C. GFAP immunoreactivity showing the astroglial tumor component. D. Prominent CD34 (precursor cell marker) immunoreactivity within GG. E,F. Representative photomicrographs of dysembryoplastic neuroepithelial tumor (DNT). E. HE staining of DNT showing a typical heterogeneous cellular composition, with floating neurons (arrow) surrounded by a prominent population of oligodendroglia‐like cells. F. NeuN staining detects the neuronal component of DNT. Insert in F: GFAP detects few astrocytes between the GFAP‐negative oligodendroglia‐like cells. Scale bar in A: A–C, E, F: 40 µm; D: 80 µm. Abbreviations: GFAP = glial fibrillary acidic protein; NeuN = neuronal nuclear protein.
Pi3K‐mTOR signaling in normal cortex and glioneuronal tumors
The following components of the Pi3K‐mTOR signaling pathway were examined immunocytochemically in GNTs, peritumoral cortex and histologically normal cortex obtained at autopsy: phosphorylated (p)‐PDK1, p‐AKT, p‐mTOR, p‐4E‐BP1, p‐eIF4G, p‐p70S6K (both Thr389 and Thr229) and p‐S6.
In control postmortem cortex as well as in the surgically removed histologically normal cortex (peritumoral cortex) weak immunoreactivity (IR) for p‐PDK1 was detected in the cytoplasm of few neuronal cells (Figure 3A). LIs for these areas were 9% ± 5% and 11% ± 7%, respectively (Table 2). In DNT, the neuronal expression of p‐PDK1 was low and comparable to control cortex (Figure 3B, Table 2). In GG, neuronal cells were immunoreactive for p‐PDK1 with an LI of 27 ± 5. (Figure 3C and D, Table 2).
Figure 3.
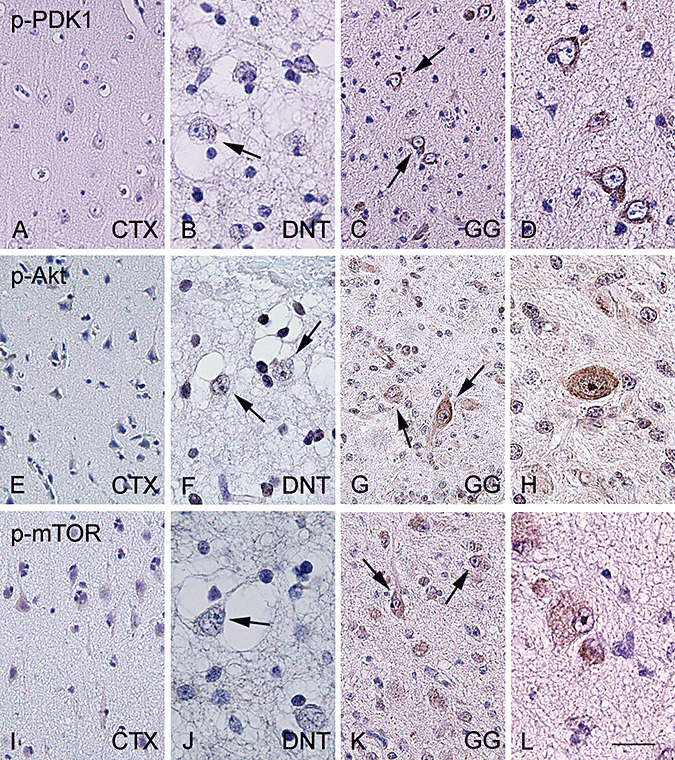
P‐PDK1, p‐AKT and p‐mTOR immunoreactivity in normal cortex and glioneuronal tumors. In histologically normal cortex (CTX), significant expression of phosphorylated (p)‐PDK1 (A), p‐AKT (E) and p‐mTOR (I) is not observed. Dysembryoplastic neuroepithelial tumor (DNT) specimens showing no significant expression of phosphorylated (p)‐PDK1 (B), p‐AKT (F) and mTOR (J). Arrows indicate negative dysplastic neurons within DNT. Ganglioglioma (GG) specimens showing consistent expression of phosphorylated (p)‐PDK1 (C–D), p‐AKT (G–H) and p‐mTOR (K–L). Arrows indicate the positive dysplastic cells within the tumors. Scale bar in L: A, C, E, G, I, K: 80 µm; B, D, F, H, J, L: 40 µm. Abbreviations: (p)‐PDK1 = phosphorylated‐phosphoinositide‐dependent protein kinase 1; p‐mTOR = phosphorylated‐mammalian target of rapamycin.
We did not observe significant expression of p‐Akt in both postmortem control and peritumoral cortex (Figure 3E, Table 2). In DNT, p‐Akt neuronal IR was minimal and comparable to control cortex (Figure 3F, Table 2). In contrast, 58% ± 7% of neuronal cells in GG expressed p‐Akt in the cytoplasm (Figure 3G and H, Table 2). In histologically normal cortex (both postmortem and peritumoral areas) IR for p‐mTOR was observed in few neuronal cells (Figure 3I, Table 2). In DNT, we observed p‐mTOR expression in hardly any neuronal cells (LI; 1% ± 2%, Figure 3J). A large majority of neuronal cells in GG displayed p‐mTOR expression (Figure 3K and L, Table 2).
Significant p‐4E‐BP1 expression was not observed in both postmortem and peritumoral cortex (Figure 4A, Table 2). Neuronal expression of p‐4E‐BP1 in DNT was similar to the neuronal expression in control material (Figure 4B, Table 2). In GG, 17% ± 6% of the dysplastic neuronal cells were immunoreactive for p‐4E‐BP1 (Figure 4C, Table 2).
Figure 4.
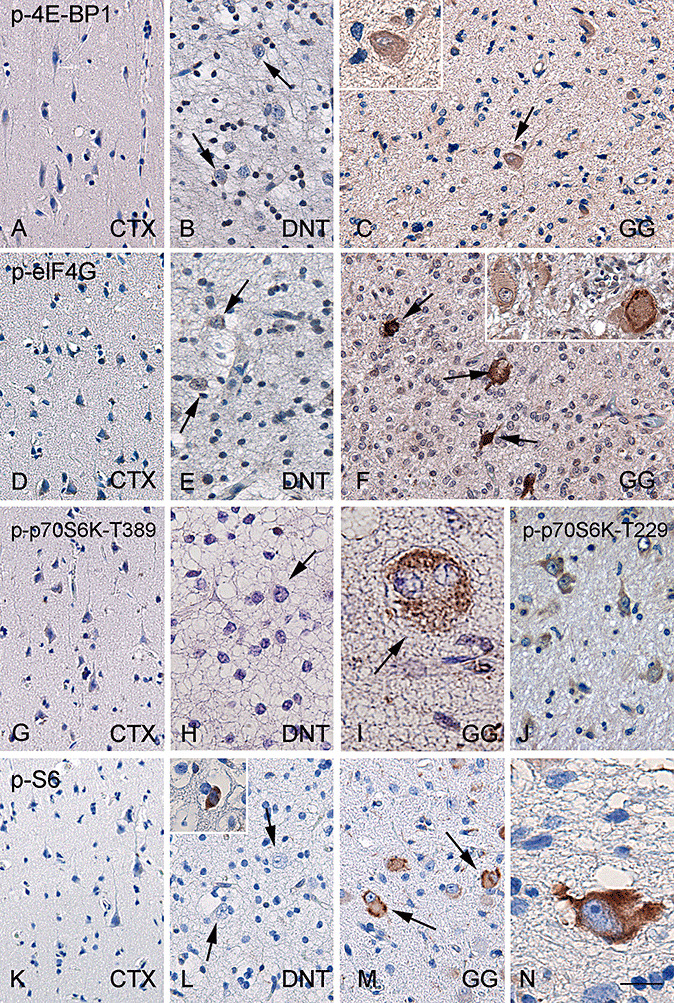
p‐4E‐BP1, p‐eIF4G, p‐p70S6K and p‐S6 immunoreactivity in normal cortex and glioneuronal tumors. Histologically normal cortex (CTX) with no significant expression of phosphorylated (p)‐4E‐BP1 (A), p‐eIF4G (D), p‐p70S6K (G) and p‐S6 (K). In dysembryoplastic neuroepithelial tumors (DNT), significant expression of p‐4E‐BP1 (B), p‐eIF4G (E), p‐p70S6K (H) and pS6 (L) is not observed (arrows indicate negative dysplastic neurons). Sporadically, p‐S6 positive neurons are observed in DNT (inset in L) as well as in histologically normal cortex (data not shown). Representative ganglioglioma (GG) specimen showing expression of p‐4E‐BP1 in dysplastic neurons (C: arrow and inset). p‐eIF4G immunoreactivity in GG (F: arrows indicate positive dysplastic cells). GG specimens showing p‐p70S6K immunoreactivity for both p‐p70S6K‐Thr389 (I) and ‐Thr229 (J) in dysplastic cells. GG specimens showing consistent expression of p‐S6 (M and N: arrows indicate positive cells with different morphology). Scale bar in N: A–G, J–M: 80 µm; H: 60 µm; I, N: 30 µm. Abbreviations: p‐4E‐BP1 = phosphorylated‐eukaryotic initiation factor 4E binding protein 1; p‐eIF4G = phosphorylated‐eukaryotic initiation factor 4G; p‐p70S6K = phosphorylated‐ribosomal protein S6 kinase; p‐S6 = phosphorylated‐ribosomal protein S6.
In both postmortem and peritumoral cortex, neuronal cells displayed a minimal expression of p‐eIF4G (Figure 4D, Table 2). In DNT, we observed a minimal neuronal expression (LI; 1 ± 0.1%; Figure 4E, Table 2). Increased expression of p‐eIF4G was observed in the neuronal component of GG (Figure 4F, Table 2).
In histologically normal cortex, cytoplasmic IR for both p‐p70S6K (Thr389 and Thr229) and its downstream effector p‐S6 was not detected (Figure 4G and K, Table 2). In DNT, neuronal expression of p‐p70S6K was minimal (Figure 4H, Table 2) and few neurons were p‐S6 positive in DNT (Figure 4L, Table 2). In GG, we observed similar neuronal expression levels for p‐p70S6K‐Thr389 and p‐p70S6K‐Thr229 with LIs of 28% ± 5% and 25% ± 3%, respectively (Figure 4I and J, Table 2). All sections showed non‐specific nuclear staining for p‐p70S6K‐Thr389 as previously reported by others 38, 47. P‐S6 IR was present in the neuronal component of GG with an LI of 33% ± 7% (Figure 4M and N, Table 2).
Resting glial cells in the control postmortem cortex as well as in the surgically removed normal cortex (peritumoral cortex) were negative for the studied components of the Pi3K‐mTOR signaling pathway. We could not detect a specific and consistent expression of phosphorylated proteins in the neoplastic glial component of the GG specimens. The population of oligodendroglia‐like cells in DNT did not show immunoreactivity for any of the phosphorylated proteins studied.
ERM immunoreactivity in normal cortex and glioneuronal tumors
In histologically normal cortex (both postmortem and peritumoral areas), IR for the ERM proteins was detected in endothelial cells (Figure 5A). We did not observe a significant expression in neuronal cells (Table 2) or in resting glial cells. In DNT, we observed weak IR for ERM in endothelial cells (Figure 5B). Minimal IR was observed in neuronal cells (Table 2), and oligodendroglia‐like cells were negative. Within GG, high expression of ERM proteins was observed in the dysplastic neuronal cells with a granular cytoplasmic staining pattern (Figure 5C and D and Table 2). The neoplastic glial component of the GG specimens did not show consistent ERM IR.
Figure 5.
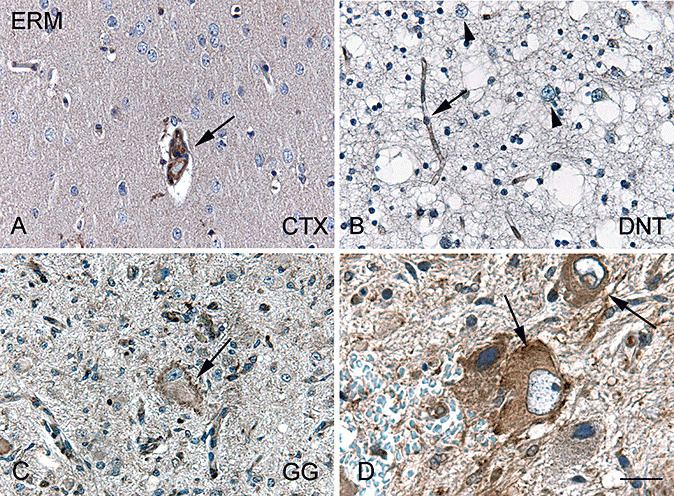
Ezrin, radixin and moesin (ERM) immunoreactivity in normal cortex and glioneuronal tumors. A. In histologically normal cortex (CTX), ERM immunoreactivity (IR) is restricted to endothelial cells (arrow). B. Dysembryoplastic neuroepithelial tumor (DNT) showing endothelial ERM IR (arrow) and ERM expression is not observed in dysplastic neurons (arrowheads). C,D. Dysplastic cells in ganglioglioma (GG, arrows) show ERM IR. Scale bar in D: A–C: 40 µm; D: 25 µm.
AMOG immunoreactivity in normal cortex and glioneuronal tumors
In histologically normal cortex (both postmortem and peritumoral areas) a diffuse and moderate IR for AMOG was detected (Figure 6A). Neuronal cells were negative for AMOG. In the white matter of control material, AMOG expression was restricted to astrocytes, especially in perivascular astrocytes (Figure 6B).
Figure 6.
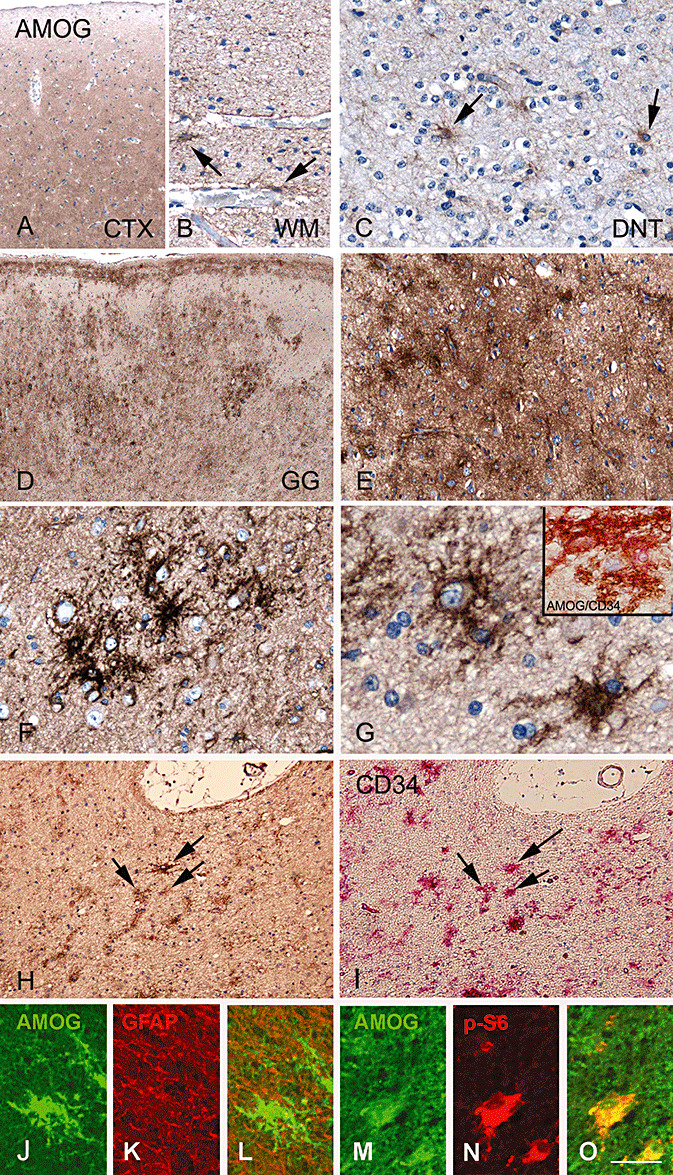
AMOG immunoreactivity patterns in normal cortex and glioneuronal tumors. A,B. AMOG immunoreactivity (IR) in histologically normal brain. A diffuse moderate staining is observed in cerebral cortex (CTX; A), while in the white matter (WM; B) AMOG is detected in the perivascular astrocytes. C. AMOG IR in few astrocytes in a dysembryoplastic neuroepithelial tumor (DNT). Panels D–H: AMOG IR in ganglioglioma (GG). D. Strong and diffuse AMOG IR within GG with multiple cell clusters. E. Higher magnification of a region with diffuse AMOG IR. F. AMOG‐immunoreactive cell cluster (clustered‐bushy pattern). G. Solitary IR pattern of AMOG, co‐localization of AMOG (brown) with CD34 (pink) is shown in inset. H,I. Sequential sections show cells immunoreactive for AMOG (H; arrows) as well as CD34 (I, arrows). J–L. Double‐labeling of AMOG (green, J) with GFAP (red, K) shows absence of co‐localization (merged image, L). M–O: double‐labeling of AMOG (green, M) with p‐S6 (red, N) show co‐localization (merged image, O) in dysplastic cells. Scale bar in O: A, D: 200 µm; B: 60 µm; C: 40 µm; E: 80 µm; F–G; 30 µm; H–I: 100 µm; J–L: 30 µm, M–O: 20 µm. Abbreviations: AMOG = adhesion molecule on glia; GFAP = glial fibrillary acidic protein; p‐S6 = phosphorylated‐ribosomal protein S6.
In DNT, few astrocytes expressed AMOG (Figure 6C), whereas neuronal cells and oligodendroglia‐like cells were AMOG negative. In GG, we observed intense AMOG IR in the tumor area (Figure 6D). AMOG was expressed in the cytoplasm and processes, and three different IR patterns of AMOG positive cells were observed. In 78% of the specimens (7 out 9), large areas of homogenous AMOG IR were present, classified as a “diffuse” staining pattern (Figure 6E). Single cells or cell processes were difficult to detect in these areas. The second staining pattern encountered in the GG specimens was the clustering of AMOG immunoreactive cells (Figure 6F). This “clustered‐bushy” immunoreactive pattern was detected in eight out of nine cases. Third, “solitary” AMOG immunoreactive cells with intense ramification of processes were observed in 67% of the GG specimens (Figure 6G). In five out of nine GG specimens, all three different AMOG IR patterns were observed. The remaining four cases had the following staining patterns: only “diffuse” IR, only “clustered” IR, “solitary” IR combined with “clustered” positive cells or “diffuse” IR combined with “clustered” positive cells.
The observed IR pattern of AMOG positive cells was similar to staining patterns observed for CD34 (marker of precursor cells) and double labeling studies confirmed CD34 and AMOG expression in the same cells (inset in Figure 6G and staining of serial sections in Figure 6H and I). Fluorescent double labeling experiments revealed that AMOG was not expressed in astrocytes (GFAP‐positive cells; Figure 6J and L). We observed co‐localization of AMOG with the neuronal marker MAP2 (not shown) and with p‐S6 in dysplastic cells in GG (Figure 6M–O).
DISCUSSION
Previous studies have shown the activation of components of the Pi3K‐mTOR signaling pathway in both FCD and TSC 6, 31, 38, 47, 48. In the present study, we demonstrate that several components of this signaling pathway, including the downstream effector proteins ERM, are activated in GG, which support the previously suggested pathogenetic relationship between GG and FCD and TSC. Activated components of this signaling pathway were not detected in DNTs. In addition, we demonstrate and describe the cellular expression pattern of AMOG, a recently identified activator of the Pi3K‐mTOR signaling pathway.
Pi3K‐mTOR signaling in GG
Akt is a critical mediator in the Pi3K‐mTOR pathway and its kinase activity is dependent on phosphorylation via p‐PDK1 (reviewed in 9, 10). Both p‐PDK1 and p‐Akt are observed in dysplastic neuronal cells in GG and were previously observed in the dysplastic cells in FCD and, to a lesser extent, in giant cells in TSC (47). Downstream phosphorylation of tuberin (TSC2) by p‐Akt inactivates the hamartin/tuberin (TSC1/TSC2) complex (22), which leads to hyperactivation of mTOR and the associated kinase signaling cascades (reviewed in 24, 27). Aside from inactivation by phosphorylation, the TSC1/TSC2 complex can also be inactivated by mutations in either TSC1 or TSC2, the causative genes in TSC 16, 52. Interestingly, an anaplastic ganglioglioma was observed in an animal model of TSC with genetic alterations in TSC2 (39). Mutational analysis of TSC1 and TSC2 in GG revealed abundant sequence alterations in the TSC2 gene, including a somatic mutation in the neoplastic glial element which was not present in the neuronal component of GG (7). Nevertheless, as mutational analysis was not performed in the GG specimens examined in this study, we cannot exclude a contribution of genetic alterations in either TSC1 or TSC2 resulting in the observed mTOR phosphorylation.
TSC1 interacts with the ERM proteins (ezrin/radixin/moesin) (29) which are expressed in proliferating and migrating cells in the developing human cerebral cortex (25). They regulate key aspects of growth cone formation in neuronal cells and affect neuronal motility and morphology (42). In adulthood, ERM proteins are predominantly located in astrocytes (15), suggesting that the observed neuronal ERM expression in GG represents immature neuronal cells which fail to migrate and proliferate properly. In several MCDs, including FCD, GG and TSC, aberrant expression of ERM proteins has already been described in dysplastic neurons and balloon/giant cells 25, 33, 48. The aberrant expression of ERM proteins might contribute to the abnormal morphology of dysplastic cells and their abnormal positioning in these MCDs.
Activation (phosphorylation) of mTOR results in the activation of two downstream substrates: 4E‐BP1 and p70S6K 24, 27. Phosphorylation of the eukaryotic initiation factor 4E‐BP1 by mTOR results in the dissociation of the translation initiation factor eIF4E, which in turn, associates with eIF4G, activating cap‐dependent mRNA translation (24) (Figure 1). We demonstrate expression of both p‐4E‐BP1 and p‐eIF4G in the dysplastic neuronal component of GG. Expression of p‐eIF4G was previously reported in the dysplastic cells of both FCD and TSC 31, 38.
The second way via which mTOR increases cell size and proliferation is by phosphorylation of p70S6K at Thr389 and the activation of the downstream protein S6 24, 27. Both proteins were expressed in the neuronal component of GG, which was previously reported by Samadani et al. (45). In addition to phosphorylation at Thr389, phoshporylation at Thr229 by p‐PDK1 is also critically involved in the kinase activity of p70S6K (44), and we demonstrate that both sites are phosphorylated in the neuronal cells of GG. Comparison with other MCDs reveals that p70S6K is predominantly phosphorylated at Thr229 in balloon cells in FCD, whereas both sites are phosphorylated in giant cells in TSC (47). The presence of several activated components of the Pi3K‐mTOR signaling pathway strongly suggests that these components are functionally active; however, we have to keep in mind that kinase activity is not represented by immunoreactivity.
Although TSC is a genetic disease and FCD and GG comprises sporadic cases, a pathogenetic relationship is supported by the finding that the downstream effectors of the Pi3K‐mTOR signaling pathway, ERM, p‐eI4FG and p‐S6 are observed in the dysplastic cell types in these MCDs. However, the underlying activation and regulation of the Pi3K‐mTOR signaling remains unclear. Differences in the secretion of growth factors and other neurotrophic factors in the microenvironment in these lesions has been previously suggested by others 22, 47 as a possible mechanism. One example is represented by the vascular endothelial growth factor (VEGF): production of VEGF is mTOR dependent and is induced in mice with a TSC1 mutation as well as in TSC1‐null and TSC2‐null fibroblast cell lines (17). Additionally, other pathways such as the ERK1/2‐, the LKB1‐AMPK‐ and the WNT‐ signaling pathway are known to regulate the TSC1/TSC2 complex 4, 26, 28, 35 and are possibly differentially involved in the different MCDs.
MCDs are highly associated with intractable epilepsy and we cannot exclude that the activation of the Pi3K‐mTOR signaling pathway in these lesions may result from seizure activity or invasive pre‐surgical monitoring. Increased expression of p70S6K and pS6 has been recently reported in the neocortical tissue removed following depth electrode implantation in adult epilepsy invasive monitoring surgeries (50). However, the patients included in this study did not undergo invasive monitoring, and as significant differences in the expression of components of the Pi3K‐mTOR signaling pathway were not observed in normal cortex adjacent to the lesion compared with control tissue from patients without a history of seizures, it is unlikely that seizures alone trigger Pi3K‐mTOR activation. In addition, increased expression of components of this signaling pathway was not detected in patients with DNTs, which did not differ in age of seizure onset, duration of seizures or seizure monitoring used prior to surgery from the GG patients.
An intriguing question for the future is to further elucidate the mechanisms that regulate the Pi3K‐mTOR signaling in order to explain the observed differences in activation of this pathway in the different MCDs.
AMOG expression patterns
The identification of AMOG as an activator of the Pi3K‐mTOR signaling (46), prompted us to investigate its expression pattern in GNTs. AMOG activates Akt independently of Pi3K and PDK1, although the exact molecular mechanism that facilitates this activation remains unknown (46). In the examined DNTs we observed AMOG immunoreactivity in astrocytes which was comparable with the expression pattern in control material 30, 43. Strong AMOG immunoreactivity patterns were present in GG, which resemble the expression patterns of CD34, a marker for glioneuronal precursor cells 12, 14. CD34 is abundantly expressed in clusters in GG and in dysplastic cells in FCD and TSC 12, 14, 20. Aside from expression in the low‐grade GG, CD34 expression is observed in other tumors of the nervous system (20), with lower expression levels in tumors of higher malignancy. In some GG cases, CD34 immunoreactivity has been detected in association with tumor cell processes in patients with an adverse clinical course (34). However, malignant progression to a glioblastoma multiforme usually is associated with loss of GG features, including loss of CD34 immunolabeling (34). The same inverse relationship between expression level and malignancy is observed for AMOG in human glioma ((49), unpublished observations). Double‐labeling showed that cells immunoreactive for AMOG also showed IR for CD34 and MAP2 and not with the astrocytic marker GFAP in the examined GG specimens. AMOG is expressed in the same cell type that express CD34 and therefore AMOG may represent a novel marker to identify glioneuronal precursor cells. Interesting to note is that DNTs are, in general, CD34‐negative (14), which is in line with our results of normal AMOG expression pattern in DNTs. Genomic alterations studied in a large series of GGs by chromosomal and array‐based comparative genomic hybridization reveal a distinct genomic profile compared with other low‐grade primary brain tumors (23). Furthermore, gene expression profiling differentiates GGs from DNTs (19). All together, these observations suggest a different pathogenetic origin for DNTs.
ACKNOWLEDGMENTS
This work was supported by the National Epilepsy Fund (NEF 05‐11, E. Aronica and K. Boer), Stichting Michelle (M06.011and M07 016, E. Aronica).
REFERENCES
- 1. Aronica E, Leenstra S, Van Veelen CW, Van Rijen PC, Hulsebos TJ, Tersmette AC et al (2001) Glioneuronal tumors and medically intractable epilepsy: a clinical study with long‐term follow‐up of seizure outcome after surgery. Epilepsy Res 43:179–191. [DOI] [PubMed] [Google Scholar]
- 2. Aronica E, Boer K, Baybis M, Yu J, Crino PB (2007) Co‐expression of cyclin d1 and phosphorylated ribosomal s6 proteins in hemimegalencephaly. Acta Neuropathol 114:287–293. [DOI] [PubMed] [Google Scholar]
- 3. Aronica E, Boer K, Becker A, Redeker S, Spliet WG, Van Rijen PC et al (2008) Gene expression profile analysis of epilepsy‐associated gangliogliomas. Neuroscience 151:272–292. [DOI] [PubMed] [Google Scholar]
- 4. Astrinidis A, Henske EP (2005) Tuberous sclerosis complex: linking growth and energy signaling pathways with human disease. Oncogene 24:7475–7481. [DOI] [PubMed] [Google Scholar]
- 5. Barkovich AJ, Kuzniecky RI, Jackson GD, Guerrini R, Dobyns WB (2005) A developmental and genetic classification for malformations of cortical development. Neurology 65:1873–1887. [DOI] [PubMed] [Google Scholar]
- 6. Baybis M, Yu J, Lee A, Golden JA, Weiner H, McKhann G 2nd et al (2004) mTOR cascade activation distinguishes tubers from focal cortical dysplasia. Ann Neurol 56:478–487. [DOI] [PubMed] [Google Scholar]
- 7. Becker AJ, Lobach M, Klein H, Normann S, Nothen MM, Von Deimling A et al (2001) Mutational analysis of TSC1 and TSC2 genes in gangliogliomas. Neuropathol Appl Neurobiol 27:105–114. [DOI] [PubMed] [Google Scholar]
- 8. Becker AJ, Blumcke I, Urbach H, Hans V, Majores M (2006) Molecular neuropathology of epilepsy‐associated glioneuronal malformations. J Neuropathol Exp Neurol 65:99–108. [DOI] [PubMed] [Google Scholar]
- 9. Bellacosa A, Kumar CC, Di Cristofano A, Testa JR (2005) Activation of AKT kinases in cancer: implications for therapeutic targeting. Adv Cancer Res 94:29–86. [DOI] [PubMed] [Google Scholar]
- 10. Bhaskar PT, Hay N (2007) The two TORCs and Akt. Dev Cell 12:487–502. [DOI] [PubMed] [Google Scholar]
- 11. Blumcke I, Wiestler OD (2002) Gangliogliomas: an intriguing tumor entity associated with focal epilepsies. J Neuropathol Exp Neurol 61:575–584. [DOI] [PubMed] [Google Scholar]
- 12. Blumcke I, Giencke K, Wardelmann E, Beyenburg S, Kral T, Sarioglu N et al (1999) The CD34 epitope is expressed in neoplastic and malformative lesions associated with chronic, focal epilepsies. Acta Neuropathol 97:481–490. [DOI] [PubMed] [Google Scholar]
- 13. Blumcke I, Lobach M, Wolf HK, Wiestler OD (1999) Evidence for developmental precursor lesions in epilepsy‐associated glioneuronal tumors. Microsc Res Tech 46:53–58. [DOI] [PubMed] [Google Scholar]
- 14. Deb P, Sharma MC, Tripathi M, Sarat Chandra P, Gupta A, Sarkar C (2006) Expression of CD34 as a novel marker for glioneuronal lesions associated with chronic intractable epilepsy. Neuropathol Appl Neurobiol 32:461–468. [DOI] [PubMed] [Google Scholar]
- 15. Derouiche A, Frotscher M (2001) Peripheral astrocyte processes: monitoring by selective immunostaining for the actin‐binding ERM proteins. Glia 36:330–341. [DOI] [PubMed] [Google Scholar]
- 16. ECTS C (1993) Identification and characterization of the tuberous sclerosis gene on chromosome 16. The European Chromosome 16 Tuberous Sclerosis Consortium. Cell 75:1305–1315. [DOI] [PubMed] [Google Scholar]
- 17. El‐Hashemite N, Walker V, Zhang H, Kwiatkowski DJ (2003) Loss of Tsc1 or Tsc2 induces vascular endothelial growth factor production through mammalian target of rapamycin. Cancer Res 63:5173–5177. [PubMed] [Google Scholar]
- 18. Engel JJ (1993) Outcome with respect to epileptic seizures. In: Surgical Treatment of the Epilepsies. Engel JJ (ed.), pp. 609–621. Raven Press: New York. [Google Scholar]
- 19. Fassunke J, Majores M, Tresch A, Niehusmann P, Grote A, Schoch S, Becker AJ (2008) Array analysis of epilepsy‐associated gangliogliomas reveals expression patterns related to aberrant development of neuronal precursors. Brain 131:3034–3050. [DOI] [PubMed] [Google Scholar]
- 20. Fauser S, Becker A, Schulze‐Bonhage A, Hildebrandt M, Tuxhorn I, Pannek HW et al (2004) CD34‐immunoreactive balloon cells in cortical malformations. Acta Neuropathol 108:272–278. [DOI] [PubMed] [Google Scholar]
- 21. Ferrier CH, Aronica E, Leijten FS, Spliet WG, Van Huffelen AC, Van Rijen PC, Binnie CD (2006) Electrocorticographic discharge patterns in glioneuronal tumors and focal cortical dysplasia. Epilepsia 47:1477–1486. [DOI] [PubMed] [Google Scholar]
- 22. Han S, Santos TM, Puga A, Roy J, Thiele EA, McCollin M et al (2004) Phosphorylation of tuberin as a novel mechanism for somatic inactivation of the tuberous sclerosis complex proteins in brain lesions. Cancer Res 64:812–816. [DOI] [PubMed] [Google Scholar]
- 23. Hoischen A, Ehrler M, Fassunke J, Simon M, Baudis M, Landwehr C et al (2008) Comprehensive characterization of genomic aberrations in gangliogliomas by CGH, array‐based CGH and interphase FISH. Brain Pathol 18:326–337. [DOI] [PMC free article] [PubMed] [Google Scholar]
- 24. Holmes GL, Stafstrom CE, Tuberous Sclerosis Study Group (2007) Tuberous sclerosis complex and epilepsy: recent developments and future challenges. Epilepsia 48:617–630. [DOI] [PubMed] [Google Scholar]
- 25. Johnson MW, Miyata H, Vinters HV (2002) Ezrin and moesin expression within the developing human cerebrum and tuberous sclerosis‐associated cortical tubers. Acta Neuropathol 104:188–196. [DOI] [PubMed] [Google Scholar]
- 26. Jozwiak J, Wlodarski P (2006) Hamartin and tuberin modulate gene transcription via beta‐catenin. J Neurooncol 79:229–234. [DOI] [PubMed] [Google Scholar]
- 27. Kwiatkowski DJ (2003) Tuberous sclerosis: from tubers to mTOR. Ann Hum Genet 67:87–96. [DOI] [PubMed] [Google Scholar]
- 28. Kwiatkowski DJ, Manning BD (2005) Tuberous sclerosis: a GAP at the crossroads of multiple signaling pathways. Hum Mol Genet 14(Spec No 2):R251–R258. [DOI] [PubMed] [Google Scholar]
- 29. Lamb RF, Roy C, Diefenbach TJ, Vinters HV, Johnson MW, Jay DG, Hall A (2000) The TSC1 tumour suppressor hamartin regulates cell adhesion through ERM proteins and the GTPase Rho. Nat Cell Biol 2:281–287. [DOI] [PubMed] [Google Scholar]
- 30. Lecuona E, Luquin S, Avila J, Garcia‐Segura LM, Martin‐Vasallo P (1996) Expression of the beta 1 and beta 2(AMOG) subunits of the Na,K‐ATPase in neural tissues: cellular and developmental distribution patterns. Brain Res Bull 40:167–174. [DOI] [PubMed] [Google Scholar]
- 31. Ljungberg MC, Bhattacharjee MB, Lu Y, Armstrong DL, Yoshor D, Swann JW et al (2006) Activation of mammalian target of rapamycin in cytomegalic neurons of human cortical dysplasia. Ann Neurol 60:420–429. [DOI] [PubMed] [Google Scholar]
- 32. Louis DN, Ohgaki H, Wiestler OD, Cavanee WK (2007) WHO Classification of Tumours of the Central Nervous System. IARC: Lyon. [DOI] [PMC free article] [PubMed] [Google Scholar]
- 33. Majores M, Schick V, Engels G, Fassunke J, Elger CE, Schramm J et al (2005) Mutational and immunohistochemical analysis of ezrin‐, radixin‐, moesin (ERM) molecules in epilepsy‐associated glioneuronal lesions. Acta Neuropathol 110:537–546. [DOI] [PubMed] [Google Scholar]
- 34. Majores M, Von Lehe M, Fassunke J, Schramm J, Becker AJ, Simon M (2008) Tumor recurrence and malignant progression of gangliogliomas. Cancer 113:3355–3363. [DOI] [PubMed] [Google Scholar]
- 35. Mak BC, Kenerson HL, Aicher LD, Barnes EA, Yeung RS (2005) Aberrant beta‐catenin signaling in tuberous sclerosis. Am J Pathol 167:107–116. [DOI] [PMC free article] [PubMed] [Google Scholar]
- 36. McClatchey AI (2003) Merlin and ERM proteins: unappreciated roles in cancer development? Nat Rev Cancer 3:877–883. [DOI] [PubMed] [Google Scholar]
- 37. Meikle L, Talos DM, Onda H, Pollizzi K, Rotenberg A, Sahin M et al (2007) A mouse model of tuberous sclerosis: neuronal loss of Tsc1 causes dysplastic and ectopic neurons, reduced myelination, seizure activity, and limited survival. J Neurosci 27:5546–5558. [DOI] [PMC free article] [PubMed] [Google Scholar]
- 38. Miyata H, Chiang AC, Vinters HV (2004) Insulin signaling pathways in cortical dysplasia and TSC‐tubers: tissue microarray analysis. Ann Neurol 56:510–519. [DOI] [PubMed] [Google Scholar]
- 39. Mizuguchi M, Takashima S, Yamanouchi H, Nakazato Y, Mitani H, Hino O (2000) Novel cerebral lesions in the Eker rat model of tuberous sclerosis: cortical tuber and anaplastic ganglioglioma. J Neuropathol Exp Neurol 59:188–196. [DOI] [PubMed] [Google Scholar]
- 40. Morris HH, Matkovic Z, Estes ML, Prayson RA, Comair YG, Turnbull J et al (1998) Ganglioglioma and intractable epilepsy: clinical and neurophysiologic features and predictors of outcome after surgery. Epilepsia 39:307–313. [DOI] [PubMed] [Google Scholar]
- 41. Nolan MA, Sakuta R, Chuang N, Otsubo H, Rutka JT, Snead OC 3rd et al (2004) Dysembryoplastic neuroepithelial tumors in childhood: long‐term outcome and prognostic features. Neurology 62:2270–2276. [DOI] [PubMed] [Google Scholar]
- 42. Paglini G, Kunda P, Quiroga S, Kosik K, Caceres A (1998) Suppression of radixin and moesin alters growth cone morphology, motility, and process formation in primary cultured neurons. J Cell Biol 143:443–455. [DOI] [PMC free article] [PubMed] [Google Scholar]
- 43. Pagliusi SR, Schachner M, Seeburg PH, Shivers BD (1990) The Adhesion Molecule on Glia (AMOG) is widely expressed by astrocytes in developing and adult mouse brain. Eur J Neurosci 2:471–480. [DOI] [PubMed] [Google Scholar]
- 44. Pullen N, Thomas G (1997) The modular phosphorylation and activation of p70s6k. FEBS Lett 410:78–82. [DOI] [PubMed] [Google Scholar]
- 45. Samadani U, Judkins AR, Akpalu A, Aronica E, Crino PB (2007) Differential cellular gene expression in ganglioglioma. Epilepsia 48:646–653. [DOI] [PubMed] [Google Scholar]
- 46. Scheidenhelm DK, Cresswell J, Haipek CA, Fleming TP, Mercer RW, Gutmann DH (2005) Akt‐dependent cell size regulation by the adhesion molecule on glia occurs independently of phosphatidylinositol 3‐kinase and Rheb signaling. Mol Cell Biol 25:3151–3162. [DOI] [PMC free article] [PubMed] [Google Scholar]
- 47. Schick V, Majores M, Engels G, Hartmann W, Elger CE, Schramm J et al (2007) Differential Pi3K‐pathway activation in cortical tubers and focal cortical dysplasias with balloon cells. Brain Pathol 17:165–173. [DOI] [PMC free article] [PubMed] [Google Scholar]
- 48. Schick V, Majores M, Koch A, Elger CE, Schramm J, Urbach H, Becker AJ (2007) Alterations of phosphatidylinositol 3‐kinase pathway components in epilepsy‐associated glioneuronal lesions. Epilepsia 48(Suppl. 5):65–73. [DOI] [PubMed] [Google Scholar]
- 49. Senner V, Schmidtpeter S, Braune S, Puttmann S, Thanos S, Bartsch U et al (2003) AMOG/beta2 and glioma invasion: does loss of AMOG make tumour cells run amok? Neuropathol Appl Neurobiol 29:370–377. [DOI] [PubMed] [Google Scholar]
- 50. Sosunov AA, Wu X, Weiner HL, Mikell CB, Goodman RR, Crino PD, McKhann GM 2nd (2008) Tuberous sclerosis: a primary pathology of astrocytes? Epilepsia 49(Suppl. 2):53–62. [DOI] [PubMed] [Google Scholar]
- 51. Takahashi A, Hong SC, Seo DW, Hong SB, Lee M, Suh YL (2005) Frequent association of cortical dysplasia in dysembryoplastic neuroepithelial tumor treated by epilepsy surgery. Surg Neurol 64:419–427. [DOI] [PubMed] [Google Scholar]
- 52. Van Slegtenhorst M, De Hoogt R, Hermans C, Nellist M, Janssen B, Verhoef S et al (1997) Identification of the tuberous sclerosis gene TSC1 on chromosome 9q34. Science 277:805–808. [DOI] [PubMed] [Google Scholar]
- 53. Van Veelen CW, Debets RM, Van Huffelen AC, Van Emde Boas W, Binnie CD, Storm van Leeuwen W et al (1990) Combined use of subdural and intracerebral electrodes in preoperative evaluation of epilepsy. Neurosurgery 26:93–101. [DOI] [PubMed] [Google Scholar]
- 55. Wolf HK, Wiestler OD (1999) Malformative and neoplastic glioneuronal lesions in patients with chronic pharmacoresistant epilepsies. Adv Neurol 81:69–79. [PubMed] [Google Scholar]
- 54. Wolf HK, Wellmer J, Muller MB, Wiestler OD, Hufnagel A, Pietsch T (1995) Glioneuronal malformative lesions and dysembryoplastic neuroepithelial tumors in patients with chronic pharmacoresistant epilepsies. J Neuropathol Exp Neurol 54:245–254. [DOI] [PubMed] [Google Scholar]