

Abstract
Down syndrome (DS), a high‐incidence genetic pathology, involves brain hypoplasia and mental retardation. Emerging evidence suggests that reduced neurogenesis may be a major determinant of brain underdevelopment in DS. To establish whether it is possible to improve neurogenesis in DS, Ts65Dn mice—the most widely used model for DS—and euploid mice were treated with control or lithium chow for 1 month. During the last 3 days animals received one daily injection of 5‐bromo‐2‐deoxyuridine (BrdU)—a marker of proliferating cells—and were sacrificed 24 h after the last injection. Neurogenesis was examined in the subventricular zone (SVZ), a region that retains a neurogenic potential across life. We found that Ts65Dn mice had less (−40%) BrdU+ cells than euploid mice, indicating severe proliferation impairment. Treatment with lithium increased the number of Brdu+ cells in both euploid and Ts65Dn mice. In the latter the number of Brdu+ cells became similar to that of untreated euploid mice. Our study shows that lithium is able to restore cell proliferation in the SVZ of the Ts65Dn mouse and point at treatments with mood stabilizers as a potential tool to improve neurogenesis in patients with DS.
Keywords: mental retardation, neurogenesis, therapy, trisomy 21
INTRODUCTION
Down syndrome (DS; trisomy 21) is the most frequent genetic cause of mental retardation and most common autosomal aneuploidy compatible with postnatal survival (22). DS occurs in 1 out of 700–1000 (33) live births, and is usually the result of undisjunction in meiosis. DS traits include dysmorphic features, which collectively constitute its distinctive physical phenotype, endocardial and immunological defects, hematological and endocrine abnormalities, behavioral deficits and mental retardation (33).
Although most of the aforementioned clinical features may be inconsistent in their occurrence, mental retardation remains the invariable hallmark of DS. Mental retardation has been related to the decreased overall brain size of DS individuals. Brain hypotrophy is particularly prominent in the cerebral hemispheres, frontal lobe, temporal cortex, hippocampus and cerebellum 1, 2, 12, 24, 31, 36, 37, 42, 44, 47, 48. The brain volume reduction arises early in development, as it is seen in children and even fetuses with DS 18, 31, 37, 42, 47, suggesting that it may be underpinned by defects in neuron formation.
To overcome the difficulties related to the study of the mechanisms underlying DS in human subjects, animal models have been developed. The Ts65Dn mouse, characterized by segmental trisomy for a distal region of chromosome 16—a region that shows perfectly conserved linkage with human chromosome 21 (11), is one of the most widely used models for DS. Recent evidence obtained in the Ts65Dn mouse clearly demonstrates that neurogenesis is severely impaired in the fetal ventricular zone (VZ) and hippocampus (6), in the hippocampus and cerebellum of neonate mice 9, 10, two structures with a prominent postnatal neurogenesis. Corresponding neurogenesis impairment has been recently documented by our group in the hippocampus and ventricular germinal matrix of fetuses with DS 9, 19. There are at present no therapeutic strategies able to correct mental retardation in DS, the most invalidating aspect of this pathology. It is likely that interventions that are able to improve the widespread neurogenesis impairment in the DS brain would result in improvement in the cognitive capacity of individuals with DS. A wealth of studies has shown that the process of neurogenesis can be modulated by a number of determinants. Interestingly, accumulating evidence in rodents shows that antidepressants increase neurogenesis in neurogenic zones of the adult brain. In addition, a recent study has shown that chronic treatment with fluoxetine is able to increase neurogenesis in the hippocampal dentate gyus of adult Ts65Dn mice (8). This raises the exciting possibility of pharmacologically improving neurogenesis with drugs that are usable by humans, to correct brain pathologies characterized by reduced neuron production/neurodegeneration. It has been recently demonstrated that lithium, a mood stabilizer commonly used in the treatment of mood disorders, markedly increases neurogenesis in the adult dentate gyrus of normal adult mice (28). The present study was undertaken to establish whether lithium ameliorates neurogenesis in the adult Ts65Dn mouse. We have examined neurogenesis in the subventricular zone (SVZ), a region that during fetal life produces principal neurons and interneurons that will populate the cortical mantle, and is characterized by ongoing neurogenesis throughout animal life (5).
METHODS
Ts65Dn mouse
Colony
Female Ts65Dn mice carrying a partial trisomy of chromosome 16 (32) were obtained from Jackson Laboratories (Bar Harbour, ME, USA) and maintained on the original genetic background by mating them to C57BL/6JEi x C3SnHeSnJ (B6EiC3) F1 males. Animals were karyotyped by real‐time quantitative polymerase chain reaction (qPCR) as previously described (26). Genotyping was validated with fluorescent in situ hybridization (40). The day of birth was designed as postnatal day (P) zero. Animals were reared in groups of three per cage. A total of 12 mice were used. The animal's health and comfort were veterinary controlled. The animals had access to water and food ad libitum and lived in a room with a 12:12 h dark/light cycle. Experiments were performed in accordance with the Italian and European Community law for the use of experimental animals and were approved by Bologna University Bioethical Committee. In this study all efforts were made to minimize animal suffering and to keep to a minimum the number of animals used.
Experimental protocol
Starting from the age of 12 months, euploid (n = 3) and Ts65Dn (n = 3) females were treated with lithium, administered through the food pellets (2.4 g/kg of Li2CO3) for 1 month [see (7)]. Age‐matched euploid (n = 3) at Ts65Dn (n = 3) females were used as controls. The weight of the animals was monitored at the beginning and at the end of treatment with lithium. In agreement with previous evidence (34), Ts65Dn mice had a lower body weight than controls (Table 1). No significant differences in the body weight were found in either euploid or Ts65Dn mice after treatment with lithium (Table 1). During the last 3 days animals of all groups received a daily intraperitoneal injection (150 µg/g body weight) of 5‐bromo‐2‐deoxyuridine (BrdU; Sigma, St. Louis, MO, USA), a marker of proliferating cells and their progeny (29) in 0.9% NaCl solution. Animals were sacrificed 24 h after the last BrdU injection (Figure 1).
Table 1.
Weights of the experimental groups. Abbreviations: NS = not significant (Duncan's test after analysis of variance); SD = standard deviation.
| Mean | SD | Mean | SD | P | ||||
|---|---|---|---|---|---|---|---|---|
| Euploid | 32.25 | ± | 4.12 | Euploid + Li | 32.72 | ± | 4.46 | NS |
| Ts65Dn | 26.75 | ± | 0.95 | Ts65Dn + Li | 26.52 | ± | 0.84 | NS |
| P | * | * |
P < 0.05.
Body weight (mean ± SD) in grams of euploid and Ts65Dn mice untreated and treated with lithium.
Figure 1.
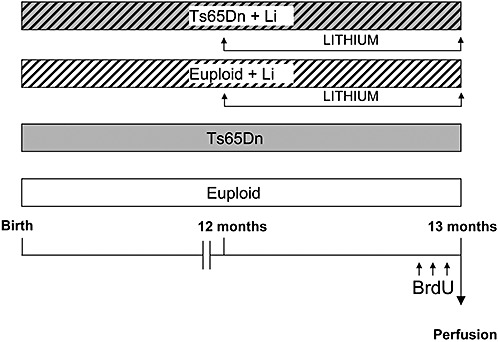
Experimental protocol. Starting from the age of 12 months, euploid (n = 3) and Ts65Dn (n = 3) mice were treated with lithium, administered through the food pellets for 1 month. Age‐matched euploid (n = 3) at Ts65Dn (n = 3) animals were used as controls. During the last 3 days animals of all groups received a daily intraperitoneal injection (150 µg/g body weight) of BrdU and were sacrificed 24 h after the last BrdU injection.
Histological procedures
Animals were deeply anesthetized with ether and transcardially perfused with saline, followed by 4% paraformaldehyde in 100 mM phosphate buffer, pH 7.4. Brains were stored in the fixative for 24 h and then kept in 18% sucrose in phosphate buffer for additional 24 h. Hemispheres were cut along the midline and stored at −80°C. Frozen samples of each hemisphere were cut with a freezing microtome in 30‐µm‐thick coronal sections and serially collected in phosphate‐buffered saline (PBS). For analysis of cell proliferation in the SVZ, sections were sampled within a region that started at the rostral pole of the lateral ventricle and stretched for approximately 1200 µm going in the caudal direction. The rostral and caudal borders of this region approximately correspond to +1.18 mm and +0.02 mm planes, respectively, of Franklin and Paxinos atlas of the mouse brain (17). For analysis of cell proliferation in the rostral migratory stream (RMS), sections were sampled within a region that started at the rostral pole of the lateral ventricle and stretched for approximately 900 µm in the rostral direction. Each histologic procedure (see further discussion) was carried out in one out of six sections. As, with this sampling scheme, we had a total of 36–40 (30‐µm thick) sections that covered the SVZ and, consequently a maximum of six series of six sections available; we also used, in addition to the right hemisphere, the left hemisphere for some procedures in the SVZ (see following discussion).
BrdU immunohistochemistry
One out of the six sections from the right hemisphere was processed for BrdU immunohistochemistry. Free‐floating sections were permeabilized with 0.1% Triton X‐100 in PBS for 30 minutes, denatured in 2 N HCl for 30 minutes at 37°C, rinsed in 0.1 M boric acid, pH 8.5, at room temperature for 20 minutes and washed in 0.1% Triton X‐100 and PBS three times, blocked for 1 h in 1% BSA in 0.1% Triton X‐100 and PBS, incubated overnight at 4°C with a rat monoclonal anti‐BrdU antibody (AbD Serotec, Düsseldorf, Germany), diluted 1:100 in 0.1% Triton X‐100 in PBS. Sections were then incubated for 2 h with an anti‐rat immunoglobulin G (IgG) Cy3 conjugated secondary antibody (Jackson Immunoresearch, West Grove, PA, USA), diluted 1:100 in 0.1% Triton X‐100 in PBS and 1% BSA, and rinsed in 0.1% Triton X‐100 in PBS for 30 minutes. Fluorescent images were taken with an Eclipse TE 2000‐S microscope (Nikon, Tokyo, Japan) equipped with an AxioCam MRm (Zeiss, Oberkochen, Germany) digital camera.
Double‐fluorescence immunohistochemistry
To characterize the phenotype of the proliferating cells, one out of six sections from the SVZ of the right hemisphere was double‐labeled with an antibody to BrdU and an antibody to: (i) polysialylated neural cell adhesion molecule (PSA‐NCAM), expressed by type A cells; or (ii) glial fibrillary acidic protein (GFAP), expressed by type B cells (14). Ki‐67 is an antibody that reacts with an antigen appearing in cell nuclei in G1, S, G2 and M phases of the cell cycle 35, 38, 39. To establish the fraction of BrdU‐positive (BrdU+) cells vs. the population of cycling cells present in the SVZ, one out of six sections from the left hemisphere was double‐labeled with an antibody to BrdU and an antibody to Ki‐67. Free‐floating sections were permeabilized with 0.1% Triton X‐100 in PBS for 30 minutes, denatured in 2 N HCl for 30 minutes at 37°C, rinsed in 0.1 M boric acid, pH 8.5, at room temperature for 20 minutes and then washed in 0.1% Triton X‐100 and PBS three times, blocked for 1 h in 1% BSA in 0.1% Triton X‐100 and PBS. For double‐fluorescence immunostaining, sections were incubated overnight at 4°C with a primary antibody, rat monoclonal anti‐BrdU antibody (AbD Serotec), diluted 1:100 in 0.1% Triton X‐100 in PBS and one of the following primary antibodies: (i) rabbit polyclonal anti‐Ki‐67 antibody (GeneTex), diluted 1:100 in 0.1% Triton X‐100 in PBS; (ii) mouse monoclonal anti‐PSA‐NCAM antibody (Chemicon), diluted 1:200 in 0.1% Triton X‐100 in PBS; or (iii) mouse monoclonal anti‐GFAP (Sigma), diluted 1:400 in 0.1% Triton X‐100 in PBS. Sections were then washed in 0.1% Triton X‐100 in PBS for 40 minutes and incubated for 2 h with an anti‐rat IgG Cy3 conjugated (1:100) (Jackson Immunoresearch) secondary fluorescent antibody, for BrdU immunoistochemistry and one of the following secondary fluorescent antibodies: (i) anti‐rabbit IgG FITC conjugated (1:100) (Sigma) for Ki‐67 immunoistochemistry; (ii) anti‐mouse IgM FITC conjugated (1:100) (Sigma) for PSA‐NCAM immunoistochemistry; or (iii) anti‐mouse IgG FITC conjugated (1:100) (Sigma) for GFAP immunoistochemistry. Fluorescent images of the double‐labeled sections were taken with a Leica TCS confocal microscope (Leica Microsystems, Wetzlar, Germany).
Phospho‐histone H3 and cleaved caspase–3 immunohistochemistry
One out of six sections, from the SVZ of the left hemisphere, was processed for phospho‐histone H3 (pHH3) or cleaved caspase‐3 immunohistochemistry. Free‐floating sections were permeabilized with 0.1% Triton X‐100 in PBS for 30 minutes, blocked for 1 h in 3% BSA in 0.1% Triton X‐100 and PBS, incubated overnight at 4°C with a primary antibody: rabbit polyclonal anti‐phospho‐histone H3 antibody (Upstate Cell Signaling, Lake Placid, NY, USA), diluted 1:100 in 0.1% Triton X‐100 in PBS, or rabbit cleaved caspase‐3 (Asp 175) antibody (Cell Signaling Technology, Danvers, MA, USA), diluted 1:200 in 3% BSA in 0.1% Triton X‐100 and PBS. Sections were washed in 0.1% Triton X‐100 in PBS for 40 minutes and incubated for 2 h with a secondary antibody, anti‐rabbit IgG FITC conjugated (1:100) (Sigma) diluted in 0.1% Triton X‐100 in PBS and 3% BSA, rinsed in 0.1% Triton X‐100 in PBS for 30 minutes.
Nissl method
One out of six sections from the SVZ of the right hemisphere was stained with Toluidin blue according to the Nissl method, for stereologic evaluation of the lateral ventricle and SVZ.
Measurements
Number of BrdU+ cells
BrdU+ cells in the SVZ were counted in sections processed for BrdU immunohistochemistry (six sections) and double‐fluorescence immunohistochemistry for BrdU and Ki‐67 (six sections), BrdU and PSA‐NCAM (six sections), and BrdU and GFAP (six sections). BrdU+ cells in the RMS were counted in sections processed for BrdU immunohistochemistry (five sections). The total number of BrdU+ cells was estimated by multiplying the number counted in the series of sampled sections by the inverse of the section sampling fraction (SSF = 1/6).
Number of Ki‐67‐positive cells
Sections from the SVZ double‐labeled for Ki‐67 and BrdU (six sections) were analyzed for the expression of Ki‐67, co‐expression of Ki‐67 and BrdU, expression of Ki‐67 only and expression of BrdU only. The total number of cells was estimated by multiplying the number counted in the series of sampled sections by the inverse of the SSF (SSF = 1/6).
Analysis of phenotypes
Sections from the SVZ double‐labeled for BrdU and either PSA‐NCAM or GFAP were analyzed for the co‐expression of either BrdU/PSA‐NCAM or BrdU/GFAP. The total number of cells of each phenotype was estimated by multiplying the number counted in the series of sections by the inverse of the SSF (SSF = 1/6). The number of cells of undetermined phenotype was calculated by subtracting from total number of BrdU+ cells the number of BrdU/PSA‐NCAM‐positive cells plus the number of BrdU/GFAP‐positive cells. The number of cells of each phenotype was then divided by total number of BrdU+ cells to estimate the percentage of cells that were labeled with PSA‐NCAM, GFAP or neither of these markers.
Number of apoptotic cells
Apoptotic death in the SVZ was estimated by counting cleaved caspase‐3‐positive cells. The total number of apoptotic cells was estimated by multiplying the number counted in the series of sections by the inverse of the SSF (SSF = 1/6).
Number of pHH3‐positive cells
pHH3‐positive cells in the SVZ were counted in one out of six sections, in a series covering the whole sampled region. The number of cells in either G2 or M phase (cells in early plus cells in late M phase) of cell cycle was expressed as percent of the total number of pHH3‐positive cells.
Stereology of the ventricle and SVZ
The following stereology system was used: (i) optical microscope (Leitz) equipped with a motorized stage and focus control system; (ii) color digital video camera attached to the microscope trinocular tube; (iii) Image Pro Plus (Media Cybernetics, Silver Spring, MD, USA) with the StagePro module for controlling the motorized stage, as primary software. In the series of Nissl‐stained sections from the SVZ, the area (A) of the ventricle was measured by tracing its contours on video images displayed on computer. The volume of the ventricle was determined according to Cavalieri's principle (45), by multiplying the sum of the cross sectional areas by the spacing T between sampled sections (T = 180 µm). In each sampled section we additionally measured the length of the lateral wall of the ventricle and the thickness of the SVZ at four to five locations along the longitudinal extent of the lateral wall.
Statistical analysis
Results are presented as the mean ± standard deviation of the mean. Data from single animals were the unity of analysis. Statistical testing was performed with ANOVA followed by post hoc comparisons with Duncan's test. A probability level of P < 0.05 was considered to be statistically significant.
RESULTS
Pattern of the rostral horn of the lateral ventricle and SVZ in euploid and Ts65Dn mice untreated and treated with lithium
The SVZ is a layer next to the ependymal lining and is most evident in the lateral wall of the lateral ventricle (14). In the current study we examined the SVZ at the level of the rostral horn of the lateral ventricle (see Methods). Observation of coronal sections from Ts65Dn and euploid mice, taken at the same rostrocaudal level, showed that the lumen of the ventricle was notably smaller in Ts65Dn mice because of the obliteration of the inferior part of the ventricle (Figure 2A,B). The lateral wall, in the region where the ventricle was obliterated, appeared to be devoid of SVZ (Figure 2B, region enclosed by the white rectangle). Volume measurements showed that the volume of the ventricle was notably reduced (−49%) in Ts65Dn compared with that in euploid mice (Figure 2I). In both euploid and Ts65Dn mice treatment with lithium did not affect the volume of the ventricle (Figure 2C,D,I).
Figure 2.
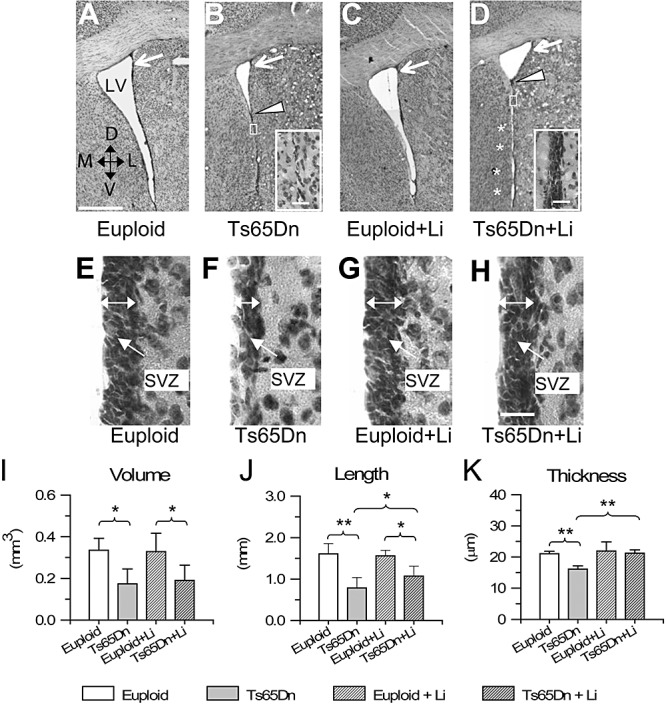
A–E. Pattern of the lateral ventricle and subventricular zone (SVZ). Examples of Nissl‐stained sections at the level of the rostral portion of the lateral ventricle (LV) in an untreated euploid mouse (A), an untreated Ts65Dn mouse (B), a euploid mouse treated with lithium (C) and a Ts65Dn mouse treated with lithium (D). The plane of the section roughly corresponds to plane +0.50 of Franklin and Paxinos atlas (16). Note that the lumen of the ventricle is largely obliterated in the Ts65Dn mouse (region below the arrowhead). The insets in B and D show a portion of the ventricle where the lumen is obliterated (region enclosed by the rectangle) at a higher magnification. Note the absence of a SVZ in the untreated Ts65Dn mouse (B) and the appearance of a SVZ after treatment with lithium. The asterisks in D indicate small apertures in the obliterated ventricle. E–H. Higher magnification images of the lateral wall of the LV, at the level indicated by the white arrows in A–D in an untreated euploid mouse (E), an untreated Ts65Dn mouse (F), a euploid mouse treated with lithium (G) and a Ts65Dn mouse treated with lithium (H). The double‐headed arrows indicate the SVZ. Calibration in A = 500 µm, applies to A–D. Calibration in the insets in B,D = 25 µm. Calibration in H = 20 µm, applies to E–H. I–K. Stereology of the LV and SVZ. Volume of the LV (I), length of the lateral wall of the ventricle (J) and thickness of the SVZ (K) in untreated euploid and Ts65Dn mice, and in euploid and Ts65Dn mice treated with lithium. *P < 0.05; **P < 0.01 (Duncan's test after analysis of variance). Abbreviations: D = dorsal; L = lateral; M = medial; V = ventral.
In agreement with the reduced ventricular volume, the length of the lateral wall of the ventricle was significantly smaller (−52%) in Ts65Dn vs. euploid mice (Figure 2J). Whereas in euploid mice the length of the lateral wall was not affected by treatment with lithium, in Ts65Dn mice treated with lithium it underwent a slight increase (Figure 2J), because of the appearance of small apertures in the obliterated region (Figure 2D, asterisks). The SVZ of the lateral ventricle in euploid mice was formed by four to five rows of cells and was 21 ± 0.73‐µm thick (Figure 2E,K). In contrast, in Ts65Dn mice it was formed by three to four rows of cells and was only 16 ± 1.02‐µm thick (Figure 2F,K). Treatment with lithium did not change the thickness of the SVZ in euploid mice (Figure 2G,K). However, in treated Ts65Dn mice the thickness increased significantly compared with the untreated Ts65Dn mice and became similar to that of untreated and treated euploid mice (Figure 2H,K). In addition, in Ts65Dn mice treated with lithium, an SVZ appeared in the region where the ventricle was obliterated (Figure 2D, area enclosed by a white rectangle) and small apertures showing a SVZ interrupted the obliterated region (Figure 2D, asterisks).
Effect of lithium on proliferation rate in the SVZ and RMS of euploid and Ts65Dn mice
In the current study we evaluated cell proliferation by using BrdU immunohistochemistry. Twenty‐four hours after the three daily BrdU injections, we found numerous BrdU+ cells in the SVZ. These cells were located in the SVZ of the lateral wall of the ventricle, at the corner formed by the lateral wall and the dorsal roof of the ventricle and at the lower corner of the ventricle (Figure 3A). Qualitative observation of images from euploid and Ts65Dn mice clearly showed that Ts65Dn mice had less BrdU+ cells (Figure 3A,B). After treatment with lithium, the number of BrdU+ cells increased in both euploid and Ts65Dn mice (Figure 3C,D). In addition, in Ts65Dn mice treated with lithium, patches of BrdU+ cells appeared also in the region where the ventricular lumen was obliterated (Figure 3D, arrow). Quantification of the number of BrdU+ cells in the SVZ showed that untreated euploid mice had 3267 ± 33 BrdU+ cells and untreated Ts65Dn mice had 1912 ± 60 cells (−40%). Treatment with lithium increased the number of BrdU+ cells in either group, so that treated euploid mice had 4556 ± 340 BrdU+ cells and treated Ts65Dn mice had 3176 ± 925 cells (Figure 3E). These figures indicate that treatment with lithium increased cell proliferation by 39% in euploid mice and by 66% in Ts65Dn mice. Though Ts65Dn mice treated with lithium had less BrdU+ cells than euploid mice treated with lithium, comparison of Ts65Dn mice treated with lithium with untreated euploid mice showed no differences between groups (Figure 3E), indicating that lithium had completely restored cell proliferation in Ts65Dn mice.
Figure 3.
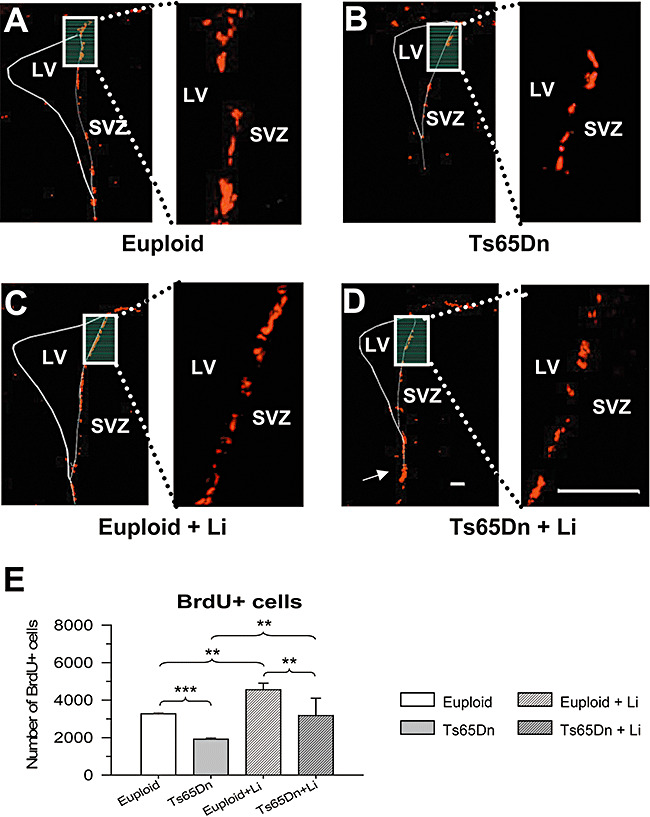
Effect of lithium on cell proliferation in the subventricular zone (SVZ) of euploid and Ts65Dn mice. A–D. Examples of sections immunostained for BrdU in an untreated euploid mouse (A), an untreated Ts65Dn mouse (B), a euploid mouse treated with lithium (C) and a Ts65Dn mouse treated with lithium (D). The white rectangle in A–D indicates the region shown at a higher magnification on the right. Brdu+ cells (red) are mainly present along the lateral wall of the ventricle. Note that in the Ts65Dn mouse treated with lithium, BrdU+ cells were present also in the region where the lateral ventricle (LV) was obliterated (D, arrow). Calibrations in D apply to A–D: calibration of low magnification images = 200 µm; calibration of high magnification images = 120 µm. E. Number of BrdU+ cells in untreated euploid and Ts65Dn mice and euploid and Ts65Dn mice treated with lithium. **P < 0.01; ***P < 0.001 (Duncan's test after analysis of variance).
We examined the effect of treatment with lithium in the RMS, because neuroblasts born in the SVZ retain proliferative capacity during their migration in the RMS to the olfactory bulb (30). As our animals were sacrificed 4 days after the first of three daily BrdU+ injections, the RMS proximal to the SVZ may harbor, in addition to locally born BrdU+ cells, also BrdU+ cells born in the SVZ, en route to the olfactory bulb. We found numerous BrdU+ cells in the RMS of all groups. Euploid mice had 2090 ± 214 BrdU+ cells and Ts65Dn mice had 1502 ± 139 cells. Treatment with lithium increased the number of BrdU+ cells in either group, so that treated euploid mice had 2665 ± 238 BrdU+ cells and treated Ts65Dn mice had 1921 ± 216 cells. Comparison across groups showed that untreated Ts65Dn mice had significantly less BrdU+ cells in the RMS than euploid mice (P < 0.01; Ducan's test) and that treatment with lithium increased the number of BrdU+ cells in treated euploid vs. untreated euploid mice (P < 0.05; Ducan's test), and in treated Ts65Dn vs. untreated Ts65Dn mice (P < 0.05; Ducan's test). Comparison of untreated euploid mice and Ts65Dn mice treated with lithium showed no difference between groups, indicating that lithium had restored cell proliferation in the RMS of Ts65Dn mice.
Effect of lithium on the phenotype of the proliferating cells in the SVZ of euploid and Ts65Dn mice
The SVZ of adult rodents contains three major types of proliferating cells (14): type A cells, which are migrating neuroblasts; type B cells, which are cells with astrocytic phenotype; and type C cells, which are very likely precursors of neuroblasts. Among the B cells, the subpopulation of B2 cells only is actively dividing, whereas the B1 subpopulation is formed by non‐proliferating cells (14). We were interested in establishing whether the lower proliferation rate in the SVZ of Ts65Dn mice involved specific cell type/s and whether treatment with lithium enhanced the proliferation of one or more of the three different classes. To identify the phenotype of the proliferating cells we used double‐fluorescence immunohistochemistry for BrdU and either PSA‐NCAM, a marker of type A cells, or GFAP, a marker of type B cells (14).
Qualitative observation of double‐stained sections showed that untreated Ts65Dn mice had less PSA‐NCAM+/BrdU+ cells (Figure 4A,B) and less GFAP+/BrdU+ cells (Figure 4E,F) than untreated euploid mice and that treatment with lithium lead to an increase in the number of PSA‐NCAM+/BrdU+ cells (Figure 4C,D) and of GFAP+/BrdU+ cells (Figure 4G,H) in both euploid and trisomic mice. Quantification of PSA‐NCAM+/BrdU+ cells showed that whereas euploid mice had 1632 ± 196 cells, Ts65Dn mice had 914 ± 101 cells only (−44%), and quantification of GFAP+/BrdU+ cells showed that whereas euploid mice had 746 ± 69 cells, Ts65Dn mice had 392 ± 28 cells only (−48%). Treatment with lithium increased the number of PSA‐NCAM+/BrdU+ and GFAP+/BrdU+ cells in both euploid and Ts65Dn mice, so that treated euploid mice had 2635 ± 375 PSA‐NCAM+/BrdU+ cells and 1021 ± 69 GFAP+/BrdU+ cells, and treated Ts65Dn mice had 1673 ± 191 PSA‐NCAM+/BrdU+ cells (Figure 5A) and 698 ± 84 GFAP+/BrdU+ cells (Figure 5B). These figures indicate that treatment with lithium increased the number of proliferating cells of type A by 61% in euploid mice and by 83% in Ts65Dn mice and increased the number of cells of type B2 by 40% in euploid mice and by 78% in Ts65Dn mice. Comparison of Ts65Dn mice treated with lithium and untreated euploid mice showed no difference in the number of PSA‐NCAM+/BrdU+ cells (Figure 5A) and GFAP+/BrdU+ cells (Figure 5B), indicating that the treatment had completely restored in Ts65Dn mice the number of proliferating cells of type A and type B2.
Figure 4.
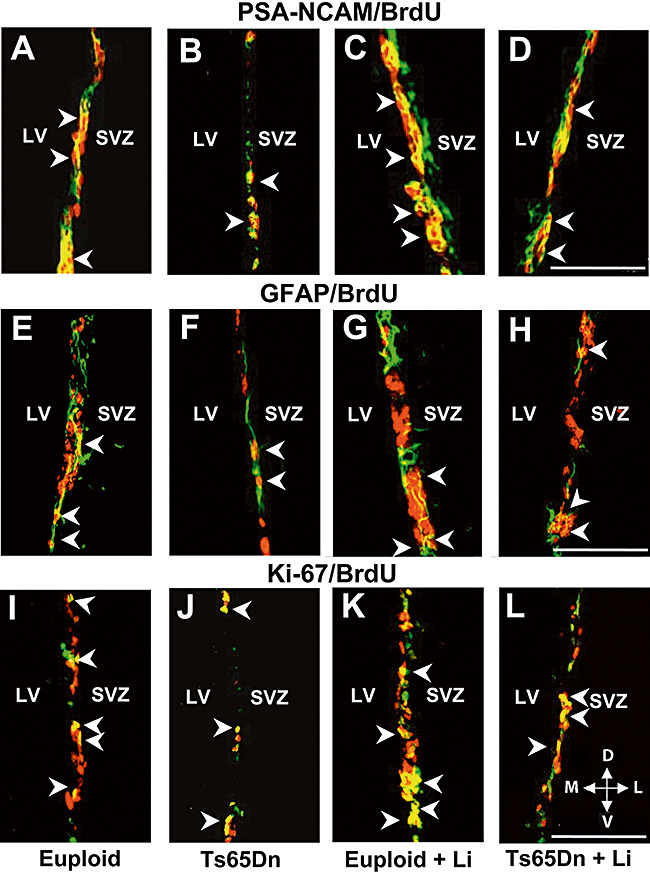
Double fluorescence immunohistochemistry. A–D: Examples of BrdU+ cells (red), PSA‐NCAM+ cells (green) and cells that are co‐labeled with BrdU and PSA‐NCAM (yellow) in the subventricular zone (SVZ) of a euploid mouse (A), a Ts65Dn mouse (B), a euploid mouse treated with lithium (C) and a Ts65Dn mouse treated with lithium (D). The arrowheads indicate some of the double‐labeled cells. E–H. Examples of BrdU+ cells (red), GFAP+ cells (green) and cells that are co‐labeled with BrdU and GFAP (yellow) in the SVZ of a euploid mouse (E), a Ts65Dn mouse (F), a euploid mouse treated with lithium (G) and a Ts65Dn mouse treated with lithium (H). The arrowheads indicate some of the double‐labeled cells. I–L. Examples of BrdU+ cells (red), Ki‐67+ cells (green) and cells that are co‐labeled with BrdU and Ki‐67 (yellow) in the SVZ of a euploid mouse (I), a Ts65Dn mouse (J), a euploid mouse treated with lithium (K) and a Ts65Dn mouse treated with lithium (L). The arrowheads indicate some of the double‐labeled cells. Calibration = 75 µm. Abbreviations: D = dorsal; GFAP = glial fibrillary acidic protein; L = lateral; LV = lateral ventricle; M = medial; PSA‐NCAM = polysialylated neural cell adhesion molecule; V = ventral.
Figure 5.
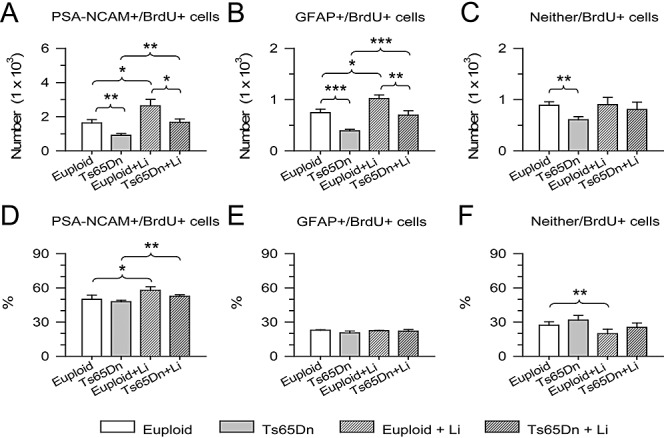
Phenotype of the proliferating cells in the subventricular zone (SVZ). Total number (A) and percentage (D) of cells co‐labeled with BrdU and PSA‐NCAM, total number (B) and percentage (E) of cells co‐labeled with BrdU and PSA‐NCAM, and total number (C) and percentage (F) of cells that did not express neither PSA‐NCAM nor GFAP. Cells expressing PSA‐NCAM correspond to type A cells, cells expressing GFAP correspond to type B2 and cells that do not express either marker are type C cells. *P < 0.05; **P < 0.01; ***P < 0.001 (Duncan's test after analysis of variance). Abbreviations: GFAP = glial fibrillary acidic protein; PSA‐NCAM = polysialylated neural cell adhesion molecule.
Cells that were BrdU+ but were not immunoreactive for either PSA‐NCAM or GFAP should mainly represent type C cells, as the other cells forming the SVZ of the adult brain (ependymal cells and tanicytes) exhibit a very low (if any) proliferation rate (14). As there are no specific markers for cells of type C, we estimated the number of type C cells by subtracting the number of cells of type A and type B2 from total number of BrdU+ cells. Evaluation of BrdU+ cells that were labeled neither by PSA‐NCAM nor by GFAP (neither/BrdU+ cells) showed that control mice had 890 ± 68 cells and Ts65Dn mice had 606 ± 62 cells (−32%). In euploid animals, treatment with lithium did not increase the number of this type of cells. After treatment with lithium, however, Ts65Dn mice had 805 ± 143 BrdU+ cells that were labeled neither by PSA‐NCAM nor by GFAP (Figure 5C). This corresponds to an increase of +33%, with respect to untreated Ts65Dn mice, though the difference was only marginally (P < 0.06) significant. Comparison of Ts65Dn mice treated with lithium and untreated euploid mice showed no difference in the number of cells that were labeled neither by PSA‐NCAM nor by GFAP (Figure 5C), indicating that the treatment had restored the number of proliferating cells of type C in Ts65Dn mice.
Evaluation of the percentage of cells of each phenotype showed that in euploid mice, PSA‐NCAM+/BrdU+ cells (type A) represented 50 ± 4% of total number of BrdU+ cells, GFAP+/BrdU+ cells (type B2) represented 23 ± 0.4% and the remaining cells (type C) represented 27 ± 3% (Figure 5D,E,F). In untreated Ts65Dn mice the percentage of cells of each phenotype was similar to that of euploid mice (Figure 5D,E,F). After treatment with lithium, the percentage of PSA‐NCAM+/BrdU+ cells showed a slight, but significant increase in both euploid (+15%) and Ts65Dn (+10%) mice (Figure 5D), the percentage of GFAP+/BrdU+ cells remained unchanged (Figure 5E) and the percentage of cells that were neither GFAP+ nor PSA‐NCAM+ slightly decreased (−28%) in treated euploid vs. untreated euploid mice (Figure 5F).
Effect of lithium on the size of the proliferating population in the SVZ of euploid and Ts65Dn mice
Ki‐67 is an endogenous protein expressed by proliferating cells during phases G1, S, G2 and M of the cell cycle 35, 38, 39. We used Ki‐67 immunohistochemistry, to estimate the size of the population of actively dividing cells in euploid and Ts65Dn mice and the effect of treatment with lithium on the size of this population. Sections were co‐labeled with an antibody to BrdU (Figure 4I–L) to evaluate the number of cells that were co‐labeled with Ki‐67 and BrdU, single‐labeled with Ki‐67, and single‐labeled with BrdU.
We found that untreated euploid mice had 2362 ± 296 Ki‐67+ cells and Ts65Dn mice had 1588 ± 310 cells, indicating that Ts65Dn mice had a smaller pool of proliferating cells (−33%) compared with euploid mice (Figure 6A). Treatment with lithium increased the number of Ki‐67+ cells in either group, so that treated euploid mice had 3630 ± 629 Ki‐67+ cells and treated Ts65Dn mice had 2945 ± 396 cells (Figure 6A). These figures indicate that treatment with lithium increased the pool of proliferating cells by 54% in euploid mice and by 85% in Ts65Dn mice. Comparison of Ts65Dn mice treated with lithium with untreated euploid mice showed no differences between groups (Figure 6A), indicating that lithium had restored the pool of proliferating cells in Ts65Dn mice.
Figure 6.
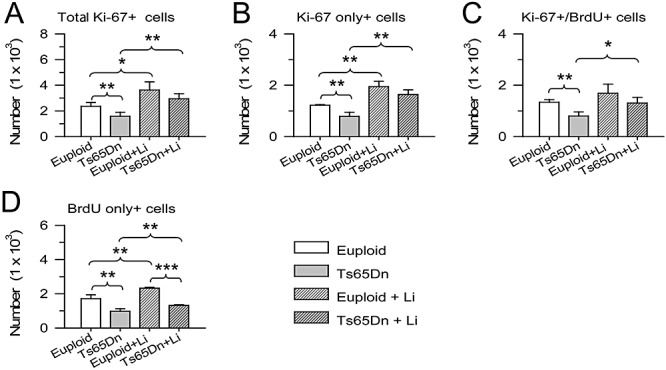
Effect of lithium on the size of the proliferating population in the subventricular zone of euploid and Ts65Dn mice. A. Total number of Ki‐67+ cells. B. Number of Ki‐67+ cells that were not co‐labeled with BrdU. C. Number of Ki‐67+ cells that were co‐labeled with BrdU. D. Number of BrdU+ cells that were not co‐labeled with Ki‐67. *P < 0.05; **P < 0.01; ***P < 0.001 (Duncan's test after analysis of variance).
In all groups, about one‐half of Ki‐67+ cells were not co‐labeled with BrdU (Figure 6B). These are the cells that were not in the S phase of the cell cycle at the time of the three BrdU injections. Among the BrdU+ cells, 40–50% were co‐labeled with Ki‐67 and the remaining cells were single‐labeled with BrdU. The cells double‐labeled with Ki‐67 and BrdU are the cells and the progeny of the cells that were in the S phase of the cell cycle during BrdU administration and had remained in the cell cycle up to the time of sacrifice (24 h after the last BrdU injection). The BrdU+ cells that were single‐labeled with BrdU are cells that were in the S phase of the cell cycle during BrdU administration and had exited the cell cycle within the time intervening between BrdU uptake and the sacrifice plus cells that at the time of sacrifice were in early G1 phase, a period in which Ki‐67 appears to be not expressed (38). We found that untreated Ts65Dn mice had less Ki‐67‐only positive cells (Figure 6B), less Ki67+/BrdU+ cells (Figure 6C) and less BrdU‐only positive cells (Figure 6D) compared with untreated euploid mice. After treatment with lithium all these cell populations underwent an increase in euploid and Ts65Dn mice, as compared with untreated euploid and Ts65Dn mice, respectively, though in the case of Ki‐67+/BrdU+ cells the difference between treated and untreated euploid mice was marginally significant (P < 0.06). These data indicate that in both Ts65Dn and euploid mice lithium increased the number of BrdU+ cells that had remained in the cell cycle as well as of BrdU+ cells that had exited the cell cycle.
Effect of lithium on phospho‐histone H3 expression in the SVZ of euploid and Ts65Dn mice
After DNA synthesis, which takes place during the S phase of cell cycle, cells pass through the G2 phase before undergoing division in the M phase. pHH3 is expressed during late G2 and mitosis (anaphase to telophase) and its nuclear pattern allows one to discriminate cells that are in the G2 and M phases of cell cycle (21) (Figure 7A; see Methods). As the G2 phase is a critical step for cell cycle progression and we found an elongation of this phase in the cerebellum of Ts65Dn mice (10), we sought to obtain information on the relative size of the populations in the G2 and M phases. We found that Ts65Dn mice had a percent number of cells in the G2 phase vs. total number of cells in G2 + M phases larger than euploid mice (Figure 7B) and a smaller number of cells in M phase (Figure 7C). Treatment with lithium decreased the percent number of cells in G2 phase and increased the percent number of cells in M phase, in both euploid and Ts65Dn mice (Figure 7B,C).
Figure 7.
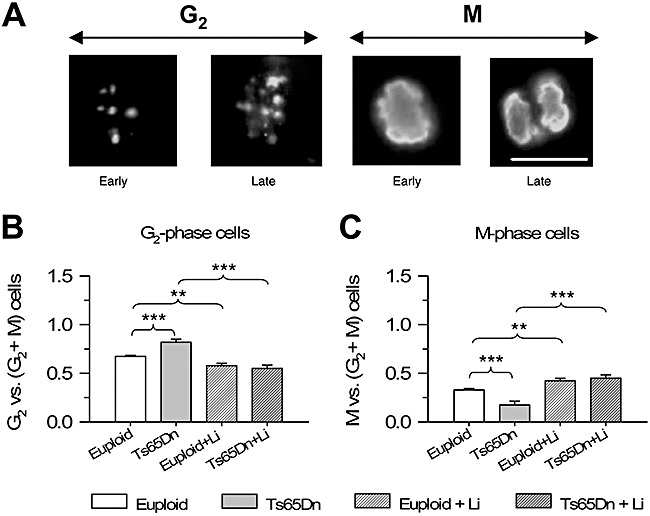
Effect of lithium on the percentage of cells in G2 and M phases of the cell cycle. A. Images of cells positive for phosphorylated‐histone‐H3 (pHH3) in the subventricular zone of a euploid mouse, showing a cell in early and late G2, early and late M phase. Cells in G2 exhibit a discontinuous pHH3 nuclear staining, cells in the early M phase exhibit a homogeneously condensed pattern and cells approaching division (late M phase) exhibit mitotic spindles. Scale bar (18 µm) applies to all the figures. B,C. Percentage of cells in G2 (B) and M (C) phases of the cell cycle with respect to total number of pHH3‐positive cells. **P < 0.01; ***P < 0.001 (Duncan's test after analysis of variance).
Effect of lithium on apoptotic cell death in the SVZ of euploid and Ts65Dn mice
Apoptotic cell death is a physiological phenomenon that contributes to establish final number of new cells in neurogenic regions. To establish the effects of lithium on apoptotic cell death, we evaluated the number of apoptotic cells in the SVZ by counting the number of cells that expressed cleaved caspase‐3, a protein that is one of the hallmarks of apoptotic death (4).
We found that the number of apoptotic cells in the sampled region was very low, with a value of 6–10 cells per section. Comparison of total number of apoptotic cells showed that untreated Ts65Dn mice had less apoptotic cells than untreated euploid mice (Figure 8). After treatment with lithium the number of apoptotic cells remained unaffected in both euploid and Ts65Dn mice as compared with that of untreated euploid and Ts65Dn mice, respectively.
Figure 8.
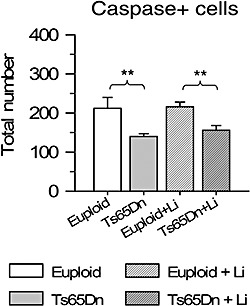
Effect of lithium on apoptotic cell death in euploid and Ts65Dn mice. Total number of cleaved caspase‐3‐positive cells in the subventricular zone of animals untreated and treated with lithium. **P < 0.01 (Duncan's test after analysis of variance).
DISCUSSION
Neurogenesis impairment in the SVZ of the adult Ts65Dn mouse
Current study shows notable proliferation impairment, as assessed by BrdU immunohistochemistry, in the SVZ (and RMS) of the adult Ts65Dn mouse. The reduced number of proliferating cells in the SVZ was not related to a greater cell death, as apoptosis was actually lower in Ts65Dn than in euploid mice. Consequently, the reduced number of cells that incorporated BrdU in Ts65Dn mice must be ascribed to defective proliferation potency.
A recent study provides evidence for reduced proliferation in the embryonic VZ of Ts65Dn mice, at early embryonic stages, but an increased proliferation in the SVZ, at later embryonic stages (6). Our findings in the SVZ of adult Ts65Dn mice are in agreement with the reduced proliferation rate found in the embryonic VZ, but are in contrast with the increased proliferation rate in the embryonic SVZ of Ts65Dn mice (6). This discrepancy may be because of the different behaviors of precursors in different regions of the VZ/SVZ, as we examined here the anterior SVZ, whereas Chakrabarti et al (6) examined the neocortical VZ/SVZ, at the level of the dorsal hippocampus. Alternatively, a dynamic change in proliferation rate in the SVZ of Ts65Dn mice across age may explain differences in proliferation potency at embryonic and adult developmental stages. We have recently found (unpublished observations) that P14‐P15 Ts65Dn mice exhibit reduced proliferation potency in the anterior SVZ, which indicates that this region is characterized by defective proliferation starting from the early postnatal period and retains this defect up to adulthood.
Analysis of the phenotype of the BrdU+ cells showed that in Ts65Dn mice all types of proliferating cells present in the SVZ exhibited reduced proliferation potency, the largest difference involving type B2 cells. These cells are thought to include the stem cells of the SVZ, which give origin to type C cells (14). The latter are rapidly dividing cells (transient amplifying) that give rise to type A cells—neuroblasts that retain proliferation capacity and migrate to the olfactory bulb. The finding that Type B2 cells were the most affected in Ts65Dn mice indicates that the trisomic condition affects more severely a population that is crucial for expansion of the SVZ.
The pool of cycling cells in the SVZ, as assessed by Ki‐67 immunohistochemistry, was notably smaller in Ts65Dn than in euploid mice. Consistent with this reduction, in Ts65Dn mice the thickness of the SVZ was notably reduced, the ventricle was partially obliterated and no SVZ was present at the site where the medial and lateral ventricular walls were fused. A reduction in the pool of proliferating cells may be the outcome of: (i) an elongated cell cycle, with consequent reduced expansion of the pool of precursors over time; and/or (ii) the loss of the capability of the stem cells to replicate and generate neural/glial precursors. Neurogenesis impairment in the embryonic neocortical and hippocampal VZ (6) and in the cerebellum of the neonate Ts65Dn mouse (10) have been shown to be associated with cell cycle elongation. We found here that in the SVZ of Ts65Dn mice there were more cells in the G2 phase of the cell cycle, compared with that of the euploid mice, which suggests that an alteration in cell cycle dynamics may underlie the reduced number of precursors in the SVZ. The presence in the SVZ of adult trisomic mice of an increased number of cells in the G2 phase is fully in agreement with previous evidence in the hippocampus of human fetuses with DS, hippocampus and cerebellum of neonate Ts65Dn mice 9, 10 and with demonstration that in cerebellar granule cells of trisomic mice an elongation of the G2 phase is one (though not the only) determinant of the increased length of the cell cycle (10). The finding that in Ts65Dn mice no SVZ was present at the sites where the ventricle was obliterated suggests that an additional factor that may contribute to reduce the size of the proliferating pool is the loss of stem properties by some cells of the SVZ.
Treatment with lithium increases neurogenesis in the SVZ of adult euploid and Ts65Dn mice
Current study shows that treatment with lithium was able to increase proliferation in the SVZ of adult euploid and Ts65Dn mice and to expand the pool of actively dividing cells. Looking at the phenotype of the proliferating cells, we found that lithium increased proliferation of type A and type B2 cells but had no effect on type C cells in euploid mice, and had a marginal effect in Ts65Dn mice. Type C cells (transient amplifying cells) are characterized by an intrinsically faster proliferation rate compared to the other two cell types (14). This property may explain why lithium was unable to further increase the proliferation of this cell population. The fact that lithium was able to increase the proliferation rate of type B2 cells appears of relevance, because these cells form a resident population of precursors that keeps the neurogenic potential of the SVZ. Interestingly, lithium also enhanced the proliferation of type A cells. These are migrating neuroblasts that, in the adult brain migrate to the olfactory bulb but that during earlier developmental stages migrate to populate the cortical layers. These data show that lithium enhances the process of neurogenesis by acting both on uncommitted (type B2 cells) and committed (type A cells) precursors. In agreement with the effect of lithium on type A cells in the SVZ, we found that lithium enhanced proliferation of neuroblasts within the RMS also.
In mouse hippocampus, chronic treatment with lithium increases neurogenesis and the levels of B‐cell lymphoma protein‐2 (bcl‐2) (7). In view of the anti‐apoptotic effects of bcl‐2 it has been postulated that enhanced survival of the newborn cells may play a role in lithium's effects in the hippocampus. In the current study we did not observe a reduction in the number of apoptotic cells in the SVZ of animals treated with lithium, Consequently, the increase in the number of BrdU+ cells should be attributable to an increase in proliferation potency. The finding that lithium reduced the relative number of cells in the G2 phase of the cell cycle is in agreement with the possibility that a reduction in the length of this phase (and possibly other phases) contributes to shorten the cell cycle length and increase proliferation rate. Importantly, in Ts65Dn mice treated with lithium a SVZ appeared also in the region where the ventricle was obliterated, suggesting that lithium may favor cell cycle reentry of quiescent stem cells. Thus, recruitment of quiescent progenitors may be an additional mechanism that, in conjunction with changes in cell cycle dynamics, increases the size of the proliferating population in the SVZ of animals treated with lithium.
Though it is established that lithium can improve bipolar disorder, exerts neuroprotective effects and increases neurogenesis7, 15, 16, 23, 41, 43, the mechanisms and signal transduction pathways by which it brings about its effects have not been fully elucidated. Lithium acts by targeting various cellular enzymes, among which inositol monophosphatase (IMPase) and glycogen synthase kinase 3β (GSK‐3β) appear to be of particular relevance 15, 23. The finding that lithium inhibits IMPase and GSK‐3β—two enzymes that play important roles in two distinct but interacting signal transduction pathways—has led to the formulation of two major hypotheses for the cellular basis of lithium's action: the inositol depletion hypothesis and the GSK‐3β inhibition hypothesis 3, 20, 23, 25. Recent evidence shows that chronic treatment with lithium increases proliferation of adult hippocampal progenitors and that these effects are independent of IMPase, but dependent on Wnt pathway components (46). In particular, both the downregulation of GSK‐3β—a negative regulator of the Wnt signaling component of the canonical Wnt signaling pathway, which plays a central role in the development of invertebrates and vertebrates—and the elevated beta‐catenin—a downstream component and transcriptional regulator in the same pathway—produce effects similar to lithium. In the light of this evidence it is likely that the neurogeneis increase observed here in the SVZ of adult mice is mediated by a similar mechanism.
Lithium restores neurogenesis in Ts65Dn mice
Treatment with lithium increased the number of BrdU and Ki‐67+ cells in both euploid and Ts65Dn mice, but in the latter the increase was remarkably more pronounced. Consistent with this, in Ts65Dn mice treated with lithium the SVZ grew in thickness and became similar to that of the euploid mice. As discussed earlier, it is likely that the increased proliferation potency induced by lithium is underpinned by a reduction in the cell cycle length. In normal animals, with precursors endowed with a correct cell cycle length, there may be a limit to the amount by which cell cycle may be shortened and thus cause neurogenesis increase. In Ts65Dn mice, characterized by defects in cell cycle dynamics, cell cycle length might be shortened proportionally more than in euploid mice, which would account for the proportionally larger effect of lithium in Ts65Dn mice. In addition, in Ts65Dn mice treated with lithium, there was a patent increase in the size of the SVZ, suggesting that the widespread recruitment of quiescent progenitors may contribute to the comparatively larger effects of lithium on neurogensis. Importantly after treatment with lithium, Ts65Dn mice exhibited a similar number of BrdU+ cells and Ki‐67+ cells as untreated euploid mice, which indicates that lithium was able to completely restore cell proliferation.
In spite of numerous efforts, the molecular mechanisms underlying neurogenesis impairment in DS are far from being elucidated and there are, at present, no therapeutic interventions that are able to ameliorate neurogenesis and mental retardation in DS. Current study suggests that it is possible to restore neurogenesis in the SVZ of an animal model for DS in adulthood with a widely used mood stabilizer. While during early embryonic stages, the VZ is the source of neurons that begin to form the cortical mantle, during later embryonic stages the VZ disappears and the SVZ, a continuous germinal zone surrounding the ventricles, achieves prominence (5). During late embryonic and early postnatal brain development the SVZ gives origin to neuronal and glial cells that will migrate to and settle into the developing cortex and other telencephalic regions. Based on specific features, distinct divisions of the SVZ can be distinguished in the developing forebrain. Each region is enriched in progenitors that generate different types of neurons and glia. We examined here the SVZ region located anterior to bregma. Though the relationship between the prenatal SVZ and the postnatal SVZ has not been established very firmly at this point, the region sampled by us should contribute to produce during late embryonic and early postnatal stages neurons and glia destined to several telencephalic regions (5). In the adult brain the rostral SVZ, in conjunction with more caudal portions of SVZ, gives origin to neuroblasts that migrate to the olfactory bulb where they become periglomerular and granule cells 13, 27. In animal models and human fetuses with DS the neocortex is characterized by severe hypocellularily, which, in light of data in the Ts65Dn embryonic mouse is most likely caused by impaired proliferation in the VZ (6). An important subsequent step will be to attempt ameliorate neurogenesis in the VZ/SVZ of the Ts65Dn mouse during brain development, the most critical period for the establishment of the correct number of neuron and appropriate neuron connections. If such a treatment will be proven to be effective, this might open the way to possible therapeutic intervention practicable by human subjects, aimed at correcting defects in brain development in DS individuals.
This work was supported by a grant from the CARISBO Foundation, Bologna, Italy to R. Bartesaghi and by the research project 1/397 granted by the Fondation Jerome Lejeune to E. Ciani.
REFERENCES
- 1. Aylward EH, Habbak R, Warren AC, Pulsifer MB, Barta PE, Jerram M, Pearlson GD (1997) Cerebellar volume in adults with Down syndrome. Arch Neurol 54:209–212. [DOI] [PubMed] [Google Scholar]
- 2. Aylward EH, Li Q, Honeycutt NA, Warren AC, Pulsifer MB, Barta PE, Chan MD (1999) MRI volumes of the hippocampus and amygdala in adults with Down's syndrome with and without dementia. Am J Psychiatry 156:564–568. [DOI] [PubMed] [Google Scholar]
- 3. Berridge MJ, Downes CP, Hanley MR (1989) Neural and developmental actions of lithium: a unifying hypothesis. Cell 59:411–419. [DOI] [PubMed] [Google Scholar]
- 4. Blomgren K, Leist M, Groc L (2007) Pathological apoptosis in the developing brain. Apoptosis 12:993–1010. [DOI] [PubMed] [Google Scholar]
- 5. Brazel CY, Romanko MJ, Rothstein RP, Levison SW (2003) Roles of the mammalian subventricular zone in brain development. Prog Neurobiol 69:49–69. [DOI] [PubMed] [Google Scholar]
- 6. Chakrabarti L, Galdzicki Z, Haydar TF (2007) Defects in embryonic neurogenesis and initial synapse formation in the forebrain of the Ts65Dn mouse model of Down syndrome. J Neurosci 27:11483–11495. [DOI] [PMC free article] [PubMed] [Google Scholar]
- 7. Chen G, Rajkowska G, Du F, Seraji‐Bozorgzad N, Manji HK (2000) Enhancement of hippocampal neurogenesis by lithium. J Neurochem 75:1729–1734. [DOI] [PubMed] [Google Scholar]
- 8. Clark S, Schwalbe J, Stasko MR, Yarowsky PJ, Costa AC (2006) Fluoxetine rescues deficient neurogenesis in hippocampus of the Ts65Dn mouse model for Down syndrome. Exp Neurol 200:256–261. [DOI] [PubMed] [Google Scholar]
- 9. Contestabile A, Fila T, Ceccarelli C, Bonasoni P, Bonapace L, Santini D et al (2007) Cell cycle alteration and decreased cell proliferation in the hippocampal dentate gyrus and in the neocortical germinal matrix of fetuses with Down syndrome and in Ts65Dn mice. Hippocampus 17:665–678. [DOI] [PubMed] [Google Scholar]
- 10. Contestabile A, Fila T, Bartesaghi R, Ciani E (2008) Cell cycle elongation impairs proliferation of cerebellar granule cell precursors in the Ts65Dn Mouse, an animal model for Down syndrome. Brain Pathol (in press). [DOI] [PMC free article] [PubMed]
- 11. Davisson MT, Schmidt C, Reeves RH, Irving NG, Akeson EC, Harris BS, Bronson RT (1993) Segmental trisomy as a mouse model for Down syndrome. Prog Clin Biol Res 384:117–133. [PubMed] [Google Scholar]
- 12. De La Monte SM, Hedley‐Whyte ET (1990) Small cerebral hemispheres in adults with Down's syndrome: contributions of developmental arrest and lesions of Alzheimer's disease. J Neuropathol Exp Neurol 49:509–520. [DOI] [PubMed] [Google Scholar]
- 13. Doetsch F, Alvarez‐Buylla A (1996) Network of tangential pathways for neuronal migration in adult mammalian brain. Proc Natl Acad Sci USA 93:14895–14900. [DOI] [PMC free article] [PubMed] [Google Scholar]
- 14. Doetsch F, Garcia Verdugo JM, Alvarez Buylla A (1997) Cellular composition and three‐dimensional organization of the subventricular germinal zone in the adult mammalian brain. J Neurosci 17:5046–5061. [DOI] [PMC free article] [PubMed] [Google Scholar]
- 15. Einat H, Manji HK (2006) Cellular plasticity cascades: genes‐to‐behavior pathways in animal models of bipolar disorder. Biol Psychiatry 59:1160–1171. [DOI] [PubMed] [Google Scholar]
- 16. Feng HL, Leng Y, Ma CH, Zhang J, Ren M, Chuang DM (2008) Combined lithium and valproate treatment delays disease onset, reduces neurological deficits and prolongs survival in an amyotrophic lateral sclerosis mouse model. Neuroscience 155:567–572. [DOI] [PMC free article] [PubMed] [Google Scholar]
- 17. Franklin KBJ, Paxinos G (1997) The Mouse Brain in Stereotaxic Coordinates. Academic Press: San Diego, CA. [Google Scholar]
- 18. Golden JA, Hyman BT (1994) Development of the superior temporal neocortex is anomalous in trisomy 21. J Neuropathol Exp Neurol 53:513–520. [DOI] [PubMed] [Google Scholar]
- 19. Guidi S, Bonasoni P, Ceccarelli C, Santini D, Gualtieri F, Ciani E, Bartesaghi R (2008) Neurogenesis impairment and increased cell death reduce total neuron number in the hippocampal region of fetuses with Down syndrome. Brain Pathol 18:180–197. [DOI] [PMC free article] [PubMed] [Google Scholar]
- 20. Hedgepeth CM, Conrad LJ, Zhang J, Huang HC, Lee VM, Klein PS (1997) Activation of the Wnt signaling pathway: a molecular mechanism for lithium action. Dev Biol 185:82–91. [DOI] [PubMed] [Google Scholar]
- 21. Hendzel MJ, Wei Y, Mancini MA, Van Hooser A, Ranalli T, Brinkley BR et al (1997) Mitosis‐specific phosphorylation of histone H3 initiates primarily within pericentromeric heterochromatin during G2 and spreads in an ordered fashion coincident with mitotic chromosome condensation. Chromosoma 106:348–360. [DOI] [PubMed] [Google Scholar]
- 22. Huether CA, Gummere GR, Hook EB, Dignan PS, Volodkevich H, Barg M et al (1981) Down's syndrome: percentage reporting on birth certificates and single year maternal age risk rates for Ohio 1970–79: comparison with upstate New York data. Am J Public Health 71:1367–1372. [DOI] [PMC free article] [PubMed] [Google Scholar]
- 23. Ikonomov OC, Manji HK (1999) Molecular mechanisms underlying mood stabilization in manic‐depressive illness: the phenotype challenge. Am J Psychiatry 156:1506–1514. [DOI] [PubMed] [Google Scholar]
- 24. Jernigan TL, Bellugi U, Sowell E, Doherty S, Hesselink JR (1993) Cerebral morphologic distinctions between Williams and Down syndromes. Arch Neurol 50:186–191. [DOI] [PubMed] [Google Scholar]
- 25. Klein PS, Melton DA (1996) A molecular mechanism for the effect of lithium on development. Proc Natl Acad Sci USA 93:8455–8459. [DOI] [PMC free article] [PubMed] [Google Scholar]
- 26. Liu DP, Schmidt C, Billings T, Davisson MT (2003) Quantitative PCR genotyping assay for the Ts65Dn mouse model of Down syndrome. Biotechniques 35:1170–1174, 1176, 1178 passim. [DOI] [PubMed] [Google Scholar]
- 27. Lois C, Alvarez‐Buylla A (1994) Long‐distance neuronal migration in the adult mammalian brain. Science 264:1145–1148. [DOI] [PubMed] [Google Scholar]
- 28. Malberg JE, Eisch AJ, Nestler EJ, Duman RS (2000) Chronic antidepressant treatment increases neurogenesis in adult rat hippocampus. J Neurosci 20:9104–9110. [DOI] [PMC free article] [PubMed] [Google Scholar]
- 29. Nowakowski RS, Lewin SB, Miller MW (1989) Bromodeoxyuridine immunohistochemical determination of the lengths of the cell cycle and the DNA‐synthetic phase for an anatomically defined population. J Neurocytol 18:311–318. [DOI] [PubMed] [Google Scholar]
- 30. Pencea V, Bingaman KD, Freedman LJ, Luskin MB (2001) Neurogenesis in the subventricular zone and rostral migratory stream of the neonatal and adult primate forebrain. Exp Neurol 172:1–16. [DOI] [PubMed] [Google Scholar]
- 31. Pinter JD, Eliez S, Schmitt JE, Capone GT, Reiss AL (2001) Neuroanatomy of Down's syndrome: a high‐resolution MRI study. Am J Psychiatry 158:1659–1665. [DOI] [PubMed] [Google Scholar]
- 32. Reeves RH, Irving NG, Moran TH, Wohn A, Kitt C, Sisodia SS et al (1995) A mouse model for Down syndrome exhibits learning and behaviour deficits. Nat Genet 11:177–184. [DOI] [PubMed] [Google Scholar]
- 33. Roizen NJ, Patterson D (2003) Down's syndrome. Lancet 361:1281–1289. [DOI] [PubMed] [Google Scholar]
- 34. Roper RJ, St John HK, Philip J, Lawler A, Reeves RH (2006) Perinatal loss of Ts65Dn Down syndrome mice. Genet 172:437–443. [DOI] [PMC free article] [PubMed] [Google Scholar]
- 35. Rose DS, Maddox PH, Brown DC (1994) Which proliferation markers for routine immunohistology? A comparison of five antibodies. J Clin Pathol 47:1010–1014. [DOI] [PMC free article] [PubMed] [Google Scholar]
- 36. Rotmensch S, Goldstein I, Liberati M, Shalev J, Ben‐Rafael Z, Copel JA (1997) Fetal transcerebellar diameter in Down syndrome. Obstet Gynecol 89:534–537. [DOI] [PubMed] [Google Scholar]
- 37. Schmidt‐Sidor B, Wisniewski KE, Shepard TH, Sersen EA (1990) Brain growth in Down syndrome subjects 15 to 22 weeks of gestational age and birth to 60 months. Clin Neuropathol 9:181–190. [PubMed] [Google Scholar]
- 38. Scholzen T, Gerdes J (2000) The Ki‐67 protein: from the known and the unknown. J Cell Physiol 182:311–322. [DOI] [PubMed] [Google Scholar]
- 39. Seress L, Abraham H, Tornoczky T, Kosztolanyi G (2001) Cell formation in the human hippocampal formation from mid‐gestation to the late postnatal period. Neuroscience 105:831–843. [DOI] [PubMed] [Google Scholar]
- 40. Strovel J, Stamberg J, Yarowsky PJ (1999) Interphase FISH for rapid identification of a down syndrome animal model. Cytogenet Cell Genet 86:285–287. [DOI] [PubMed] [Google Scholar]
- 41. Su H, Chu TH, Wu W (2007) Lithium enhances proliferation and neuronal differentiation of neural progenitor cells in vitro and after transplantation into the adult rat spinal cord. Exp Neurol 206:296–307. [DOI] [PubMed] [Google Scholar]
- 42. Sylvester PE (1983) The hippocampus in Down's syndrome. J Ment Defic Res 27:227–236. [DOI] [PubMed] [Google Scholar]
- 43. Tajes M, Gutierrez‐Cuesta J, Folch J, Ferrer I, Caballero B, Smith MA et al (2008) Lithium treatment decreases activities of tau kinases in a murine model of senescence. J Neuropathol Exp Neurol 67:612–623. [DOI] [PubMed] [Google Scholar]
- 44. Teipel SJ, Schapiro MB, Alexander GE, Krasuski JS, Horwitz B, Hoehne C et al (2003) Relation of corpus callosum and hippocampal size to age in nondemented adults with Down's syndrome. Am J Psychiatry 160:1870–1878. [DOI] [PubMed] [Google Scholar]
- 45. West MJ, Gundersen HJ (1990) Unbiased stereological estimation of the number of neurons in the human hippocampus. J Comp Neurol 296:1–22. [DOI] [PubMed] [Google Scholar]
- 46. Wexler EM, Geschwind DH, Palmer TD (2008) Lithium regulates adult hippocampal progenitor development through canonical Wnt pathway activation. Mol Psychiatry 13:285–292. [DOI] [PubMed] [Google Scholar]
- 47. Winter TC, Ostrovsky AA, Komarniski CA, Uhrich SB (2000) Cerebellar and frontal lobe hypoplasia in fetuses with trisomy 21: usefulness as combined US markers. Radiology 214:533–538. [DOI] [PubMed] [Google Scholar]
- 48. Wisniewski KE (1990) Down syndrome children often have brain with maturation delay, retardation of growth, and cortical dysgenesis. Am J Med Genet Suppl. 7:274–281. [DOI] [PubMed] [Google Scholar]