

Abstract
Chordoid gliomas are rare, slow‐growing neoplasms of the anterior third ventricle. We reported a case of chordoid glioma in a 41‐year‐old man with obstructive hydrocephalus. Histologically, the tumor consisted of polygonal epithelioid cells admixed with elongated cells in a myxoid stroma. A prominent lymphoplasmacytic infiltrate was present. The tumor cells expressed glial fibrillary acidic protein (GFAP), epithelial membrane antigen (EMA), vimentin, CD31, CD34, epidermal growth factor receptor (EGFR) and S100 but were negative for pankeratin and E‐cadherin. The percentage of Ki67 positive cells was approximately 3%. Weak p53 immunoreactivity was seen in less than 10% of the cells. Array comparative genomic hybridization performed on this case, as well as on four other archived cases, showed losses at several loci. Fluorescence in situ hybridization (FISH) confirmed consistent genetic alterations at 9p21 and 11q13. These are the fifth through ninth reported cases of chordoid gliomas with molecular characterization suggesting a distinct genetic origin from other gliomas.
Keywords: array comparative genomic hybridization, chordoid glioma, fluorescence in situ hybridization
INTRODUCTION
Chordoid glioma is a newly defined neoplasm of the third ventricle, officially named in 1998 by Brat et al (4), but probably first described by Wanschitz et al as a third ventricular meningioma with glial fibrillary acidic protein (GFAP) expression (38). Over 40 cases have been described in the literature. Chordoid gliomas generally appear to be slow‐growing, solid, contrast‐enhancing tumors arising in the anterior third ventricle of middle‐aged adults; only rarely have they been reported as cystic or aggressive 2, 19. Cases may also arise in other parts of the ventricular system or even extraventricularly, although this is controversial 12, 17. One case involved a collision tumor between chordoid glioma and a Rathke's cleft cyst (34). Histologically, the tumor consists of epithelioid cells arranged in cords and clusters admixed with spindle cells in a myxoid stroma. Lymphoplasmacytic infiltrates and Russell bodies are common, as well as reactive gliosis and Rosenthal fibers in the adjacent brain parenchyma 4, 22, 29, 37. The prognosis of this tumor is worse than the relatively benign histology and slow growth would suggest, because of the difficulty in resecting it fully without compromising critical adjacent structures such as the hypothalamus 20, 25. Thus, when it was included in the 2000 World Health Organization (WHO) classification as a “neuroepithelial tumor of uncertain origin,” it was assigned grade II, and this has remained unchanged in the 2007 version 4, 22.
Since then, ultrastructural studies showing apical microvilli, abnormal cilia, hemidesmosome‐like structures and cytoplasmic zonation have suggested an ependymal origin for chordoid glioma. Possibilities include the ependymal cells of the subcommissural organ and the tanycytes lining the anterior third ventricle 6, 7, 17, 23, 24, 28, 33. One case reportedly showed an expression profile similar to that of the subcommissural organ and papillary tumor of the pineal region (8). However, not all ultrastructural studies have found microvilli or hemidesmosome‐like structures 31, 35, and several studies support an origin for chordoid glioma in the lamina terminalis of the anterior third ventricle 3, 10, 11, 14, 21.
Genetic studies have been limited because, in part, of the rarity of this neoplasm. In addition to the aforementioned expression array profile on one case (8), conventional comparative genomic hybridization (CGH) of four chordoid gliomas detected no chromosomal imbalances. Moreover, there were no abnormalities of TP53, CDKN2A, EGFR, CDK4 or MDM2, all of which are important in astrocytoma pathogenesis (29). These results suggested a novel genetic origin compared with astrocytomas. In the current study, we reported a case of chordoid glioma in a 41‐year‐old male, with clinical, radiologic, histologic and immunohistochemical characterization. Array comparative genomic hybridization (aCGH), fluorescence in situ hybridization (FISH) and TP53 sequencing were performed on this case and four others. The results suggested novel genetic alterations involving potentially important genes.
MATERIALS AND METHODS
Immunohistochemical studies were performed on 4 µm‐thick sections obtained from paraffin‐embedded material. The primary antibodies, including manufacturer, clone and dilution, were as follows: vimentin (prediluted, V9, Ventana, Tucson, AZ, USA); epithelial membrane antigen (EMA) (prediluted, E29, Cell Marque, Rocklin, CA, USA); GFAP (polyclonal, 1:1000, Dako, Carpinteria, CA, USA); S100 (polyclonal, 1:500, Dako); CD34 (prediluted, QBend10, Ventana); p53 (1:100, DO‐7, Dako); Ki67 (1:100, M7240, MIB‐1, Dako); CD31 (1:25, M0823, JC/70A, Dako); synaptophysin (polyclonal, prediluted, 760‐2668, Cell Marque); chromogranin (prediluted, 760‐2519, LIK2H10, Ventana); EGFR (prediluted, 790‐2988, 3C6, Ventana); pankeratin cocktail (1:1000, cytokeratin AE1/AE3 M3515, AE1/AE3, Dako; 1:80, Cam5.2 349205, Cam5.2, Becton‐Dickinson, Franklin Lakes, NJ, USA; 1:2000, polyclonal, wide‐spectrum screening cytokeratin, Z0622, Dako); E‐cadherin (1:25, M3612, NCH‐38, Dako); CD45/leukocyte common antigen (LCA) (prediluted, 760‐2515, RP2/18, Ventana); and CD138 (1:100, M7228, MI15, Dako). The antibody labeling was performed using the avidin–biotin complex method and visualized using a horseradish peroxidase enzyme label and 2'‐diaminobenzamide [(DAB) Dako] as the substrate chromogen (brown) for all antibodies except S100, which was visualized using an alkaline phosphatase enzyme label with Fast Red (Dako) as the substrate chromogen.
Histochemical staining
Reticulin, mucicarmine and Periodic Acid‐Schiff with diastase (PASD) stains were performed on 4‐µm‐thick sections obtained from paraffin‐embedded material. For reticulin, the slides were sequentially treated with 0.5% potassium permanganate, 2% potassium metabisulfite, 2% ferric ammonium sulfate, ammonical silver solution, 20% formalin, gold chloride, 2% potassium metabisulfite and 2% sodium thiosulfate. Mucicarmine stains were performed with Harris hematoxylin followed by working mucicarmine and metanil yellow. For PAS with diastase, the slides were placed in preheated diastase digestion solution followed by sequential treatment with 0.5% periodic acid, Schiff's reagent, 0.55% potassium metabisulfite and Harris hematoxylin.
aCGH
Gene gains and losses were detected by commercially available genomic DNA microarray kit GenoSensor™ Array 300 (Abbott Molecular, Des Plaines, IL, USA), which contains triplicate of 287 target clone DNAs (P1 or bacterial artificial chromosome (BAC) clones) representing oncogenes and tumor suppressor genes. A complete list of clones can be obtained from http://www.vysis.com.
A target tissue was microdissected from ten 4 µm‐thick unstained histologic sections under direct visualization using a stereoscopic microscope. Genomic DNA was extracted by proteinase K digestion and DNEasy DNA extraction column (Qiagen, Valencia, CA, USA). The DNA concentration was quantified using a fluorospectrometer (Nanodrop, Wilmington, DE, USA). DNA quality was assured on 2% agarose gel.
DNA labeling and hybridization were performed according to the manufacturer's instructions. In brief, tumor and reference DNA were labeled by random priming reaction (Random Priming Reaction Kit, Vysis, Inc., Downers Grove, IL, USA) with Cy3‐dCTp and Cy5‐dCTP (Perkin Elmer Life Sciences Inc., Boston, MA, USA), respectively. Labeled tumor and reference DNA were mixed with Microarray Hybridization Buffer (Vysis, Inc.) containing Cot‐1 DNA, followed by denaturation at 80°C for 10 minutes, followed by 1‐h incubation at 37°C. Thirty microliters of hybridization mixture was transferred onto the GenoSensor™ Array 300 microarray template (Abbott Molecular). Hybridization was carried out for 7 days at 37°C. Posthybridization washes were performed using a washing solution (2XSSC/50% formamide) at 40°C (3 × 10 minutes), followed by 1XSSC (4 × 5 minutes) and a 1‐ to 2‐s rinse in distilled water. Hybridized DNA was counterstained with 4′‐6‐diamidino‐2‐phenylindole (DAPI) IV solution (Vysis, Inc.).
The hybridized microarray slides were analyzed using the GenoSensor Reader System (Abbott Molecular). Cy3/Cy5 ratios were automatically determined for each target. The normalized ratios of the test DNA copy number relative to the normal reference DNA copy number were calculated. According to the manufacturer's instructions and our own validation using normal DNA vs. normal reference DNA, the cutoff fluorescence ratio between normal and aberrant DNA copy numbers was at mean 1.00 ± 2 standard deviations. Fluorescence ratios ≥1.2 were considered to be DNA sequence copy number gain. Fluorescence ratios ≤0.80 were considered to be DNA sequence copy number losses.
FISH
Two loci were selected for validation by FISH analysis on formalin‐fixed, paraffin‐embedded histologic sections. Formalin‐fixed, paraffin‐embedded sections were mounted and serially sectioned at 5 µm intervals. Hematoxylin and eosin (H&E) sections were used by the pathologist to determine the area of the tissue to be targeted for analysis. FISH slides were deparaffinized in xylene twice for 10 minutes, dehydrated twice with 100% ethanol and then pretreated using the Vysis Paraffin Pretreatment Kit. The slides were digested for 18 minutes in protease solution (0.5 mg/mL) at 37°C. FISH was performed using probes for 9p21 and 11q13 (Abbott Molecular). For ploidy control, centromeric enumeration probes were used for chromosomes 7 (CEP7), 9 (CEP9) and 11 (CEP11). In addition, EGFR (7p12) FISH was performed on the index case as part of the institution‐specific workup of all gliomas. The target slide and probe were codenatured at 95°C for 8 minutes and incubated overnight at 37°C in a humidified chamber. Posthybridization washes were performed using 2XSSC/0.3% Igepal (Sigma, St. Louis, MO, USA) at 72°C for 2 minutes. The slides were air‐dried in the dark and counterstained with DAPI (Vysis, Inc.). Analysis was performed using a Nikon Optiphot‐2 (Nikon, Inc., Melville, NY, USA) and Quips Genetic Workstation equipped with Chroma Technology filter set with single band excitors for SpectrumOrange, fluorescein isothiocyanate (FITC), DAPI (UV 360 nm) (Vysis, Inc.). Only individual and well‐delineated cells were scored. Overlapping cells were excluded from the analysis. Approximately 60 cells were analyzed in the targeted region per case. Each tumor was assessed by the average and the maximum numbers of copies of gene per cell and the average ratio of gene to chromosome copy numbers. Amplification was defined as a ratio of gene signals to chromosome centromere signals of ≥2.0. Deletion was defined if one or both 9p21 and 11q13 signals were lost in at least 20% of nuclei. These cutoff points were derived using non‐neoplastic autopsy brain tissue as controls.
P53 sequencing
Genomic DNA was extracted from formalin‐fixed, paraffin‐embedded thick sections (10 µm) using standard kit‐based techniques. Intronic primers were used to amplify the coding regions and intron/exon boundaries of exons 4–11 using polymerase chain reaction (PCR). The primers used for PCR contain universal M13 primer sequences (forward and reverse on each PCR pair) at their 5′ ends. After amplification, the size and quality of PCR products were checked by capillary gel electrophoresis. Reactions with single bands of the appropriate size were treated with an exonuclease/phosphatase mixture (ExoSap‐IT USB Corporation, Cleveland, OH, USA). Sequencing was performed using primers that are complementary to the M13 PCR primer tails and the Big Dye Terminator Cycle Sequencing Kit (Applied Biosystems, Foster City, CA, USA). Sequencing products were purified and resolved on an ABI 3130xl Genetic Analyzer (Applied Biosystems). Analysis was performed using the accompanying ABI data collection and analysis software suite.
CASE HISTORY
The index case (case #1, University of Pittsburgh) was a 41‐year‐old male whose cognitive status steadily deteriorated over the course of a month, ultimately progressing to stupor and obtundation. A head computerized tomography (CT) scan without contrast showed a large mostly homogeneous mass with punctate calcification occupying the third ventricle, causing obstructive hydrocephalus (Figure 1A). Magnetic resonance imaging (MRI) showed a 4.0 × 4.0 × 4.2 cm mass with focal hemorrhage and enhancement with contrast. The tumor obliterated the suprasellar cistern and demonstrated mass effect on the adjacent brain, leading to displacement and edema (Figure 1B–E). Based on the location and the radiologic characteristics, the differential diagnosis was included, but was not restricted to, meningioma, oligodendroglioma and neurocytoma.
Figure 1.
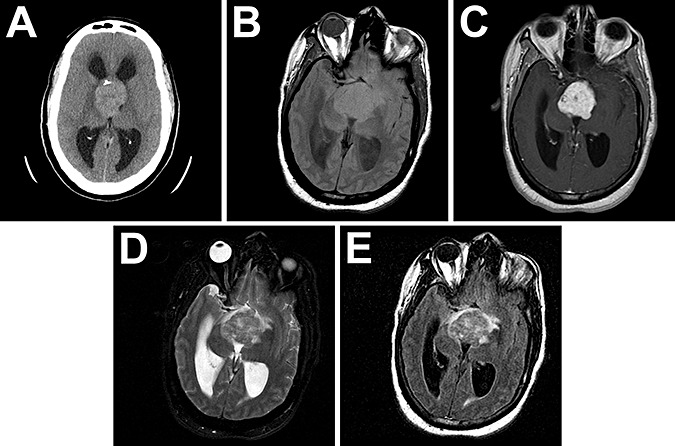
Radiographic appearance of chordoid glioma. CT without contrast showed a large mostly homogeneous mass with punctate calcification arising in the third ventricle, causing obstructive hydrocephalus (A). MRI showed a 4.0 × 4.0 × 4.2 cm mass weakly hyperintense on T1 (B) that enhanced with contrast (C). The tumor obliterated the suprasellar cistern and had some mass effect and edema as seen by T2 (D) and fluid attenuation inversion recovery (FLAIR, E).
Intraoperatively, the tumor was visualized through the markedly distended foramen of Monro. The tumor was soft, tan‐gray, semitranslucent, moderately vascular and focally calcified, with a well‐defined capsule that did not adhere preferentially to any surrounding parenchymal structures. Grossly, the tumor was completely resected.
The patient's postoperative course was complicated by panhypopituitarism with adrenal insufficiency, diabetes mellitus, hypothyroidism and diabetes insipidus, as well as hyperthermia, hypernatremia, brain edema and pneumonia. He required a ventriculoperitoneal shunt 2 weeks after the original resection because of persistent noncommunicating hydrocephalus. The patient was eventually stabilized and discharged.
Cases #2–4 were from Emory University, and case #5 was from Duke University. Case #2 was a 36‐year‐old male who developed headaches, nausea and blurred vision. MRI showed a midline mass in the third ventricle compressing the optic chiasm (not shown). Case #3 was a 36‐year‐old female with progressive visual symptoms for 6 months. CT and MRI revealed a 3.0‐cm mass in the third ventricle that homogeneously enhanced and displaced the optic chiasm inferiorly (not shown). Case #4 was a 50‐year‐old female with increasing lethargy, urinary incontinence and ataxia. CT showed a third ventricular contrast‐enhancing mass and hydrocephalus (not shown). Case #5 was a 72‐year‐old male who had syncopal episodes and cognitive difficulties, but no visual alterations. CT scan showed a homogeneously enhancing tumor over the posterior sella without calcifications (not shown). Up to 9 months after the tumor was resected, the patient had difficulties with panhypopituitarism, including diabetes insipidus, but at 2 years after resection the patient's condition had improved markedly, with only slight residual enhancement on follow‐up MRI.
RESULTS
Histology
The intraoperative squash preparation showed a biphasic neoplasm. Some areas contained clumps of cells with abundant pink cytoplasm and long fibrillary processes in a myxoid background (Figure 2A,B). Other areas displayed cohesive clusters of epithelioid cells with eosinophilic cytoplasm and shorter delicate processes without a myxoid background (Figure 2C,D). Both types of cells had medium‐sized nuclei with uniform chromatin and one to two small nucleoli. No mitoses, necrosis or bizarre cellular atypia was observed. The specimen was identified as a neoplasm, with definitive diagnosis deferred to the permanent sections.
Figure 2.
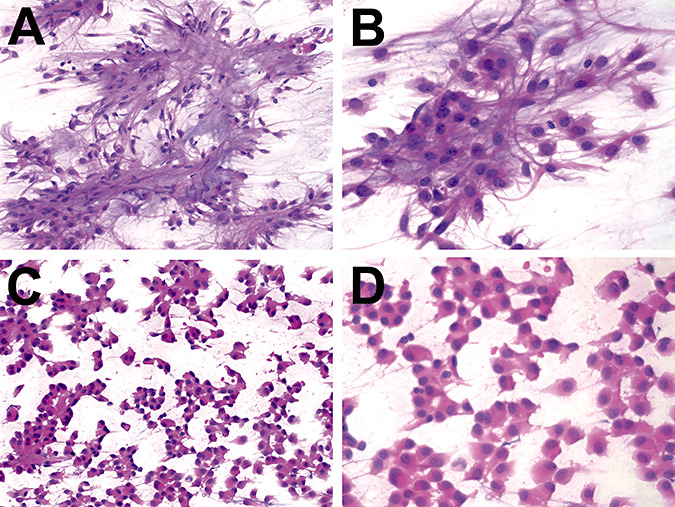
Intraoperative preparation of chordoid glioma. The intraoperative smears on case 1 showed a biphasic neoplasm. Some areas contained clumps of cells with abundant pink cytoplasm and long fibrillar processes in a myxoid background (A & B). Other areas had cohesive clusters of epithelioid cells with abundant eosinophilic cytoplasm and shorter delicate processes without a myxoid background (C & D). Both types of cells had medium‐sized nuclei with 1–2 small nucleoli. No mitoses, necrosis, or bizarre cellular atypia were observed.
The permanent sections confirmed the biphasic nature of this neoplasm. Regions of epithelioid cells were interspersed with cords of spindled cells in a myxoid stroma (Figure 3A,B,E). There were multiple areas with brisk lymphoplasmacytic infiltrates and Russell bodies (Figure 3C,D,F). Adjacent brain tissue showed reactive gliosis and Rosenthal fibers (Figure 3G). The calcified area described radiographically was also observed histologically (Figure 3H). No whorls, rosettes, perivascular pseudorosettes, psammoma bodies, mitoses, endothelial proliferation or necrosis was seen.
Figure 3.
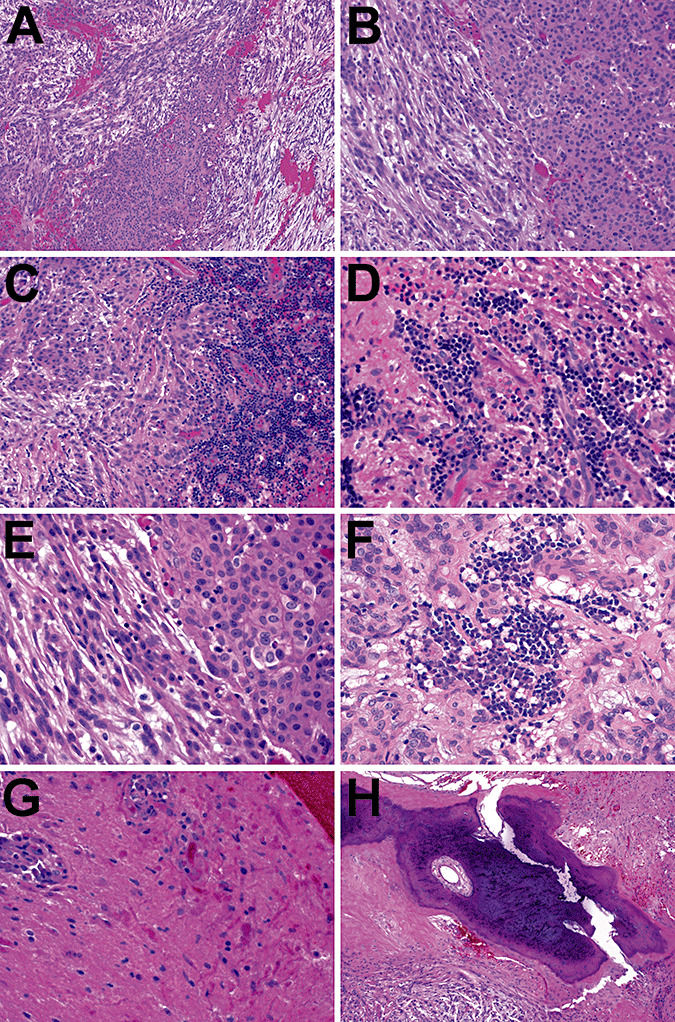
Chordoid glioma histology. The permanent sections on case 1 confirmed the biphasic nature of this neoplasm. Regions of epithelioid cells were interspersed with cords of spindle cells in a myxoid stroma (A, B, and E). There were multiple areas with brisk lymphoplasmacytic infiltrates and Russell bodies (C, D, and F). Adjacent nonneoplastic brain tissue showed abundant Rosenthal fibers (G). The calcified area described radiographically was also seen histologically (H). No whorls, rosettes, perivascular pseudorosettes, psammoma bodies, mitoses, endothelial proliferation, or necrosis were seen.
Immunohistochemistry and special stains
The tumor was positive for GFAP in both the chordoid and epithelioid regions (Figure 4A, compare with Figure 3B). Both regions were also strongly positive for vimentin (Figure 4B). EMA, S100, CD34 and synaptophysin were present in scattered areas of the epithelioid cells (Figure 4C–F). The proliferation index of this tumor, based on the percentage of tumor cells positive for the cell cycle marker Ki67, was 3% (Figure 4G). EGFR expression was stronger in the chordoid regions than the epithelioid regions (Figure 4H), and only about 10% of cells were weakly positive for p53 (Figure 4I). The tumor was negative for chromogranin, pankeratin and E‐cadherin; LCA and CD138 were negative in tumor cells but highlighted the lymphoplasmacellular infiltrate (not shown). Bundles of reticulin fibers surrounded clusters of epithelioid cells (Figure 4J). The myxoid background contained mucopolysaccharides but not mucin (Figure 4K,L).
Figure 4.
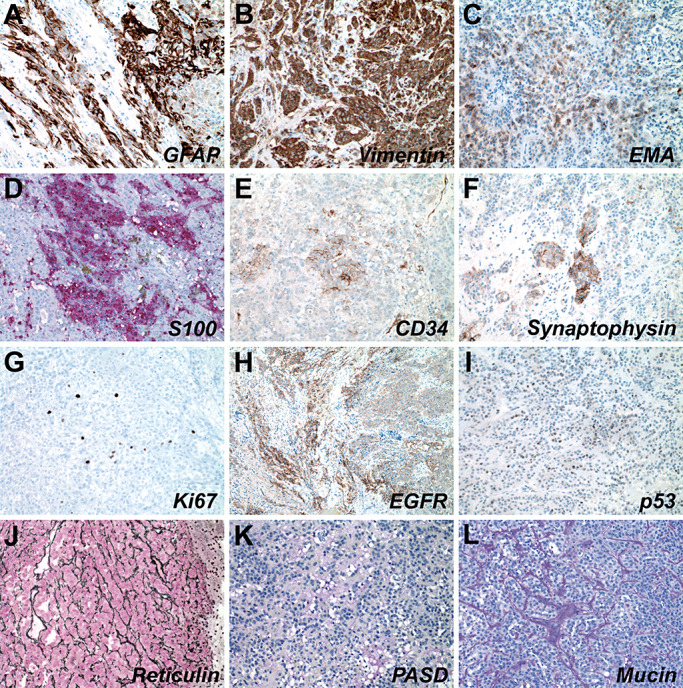
Immunohistochemical and histochemical profile of chordoid glioma. Case 1 tumor cells were positive for GFAP (A) and vimentin (B), and showed focal positivity for EMA (C), S100 (D), CD34 (E), and synaptophysin (F). Ki67 proliferation index was low at ∼3% (G). Some areas of the tumor expressed EGFR (H). It did not show a clonal pattern of p53 immunoreactivity (I). The tumor had an extensive reticulin network (J) and stroma with some mucopolysaccharides but no mucin (K and L). Abbreviations: GFAP = glial fibrillary acidic protein; EMA = epithelial membrane antigen; EGFR = epidermal growth factor receptor; PASD = Periodic Acid‐Schiff with diastase.
The diagnosis of this neoplasm, based on the location, histology and immunohistochemistry, was a chordoid glioma of the third ventricle.
Histology of additional cases
Cases #2–4 were diagnosed at Emory University by one of the authors (D.J.B.). Case #5 was diagnosed at Duke University by one of the authors (R.E.M.). Diagnoses on all five cases were confirmed (C.H. and C.T.C.) prior to molecular analysis, and all showed characteristic cords and clusters of epithelioid and spindly tumor cells in a myxoid stroma with lymphoplasmacellular infiltrate (Figure 5A–D). All cases were positive for GFAP. Case #2 was positive for S‐100 and was weakly positive for EMA and cytokeratin (AE1/3). Case #3 was positive for S‐100 and was negative for EMA and cytokeratin (AE1/3). Case #4 was positive for vimentin and S‐100, and was negative for EMA. Case #5 was negative for EMA. The tumors in cases #2 and 3 were focally positive for synaptophysin, while cases #4 and 5 were negative (not shown).
Figure 5.
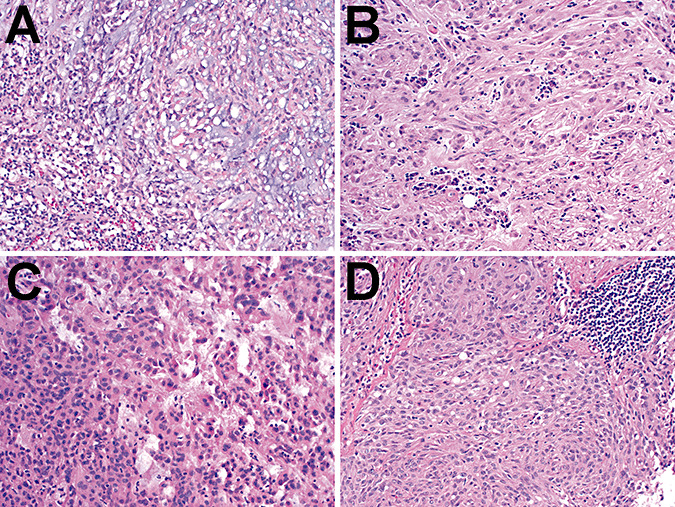
Histology of cases 2–5. Both the cases from Emory University (cases #2–4, panels A–C, respectively) and Duke University (case #5, panel D) showed morphologic characteristics of chordoid gliomas, including cords and nests of epithelioid to spindly tumor cells in a variable amount of myxoid matrix. Lymphoplasmacellular infiltrates were present in all cases.
Molecular studies
aCGH was performed on DNA extracted from formalin‐fixed, paraffin‐embedded tissue in this case and the four other archived cases. aCGH failed in one case from 1988. In two of the four remaining cases, however, losses were generally more common than gains, and loss at 11q13 was common to both of those cases (Table 1 and Figure 6). Gains were found in three of the four cases, including one with an apparent gain from 11q13.5 to 11q14 (Table 1).
Table 1.
aCGH on the primary case and four cases from other institutions. aCGH was performed as described in Materials and Methods. A small number of gains and losses were identified in three of the five cases, including copy number alterations at 11q13.
| Array comparative genomic hybridization (aCGH) | |||
|---|---|---|---|
| Case # | Losses | Gains | |
| 1 | 2q14 | 11q13 | 22q11.23 |
| 2q33‐q34 | 11q22.3 | ||
| 9p11.2 | 13q14 | ||
| 9p21 | 17q21 | ||
| 2 | 1p36 | 18p11.32 | |
| 11p15.5 | |||
| 11q13 | |||
| 3 | None | None | |
| 4 | Failed | Failed | |
| 5 | None | 11p15.5 | |
| 11q13.5‐q14 | |||
| 15q26.1 | |||
Figure 6.
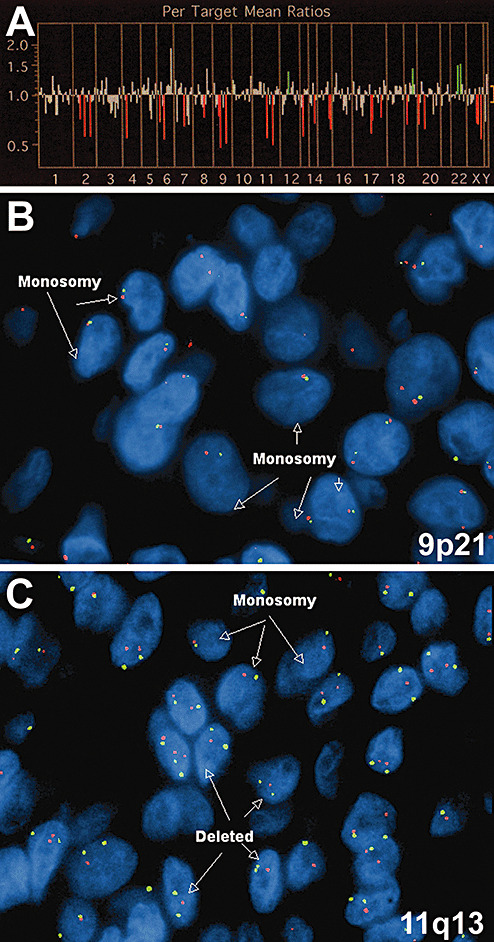
Molecular characterization of chordoid glioma. Array CGH on case 1 (A) showed multiple loci of losses (red vertical lines) as well as a few gains (green vertical lines). Only those loci that were determined to be statistically significant are shown in Table 1. FISH showed both deletions and losses at 9p21 (B) and 11q13 (C). In panels B and C, centromeric enumeration probes for chromosomes 9 (B) and 11 (C) are red, while probes for 9p21 (B) and 11q13 (C) are green.
FISH analysis using probes to the EGFR gene and the centromere of chromosome 7 (CEP7) in this case showed no EGFR amplification. None of the 61 cells analyzed had chromosome 7 hyperploidy (not shown). In contrast, FISH probing 9p21 and 11q13 found consistent losses at both loci in all five tumors studied (Table 2). Of note, case #4 in which aCGH failed was successfully studied using FISH. The losses were mostly in the form of monosomy on chromosomes 9 and 11, ranging from approximately 20% to 50%.
Table 2.
FISH on 9p21 and 11q13 in chordoid glioma. All four chordoid glioma cases probed at the 9p21 and 11q13 loci (see Materials and Methods) showed consistent losses. Total gain = amplification + hyperploidy; total loss = deletion + monosomy. Abbreviations: Amp = amplification; Hyper = hyperploidy; Del = deletion; Mono = monosomy.
| Fluorescence in situ hybridization (FISH) | |||||||
|---|---|---|---|---|---|---|---|
| Case # | Probe | Gain | Amp | Hyper | Loss | Del | Mono |
| 1 | 9p21 | 10.0% | 6.7% | 3.3% | 35.0% | 5.0% | 31.7% |
| 11q13 | 15.0% | 15.0% | 0.0% | 33.3% | 8.3% | 25.0% | |
| 2 | 9p21 | 10.6% | 6.10% | 4.50% | 54.5% | 16.7% | 39.4% |
| 11q13 | 5.0% | 5.0% | 0.0% | 31.7% | 8.3% | 25.0% | |
| 3 | 9p21 | 11.7% | 8.30% | 3.0% | 55.0% | 8.3% | 46.7% |
| 11q13 | 0.0% | 0.00% | 0.0% | 31.7% | 13.3% | 18.3% | |
| 4 | 9p21 | 6.7% | 5.0% | 1.7% | 41.7% | 8.3% | 33.3% |
| 11q13 | 7.9% | 7.9% | 0.0% | 42.9% | 4.8% | 39.7% | |
| 5 | 9p21 | 20.0% | 8.3% | 11.7% | 43.3% | 5% | 38.3% |
| 11q13 | 15.0% | 15.0% | 0% | 40.0% | 10% | 30.0% | |
Sequencing of TP53 exons 4–11 in cases #1, 2, 4 and 5 showed no mutations (not shown). Insufficient material was available to sequence TP53 in case #3.
DISCUSSION
The term “chordoid glioma” was originally developed to identify a third ventricular tumor that had histologic similarities to chordomas but expressed the glial marker GFAP (4). Since then, the protein expression and ultrastructure of this tumor have been characterized more fully. In this paper, we described a case of chordoid glioma arising in a 41‐year‐old man. This particular tumor featured the most common radiologic characteristics of chordoid gliomas, with anterior third ventricular location, homogeneity, isointensity and contrast enhancement 13, 27, 36. It also had calcifications as described recently in another case (16). Histologically, the tumor displayed all the key components of chordoid gliomas, including epithelioid cells arranged in clusters and cords, mucinous matrix, lymphoplasmacellular infiltrate with Russell bodies, Rosenthal fibers in adjacent brain and a lack of mitoses, endothelial proliferation or necrosis 4, 29, 37.
The immunohistochemical profile of this tumor is also generally consistent with what has been reported in chordoid gliomas, featuring strong diffuse GFAP and vimentin expression with focal EMA, CD34 and S100 positivity (24). At 3%, the Ki67 proliferation index was within the range reported for most chordoid gliomas, again confirming the clinical impression of low growth rate. Of note, synaptophysin was strongly, but focally, expressed in this index tumor (Figure 4F) as well as in two of the four additional cases, which is the first time this has been reported in a chordoid glioma 20, 24. E‐cadherin expression was not found in this tumor, unlike one case previously reported (33). Of interest, the regions of the tumor that did not express the cell adhesion molecules CD31 and CD34 are also the areas that were strongest for GFAP. These cells were more glia‐like, with elongated morphology and longer fibrillary processes. The cells that expressed CD31, CD34 and EMA showed a more epithelioid appearance and weaker GFAP staining.
Some of the classic genetic abnormalities seen in gliomas, including trisomy 7 or EGFR amplification, were not seen in the case described clinically in this report, nor were there any TP53 mutations in any of the cases studied. These results are in concordance with those published previously (29). Moreover, although the 22q loss characteristic of many ependymomas (9) was not seen in these chordoid gliomas, losses in chromosome 9 have been described in clear cell ependymomas and supratentorial ependymomas 18, 30, 32. In another study of chordoid glioma genetics, Reifenberger et al (29) detected no imbalances in four tumors using conventional CGH, which has an approximate resolution of 10 Mb. aCGH, in contrast, can detect gains and losses of as little as 1 Mb or lower (26). This could account for some of the discrepancies between these two studies. What is more difficult to reconcile is monosomy of chromosome 9 and 11 in the current study of five cases, as such large losses should be detectable by conventional CGH if present in a sufficient percentage of cells. Given the unavoidably small numbers of cases in each study, this may simply indicate variation in the degree of monosomy observed in individual cases.
Regarding some apparent incongruities between the FISH and aCGH results (Figure 6 and 1, 2), although FISH is an accepted method for verifying aCGH results, there can be differences between the techniques and the data generated from each method. In brief, aCGH is a summation of the DNA copy number from thousands of tumor cells and is thus susceptible to “dilution” by admixed non‐neoplastic tissue, while FISH probes individual cells and each cell is independently scored. Thus, while 25%–30% of tumor cells in case #1 had monosomy of chromosomes 9 and 11 by FISH, this prevalence of monosomy may not have been sufficient to cause unequivocal widespread loss of those chromosomes when studied using aCGH, particularly as formalin‐fixed, paraffin‐embedded tissues inevitably generate more signal “noise” compared with fresh‐frozen tissue (26). Moreover, losses detected by aCGH could be caused by mutations that impair hybridization to the chip. Another possibility is that some gains seen on aCGH are false‐positive because they are adjacent to areas of loss, thereby altering the data analysis algorithms. FISH has a known degree of monosomy in paraffin‐embedded tissue such that monosomy is only considered significant if it is present in more than 20% of the cells—a cutoff that is exceeded by most of the cases in this analysis.
A full assessment of all the genes on both 9p21 and 11q13 with regard to tumorigenesis is beyond the scope of this study. However, it is notable that the INK4A/ARFlocus on 9p21 encodes p16INK4, which induces cell cycle arrest in G1 phase. The alternative splice product p14/p19ARF induces G1 and G2 arrest by stabilizing p53. Gliomas, particularly high‐grade gliomas, often show loss of this region (15). The 11q13 region contains MEN1, which encodes menin and is either mutated or deleted in multiple endocrine neoplasia 1, an autosomal recessive disease characterized by neoplasms of endocrine organs, for example, parathyroid adenomas, gastrinomas and carcinoid tumors, as well as nonendocrine tumors like angiofibromas and meningiomas (1). The function of menin is not yet known, but the pattern of inheritance would suggest some sort of tumor suppressor action.
Despite the low‐grade appearance of chordoid gliomas, its location and frequent adherence to the hypothalamus make gross total resection difficult, which is unfortunate given that the chief prognostic variable in these tumors appears to be whether the tumor is completely resected 4, 5, 20, 27. It can be impossible to adequately resect the tumor while avoiding postoperative sequelae, most notably diabetes insipidus and panhypopituitarism. In the current case, a full resection was grossly achieved, but the patient developed diabetes insipidus and panhypopituitarism requiring desmopressin, levothyroxine and hydrocortisone replacement therapy.
In summary, chordoid gliomas are rare, slow‐growing tumors of the third ventricle whose prognosis is dependent on whether total resection in a challenging anatomic location is possible. The tumor immunohistochemical profile includes GFAP, vimentin and CD34 positivity, among others. While calcifications and CD31 expression are also less commonly observed in chordoid gliomas, the presence of synaptophysin in three of our five cases suggests that larger specimens may contain focal reactivity. The tumor does not exhibit classic glioma molecular genetic patterns, but may have alterations at key loci including 9p21 and 11q13. Further research into potential molecular markers is warranted, as a better understanding of chordoid glioma tumorigenesis may yield insight toward adjuvant therapies when resection is not possible.
ACKNOWLEDGMENTS
The authors wish to thank Cary Sipos, Kimberly Fuhrer and Christopher Simmons for their excellent histologic and immunohistochemical work, and Kathleen Cumbie for her technical support with the FISH analysis. Support for this work came from the Pathology Departments of the University of Pittsburgh and Duke University.
REFERENCES
- 1. Agarwal SK, Lee Burns A, Sukhodolets KE, Kennedy PA, Obungu VH, Hickman AB et al (2004) Molecular pathology of the MEN1 gene. Ann N Y Acad Sci 1014:189–198. [DOI] [PubMed] [Google Scholar]
- 2. Baehring JM, Bannykh S (2006) Chordoid glioma of the third ventricle. J Neurooncol 76:269. [DOI] [PubMed] [Google Scholar]
- 3. Brat DJ (2006) The elusive origin of chordoid glioma. Arch Pathol Lab Med 130:437–438. [DOI] [PubMed] [Google Scholar]
- 4. Brat DJ, Scheithauer BW, Staugaitis SM, Cortez SC, Brecher K, Burger PC (1998) Third ventricular chordoid glioma: a distinct clinicopathologic entity. J Neuropathol Exp Neurol 57:283–290. [DOI] [PubMed] [Google Scholar]
- 5. Buccoliero AM, Caldarella A, Gallina P, Di Lorenzo N, Taddei A, Taddei GL (2004) Chordoid glioma: clinicopathologic profile and differential diagnosis of an uncommon tumor. Arch Pathol Lab Med 128:e141–e145. [DOI] [PubMed] [Google Scholar]
- 6. Cenacchi G, Giangaspero F (2004) Emerging tumor entities and variants of CNS neoplasms. J Neuropathol Exp Neurol 63:185–192. [DOI] [PubMed] [Google Scholar]
- 7. Cenacchi G, Roncaroli F, Cerasoli S, Ficarra G, Merli GA, Giangaspero F (2001) Chordoid glioma of the third ventricle: an ultrastructural study of three cases with a histogenetic hypothesis. Am J Surg Pathol 25:401–405. [DOI] [PubMed] [Google Scholar]
- 8. Fevre‐Montange M, Champier J, Szathmari A, Wierinckx A, Mottolese C, Guyotat J et al (2006) Microarray analysis reveals differential gene expression patterns in tumors of the pineal region. J Neuropathol Exp Neurol 65:675–684. [DOI] [PubMed] [Google Scholar]
- 9. Fuller CE, Perry A (2005) Molecular diagnostics in central nervous system tumors. Adv Anat Pathol 12:180–194. [DOI] [PubMed] [Google Scholar]
- 10. Gallina P, Pansini G, Mouchaty H, Mura R, Buccoliero AM, Lorenzo ND (2007) An incidentally detected third ventricle chordoid glioma. Neurol India 55:406–407. [DOI] [PubMed] [Google Scholar]
- 11. Galloway M, Afshar F, Geddes JF (2001) Chordoid glioma: an uncommon tumour of the third ventricle. Br J Neurosurg 15:147–150. [DOI] [PubMed] [Google Scholar]
- 12. Goyal R, Vashishta RK, Singhi S, Gill M (2007) Extraventricular unusual glioma in a child with extensive myxoid change resembling chordoid glioma. J Clin Pathol 60:1294–1295. [DOI] [PMC free article] [PubMed] [Google Scholar]
- 13. Grand S, Pasquier B, Gay E, Kremer S, Remy C, Le Bas JF (2002) Chordoid glioma of the third ventricle: CT and MRI, including perfusion data. Neuroradiology 44:842–846. [DOI] [PubMed] [Google Scholar]
- 14. Hanbali F, Fuller GN, Leeds NE, Sawaya R (2001) Choroid plexus cyst and chordoid glioma. Report of two cases. Neurosurg Focus 10:E5. [DOI] [PubMed] [Google Scholar]
- 15. Ivanchuk SM, Mondal S, Dirks PB, Rutka JT (2001) The INK4A/ARF locus: role in cell cycle control and apoptosis and implications for glioma growth. J Neurooncol 51:219–229. [DOI] [PubMed] [Google Scholar]
- 16. Iwami KI, Arima T, Oooka F, Fukumoto M, Takagi T, Takayasu M (2008) Chordoid glioma with calcification and neurofilament expression: case report and review of the literature. Surg Neurol corrected proof, doi: 10.1016/j.surneu.2007.07.032. [DOI] [PubMed] [Google Scholar]
- 17. Jain D, Sharma MC, Sarkar C, Suri V, Rishi A, Garg A, Vaishya S (2008) Chordoid glioma: report of two rare examples with unusual features. Acta Neurochir (Wien) 150:295–300. [DOI] [PubMed] [Google Scholar]
- 18. Jeuken JW, Sprenger SH, Gilhuis J, Teepen HL, Grotenhuis AJ, Wesseling P (2002) Correlation between localization, age, and chromosomal imbalances in ependymal tumours as detected by CGH. J Pathol 197:238–244. [DOI] [PubMed] [Google Scholar]
- 19. Jung TY, Jung S (2006) Third ventricular chordoid glioma with unusual aggressive behavior. Neurol Med Chir (Tokyo) 46:605–608. [DOI] [PubMed] [Google Scholar]
- 20. Kurian KM, Summers DM, Statham PF, Smith C, Bell JE, Ironside JW (2005) Third ventricular chordoid glioma: clinicopathological study of two cases with evidence for a poor clinical outcome despite low grade histological features. Neuropathol Appl Neurobiol 31:354–361. [DOI] [PubMed] [Google Scholar]
- 21. Leeds NE, Lang FF, Ribalta T, Sawaya R, Fuller GN (2006) Origin of chordoid glioma of the third ventricle. Arch Pathol Lab Med 130:460–464. [DOI] [PubMed] [Google Scholar]
- 22. Louis DN, Ohgaki H, Wiestler OD, Cavenee WK (2007) WHO classification of tumors of the central nervous system. In: World Health Organization Classification of Tumors. Ohgaki H (ed.), pp. 90–91. IARC: Lyon. [Google Scholar]
- 23. Nakajima M, Nakasu S, Hatsuda N, Takeichi Y, Watanabe K, Matsuda M (2003) Third ventricular chordoid glioma: case report and review of the literature. Surg Neurol 59:424–428. [DOI] [PubMed] [Google Scholar]
- 24. Pasquier B, Peoc'h M, Morrison AL, Gay E, Pasquier D, Grand S et al (2002) Chordoid glioma of the third ventricle: a report of two new cases, with further evidence supporting an ependymal differentiation, and review of the literature. Am J Surg Pathol 26:1330–1342. [DOI] [PubMed] [Google Scholar]
- 25. Piepmeier J, Baehring JM (2004) Surgical resection for patients with benign primary brain tumors and low grade gliomas. J Neurooncol 69:55–65. [DOI] [PubMed] [Google Scholar]
- 26. Pinkel D, Albertson DG (2005) Comparative genomic hybridization. Annu Rev Genomics Hum Genet 6:331–354. [DOI] [PubMed] [Google Scholar]
- 27. Pomper MG, Passe TJ, Burger PC, Scheithauer BW, Brat DJ (2001) Chordoid glioma: a neoplasm unique to the hypothalamus and anterior third ventricle. AJNR Am J Neuroradiol 22:464–469. [PMC free article] [PubMed] [Google Scholar]
- 28. Raizer JJ, Shetty T, Gutin PH, Obbens EA, Holodny AI, Antonescu CR, Rosenblum MK (2003) Chordoid glioma: report of a case with unusual histologic features, ultrastructural study and review of the literature. J Neurooncol 63:39–47. [DOI] [PubMed] [Google Scholar]
- 29. Reifenberger G, Weber T, Weber RG, Wolter M, Brandis A, Kuchelmeister K et al (1999) Chordoid glioma of the third ventricle: immunohistochemical and molecular genetic characterization of a novel tumor entity. Brain Pathol 9:617–626. [DOI] [PMC free article] [PubMed] [Google Scholar]
- 30. Rickert CH, Korshunov A, Paulus W (2006) Chromosomal imbalances in clear cell ependymomas. Mod Pathol 19:958–962. [DOI] [PubMed] [Google Scholar]
- 31. Ricoy JR, Lobato RD, Baez B, Cabello A, Martinez MA, Rodriguez G (2000) Suprasellar chordoid glioma. Acta Neuropathol 99: 699–703. [DOI] [PubMed] [Google Scholar]
- 32. Rousseau E, Palm T, Scaravilli F, Ruchoux MM, Figarella‐Branger D, Salmon I et al (2007) Trisomy 19 ependymoma, a newly recognized genetico‐histological association, including clear cell ependymoma. Mol Cancer 6:47. [DOI] [PMC free article] [PubMed] [Google Scholar]
- 33. Sato K, Kubota T, Ishida M, Yoshida K, Takeuchi H, Handa Y (2003) Immunohistochemical and ultrastructural study of chordoid glioma of the third ventricle: its tanycytic differentiation. Acta Neuropathol 106:176–180. [DOI] [PubMed] [Google Scholar]
- 34. Suh YL, Kim NR, Kim JH, Park SH (2003) Suprasellar chordoid glioma combined with Rathke's cleft cyst. Pathol Int 53:780–785. [DOI] [PubMed] [Google Scholar]
- 35. Takei H, Bhattacharjee MB, Adesina AM (2006) Chordoid glioma of the third ventricle: report of a case with cytologic features and utility during intraoperative consultation. Acta Cytol 50:691–696. [DOI] [PubMed] [Google Scholar]
- 36. Tonami H, Kamehiro M, Oguchi M, Higashi K, Yamamoto I, Njima T et al (2000) Chordoid glioma of the third ventricle: CT and MR findings. J Comput Assist Tomogr 24:336–338. [DOI] [PubMed] [Google Scholar]
- 37. Vajtai I, Varga Z, Scheithauer BW, Bodosi M (1999) Chordoid glioma of the third ventricle: confirmatory report of a new entity. Hum Pathol 30:723–726. [DOI] [PubMed] [Google Scholar]
- 38. Wanschitz J, Schmidbauer M, Maier H, Rossler K, Vorkapic P, Budka H (1995) Suprasellar meningioma with expression of glial fibrillary acidic protein: a peculiar variant. Acta Neuropathol 90:539–544. [DOI] [PubMed] [Google Scholar]