

Abstract
RCL2 is an alcohol‐based fixative reported to preserve histomorphology and nucleic acids in non‐CNS neoplasms. We compared histomorphology, immunohistochemistry, DNA and RNA in brain tumor specimens preserved frozen at −80°C, and after formalin or RCL2 fixation. RCL2‐fixed and paraffin‐embedded (RCLPE) samples showed well‐preserved histomorphology and specific immunoreactivity comparable to formalin‐fixed and paraffin‐embedded (FFPE) specimens testing a broad panel of antibodies. In all the analyzed cases, high‐molecular weight DNA (up to a fragment length of 600 bp) was amplifyable from RCLPE samples, even after prolonged fixation times. Beta‐actin (ACTB) and O6‐methylguanine‐methyltransferase (MGMT) gene concentrations were significantly higher in DNA isolated from RCLPE specimens as compared with FFPE specimens. Testing of MGMT promoter methylation status using methylation‐specific polymerase‐chain reaction (MSP) yielded conclusive results in 8/8 analyses in RCLPE and 6/8 analyses in FFPE material, respectively. Amplification of three reference genes (ABL, RAR‐alpha, BCR‐1) from cDNA showed good RNA preservation in frozen and RCLPE tissue specimens and significant RNA degradation in all FFPE samples. In conclusion, RCL2 fixation of brain tumor biopsies does not seem to significantly compromise histological tumor typing or immunohistochemistry and preserves nucleic acids (DNA and RNA) at a better quality than formalin fixation.
Keywords: brain tumor, immunohistochemistry, molecular analysis, neuropathology, tissue fixation
INTRODUCTION
Since decades, formalin fixation and paraffin embedding (FFPE) of biopsy specimens is used as standard procedure for tissue preservation in (neuro‐)surgical pathology worldwide. FFPE warrants well preserved histomorphology that allows reliable tumor typing by means of light‐microscopic evaluation of histopathologic features. Furthermore, many proteins and their epitopes retain their characteristics and can be visualized by means of immunohistochemistry. Due to low toxicity, handling of formalin necessitates only minor safety precautions. FFPE tissue specimens can be stored at room temperature over many years.
Nowadays, molecular analyses of brain tumor specimens at the genetic and epigenetic levels are becoming relevant for diagnostic, prognostic or predictive considerations 3, 7, 25. However, nucleic acid quality and reliability of molecular tests are negatively affected by formalin‐fixation 2, 6, 14, 16, 18. Previous studies have shown that formalin fixation leads to nucleic acid degradation and may be associated with sequence alterations (artificial mutations) and base modifications 12, 18, 23, 24.
Some centers collect frozen tissue samples in addition to FFPE tissue samples, in particular for expression studies and translational research purposes. Unfortunately, freezing of brain tumor tissue samples impairs histomorphology and therefore diagnostic tumor typing remains to be based on FFPE. Thus, histomorphology and molecular analyses have to be performed from two different tissue samples, which could hamper a direct comparison of results. Moreover, maintenance of a frozen tissue bank is complex and costly. Collection of frozen brain tumor samples in the frame of multi‐centric clinical trials with companion tissue‐based translational research has proven problematic in particular for logistic and economic reasons. Alternative methods of tissue fixation that do not impair nucleic acid quality and at the same time warrant high quality histopathology and facilitate molecular analysis are needed. In the recent years, several new fixatives have been proposed as alternative to formalin fixation 5, 13, 17. Among them, RCL2 seems to be a promising candidate. RCL2 is a commercial alcohol‐based fixative containing ethanol and acetic acid that has been described to preserve histomorphology and nucleic acid integrity in breast and thyroid tumors 5, 8. In our study we analyzed for the first time the effect of RCL2 fixation on histomorphology, immunohistochemistry, and DNA and RNA quality in comparison to freezing and formalin‐fixation in neurosurgical biopsy specimens.
MATERIALS AND METHODS
Materials
We prospectively collected brain tumor specimens of 49 patients operated at the Department of Neurosurgery, Medical University of Vienna (Table 1). For diagnostic work‐up all specimens were submitted to the Institute of Neurology (Neuropathology) and histopathological typing of the tumors was performed according to the current World Health Organization (WHO) Classification of Tumors of the Central Nervous System (10). Case selection was based on the following inclusion criteria: (i) the entire surgical specimen was submitted directly from the operating theatre in unfixed condition (ii) parallel to standard neuropathological sampling and formalin‐fixation [4.5% buffered formaldehyde solution (SAV liquid production, Flintsbach am Inn, Germany)] for diagnostic purposes, a representative part of the specimen was fixed in RCL2 solution (Alphelys, Plaisier, France) according to manufacturer's instructions. For dehydration, FFPE and RCL2‐fixed/paraffin‐embedded RCLPE tissue specimens were incubated in ethanol solutions of increasing concentrations (FFPE tissues: 50%, 2 × 70%, 2 × 80%, 3 × 96%; RCLPE tissues: 70%, 100%). Formalin and RCL2‐fixed specimens were embedded in paraffin (Histotec, Merck, Darmstadt, Germany). All FFPE and RCLPE blocks were stored at room temperature. Of 44/49 cases, a representative part of the specimen was snap frozen and stored at −80°C.
Table 1.
Number of cases (n) per histological diagnosis used in this study.
| Histological diagnosis | n |
|---|---|
| Glioblastoma | 20 |
| Anaplastic astrocytoma | 1 |
| Diffuse astrocytoma | 8 |
| Oligoastrocytoma | 5 |
| Pilocytic astrocytoma | 2 |
| Pleomorphic xanthoastrocytoma | 1 |
| Anaplastic ependymoma | 3 |
| Ependymoma | 1 |
| Meningioma | 3 |
| Atypical meningioma | 1 |
| Anaplastic meningioma | 1 |
| Medulloblastoma/PNET | 2 |
| Metastasis (carcinoma) | 1 |
Neuropathology
Hematoxylin and eosin (HE) stain
For evaluation of histomorphology, 3‐ to 5‐µm thick sections were cut from all FFPE, RCLPE and frozen tissue samples and were stained with HE according to standard protocol.
Immunohistochemistry
For immunohistochemistry, sections were cut at a thickness of 3 to 5 µm from FFPE and RCLPE tumor tissue blocks. Antibodies and staining protocols used in this study are summarized in Table 2. Detection of immunostaining was performed using the EnVision™ FLEX+ kit (Dako, Glostrup, Denmark) and diaminobenzidine was used as chromogen.
Table 2.
Summary of antibodies and staining protocols used in this study. Abbreviations: FFPE = formalin‐fixed and paraffin‐embedded; RCLPE = RCL2‐fixed and paraffin‐embedded.
| Visualized antigen | Supplier (antibody, clonality) | Fixation type | Pretreatment (Supplier) | Antibody dilution | Antibody incubation time |
|---|---|---|---|---|---|
| GFAP | Dako, Glostrup, Denmark (Anti‐GFAP, pc) | FFPE | 5 min Proteinase K (Dako) | 1:3000 | 30 min |
| RCLPE | none | 1:3000 | 30 min | ||
| S‐100 protein | Dako, Glostrup, Denmark (Anti‐S100 protein, pc) | FFPE | none | 1:500 | 30 min |
| RCLPE | none | 1:500 | 30 min | ||
| Vimentin | Dako, Glostrup, Denmark (V9, mc) | FFPE | none | 1:50 | 30 min |
| RCLPE | none | 1:400 | 30 min | ||
| EMA | Dako, Glostrup, Denmark (E29, mc) | FFPE | FLEX TRS low (Dako) | 1:100 | 30 min |
| RCLPE | none | 1:100 | 30 min | ||
| Synaptophysin | Dako, Glostrup, Denmark (SY38, mc) | FFPE | FLEX TRS low (Dako) | 1:200 | 30 min |
| RCLPE | FLEX TRS low (Dako) | 1:200 | 30 min | ||
| NeuN | Chemicon, Tomecula, California, USA (A60, mc) | FFPE | FLEX TRS low (Dako) | 1:1000 | 30 min |
| RCLPE | FLEX TRS low (Dako) | 1:1000 | 30 min | ||
| Map‐2 | Chemicon, Tomecula, California, USA (AP20, mc) | FFPE | FLEX TRS low (Dako) | 1:8000 | 30 min |
| RCLPE | FLEX TRS low (Dako) | 1:8000 | 30 min | ||
| Phosphorylated neurofilament H and M | Sternberger Monoclonals, Lutherville, Maryland, USA (SMI31, mc) | FFPE | FLEX TRS low (Dako) | 1:50.000 | 30 min |
| RCLPE | FLEX TRS low (Dako) | 1:50.000 | 30 min | ||
| Nonphosphorylated neurofilament H | Sternberger Monoclonals, Lutherville, MD, USA (SMI32, mc) | FFPE | FLEX TRS low (Dako) | 1:200 | 30 min |
| RCLPE | FLEX TRS low (Dako) | 1:1000 | 30 min | ||
| NSE | Dako, Glostrup, Denmark (BBS/NC/VI‐H14, mc) | FFPE | FLEX TRS low (Dako) | 1:1000 | 30 min |
| RCLPE | FLEX TRS low (Dako) | 1:1000 | 30 min | ||
| CK | BMA Biomedicals (Lu‐5, mc) | FFPE | 5 min Proteinase K (Dako) | 1:100 | 30 min |
| RCLPE | none | 1:10 | 30 min | ||
| Ki‐67 | Dako, Glostrup, Denmark (MIB1, mc) | FFPE | FLEX TRS low (Dako) | 1:200 | 30 min |
| RCLPE | FLEX TRS high (Dako) | 1:200 | 30 min |
Neuropathological evaluation
Comparison of histological and cellular features of HE stained sections and immunohistochemical staining results of FFPE and RCLPE specimen was performed in an unblinded fashion by JAH (consultant in neuropathology) and MP (medical oncologist with training background in neuropathology) on a multiheaded microscope.
Evaluation of DNA quality
We performed DNA extraction, spectrophotometric determination of DNA concentration and purity, and multiplex polymerase chain reaction (PCR) with subsequent gel electrophoresis to analyze DNA quantity and quality in 13 FFPE, 13 RCLPE and 11 frozen tissue specimens (Table 3).
Table 3.
The table summarizes the results of DNA and RNA integrity checks according to fixation conditions. Abbreviations: AA = anaplastic astrocytoma; AOA = anaplastic oligoastrocytoma; bp = base pairs; DA = diffuse astrocytoma; DNA = deoxyribonucleic acid; GBM = glioblastoma multiforme; PXA = pleomorphic xanthoastrocytoma; RNA = ribonucleic acid.
| ID | Histo‐Nr. | Histological diagnosis | Fixation type | Fixation time (days) | Amplifiable DNA reference genes (bp) | Amplifiable RNA reference genes (bp) |
|---|---|---|---|---|---|---|
| 1 | N1420‐08 | GBM | Frozen | 100, 200, 300, 400, 600 | 238, 295, 377 | |
| RCL2 | 1 | 100, 200, 300, 400, 600 | 238, 295, 377 | |||
| Formalin | 1 | 100, 200, 300, 400, 600 | 238 | |||
| 2 | N225‐09 | GBM | Frozen | 100, 200, 300, 400, 600 | 238, 295, 377 | |
| RCL2 | 1 | 100, 200, 300, 400, 600 | 238, 295, 377 | |||
| Formalin | 1 | 100, 200, 300, 400, 600 | 238 | |||
| 3 | N234‐09 | GBM | Frozen | 100, 200, 300, 400, 600 | 238, 295, 377 | |
| RCL2 | 1 | 100, 200, 300, 400, 600 | 238, 295, 377 | |||
| Formalin | 1 | 100, 200, 300, 400, 600 | 238, 377 | |||
| 4 | N1366‐08 | Meningothelial meningioma | Frozen | 100, 200, 300, 400, 600 | 238, 295, 377 | |
| RCL2 | 1 | 100, 200, 300, 400, 600 | 238, 295, 377 | |||
| Formalin | 1 | 100, 200, 300, 400, 600 | 238, 377 | |||
| 5 | N1369‐08 | Metastasis (carcinoma) | Frozen | 100, 200, 300, 400, 600 | 238, 295, 377 | |
| RCL2 | 1 | 100, 200, 300, 400, 600 | 238, 295, 377 | |||
| Formalin | 1 | 100, 200, 300, 400, 600 | 238, 377 | |||
| 6 | N392‐09 | GBM | Frozen | 100, 200, 300, 400, 600 | 238, 295, 377 | |
| RCL2 | 2 | 100, 200, 300, 400, 600 | 238, 295, 377 | |||
| Formalin | 2 | 100, 200, 300, 400, 600 | 238 | |||
| 7 | N401‐09 | AOA | Frozen | 100, 200, 300, 400, 600 | 238, 295, 377 | |
| RCL2 | 2 | 100, 200, 300, 400, 600 | 238, 295, 377 | |||
| Formalin | 2 | 100, 200, 300, 400, 600 | 238, 377 | |||
| 8 | N98‐09 | Medulloblastoma | Frozen | 100, 200, 300, 400, 600 | 238, 295, 377 | |
| RCL2 | 3 | 100, 200, 300, 400, 600 | 238, 295, 377 | |||
| Formalin | 1 | 100, 200, 300, 400, 600 | 238 | |||
| 9 | N1509‐08 | GBM | Frozen | 100, 200, 300, 400, 600 | na | |
| RCL2 | 3 | 100, 200, 300, 400, 600 | 238, 295, 377 | |||
| Formalin | 3 | 100, 200, 300, 400, 600 | 238 | |||
| 10 | N1377‐08 | DA | Frozen | 100, 200, 300, 400, 600 | 238, 295, 377 | |
| RCL2 | 3 | 100, 200, 300, 400, 600 | 238, 377 | |||
| Formalin | 3 | 100, 200, 300, 400, 600 | 238 | |||
| 11 | N1492‐08 | DA | Frozen | 100, 200, 300, 400, 600 | 238, 295, 377 | |
| RCL2 | 3 | 100, 200, 300, 400, 600 | 238, 377 | |||
| Formalin | 3 | 100, 200, 300, 400, 600 | 238 | |||
| 12 | N87‐09 | AA | Frozen | 100, 200, 300, 400, 600 | 238, 295, 377 | |
| RCL2 | 6 | 100, 200, 300, 400, 600 | 238, 295, 377 | |||
| Formalin | 3 | 100, 200, 300, 400 | 238 | |||
| 13 | N191‐09 | PXA | Frozen | 100, 200, 300, 400, 600 | na | |
| RCL2 | 8 | 100, 200, 300, 400, 600 | 238, 295, 377 | |||
| Formalin | 8 | 100, 200, 300, 400 | 238 |
Nucleic acid degradation was estimated by evaluation of the length of reference DNA fragments generated in a multiplex PCR system, respectively. In the presence of undegraded DNA, reference DNA fragments of 100, 200, 300, 400 and 600 bp are expected. In the presence of undegraded RNA, reference gene amplificates of 238, 295 and 377 bp are expected. Failure to amplify reference DNA fragments indicates DNA or RNA degradation, respectively.
DNA extraction
From each FFPE and RCLPE tissue block 5 serial sections of an approximate thickness of 10 µm (in total about 50 µm) were used for DNA extraction. Of each frozen tissue sample, approximately 25 mg were taken for DNA extraction. DNA was extracted with the QIAamp DNA Mini Kit™ (QIAGEN GmbH, Hilden, Germany) following the protocol recommended by the manufacturer for tissue samples.
Determination of DNA concentration and quality
Optical density (OD) at 260 and 280 nm was determined using the Nanodrop ND‐1000 spectrophotometer (NanoDrop Technologies Inc., Wilmington, DE, USA). DNA concentrations were calculated from the OD measured at 260 nm using a wavelength dependent extinction coefficient of 50 ng‐cm/µL for double stranded DNA. The ratio of OD at 260 nm to OD 280 nm was calculated and served as criteria for DNA quality.
Multiplex PCR and gel electrophoresis
To evaluate the suitability of the isolated DNA for PCR amplification and to estimate the degree of degradation of the DNA a multiplex PCR was performed using the BIOMED‐2 Template Amplification Control Master Mix: Multiple oligonucleotides targeting housekeeping genes (IdentyClone™ Kits, InVivoScribe Technologies, San Diego, CA, USA). The PCR was performed according to the recommendations of the manufacturer. In the presence of undegraded DNA, fragments of 100, 200, 300, 400 and 600 base pairs (bp) should be generated. The PCR products were analyzed by polyacrylamide gel electrophoresis using precast 5% Criterion™ gels (1.0 mm,18 wells, Bio‐Rad Laboratories, Hercules, CA,USA) followed by staining with SybrGreen (SybrGreen I Nucleic Acid Gel Stain, Invitrogen Corp, Carlsbad, CA, USA). Results were documented with the Densitometer: FluorChem™ SP (Alpha Innotech, San Leandro, CA USA).
O6‐methylguanine‐methyltransferase methylation‐specific PCR (MGMT MSP)
Of the four GBM cases, we prepared two sections of an approximate thickness of 20 µm of each FFPE and RCLPE tissue block, respectively. All 16 samples were sent to Oncomethylome Sciences (Amsterdam, the Netherlands) for quantitative MGMT MSP. The samples were coded so that OMS laboratories were unaware of the fixation type and case allocations of each sample at the time of MGMT MSP analysis. DNA isolation, DNA bisulfite modification and real‐time MGMT MSP using beta‐actin (ACTB) as reference gene were performed as previously described (22). In brief, the MGMT MSP assay determines the MGMT gene promoter methylation status by amplification of methylated DNA sequences of sodium bisulfate treated DNA. The copy number of methylated MGMT promoter is normalized to the ACTB gene.
Evaluation of RNA quality
RNA extraction
From each FFPE and RCLPE tissue block 5 serial sections of an approximate thickness of 10 µm (in total about 50 µm) were used for RNA extraction. Of each frozen tissue sample, approximately 25 mg were taken. The extractions were performed with the RNeasy FFPE Kit™ (QIAGEN GmbH) for paraffin embedded tissues, and the RNeasy Mini Kit™ (QIAGEN GmbH) for frozen samples following the protocol recommended by the manufacturer.
Estimation of RNA concentration and purity
OD at 260 and 280 nm was determined using the Nanodrop ND‐1000 spectrophotometer (NanoDrop Technologies Inc., Wilmington, DE, USA). RNA concentrations were calculated from the OD measured at 260 nm using a wavelength dependent extinction coefficient of 40 ng‐ cm/µL. The ratio of OD at 260 nm to OD 280 nm was calculated and served as criteria for RNA quality. Only samples with a ration of >1.9 were used for cDNA synthesis.
cDNA synthesis, reference gene amplification and gel electrophoresis
cDNA synthesis was performed with the High‐Capacity cDNA Reverse Transcription Kit with RNase Inhibitor (Applied Biosystems Inc., Foster City, CA, USA) following the manufacturers protocol. Usually, between 200 and 2000 ng RNA were subjected to cDNA synthesis. To evaluate the cDNA quality a reference gene PCR was performed for the BCR1, the RAR alpha and the ablson protooncogene as previously described (19). The PCR products were analyzed in the same was as described for the DNA samples.
Statistics
The software package SAS SPSS (SPSS Inc., Chicago, IL, USA) was used for statistical calculations. We used the paired‐sampled T‐test to test the association of the fixation type (FOR, RCL2 or frozen) with OD 260/280 nm ratios. A two‐tailed P value of 0.05 was considered significant.
RESULTS
Neuropathology
Microscopic evaluation of HE sections on a multi‐headed microscope led us to the conclusion that the quality of histological and cytological features of RCLPE neurosurgical brain tumor samples is comparable to that of FFPE samples.
Histology
Meningioma
Both FFPE and RCLPE HE sections showed typical features of meningioma including syncytial pattern and “whorls” (Figure 1A and B). In atypical and anaplastic meningioma sheet‐like growth pattern, brain invasion, necrosis and increased mitotic activity were apparent in FFPE and RCLPE specimens, respectively.
Figure 1.
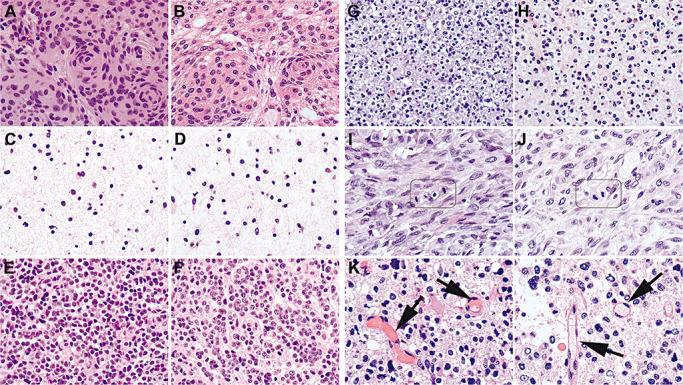
Exemplary images showing that the quality of RCL2‐fixed and paraffin‐embedded (RCLPE) neurosurgical brain tumor samples is comparable to that of formalin‐fixed and paraffin‐embedded (FFPE) sample after standard hematoxylin and eosin (HE) staining. Meningothelial meningioma showing typical syncytial pattern and “whorls” in FFPE (A) and RCLEPE (B) specimens. Diffuse astrocytoma showing characteristic gliofibrillary matrix in FFPE (C) and RCLPE (D) specimens. Medulloblastoma showing high nuclear density and tumor cells with round to oval hyperchromatic nuclei surrounded by scanty cytoplasm in FFPE (E) and RCLPE (F) specimens. Oligoastrocytoma showing typical perinuclear halos both in FFPE (G) and RCLPE (H) samples. Mitotic figures are clearly identifiable in FFPE (I) and RCLPE (J) tissue specimens in a representative glioblastoma case. Erythrocytes (arrows) are usually brightly eosinophilic in FFPE tissue (K) and appear “empty” in RCLPE tissue samples (L).
Gliomas
In HE stained sections of both FFPE and RCLPE specimens, the typical histopathological features of gliomas were apparent including the characteristic gliofibrillary matrix in diffuse (Figure 1C and D), anaplastic and pilocytic astrocytoma, oligoastrocytoma and glioblastoma multiforme (GBM), perinuclear halos of the oligodendroglial component of oligoastrocytoma (Figure 1G and H), calcifications in oligoastrocytoma, pseudorosettes in ependymoma, Rosenthal fibers in pilocytic astrocytoma, necroses and vascular proliferations in GBM and xanthomatous cells and granular bodies in pleomorphic xanthoastrocytoma (PXA).
Medulloblastoma/primitive neuroectodermal tumor (PNET)
HE‐stained sections of both FFPE and RCLPE tissue blocks showed characteristic histomorphology of medulloblastoma and PNET with high nuclear density and tumor cells with round to oval hyperchromatic nuclei surrounded by scanty cytoplasm (Figure 1E and F).
Metastatic carcinoma
HE‐stained sections of FFPE and RCLPE tissue blocks showed polymorphic tumor cells, marked nuclear atypia, intracellular pigment and extensive necrosis.
Cytological features
Cytoplasmic and nuclear details were well discernible in HE‐stained sections of FFPE and RCLPE tissue blocks, including clearly identifiable mitotic figures (Figure 1I and J) and apoptotic bodies. Erythrocytes were usually brightly eosinophilic in FFPE sections and mostly appeared “empty” in RCLPE tissue samples (Figure 1K and L). This feature is not relevant for diagnostic brain tumor typing.
Immunohistochemistry
All immunostainings revealed specific antibody binding in RCLPE sections and showed staining signals of comparable intensity as in FFPE tissue. For most antibodies the staining protocol used for FFPE did not need to be adapted for staining of RCLPE specimens; only slight adaptations of tissue section pretreatment or antibody concentration were necessary for GFAP, EMA, nonphosphorylated neurofilament H and CK immunostainings (see Table 2).
Glial markers: GFAP, S100 protein, vimentin, EMA
All glial markers showed comparable immunostaining results in FFPE and RCLPE specimens. Tumor cell cytoplasms were distinctly immunolabeled by anti‐GFAP immunostaining (Figure 2A and B) in astrocytic and by anti‐S100 (Figure 2C and D) and anti‐vimentin immunostaining (Figure 2E and F) in glial neoplasms. Anti‐EMA immunostaining showed strong cytoplasmic labelling in FFPE and RCLPE meningioma specimens. In ependymal neoplasms, anti‐EMA immunostaining showed characteristic intracytoplasmic dot‐like staining pattern (Figure 2G and H) and labeled ependymal surfaces both in FFPE and RCLPE specimens.
Figure 2.
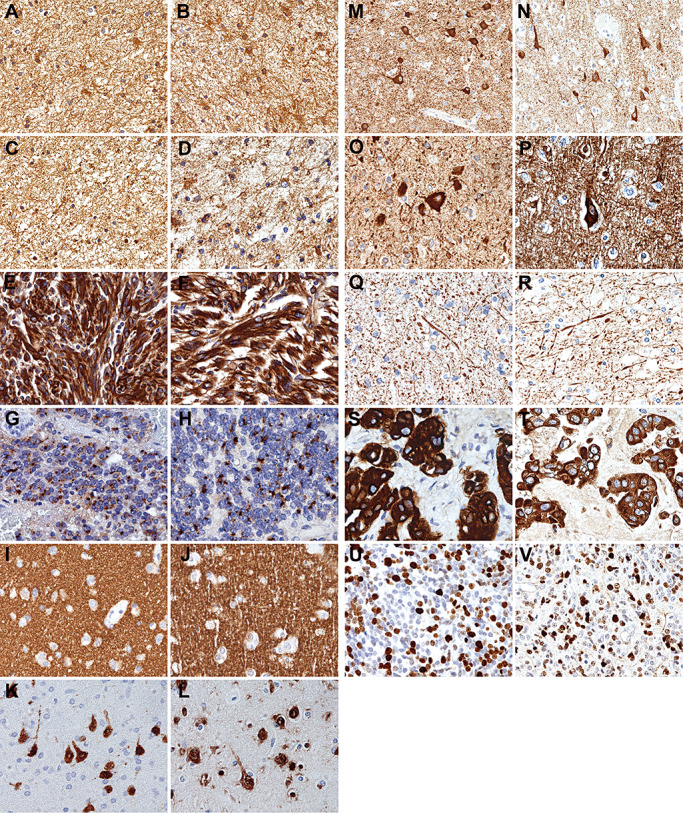
Representative images showing that the quality of immunostaining on RCL2‐fixed and paraffin‐embedded (RCLPE) neurosurgical brain tumor samples is comparable to that of formalin‐fixed and paraffin‐embedded (FFPE) samples. Anti‐glial fibrillary acidic protein (GFAP) immunohistochemistry shows distinct immunolabelling of gliofibrillary matrix and cytoplasms in a case of diffuse astrocytoma in FFPE (A) and RCLPE (B) tissue samples. Anti‐S100 protein immunohistochemistry shows distinct immunolabelling of gliofibrillary matrix and cytoplasms in a case of diffuse astrocytoma in FFPE (C) and RCLPE (D) tissue samples. Anti‐vimentin immunohistochemistry shows strong and distinct immunolabelling of tumor cytoplasms in a case of glioblastoma in FFPE (E) and RCLPE (F) tissue samples. Anti‐epithelial membrane antigen (EMA) immunohistochemistry shows dot‐like staining signals (“EMA dots”) in a case of ependymoma in FFPE (G) and RCLPE (H) tissue samples. Anti‐synaptophysin immunostaining shows fine granular (“synaptic”) staining pattern in the cerebral cortex in FFPE (I) and RCLPE (J) specimens. Anti‐NeuN immunostaining shows distinct labeling of neuronal nuclei and cell bodies in the cerebral cortex in FFPE (K) and RCLPE (L) specimens. Anti‐MAP‐2 immunostaining shows distinct labeling of neuronal cell bodies in the cerebral cortex in FFPE (M) and RCLPE (N) specimens. Anti‐nonphosphorylated neurofilament immunostaining shows distinct labeling of neuronal cell bodies in the cerebral cortex in FFPE (O) and RCLPE (P) specimens. Anti‐phosphorylated neurofilament immunostaining shows distinct labeling of axons in the cerebral cortex in FFPE (Q) and RCLPE (R) specimens. Anti‐cytokeratin (CK) immunohistochemistry shows distinct labeling of tumor cells in a brain metastasis of a carcinoma in FFPE (S) and RCLPE (T) specimens. Anti‐Ki67 immunohistochemistry shows strong and distinct immunolabelling of a fraction of tumor cell nuclei in a case of medulloblastoma in FFPE (U) and RCLPE (V) tissue samples.
Neuronal markers: synaptophysin, NeuN, MAP‐2, phosphorylated and nonphosphorylated neurofilaments
All neuronal markers showed comparable immunostaining results in FFPE and in RCLPE specimens. Anti‐synaptophysin immunostaining showed diffuse fine granular labeling (“synaptic staining pattern”) of cortical neuropil (Figure 2I and J). Anti‐NeuN labeled neuronal nuclei and cell bodies in the cortex (Figure 2K and L) and anti‐MAP‐2 (Figure 2M and R) and anti‐nonphosphorylated neurofilament H (2O and 2P) showed distinct labeling of neuronal cell bodies. Anti‐phosphorylated neurofilament H and M showed distinct labeling of axons and neuronal processes (Figure 2Q and R).
Epithelial markers: EMA and CK
Anti‐EMA and anti‐CK showed strong and distinct immunolabelling of tumor cells in the brain metastasis of a carcinoma in FFPE and RCLPE specimens (Figure 2S and T).
Cell proliferation: Ki67
Anti‐Ki67 immunostaining showed distinct immunolabelling of tumor cell nuclei in RCLPE sections. Staining intensity and tissue distribution was comparable as observed in FFPE sections (Figure 2U and V).
DNA
DNA concentration
All DNA samples were dissolved in 200 µL Qiagen elution buffer. The DNA concentrations ranged from 4 to 48 (median 13) ng/µl in the FFPE specimens, from 5 to 59 (median 35) ng/µl in the RCLPE specimens, and from 9 to 79 (median 17) ng/µL in the frozen tissue specimens.
DNA quality
The ratio of OD 260/280 nm served as an indicator of DNA quality. High ratios indicate highly purified DNA, while low ratios indicate presence of contaminations. The OD 260/280 nm ratios ranged from 1.32 to 2.05 (median 1.84) in 13 analyzed FFPE specimens, from 1.24 to 1.94 (median 1.88) in 13 analyzed RCLPE specimens and from 1.43 to 1.96 (median 1.67) in 11 analyzed frozen tissue specimens. There was no statistically significant difference in OD 260/280 nm ratios between frozen, RCLPE and FFPE specimens (P > 0.05; paired samples t‐test).
DNA degradation
DNA fragments with a length of 600 bp were amplifyable in 11/11 frozen tissue samples, in 13/13 RCLPE samples and in 11/13 FFPE samples (Table 3, Figure 3). Even after prolonged fixation times, high‐molecular DNA was amplifiable from all RCLPE specimens. We found loss of high‐molecular DNA in two FFPE specimens after prolonged duration of fixation.
Figure 3.
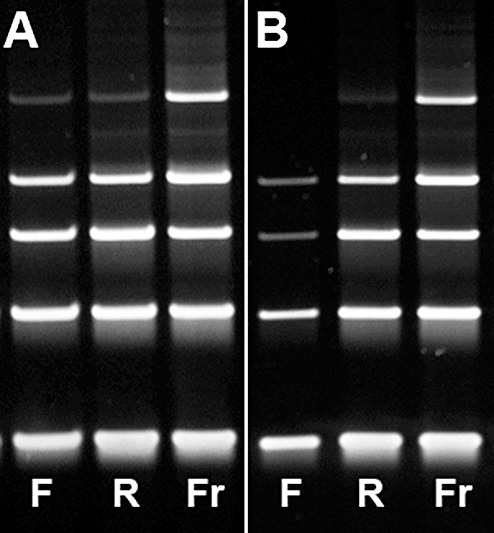
Exemplary images of gel electrophoresis of DNA amplified using PCR with primers for DNA fragments of 100 (lowest band), 200, 300, 400, 600 base pairs (bp) of two brain tumor cases. (A) Representative image for the majority of cases showing amplifiable DNA up to a fragment length of 600 bp in FFPE, RCLPE and frozen specimens (Case 7, Table 3). (B) In this case with prolonged fixation duration of 6 days for RCLPE and 3 days for FFPE (Case 12, Table 3), DNA extracted from frozen (Fr) and RCLPE (R) specimens is amplifiable up to a fragment length of 600 base pairs (bp), although the RCLPE 600 bp band is relatively weak. DNA extracted from the FFPE (F) tissue sample is amplifiable only up to a fragment length of 400 bp. The 300 bp and 400 bp bands are markedly weaker in the FFPE specimen as compared to the RCLPE specimen. Thus, there is evidence of significant DNA degradation in FFPE material.
MGMT MSP
Beta‐actin (ACTB) reference gene and O6‐methylguanine‐methyltransferas (MGMT) gene concentrations were significantly higher in DNA isolated from RCLPE specimens as compared to FFPE specimens (Figure 4). Testing of MGMT promoter methylation status using methylation‐specific polymerase‐chain reaction (MSP) yielded conclusive results in 8/8 analyses in RCLPE and 6/8 analyses in FFPE material (Table 4).
Figure 4.
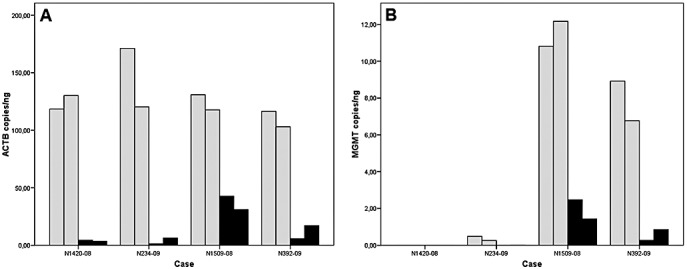
Bar graphs showing concentrations of beta‐actin (ACTB; A) and O6‐methylguanine‐methyltransferase (MGMT; B) gene copies in DNA isolated from FOUR glioblastoma cases. In each case, DNA was isolated twice from an RCL2‐fixed and paraffin‐embedded (RCLPE; gray bars) and from a formalin‐fixed and paraffin‐embedded (FFPE; black bars) tissue sample, respectively. ACTB and MGMT concentrations are significantly higher in DNA isolated from RCLPE specimens than in DNA isolated from FFPE specimens. See Table 4 for MGMT methylation‐specific PCR test results.
Table 4.
The table summarizes the results of repetitive O6‐methylguanine‐methyltransferase methylation‐specific polymerase‐chain reaction (MGMT MSP) testing in four glioblastoma cases. Abbreviations: m = methylated MGMT promoter; u = unmehtylated MGMT promoter.
| Fixation type | RCL2 | Formalin | ||
|---|---|---|---|---|
| MGMT MSP run | 1 | 2 | 1 | 2 |
| N1420‐08 | u | u | u | Invalid |
| N234‐09 | u | u | Invalid | u |
| N1509‐08 | m | m | m | m |
| N392‐09 | m | m | m | m |
In each case, two MGMT MSP analyses were performed from a RCL2‐fixed and paraffin‐embedded (RCLPE) specimen and two analyses were performed from a formalin‐fixed and paraffin‐embedded (FFPE) specimen. MGMT MSP was successful in eight of eight analyses from RCLPE specimens. In contrast, in FFPE specimens MGMT MSP yielded invalid results in two of eight analyses.
RNA
RNA concentration
In total, from frozen samples 440 to 10 080 ng, from RCLPE samples 780 to 12 860 ng and from FFPE samples 500 to 11 340 ng RNA were recovered. RNA concentrations ranged from 25 to 567 (median 107) ng/µL in 13 FFPE specimens (total volume 20 µL), from 39 to 643 (median 173) ng/µL in 13 RCLPE specimens (total volume 20 µL), and from 11 to 252 (median 53) ng/µl in 11 frozen tissue specimens (total volume 40 µL).
RNA quality
OD 260/280 nm served as indicator of RNA quality. The OD 260/280 nm ratios ranged from 1.59 to 2.03 (median 1.89) in FFPE specimens, from 1.56 to 2.04 (median 1.9) in RCLPE specimens and from 1.82 to 2.05 (median 1.96) in frozen tissue specimens. There was no statistically significant difference in OD 260/280 nm rations between frozen, RCLPE and FFPE specimens (P > 0.05; paired samples t‐test).
RNA degradation
All three reference genes (ABL 238 bp, RAR‐alpha 295 bp, BCR‐1377 bp) were amplifyable in 11/11 frozen tissue samples, in 11/13 RCLPE samples and in none of the FFPE samples (Table 3, Figure 5). In most FFPE samples only the ABL gene product was amplifyable. These findings indicate that RNA is degraded in FFPE samples and large fragments cannot be amplified.
Figure 5.
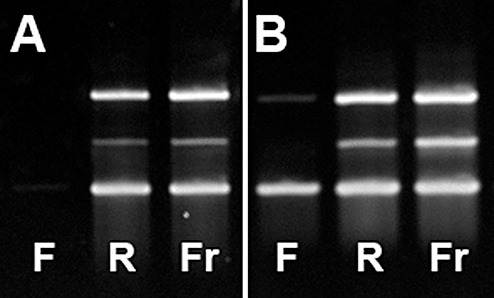
Exemplary images of gel electrophoresis of cDNA generated from RNA isolated from FFPE and RCLPE specimens and amplified using PCR with primers for three reference genes of different sizes (ABL gene: 238 bp, lower band; RAR‐alpha gene: 295 bp middle band; BCR‐1 gene: 377 bp: upper band). (A) Image of the case showing the worst result in FFPE (F) material (Case 12, Table 3). From FFPE tissue none of the three reference genes could be amplified. In contrast, all three genes are amplifiable from RCLPE (R) and frozen (Fr) specimens. (B) Image of the case showing the best result in FFPE (F) material (Case 2, Table 3). From FFPE tissue only the smallest and largest of the three reference genes could be amplified. In contrast, all three genes are amplifiable from RCLPE (R) and frozen (Fr) specimens.
DISCUSSION
Tissue‐based brain tumor diagnostics relies in first line on histological analysis (10). In the past years, several DNA‐based candidate biomarkers have emerged, which may complement histopathological diagnosis by providing additional prognostic or predictive information. A prerequisite for translation of such candidate biomarkers into clinics are reliable and validated laboratory methods (“analytical performance”) and high quality pre‐analytics. Currently, the most common practice of tissue preservation worldwide is formalin‐fixation which warrants good quality of histopathology but damages DNA and RNA and affects their quality and usefulness for molecular biological analysis. Attempts to avoid this problem by collecting frozen tissue samples in addition to formalin‐fixed samples have been made. Freezing of tissue samples is known to preserve nucleic acids. However, a number of organizational and logistic problems make standardized collection of frozen tissue samples very difficult. Sampling and storage of frozen tissues is cost‐intensive, because special equipment (−80°C freezers, nitrogen tanks) and consumables (eg, liquid nitrogen) are required, and there are additional operating expenses (eg, electric power, continuous surveillance of freezing conditions). The infrastructure and logistics needed for preservation of frozen tissue samples are lacking in many centers. Furthermore, freezing artifacts impair histopathological analyzability. Transportation of frozen tissue samples from one laboratory to another is complicated and needs special equipments for transportation. In addition, degradation of nucleic acids, particularly RNA, during storage or thawing of the tissue samples cannot be fully excluded. Alternative methods of tissue preservation that warrant the advantages of formalin‐fixation (good quality histomorphology, easy and inexpensive sampling, storage, and transportation) and at the same time do not impair nucleic acid quality would be of interest. Two recent studies on noncentral nervous system neoplasms have reported that RCL2‐fixation provides these combined advantages 5, 8. In the present study, we evaluated for the first time systematically histomorphology and nucleic acid preservation in formalin‐ and RCL2‐fixed brain tumor tissue samples. We show that histological and cytological characteristics of brain tumors are well preserved in RCLPE specimens. In our hands typing of brain tumors according to WHO criteria (10) does not seem to be compromised by RCL2 fixation. In line with previous studies we show that DNA and RNA are generally better preserved in RCLPE specimens than in FFPE specimens 5, 8. Our findings are in keeping with a previous study showing that histology, immunohistochemistry and RNA integrity are preserved in 70% ethanol‐fixed mouse brain specimens (20). Ethanol is also the main constituent of RCL2.
A recent study using a novel method for DNA extraction reported that DNA fragments of lengths of up to 200 bp were extractable from archival FFPE tissue specimens, while larger DNA fragments were not amplifiable (9). In line with this report, we found loss of high‐molecular DNA in some FFPE specimens after prolonged duration of fixation. In contrast, we could amplify fragments of up to 600 bp from DNA extracted from RCLPE specimens even after prolonged fixation times.
Besides RCL2, other fixatives, for example, hepes glutamic acid buffer‐mediated organic solvent protection effect fixation (HOPE) (13), Universal Molecular Fixative (UMFIX) (21), or methacarn 4, 15, 17 have been reported to preserve both histomorphology and DNA. However, these methods are less practicable than RCL2‐fixation. HOPE requires long fixation times (optimal fixation time: 40 h) and low‐melting paraffin for embedding. Histomorphology of UMFIX‐fixed tissue specimens has been reported to be “unacceptable” in one study (4). Methacarn has to be freshly prepared from methanol, chloroform and glacial acetic acid before each use, which may cause problems in standardization.
We found that immunohistochemistry works satisfactorily in RCLPE brain tumor specimens using a broad panel of diagnostically relevant antibodies. For most antibodies no adaptations of the immunostaining protocols routinely used for FFPE material were necessary to achieve satisfactory staining results on RCLPE specimens. Few antibodies (anti‐GFAP, anti‐EMA, anti‐CK and anti‐nonphosphorylated neurofilament H) required slight adaptations of immunostaining protocols like omission of antigen retrieval prior to antibody incubation or lower antibody concentration in RCLPE samples (Table 2). In line with our experience, three previous studies on non‐CNS tissues have shown that immunohistochemistry using various antibodies yielded staining results of comparable quality in RCLPE and FFPE tissues 1, 5, 8. In addition, Belief et al reported that RCLPE tissue showed higher protein yield than FFPE and frozen tissues (1). On mono and bidimensional electrophoresis, similar protein patterns were observed in RCLPE and frozen tissues. Furthermore, detection of membrane, cytoplasmic and nuclear proteins, as well as phosphorylated proteins was feasible by means of Western blot analysis of RCLPE tissues. Protein patterns observed by mass spectrometry analysis were found to be identical for frozen and RCL2‐fixed tissues in two studies 1, 11. Altogether, current evidence indicates that proteins are well preserved and analyzable in RCLPE tissues.
Currently available data indicate that RCLPE may allow extraction of a wider spectrum of bio‐information from neurosurgical tissue specimens than FFPE or freezing. RCLPE as adjunct to FFPE could facilitate molecular translational biomarker research. For example, RCL2‐fixation may be useful as alternative to the collection of frozen tissue samples for companion translational research in clinical trials. However, more experience with RCLPE has yet to be collected before complete replacement of FFPE by RCLPE may be considered. Particularly, preservation of histomorphology, proteins and nucleic acids after prolonged storage (eg, 1, 5, 10 years) of RCLPE specimens needs to be evaluated. Of note, Delfour et al reported preservation of tissue morphology and RNA integrity in RCLPE specimens after 8 months of storage (5).
According to our experience, implementation of RCL2‐fixation in a standard neuropathology laboratory is feasible. Toxicity of RCL2 is minor (light irritation skin, eyes, and mucosa upon contact) according to the supplier's information. The procedure of RCLPE (handling of tissue specimens and fixation solution, recommended fixation duration, paraffin embedding and tissue storage) is very similar to FFPE. The most notable difference concerns dehydration of specimens. This step requires different ethanol concentrations for FFPE and RCLPE. Therefore formalin and RCL2‐fixed specimens cannot be processed simultaneously in the same embedding machine. If RCLPE parallel to FFPE is performed on a regular basis, an additional embedding machine is needed.
Economic considerations: at our center the costs for formalin‐fixation are approximately 10 Eurocent per case whereas the costs for RCL2‐fixation are approximately 1 Euro per case. The costs for frozen samples are difficult to calculate but undoubtedly exceed the costs of RCL2‐fixation due to permanent maintenance and surveillance of freezing conditions.
CONFLICT OF INTEREST STATEMENT
There is no conflict of interest of any of the authors in respect to the article contents.
ACKNOWLEDGMENTS
We are grateful to Mrs Gerda Ricken (Institute of Neurology, Medical University of Vienna) for excellent technical assistance. We acknowledge Mr Greg Jones (Oncomethylome Sciences, Amsterdam, the Netherlands) for cooperation and support.
REFERENCES
- 1. Belief V, Boissiere F, Bibeau F, Desmetz C, Berthe ML, Rochaix P et al (2008) Proteomic analysis of RCL2 paraffin‐embedded tissues. J Cell Mol Med 12:2027–2036. [DOI] [PMC free article] [PubMed] [Google Scholar]
- 2. Bramwell NH, Burns BF (1988) The effects of fixative type and fixation time on the quantity and quality of extractable DNA for hybridization studies on lymphoid tissue. Exp Hematol 16:730–732. [PubMed] [Google Scholar]
- 3. Cairncross JG, Ueki K, Zlatescu MC, Lisle DK, Finkelstein DM, Hammond RR et al (1998) Specific genetic predictors of chemotherapeutic response and survival in patients with anaplastic oligodendrogliomas. J Natl Cancer Inst 90:1473–1479. [DOI] [PubMed] [Google Scholar]
- 4. Cox ML, Schray CL, Luster CN, Stewart ZS, Korytko PJ, M Khan KN et al (2006) Assessment of fixatives, fixation, and tissue processing on morphology and RNA integrity. Exp Mol Pathol 80:183–191. [DOI] [PubMed] [Google Scholar]
- 5. Delfour C, Roger P, Bret C, Berthe ML, Rochaix P, Kalfa N et al (2006) RCL2, a new fixative, preserves morphology and nucleic acid integrity in paraffin‐embedded breast carcinoma and microdissected breast tumor cells. J Mol Diagn 8:157–169. [DOI] [PMC free article] [PubMed] [Google Scholar]
- 6. Douglas MP, Rogers SO (1998) DNA damage caused by common cytological fixatives. Mutat Res 401:77–88. [DOI] [PubMed] [Google Scholar]
- 7. Hegi ME, Diserens AC, Gorlia T, Hamou MF, De Tribolet N, Weller M et al (2005) MGMT gene silencing and benefit from temozolomide in glioblastoma. N Engl J Med 352:997–1003. [DOI] [PubMed] [Google Scholar]
- 8. Lassalle S, Hofman V, Marius I, Gavric‐Tanga V, Brest P, Havet K et al (2009) Assessment of morphology, antigenicity, and nucleic acid integrity for diagnostic thyroid pathology using formalin substitute fixatives. Thyroid 19:1239–1248. [DOI] [PubMed] [Google Scholar]
- 9. Lin J, Kennedy SH, Svarovsky T, Rogers J, Kemnitz JW, Xu A, Zondervan KT (2009) High‐quality genomic DNA extraction from formalin‐fixed and paraffin‐embedded samples deparaffinized using mineral oil. Anal Biochem 395:265–267. [DOI] [PMC free article] [PubMed] [Google Scholar]
- 10. Louis DN, Ohgaki H, Wiestler OD, Cavanee WK (2007) WHO Classification of Tumours of the Central Nervous System, 4th edn. IARC Press: Lyon. [DOI] [PMC free article] [PubMed] [Google Scholar]
- 11. Mange A, Chaurand P, Perrochia H, Roger P, Caprioli RM, Solassol J (2009) Liquid chromatography‐tandem and MALDI imaging mass spectrometry analyses of RCL2/CS100‐fixed, paraffin‐embedded tissues: proteomics evaluation of an alternate fixative for biomarker discovery. J Proteome Res 8:5619–5628. [DOI] [PMC free article] [PubMed] [Google Scholar]
- 12. Masuda T, Ide N, Kitabatake N (2005) Effects of chemical modification of lysine residues on the sweetness of lysozyme. Chem Senses 30:253–264. [DOI] [PubMed] [Google Scholar]
- 13. Olert J, Wiedorn KH, Goldmann T, Kuhl H, Mehraein Y, Scherthan H et al (2001) HOPE fixation: a novel fixing method and paraffin‐embedding technique for human soft tissues. Pathol Res Pract 197:823–826. [DOI] [PubMed] [Google Scholar]
- 14. Puchtler H, Meloan SN (1985) On the chemistry of formaldehyde fixation and its effects on immunohistochemical reactions. Histochemistry 82:201–204. [DOI] [PubMed] [Google Scholar]
- 15. Puchtler H, Waldrop FS, Meloan SN, Terry MS, Conner HM (1970) Methacarn (methanol‐Carnoy) fixation. Practical and theoretical considerations. Histochemie 21:97–116. [DOI] [PubMed] [Google Scholar]
- 16. Serth J, Kuczyk MA, Paeslack U, Lichtinghagen R, Jonas U (2000) Quantitation of DNA extracted after micropreparation of cells from frozen and formalin‐fixed tissue sections. Am J Pathol 156:1189–1196. [DOI] [PMC free article] [PubMed] [Google Scholar]
- 17. Shibutani M, Uneyama C, Miyazaki K, Toyoda K, Hirose M (2000) Methacarn fixation: a novel tool for analysis of gene expressions in paraffin‐embedded tissue specimens. Lab Invest 80:199–208. [DOI] [PubMed] [Google Scholar]
- 18. Srinivasan M, Sedmak D, Jewell S (2002) Effect of fixatives and tissue processing on the content and integrity of nucleic acids. Am J Pathol 161:1961–1971. [DOI] [PMC free article] [PubMed] [Google Scholar]
- 19. Stiegler G, Fischer G, Ramanathan G, Bencur P, Weigel G, Mannhalter C (2009) P‐selectin mRNA is maintained in platelet concentrates stored at 4 degrees C. Transfusion 49:921–927. [DOI] [PMC free article] [PubMed] [Google Scholar]
- 20. Su JM, Perlaky L, Li XN, Leung HC, Antalffy B, Armstrong D, Lau CC (2004) Comparison of ethanol versus formalin fixation on preservation of histology and RNA in laser capture microdissected brain tissues. Brain Pathol 14:175–182. [DOI] [PMC free article] [PubMed] [Google Scholar]
- 21. Vincek V, Nassiri M, Nadji M, Morales AR (2003) A tissue fixative that protects macromolecules (DNA, RNA, and protein) and histomorphology in clinical samples. Lab Invest 83:1427–1435. [DOI] [PubMed] [Google Scholar]
- 22. Vlassenbroeck I, Califice S, Diserens AC, Migliavacca E, Straub J, Di Stefano I et al (2008) Validation of real‐time methylation‐specific PCR to determine O6‐methylguanine‐DNA methyltransferase gene promoter methylation in glioma. J Mol Diagn 10:332–337. [DOI] [PMC free article] [PubMed] [Google Scholar]
- 23. Williams C, Ponten F, Moberg C, Soderkvist P, Uhlen M, Ponten J et al (1999) A high frequency of sequence alterations is due to formalin fixation of archival specimens. Am J Pathol 155:1467–1471. [DOI] [PMC free article] [PubMed] [Google Scholar]
- 24. Wong C, DiCioccio RA, Allen HJ, Werness BA, Piver MS (1998) Mutations in BRCA1 from fixed, paraffin‐embedded tissue can be artifacts of preservation. Cancer Genet Cytogenet 107:21–27. [DOI] [PubMed] [Google Scholar]
- 25. Yan H, Parsons DW, Jin G, McLendon R, Rasheed BA, Yuan W et al (2009) IDH1 and IDH2 mutations in gliomas. N Engl J Med 360:765–773. [DOI] [PMC free article] [PubMed] [Google Scholar]