

Abstract
Methylation of CpG islands in gene promoters can lead to gene silencing. Together with deletion or mutation, it may cause a loss of function of tumor suppressor genes. RASSF1A (3p21.3), NORE1A (1q32.1) and BLU (3p21.3) have been shown to be downregulated by methylation in cancer, and PTEN (10q23.3) and MGMT (10q26.1) are located in areas commonly deleted in astrocytomas. MGMT methylation predicts a better response and a longer overall survival in patients with glioblastomas treated with temozolomide. We analyzed 53 astrocytoma samples and 10 high‐grade glioma cell lines. Gene expression was assessed by RT‐PCR. Bisulfite sequencing, MSP and a melting curve analysis‐based real‐time PCR were performed to detect promoter methylation. Treatments with 5′‐aza‐2′‐deoxicitidine were applied to restore gene expression in cell lines. Ninety‐two percent of tumor samples were methylated for RASSF1A, 30%–57% for BLU and 47% for MGMT, suggesting promoter methylation of these genes to be a common event in glioma tumorigenesis. Only 4% of the tumors revealed a methylated promoter for NORE1A. No association between methylation and loss of expression could be established for PTEN. We identified de novo DNMTs overexpression in a subset of tumors which may explain the methylation phenotype of individual gliomas.
Keywords: DNMT, epigenetics, glioma, MCA‐Meth, methylation, tumor suppressor genes
INTRODUCTION
Astrocytomas account for more than 60% of all primary brain tumors. Epigenetic alterations contribute to glioma genesis. During tumorigenesis genome‐wide hypomethylation coincides with hypermethylation of CpG islands in selected gene promoters (4, 35). The former lead to genomic instability and overexpression of proto‐oncogene by promoter hypomethylation (9), the latter functionally inactivates tumor suppressor genes (TSGs) (29). Similar to genetic and chromosomal events, epigenetic changes are tissue and tumor type‐specific (14). Together with the observation of distinct methylation patterns in certain tumor entities, this helps define molecular subtypes of histopathologically identical tumors. For example, MGMT promoter methylation indicates a subtype of glioblastomas with a better susceptibility and a more favorable response to combined chemotherapy and radiotherapy (21). Here promoter methylation, similar to 1p/19q testing in oligodendrogliomas, paves the way to a more patient‐tailored therapy in the near future. Of note, in contrast to somatic mutations and chromosomal losses encountered as persistent alterations in tumor cells, promoter methylation is reversible and therefore potentially amenable to pharmacological intervention (12). Even though to date the bottleneck in pharmaceutical demethylation therapy is the lack of promoter‐specific demethylating agents, a more gene‐targeted demethylation therapy seems conceivable in future. Thus, today epigenetics already impacts all aspects of glioma patient management, from diagnosis and tumor classification to a molecular pathology‐based tumor therapy. This underscores the need to identify and characterize epigenetically regulated genes in tumors. In this regard the identification of commonly epigenetically deregulated genes is of uttermost interest to tumor classification and drug development. Also, as testing for promoter methylation of individual genes becomes an integrated part of tumor diagnosis and classification, we are in need for a reliable, robust, easy‐to‐use and ubiquitously available technique that allows for a quick promoter methylation analysis in surgical specimens. DNA methyltransferases (DNMTs) tightly control and regulate both cell type‐specific de novo DNA methylation during development and methylation pattern maintenance during DNA replication throughout the lifetime of the organism. Evidence of their deregulation would in part explain genome‐wide hypomethylation associated with tumor‐related promoter hypermethylation and epigenetic silencing of selected genes in cancer.
Here we analyzed a series of low‐ and high‐grade gliomas for promoter methylation implementing a semiquantative melting curve analysis (MCA)‐based methylation assay (MCA‐Meth), methylation‐specific PCR (MSP) and bisulfite sequencing. Of note, we recently introduced different MCA‐based methylation analysis techniques in gliomas and proofed them to be reliable and robust screening tools and in some instances even superior to classical MSP assays (38). We therein also discussed their respective advantages and shortcomings as compared with classical methylation analysis techniques. The investigated genes of the current work were selected based on their potential or established function as TSG in gliomas (PTEN), their chromosomal location in areas frequently lost in gliomagenesis, that is, 3p (RASSF1A, BLU) (31, 48) and 10q (PTEN, MGMT), their concerted function as part of the same pathway (ie, RASSF1A, NORE1A as effectors of RAS in the RAS‐signaling pathway) and data suggesting tumor‐related silencing of these genes by promoter methylation both in gliomas (MGMT (33, 55), RASSF1A and BLU (24)) and tumors outside the brain (RASSF1A (20), BLU (2, 24), NORE1A (23), MGMT (33, 55)). To test the feasibility of promoter methylation status prediction by alternative diagnostic tools (ie, immunohistochemistry or in situ hybridization), promoter methylation analysis was accompanied by comprehensive RNA and protein expression studies at the same set of tumors and glioma cell lines. 5′‐aza‐2′‐deoxycitidine (5′‐aza‐dC)‐induced demethylation was implemented to demonstrate reversible epigenetic gene silencing in vitro. Finally, to identify deregulated DNMT function in low‐ and high‐grade gliomas and to elucidate possible associations between DNMT function and the promoter methylation status, we investigated the expression of three human DNMTs (DNMT1, DNMT3A and DNMT3B) in relation to the promoter methylation status of the genes investigated here.
MATERIAL AND METHODS
Samples and cell lines
Fifty‐three primary astrocytic tumors corresponding to WHO grades I, II, III and IV and 10 high‐grade glioma cell lines were available for analysis. Tumor samples were collected at the Hospital de Cruces, Barakaldo, Spain. The samples were snap frozen at surgery and stored at −80°C. For semiquantitative expression and promoter methylation analyses of BLU, RNA and DNA were available from an additional set of 20 GBM obtained at the Virchow University Hospital, Charité, Berlin, Germany. The American Type Culture Collection, Barcelona, Spain provided the cell lines CCF‐STTG1, U118, SW1088 and SW1783. Cell lines A172, MOG‐G‐CCM, T98G and U87MG were purchased from the European Collection of Cell Culture, ECACC, Salisbury, Wiltshire, United Kingdom. LN‐405 and GOS‐3 were available at the “Deutsche Sammlung von Mikroorganismen und Zellkulturen”, DSMZ, Braunschweig, Germany. The Health Science's Department, Public University of Navarre, Pamplona, Spain, donated the HeLa cervical cancer cell line, used in Western blot analysis as positive control of protein expression for RASSF1A, NORE1A, PTEN and MGMT. All cell lines were maintained in RPMI+L‐Glutamax medium (Invitrogen S.A., Barcelona, Spain). The medium was supplemented with heat‐inactivated 10% fetal bovine serum (Sigma Aldrich Corporation, St Louis, MO, USA), 1% penicillin/streptomycin (Gibco, Invitrogen Corporation, Carlsbad, CA, USA) and 0.1% amphotericin B (Invitrogen S.A., Barcelona, Spain) and grown at 37°C in a humidified atmosphere of 5% CO2/95% air.
Gene expression analyses by semiquantitative and quantitave RT‐PCR
Gene expression of RASSF1A, BLU, NORE1A, MGMT and PTEN was analyzed by semiquantative RT‐PCR. RNA from cell lines and tumor samples was purified using the guanidine isotiocianate reagent from the QuickPrep Total RNA Extraction Kit (Amersham Biosciences Corporation, Piscataway, NJ, USA), following manufacturer's instructions. 1 µg of RNA was used for cDNA synthesis facilitated by SuperScript™ II RNase H Reverse Transcriptase (Invitrogen, Carlsbad, CA, USA). The transferring receptor (TFR) and the ß‐microglobulin‐housekeeping gene were used as an internal controls of expression. Primer pairs for TFR, ß‐microglobulin, RASSF1A and MGMT were designed using the Oligo 4.0 software (National Bioscience Inc, Plymouth, MN, USA). For BLU, NORE1A and PTEN amplification primers had been described previously (24, 49, 54). PCR products were separated in a 2% agarose gel and visualized by ethidium bromide. The intensity of the bands was quantified in a Bio‐Rad GS‐800 Calibrated Densitomenter (Bio‐Rad, Hercules, CA, USA). The data for each sample were normalized to TFR expression and compared with gene expression in normal human brain.
DNMT1, DNMT3A and DNMT3B expression was assessed by a different quantitative real‐time RT‐PCR assay in 19 astrocytomas and 10 high‐grade glioma cell lines. The hypoxanthine phosphoribosyltransferase 1 (HPRT1) housekeeping gene exemplified an internal control of expression. Primers for DNMT1 were designed using the Primer3 software (44). Primer pairs for DNMT3A and DNMT3B genes had been described previously (18). All PCR reactions were carried out in an IQ5 multicolor real‐time PCR detection system (Bio‐Rad), with 12.5 ng of starting cDNA. For quantification, an efficiency‐corrected quantification model was applied (42). Normal human brain RNA was used as reference of normal expression level. The derivated ratio values describe the relative expression change of the target gene relative to the HPRT1 reference gene expression:
 |
5′‐aza‐2′‐deoxycitidine treatment
The glioma cell lines were exposed to 1 µM 5′‐aza‐dC (Sigma Aldrich Corporation) for 72 h, with a change of media every day. RNA was extracted immediately after treatment. RT‐PCRs were performed to check for treatment‐induced reexpression of RASSF1A, NORE1A, BLU, MGMT and PTEN.
DNA extraction and bisulfite modification
DNA from cell lines and tumor samples was purified using the Wizard® Genomic DNA Purification Kit (Promega Corporation, Madison, WI, USA) according to manufacturer's instructions. The CpGenome™ DNA Modification Kit (Chemicon® International Inc, Temecula, CA, USA) facilitated bisulfite modification. Modified DNA was purified, eluted in 1 mM TE pH 8 and used immediately or stored at −80°C for up to 6 months. Genomic leukocyte DNA and in vitro hypermethylated genomic DNA (Genome™ Universal Methylated DNA, Chemicon® International Inc) validated successful bisulfite modification and were used as control for the methylation status of DNA in bisulfite sequencing, MSP and MCA‐Meth. Complete conversion was ensured and visualized by (i) amplification of all samples following conversion using bisulfite‐sequencing primers, (ii) by sequencing the controls for methylated and unmethylated DNA to control for incomplete conversion of non‐CpG associated cytosine residues, and (iii) by performing experiments in duplicate using converted sample DNA derived from different conversion experiments.
Bisulfite sequencing
The promoter regions of RASSF1A, BLU, NORE1A, PTEN and MGMT were analyzed by bisulfite sequencing. The promoter region upstream of the transcription start site was amplified in an initial PCR using 12 ng bisulfite modified DNA. The NORE1A promoter was covered by two amplicons and for the PTEN and MGMT promoter we amplified three fragments in total. The promoter fragments contained 32, 22, 64, 37 and 98 CpG dinucleotides for RASSF1A, BLU, NORE1A, PTEN and MGMT, respectively. The primers were designed by use of the MethPrimer software (36). The PCR products were plasmid incorporated using one shot Escherichia coli cells and the TOPO TA Cloning Kit PCR®2.1‐TOPO Vector (Invitrogen, Carlsbad, CA, USA). Cells were plated and grown overnight on LB plates containing X‐Gal and 50 mg/mL amplicillin and 50 mg/mL kanamycin. Eight white colonies were picked and colony PCR confirmed the insert. The PCR product was digested with EXOSAP‐IT® exonuclease (Usb Corporation, Staufen, Germany) and the sequencing PCR was performed with 1 µL Big Dye® Terminator v1.1 cycle sequencing PR‐100, 1.5 µL Big Dye® Terminator v1.1, v3.1 5× sequencing buffer (Applied Biosystems, Foster City, CA, USA), 5 pmol of M13 reverse primer and 1 µL of digested DNA in a total volume of 10 µL. The product was cleaned in Sephadex® G‐50 columns (Sigma‐Aldrich Corporation) and sequenced using an ABI PRISM 377 DNA Sequencer (Applied Biosystems). The results were analyzed by Sequencher Software version 4.2 (GeneCodes Corp., Ann Arbor, MI, USA).
Methylation‐specific PCR (MSP)
MSPs were carried out in a T3 thermocycler (Biometra®, Goettingen, Germany). Each reaction contained 60 ng of bisulfite modified DNA, 2.5 µL of 10× reaction buffer, 2–2.5 mM MgCl2, 0.2 mM of each dNTP, 10 pmol forward and reverse primers, 5% DMSO and one unit of AmpliTaq Gold™ polymerase (Applied Biosystems). The total volume of each reaction was 25 µL. MSP primers for NORE1A, BLU and PTEN had been described previously (2, 22, 24, 46). Primers for RASSF1A and MGMT were designed using MethPrimer software (36). PCR products were separated in a 2% agarose gel and visualized by ethidium bromide.
Melting curve analysis‐based real‐time methylation assay (MCA‐Meth)
MCA‐Meths were carried out with 3–6 ng of bisulfite modified DNA in a total volume of 25 µL, containing 12.5 µL of 2× IQ™ SYBR Green Supermix (Bio‐Rad) and 2.5 pmol of primers. The primer sequences lacked CpG dinucleotides, thereby facilitating the amplification of target DNA regardless of its promoter methylation status. MethPrimer software facilitated primer design (36). The MCA was carried out after 40–45 cycles of amplification. Starting at 70°C, the temperature was increased by 0.5°C every 30 s until the final temperature of 90°C. Both amplification and the MCA were carried out in an IQ5 Multicolor Real‐Time PCR Detection System (Bio‐Rad).
Of note, sequences of primers designed by the authors for the different applications and their respective conditions are available upon request. All other primer sequences and conditions have been previously published elsewhere (2, 18, 22, 24, 46, 49, 54).
Protein expression by Western blot
Western blot analysis assessed protein expression of RASSF1A, NORE1A, MGMT and PTEN in 22 astrocytomas and 10 high‐grade glioma cell lines. Proteins from cell lines and tumor samples were extracted using the RIPA buffer. Protein concentration was determined using the BCA Protein Assay Kit (Pierce, Rockford, IL, USA). Lysates from cell lines and gliomas were resolved by SDS‐PAGE (Sodium Dodecyl Sulfate PolyAcrilamide Gel Electrophoresis) under reducing conditions. The resolved proteins were electroblotted onto a nitrocellulose membrane (Bio‐Rad). Five percent non‐fat milk in TBST buffer prior to antibody incubation blocked unspecific binding followed by primary antibody incubation over night. The secondary antibody was incubated for 1–2 h at room temperature. Finally, enhanced chemiluminescence (ECL™ Western Blotting Analysis System, Amersham Biosiences, Piscataway, NJ, USA) and autoradiography detected secondary antibody binding. The secondary antibody was goat anti‐mouse IgG‐HRP, Santa Cruz Biotechnology (sc‐2005) for all reactions. Dilutions were 1:2000 for NORE1A, MGMT and PTEN and 1:5000 for RASSF1A and GAPDH, respectively.
The intensity of bands was quantified in a Bio‐Rad GS‐800 Calibrated Densitomenter (Bio‐Rad). The data obtained for each sample were normalized to the corresponding value for GAPDH protein expression.
Statistical analysis
All statistical analyses were done using the SPSS v13.0 software (SPSS Inc, Chicago, IL, USA). The continuous variables were assessed for normality via the Kolmogorof–Smirnov and Shapiro–Wilk tests. The level of expression of the three DNMTs was analyzed by the t‐test or the Wilcoxon rank sum test. Associations between genes methylation status and DNMT expression level were analyzed by contingency table analysis and Fisher's exact test. All reported P‐values were two‐sided, and P ≤ 0.05 was considered statistically significant.
RESULTS
Differential RNA expression of RASSF1A, NORE1A, BLU, MGMT and PTEN
Twenty‐five astrocytomas and 10 high‐grade glioma cell lines were analyzed. The astrocytomas correspond to 25 of the 53 primary gliomas available for the promoter methylation analyses. Commercially available total RNA isolated from normal whole human brain under extensive quality control procedures was used for basal gene expression analysis of the individual genes (US Biological, Swampscott, MA, United States, cat# T5595‐7549). Representative results are shown in Figure 1.
Figure 1.
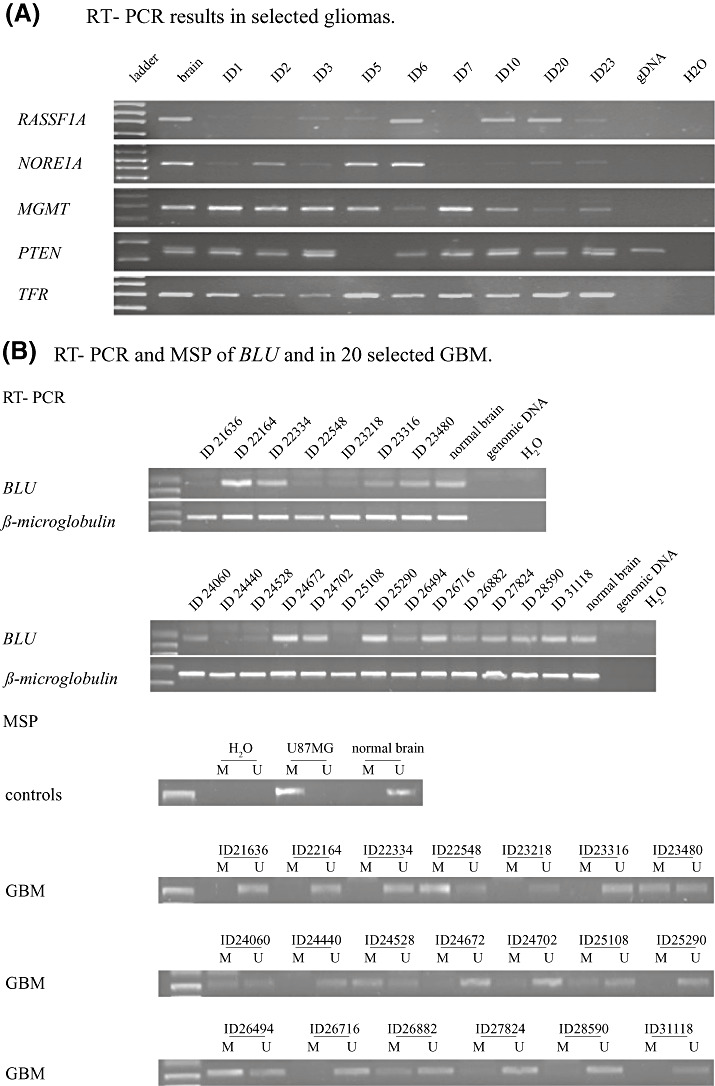
A. RT‐PCR of RASSF1A, NORE1A, MGMT and PTEN in selected GBM. Gene expression was calculated in relation to Transferring Receptor (TFR) housekeeping gene expression of the same sample. There is evidence of differential gene expression in all genes. Downregulation in a significant number of samples was detected for RASSF1A, NORE1A and MGMT. PTEN expression was also lost or reduced in 20% of the samples and 30% of the cell lines. B. Upper panel: RT‐PCR of BLU in 20 GBM reveals downregulation or loss of BLU gene expression in 45% (9/20) of tumor samples. Lower panel: MSP of BLU promoter in the same set of 20 GBM. Evidence of tumor‐related epigenetic BLU regulation could be established for the majority of the samples. Loss or downregulation of BLU was associated with a methylated BLU promoter (ie, ID22548, ID24060, ID24528, ID25108, ID26494) and robust BLU expression reflected an unmethylated promoter (ie, ID22164, ID22334, ID24672, ID24702, ID25290, ID26716). Mono‐allelic promoter hypermethylation could explain BLU expression in tumors despite evidence of promoter methylation (ie, ID23480). Also, as tumors were not microdissected, a “contamination” by normal cells may mock BLU expression in these samples. Alternative mechanisms of gene inactivation have to be postulated for samples significant for BLU downregulation or loss and an unmethylated BLU promoter (ie, ID 24440).
Complete lack of RASSF1A expression was detected in four gliomas (16%) and in eight glioma cell lines (80%). Nine additional gliomas (36%) revealed a reduced gene expression for RASSF1A. RASSF1A expression was similar to normal brain in all other gliomas and the remaining two cell lines. We analyzed 20 GBM for BLU expression. Nine (45%) revealed a reduced gene expression as compared with normal brain cDNA. Robust BLU expression was detected in the remaining 11 GBM samples (Figure 1A). All glioma cell lines expressed the BLU gene. A reduced expression of NORE1A was seen in 16 (64%) of the gliomas and two (20%) of the glioma cell lines. Four (16%) gliomas lacked a transcript for NORE1A. PTEN was not expressed in four (16%) gliomas and three (30%) glioma cell lines. One additional glioma (4%) revealed a reduced PTEN expression. A reduced expression of MGMT was detected in 13 (52%) gliomas and in three (30%) glioma cell lines. The MGMT transcript could not be detected in three additional (12%) gliomas and three (30%) glioma cell lines.
Demethylation treatment of glioma cell lines with 5′‐aza‐2′‐deoxycitidine (5′‐aza‐dC)
To elucidate epigenetic gene regulation, expression of RASSF1A, BLU, NORE1A, MGMT and PTEN was analyzed in 10 high‐grade glioma cell lines before and after global demethylation induced by 5′‐aza‐dC. Clear evidence of epigenetic gene silencing indicated by restored gene expression following global demethylation was detected for RASSF1A and MGMT. Eight glioma cell lines lacked RASSF1A expression. MGMT expression was lost in three glioma cell lines. Demethylation restored RASSF1A and MGMT expression in all these cell lines. SW1088 revealed a low basal MGMT expression, which was further increased by demethylation. Gene expression unaffected by demethylation was detected in LN405 and SW1088 for RASSF1A and in the remaining six glioma cell lines for MGMT. BLU and NORE1A were expressed in all glioma cell lines independent of 5′‐aza‐dC demethylation. However, similar to MGMT expression in glioma cell line SW1088, basal NORE1A expression was found further increased following demethylation in glioma cell line GOS3, suggesting partial epigenetic gene regulation in these cell lines. No clear evidence of epigenetic gene regulation was seen for PTEN. In case of gene expression, it was found unaffected by demethylation. If lost in a cell line, demethylation failed to restore the expression of PTEN. In detail, seven of the 10 cell lines expressed PTEN, independent of demethylation treatment, while three cell lines revealed no expression for PTEN. In these, demethylation failed to restore gene expression. In summary, 5′‐aza‐dC demethylation strongly suggested frequent epigenetic silencing of RASSF1A and MGMT in glioma cell lines. For BLU the demethylation treatment to elucidate epigenetic silencing was not informative as all cell lines already expressed these genes before 5′‐aza‐dC exposure. Experimental data on PTEN suggested other mechanisms of gene inactivation than promoter methylation. Figure 2 summarizes representative results.
Figure 2.
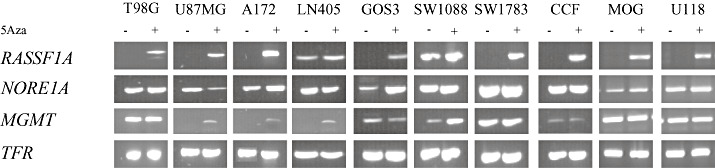
Effect of 5′‐aza‐dC‐induced demethylation on gene expression of RASSF1A, NORE1A, MGMT, PTEN and BLU in selected glioma cell lines. RASSF1A: Evidence of 5′‐aza‐dC‐induced reexpression in all but two cell lines. LN405 and SW1088 reveal RASSF1A expression before and after demethylation. In LN405 expression intensifies after demethylation treatment, while no effect is seen in SW1088. These results reflect promoter methylation data. MCA‐Meth suggested little or insignificant promoter methylation for LN405 and SW1088. All other cell lines harbored heavily methylated RASSF1A promoter in both MSP and MCA‐Meth analyses. NORE1A: Upregulation of NORE1A expression was seen in cell lines MOG and GOS3. This was in keeping with the MCA‐Meth data, which suggested a hypermethylated NORE1A promoter in these cell lines. No effect of demethylation treatment was seen in the remaining glioma cell lines, which also was reflecting MCA‐Meth data of an unmethylated promoter. Of note, glioblastoma cell line CCF‐STTG1 revealed a heavily methylated promoter, 5′‐aza‐dC failed to alter gene expression levels. Mono‐allelic promoter methylation may account for this observation. MGMT: Clear evidence of MGMT upregulation after demethylation treatment in glioma cell lines U87MG, A172, LN405 and SW1088. These revealed heavily methylated promoters in both MSP and MCA‐Meth analyses. Robust MGMT expression in SW1783 before and after demethylation suggested an unmethylated promoter, which was confirmed by MSP and MCA‐Meth. The remaining glioma cell lines T98G, GOS3, CCF, MOG and U118 were not clearly affected by 5′‐aza‐dC, even though methylation analysis was significant for promoter hypermethylation. Pharmacological demethylation had no clear effect on PTEN and BLU expression in selected glioma cell lines (data not shown).
Bisulfite sequencing
Normal brain samples revealed unmethylated promoters for RASSF1A, NORE1A, BLU, MGMT and PTEN. While the MGMT promoter contained scarcely scattered methylated CpGs (5–6 methylated CpG at the beginning of the analyzed fragment), the promoters of the remaining genes were completely unmethylated.
In principle, our selection of samples for bisulfite sequencing aimed at confirming and reinforcing matching MCA‐Meth and MSP results. This was to document their feasibility in methylation detection and to visualize the samples' inter‐priming site methylation status. In ambiguous cases sequencing was to decide which of the techniques was giving more reliable results.
Three gliomas (ID7, AIII; ID14, AIII; ID30, GBM) and glioma cell line T98G were selected for bisulfite sequencing of the RASSF1A promoter. The promoter was heavily methylated in the glioma cell line T98G and the glioma samples ID14 and ID30 (91%, 90%, 100% of methylated CpGs, respectively). Bisulfite sequencing results reflected gene expression data of RASSF1A in these samples, supporting tumor‐related epigenetic silencing of RASSF1A. Results were ambiguous for glioma sample ID7. While no RASSF1A expression could be detected by RT‐PCR, the promoter was almost unmethylated (25% of methylated CpGs), suggesting alternative mechanisms of RASSF1A inactivation in a subset of gliomas. Two glioma cell lines (A172, U118) were selected for bisulfite sequencing of the BLU promoter. The promoter was heavily methylated in A172 (94% of methylated CpGs) and completely unmethylated in U118. On RT‐PCR, glioma cell line A172 revealed a slightly reduced BLU expression compared with U118. Based on evidence of NORE1A downregulation, glioma cell line GOS3 was selected for bisulfite sequencing of the NORE1A promoter. In keeping with RT‐PCR results, the NORE1A promoter was heavily methylated (94% of methylated CpGs). The PTEN promoter was investigated in glioma cell lines LN‐405 and GOS3. Both cell lines expressed PTEN. While LN405 revealed scattered methylated CpGs, only (6%), the PTEN promoter GOS3 showed intermediate methylation (41% of methylated CpGs). In these two glioma cell lines, promoter methylation status did not clearly reflect the individual gene expression levels. Three astrocytoma samples (ID26, GBM; ID28, GBM; ID33, AIII) and glioma cell line U87MG were bisulfite sequenced in a region of the MGMT promoter. The promoter was heavily methylated in glioma sample ID28 (70% of methylated CpGs). An intermediate state of promoter methylation was seen for glioma sample ID33 and the glioma cell line U87 (20% and 47% of methylated CpGs, respectively) U87MG. Glioma sample ID26 had an unmethylated MGMT promoter with single scattered methylated CpGs similar to the normal brain analysis. While RT‐PCR predicted promoter methylation status for U87MG, glioma sample ID28 revealed dense promoter methylation without signs of downregulation of RNA levels and ID26 harbored only scattered methylated CpGs even though RNA levels were low. These results point to mechanisms of phenotype rescue despite promoter methylation and alternative mechanisms of inactivation besides promoter methylation, respectively. In case of glioma sample ID33, no RNA was available for gene expression experiments.
Promoter methylation analysis by MSP analysis and melting curve analysis‐based real‐time PCR (MCA‐Meth)
The promoter methylation status of RASSF1A, NORE1A, BLU, MGMT and PTEN was analyzed by MSP and by melting curve analysis‐based real‐time PCR (MCA‐Meth). We investigated 53 frozen astrocytoma samples and 10 high‐grade glioma cell lines. Twenty additional GBM were analyzed by MSP for BLU promoter methylation. Results are summarized in Table 1. Figure 3 illustrates MCA‐Meth results in relation to bisulfite sequencing.
Table 1.
Promoter methylation of RASSF1A, BLU, NORE1A, PTEN and MGMT by MSP and MCA‐Meth in glioma samples and glioma cell lines. Abbreviations: PAI = pilocytic astrocytoma WHO grade I; AII = astrocytoma grade WHO grade II; AIII = anaplastic astrocytoma grade WHO grade III; GBM = glioblastoma WHO grade IV; OAIII = anaplastic oligoastrocytomas WHO grade III.
| RASSF1A | BLU | NORE1A | PTEN | MGMT | ||||||
|---|---|---|---|---|---|---|---|---|---|---|
| MSP | MCA‐Meth | MSP | MCA‐Meth | MSP | MCA‐Meth | MSP | MCA‐Meth | MSP | MCA‐Meth | |
| Gliomas | ||||||||||
| PAI | 100% | 100% | 100% | 100% | 0% | 0% | 0% | 0% | 67% | 67% |
| (3/3) | (3/3) | (3/3) | (3/3) | (0/3) | (0/3) | (0/3) | (0/3) | (2/3) | (2/3) | |
| AII | 100% | 50% | 100% | 100% | 0% | 0% | 0% | 0% | 0% | 0% |
| (2/2) | (1/2) | (2/2) | (2/2) | (0/2) | (0/2) | (0/2) | (0/2) | (0/2) | (0/2) | |
| AIII | 80% | 80% | 60% | 50% | 20% | 10% | 0% | 0% | 60% | 60% |
| (8/10) | (8/10) | (6/10) | (5/10) | (2/10) | (1/10) | (0/10) | (0/10) | (6/10) | (6/10) | |
| GBM† | 100% | 84% | 46% | 37% | 8% | 3% | 0% | 0% | 61% | 58% |
| (38/38) | (32/38) | (26/58) | (14/38) | (3/38) | (1/38) | (0/38) | (0/38) | (23/38) | (22/38) | |
| Total | 96% | 83% | 48% | 45% | 9% | 4% | 0% | 0% | 58% | 57% |
| (51/53) | (44/53) | (37/73) | (24/53) | (5/53) | (2/53) | (0/53) | (0/53) | (31/53) | (30/53) | |
| Cell lines | ||||||||||
| AIII | 00% | 100% | 33% | 33% | 33% | 33% | 0% | 0% | 67% | 67% |
| (3/3) | (3/3) | (1/3) | (1/3) | (1/3) | (1/3) | (0/3) | (0/3) | (2/3) | (2/3) | |
| GBM | 100% | 100% | 17% | 17% | 67% | 33% | 0% | 0% | 100% | 100% |
| (6/6) | (6/6) | (1/6) | (1/6) | (4/6) | (2/6) | (0/6) | (0/6) | (6/6) | (6/6) | |
| OAIII | 100% | 100% | 100% | 100% | 100% | 100% | 100% | 0% | 100% | 100% |
| (1/1) | (1/1) | (1/1) | (1/1) | (1/1) | (1/1) | (1/1) | (0/1) | (1/1) | (1/1) | |
| Total | 100% | 100% | 30% | 30% | 60% | 40% | 10% | 0% | 90% | 90% |
| (10/10) | (10/10) | (3/10) | (3/10) | (6/10) | (4/10) | (1/10) | (0/10) | (9/10) | (9/10) | |
20 additional GBM were available for MSP of the BLU promoter.
Results are shown in percentage of methylated samples.
The following glioma cell lines were used in detail:
AIII: MOG‐G‐CCM, SW1088, SW1783
GBM: LN405, CCF‐STTG1, U87MG, U118, T98G, A172
OAIII: GOS3
Figure 3.
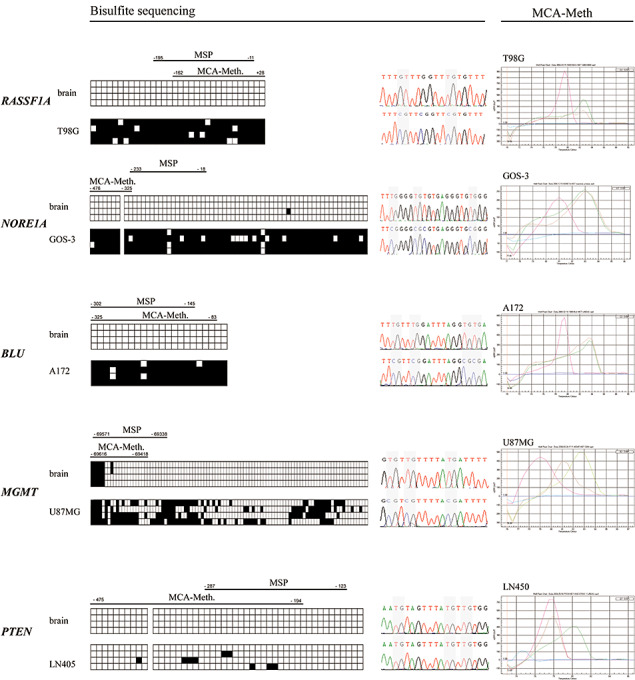
Bisulfite sequencing and MCA‐Meth analysis in normal human brain and selected glioma cell lines. Left and middle panel: Bisulfite sequencing of human brain and selected glioma cell lines of promoter sequences of RASSF1A, NORE1A, BLU, MGMT and PTEN. Each line corresponds to the sequencing result of an individually picked clone. MCA‐Meth and MSP primer positions are illustrated above the sequencing data. Each square equals one CpG dinucleotide within the promoter sequence. A black square indicates a methylated, a blank square an unmethylated CpG (left panel). Representative sequencing results are depicted in the middle panel. Promoter sequences were unmethylated in human brain for all five genes. RASSF1A, NORE1A and BLU revealed heavy promoter methylation on bisulfite sequencing. Intermediate promoter methylation could be demonstrated for MGMT in U87MG cell line. The PTEN promoter was unmethylated. Of note, promoter methylation status was found as predicted by cDNA expression analyses for these cell lines and genes. A graphical representation of the CpG islands analyzed by MSP and MCA‐Meth accompanies the respective genes above the bisulfite sequencing data. Size and location are indicated in relation to the individual transcription start sites. Right panel: Corresponding MCA‐Meth analyses data on respective glioma cell lines and genes. Please note the red graph represents unmethylated DNA and the green graph methylated DNA as positive controls. The brown graph corresponds to the samples DNA. Perfect correlation between bisulfite‐sequencing data and MCA‐Meth results. Of note, intermediate promoter hypermethylation of MGMT promoter in U87MG is reflected by a sample graph of intermediate position between methylated and unmethylated controls, underscoring the feasibility of MCA‐Meth analysis.
MSP
Evidence of RASSF1A promoter methylation was found in 96% (51/53) of the astrocytoma samples and in 100% (10/10) of the glioma cell lines.
BLU promoter methylation was detected in 57% (30/53) of astrocytoma samples and in 30% (3/10) of the glioma cell lines. Promoter methylation was detected by MSP in 35% (n = 7) of the 20 GBM. Methylation of the NORE1A gene promoter was found in 9% (5/53) of astrocytoma samples and in 60% of the cell lines (6/10).
MSP analysis revealed an unmethylated PTEN promoter in all glioma samples (53/53) and in all but glioma cell line GOS3. The latter result was in keeping with our bisulfite sequencing data of intermediate promoter methylation of GOS3. The MGMT promoter was methylated in 57% (30 of 53) of the astrocytomas and 90% of the cell lines (9 of 10).
Of note, RASSF1A and MGMT methylation correlated well with loss of cDNA expression. BLU gene expression in the 20 GBM samples for which cDNA expression data were available reflected the BLU promoter methylation status for the majority of the cases (Figure 1B). Methylation‐associated downregulation of NORE1A could be observed in few cases. However, loss of PTEN expression in both glioma cell lines and tumor samples was not associated to a methylated promoter.
Melting curve analysis‐based real‐time PCR
Methylation of the RASSF1A gene promoter was found in 83% (44/53) of astrocytoma samples and in 100% (10/10) of the glioma cell lines. Methylation of the BLU gene promoter was found in 45% (24/53) of astrocytoma samples and 30% (3/10) of the cell lines. The NORE1A promoter was methylated in 4% (2/53) of the astrocytoma samples and in 40% of the glioma cell lines (4/10). The promoter of the PTEN gene appeared to be unmethylated in all tumor samples (53/53) and in all glioma cell lines (10/10). The MGMT promoter methylation was seen in 58% (30 of 52) of the astrocytoma samples and in all but one glioma cell line (90%, 9/10).
Comparison of bisulfite sequencing, MSP and MCA‐Meth results
Overall MS‐PCR confirmed the MCA‐Meth results and both MSP and MCA‐Meth matched bisulfite‐sequencing results in selected samples and controls.
Quantitative analysis of DNMT1, DNMT3A and DNMT3B RNA expression
Nineteen astrocytomas and 10 glioma cell lines were analyzed. The gliomas were derived from the 53 gliomas available for promoter methylation analysis. HPRT1 was amplified as internal control for cDNA quality and quantity. HPRT1 was used here as it has been reported to be the best single gene to be used as an internal control in quantitative RT‐PCR (8). As compared with normal brain RNA, DNMT1 expression was found significantly increased (P = 0.001) in the glioma cell lines. However, differences in expression did not reach statistical significance (P = 0.359) in the tumor samples. The results obtained for DNMT3A and DNMT3B RNA strongly suggest that these DNA methyltransferases are overexpressed in both glioma cell lines (P = 0.002 for DNMT3A; P = 0.000 for DNMT3B) and glioma samples (P = 0.000 for both DNMT3A and DNMT3B).
Association between genes methylation status and overexpression of DNMTs
No statistically relevant correlation could be established for DNMT overexpression and promoter methylation phenotype in gliomas and glioma cell lines.
Protein expression of RASSF1A, NORE1A, MGMT and PTEN
Twenty‐two astrocytomas and 10 high‐grade glioma cell lines were available for analysis. Again, the astrocytomas were derived from the 53 gliomas analyzed for promoter methylation to allow for easy comparison between protein expression and promoter methylation status. Results are summarized in Table 2 and Figure 4. The RASSF1A protein was detected in five (50%) glioma cell lines and in six (27%) astrocytoma samples. NORE1A was detected in 10 (45%) astrocytoma samples and in eight (80%) of the glioma cell lines. The PTEN protein was detected in four (40%) glioma cell lines and in 16 (72%) astrocytoma samples. The MGMT protein was detected in three (30%) glioma cell lines and in 10 (45%) astrocytoma samples. Despite evidence of differential protein expression of all genes in gliomas and glioma cell lines, protein expression data failed to predict the respective promoter methylation status.
Table 2.
Protein expression and promoter methylation status of RASSF1A, NORE1A, PTEN and MGMT in 10 high‐grade glioma cell lines and in selected glioma samples. Scores of protein expression (Prot) in WB in relation to GAPDH expression: − = no expression; + = low expression; ++ = high expression. Promoter methylation status (Meth) in MCA‐Meth analysis: M = methylated promoter; U = unmethylated promoter; U + M = hemi‐methylated promoter; UM = methylated promoter with intermediate proportion of methylated CpGs within the promoter sequence. Tissues: AII = astrocytoma WHO grade II; AIII = anaplastic astrocytoma WHO grade III; GBM = glioblastoma WHO grade IV; OAIII = anaplastic oligoastrocytoma WHO grade III.
| Celllines | Tissue | RASSF1A | NORE1A | PTEN | MGMT |
|---|---|---|---|---|---|
| Prot/Meth | Prot/Meth | Prot/Meth | Prot/Meth | ||
| MOG‐G‐CCM | AIII | +/UM | +/M | +/U | ++/UM |
| SW1088 | AIII | −/U+M | +/U | −/U | −/M |
| SW1783 | AIII | ++/M | +/U | −/U | −/U |
| LN405 | GBM | ++/U+M | −/U | −/U | −/UM |
| CCF‐STTG1 | GBM | ++/U+M | −/M | −/U | −/U+M |
| U87 | GBM | −/U+M | +/U | −/U | −/UM |
| A172 | GBM | +/M | +/U | −/U | −/UM |
| T98G | GBM | −/M | +/U+M | ++/U | ++/M |
| U118 | GBM | −/M | +/U | ++/U | ++/UM |
| GOS3 | A/O | −/M | +/M | +/U | −/U+M |
| Glioma samples | Tissue | Prot/Meth | Prot/Meth | Prot/Meth | Prot/Meth |
|---|---|---|---|---|---|
| ID20 | AII | +/U+M | +/U | ++/U | +/U |
| ID4 | AIII | −/U+M | +/U | −/U | ++/U |
| ID7 | AIII | +/U+M | +/U | ++/U | +/U+M |
| ID21 | AIII | ++/M | +/U | +/U | +/U+M |
| ID35 | AIII | ++/U | −/U+M | ++/U | −/U |
| ID1 | GBM | −/U+M | +/U | −/U | +/U |
| ID2 | GBM | −/U | −/U | −/U | +/U+M |
| ID3 | GBM | −/U+M | +/U | −/U | ++/U+M |
| ID6 | GBM | −/U+M | −/U | ++/U | +/U+M |
| ID9 | GBM | −/U+M | +/U | −/U | +/U |
| ID11 | GBM | −/U | −/U | −/U | −/U+M |
| ID22 | GBM | −/U+M | −/U | ++/U | +/U |
| ID23 | GBM | −/U+M | −/U | ++/U | −/U+M |
| ID26 | GBM | −/U+M | −/U | ++/U | −/U |
| ID27 | GBM | −/U+M | −/U | ++/U | −/U |
| ID28 | GBM | −/U+M | −/U | ++/U | −/M |
| ID29 | GBM | −/U+M | −/U | ++/U | −/U+M |
| ID30 | GBM | +/U+M | −/U | ++/U | −/UM |
| ID31 | GBM | −/U+M | +/U | ++/U | −/U+M |
| ID32 | GBM | +/U | +/U | ++/U | −/U+M |
| ID39 | GBM | −/U+M | +/U | +/U | −/U+M |
| ID53 | GBM | −/U+M | −/U | +/U | −/U+M |
Of note, protein expression failed to clearly predict promoter methylation status in any of these genes.
Figure 4.
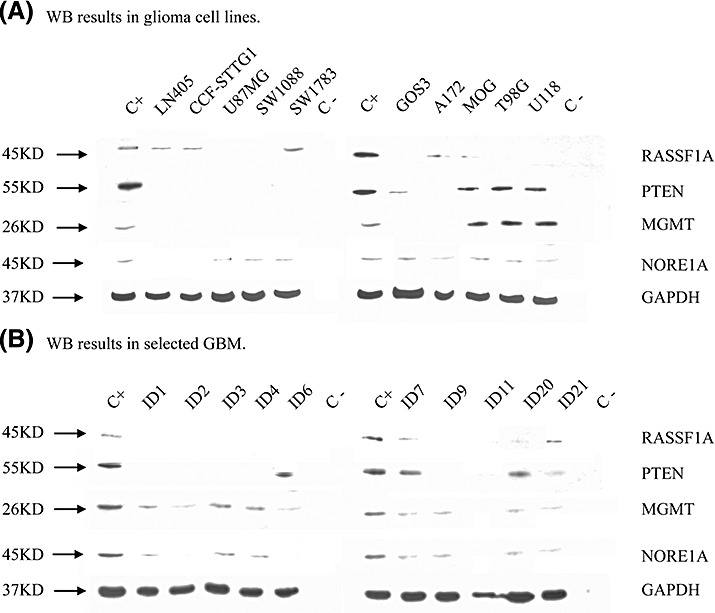
Western blot (WB) of RASSF1A, NORE1A, MGMT and PTEN in glioma cell lines (A) and selected GBM (B). Antibodies used in the analysis and their respective dilutions: Human RASSF1A antibody, eBioscience (14‐6888); 1:500; Anti‐NORE1A, clone 10F10, Upstate (05‐890), 1:1000; MGMT (Mt5.1, Santa Cruz Biotechnology (sc‐33674), 1:500; PTEN (A2B1) Santa Cruz Biotechnology (sc‐7974), 1:500; GAPDH, Santa Cruz Biotechnology (sc‐32233), 1:2000. Protein expression was calculated in relation to glyceraldehyde‐3‐phosphatase dehydrogenase protein (GAPDH) expression of the same samples. There is evidence of downregulation in a significant number of samples in all genes analyzed. However, protein expression failed to predict promoter methylation status in these samples. C+: positive control, protein lysate from HeLa cell line, C−: negative control.
DISCUSSION
With the completion of the human genome project genome‐wide mutational analyses became possible and have already been done for different tumor entities including gliomas (19). Interestingly, except for already established and commonly known somatic alterations, they failed to identify a significant number of novel candidate genes in gliomas. Therefore, it is not surprising that research started to shift focus also onto the genome‐wide, gene‐specific or pathway‐related analysis of epigenetic events in these tumors. The current analysis combines a gene‐specific and pathway‐related approach. The simultaneous investigation of single genes helps unveil the complexity of promoter methylation patterns in the tumors studied. The detection and description of functional disruption of methylation maintenance or de novo methylation could contribute to gaining a more fundamental understanding of epigenetic regulation in tumor cells. Molecular alterations of the short arm of chromosome 3 (3p) occur frequently in various different cancers (32). Allelic loss and homozygous deletions belong to the earliest molecular changes in tumors of the lung, kidney, head and neck, breast, cervix and gastrointestinal tract (26, 32, 53). In keeping with the notion of an early event in glioma development LOH at 3p is observed in up to 40% of gliomas, preferably in low‐grade astrocytomas (31, 48). RASSF1A, a TSG on 3p21.3 is frequently inactivated during tumorigenesis in a variety of cancers, most commonly by promoter methylation. Several studies correlate the loss of RASSF1A gene expression to promoter methylation in 32% to 70% in astrocytomas (17, 24, 25). Of note, RASSF1A promoter methylation seems to increase with tumor grade (24). In our study, RASSF1A promoter methylation was the most frequent epigenetic event in astrocytomas of all malignancy grades. It correlated with loss of RASSF1A gene expression and 5′‐aza‐dC treatment successfully reconstituted RASSF1A gene expression in glioma cell lines. Taken together, these results suggest that the inactivation of this TSG by promoter methylation is a crucial and frequent event in astrocytoma initiation and progression. What is more, the fact that RASSF1A promoter methylation occurs rarely in normal tissues including the brain, has been reported in various tumor types (1) including gliomas (17, 24, 25), preferably in early tumor stages and, if present is often moderate to very high, therefore easily detectable, and may render RASSF1A promoter methylation analysis a useful diagnostic tool in early tumor detection and disease monitoring.
The BLU gene also maps to 3p21.3. Recently, BLU inactivation by promoter methylation has been reported in up to 80% of gliomas and 7/7 glioma cell lines (24). More recently, Martínez et al (40) analyzed the epigenetic profile including the BLU gene of 32 paired tumor samples of relapsed GBM and their corresponding primary neoplasms. In their series a methylated BLU promoter and an unmethylated CASP8 CpG island in the primary GBM was closely related to a prolonged time to progression (40). We observed BLU promoter methylation in 35% (7/20) of our series of 20 GBM, in 57% (30/53) of the astrocytoma samples and in 30% (3/10) of the glioma cell lines. Of note, MSP of the 38 GBM, as part of the group of 53 glioma samples, was significant for BLU promoter methylation in 50% (19/38) of the GBM. These results are in keeping with our observation in the independent group of 20 GBM. Also, we observed a close correlation between promoter methylation and reduction or loss of BLU gene expression, confirming frequent tumor‐related epigenetic gene silencing of BLU in gliomas. Also, as reported previously (24), bisulfite sequencing revealed a heavily methylated BLU promoter in glioma cell line A172. However, in vitro demethylation failed to visibly increase BLU gene expression levels in that particular cell line (Figure 1A). This observation may be explained either by a failure to fully reverse promoter methylation of the BLU gene promoter during 5′‐aza‐dC demethylation treatment, or by an additional obscure alternative BLU gene inactivation mechanism in our A172 cell line. Taken together, these data suggest BLU promoter methylation to be a frequent and early observation in the development of gliomas and further support the notion of a TSG cluster on 3p21.3.
Similar to RASSF1A, NORE1A is a RAS effector protein. It maps to 1q32.1 a region not regularly affected by chromosomal loss in gliomas. NORE1A inactivation by promoter methylation has been described in up to 32% of sporadic clear cell renal cell carcinoma and in 24% of NSCLC (27). These data and its protein function prompted our analysis in gliomas. We observed a very low frequency of NORE1A promoter methylation. However, reduced or silenced NORE1A expression exceeded the frequency of promoter methylation, suggesting alternative mechanisms of NORE1A inactivation in gliomas. The glioma cell lines revealed a higher frequency of promoter methylation, possibly reflecting the observation that extensive serial passages can alter the cancer epigenome (41). In vitro demethylation restored NORE1A expression in some glioma cell lines, supporting promoter methylation as the mechanism of gene silencing in those. Of note, promoter methylation was restricted to anaplastic gliomas and GBMs. We therefore conclude that NORE1A promoter methylation occurs infrequently and late during glioma formation confirming previous observations (24).
Mutations in the PTEN gene accompany progression of brain tumors and together with loss of heterozygosity have been identified as the major mechanism of PTEN (10q23.31) inactivation in high‐grade gliomas and other tumor entities, that is, breast cancer, melanoma, prostate and endometrial carcinoma (52). Here, we did not find evidence of epigenetic PTEN inactivation. Our results are in keeping with previous studies (15, 56). However, there have been single reports on PTEN promoter methylation in gliomas (3, 52). Of note, Baeza et al reported on a frequency of 35% of promoter methylation in glioblastomas in a series of 77 tumor samples, and in 36% of 11 glioma cell lines. More interestingly, the PTEN promoter was reported methylated in glioma cell lines U87 and T98G, in both of which we did not detect promoter methylation (3). In order to clarify these conflicting data, we first genotyped and phenotyped our glioma cell lines (U87 and T98G) to ensure their glioma provenance. In glioma cell line T98G we confirmed the missence mutation in codon 237 (transition G > A; ATG > ATA; Met > Ile) of the TP53 gene as reported in the literature (50). We then detected GFAP expression in both cell lines by fluorescence immunohistochemistry. To further exclude epigenome alterations during passaging, we analyzed U87 at two different passages (Passage 6 and after extensive passaging). Also, to exclude false negative results caused by incomplete bisulfite conversion, experiments were done on samples converted at two different occasions. Conversions were done immediately before the analysis. To enable side‐by‐side comparison of our results with the previously published data we implemented the same two sets of PTEN‐specific primers (57). We confirmed our results of an unmethylated PTEN promoter in both cell lines. Data of all these additional experiments are not shown here but available as supplementary data upon request. One possible explanation for Baeza's results may root in an incomplete bisulfite conversion. The retention of unmethylated yet unconverted CpG dinucleotides within the priming site of the MSP primers could produce false positive results in MSP reactions. Also, even though we did not see any difference in methylation status between early and late passages of U87, it has been shown that extensive passaging can alter the epigenome (41). Less likely yet not completely to exclude is the possibility of cross‐contamination with co‐cultured cell lines, as Baeza et al did not genotype or phenotype their glioma cell lines prior to analysis. More recently, PTEN promoter methylation has been seen in both low‐ and high‐grade gliomas (52). In high‐grade gliomas promoter methylation was more frequent in anaplastic astrocytomas and in secondary GBMs. PTEN methylation was rare in de novo GBMs and mutually exclusive to PTEN mutations. In light of these data, missing PTEN promoter methylation in our AIII could root in the low numbers analyzed (n = 10). As for the GBMs, for our analysis we did not distinguish secondary from de novo GBMs. But taking into account that secondary GBMs are much less frequent, most of the GBMs we analyzed possibly developed de novo. What is more, de novo GBMs more frequently harbor PTEN mutations and PTEN mutations are mutually exclusive to PTEN promoter methylation. Thus the downregulation of PTEN found in some of our glioma samples and cell lines was not related to promoter methylation but may reflect deletions or mutations of the gene.
Epigenetic silencing of the MGMT gene by promoter methylation has been recognized as an important factor to predict outcome in glioblastoma patients with alkylating agents such as temozolomide (13, 21). Several studies have been performed in the last decade to analyze the methylation status and expression of MGMT in astrocytomas, observing MGMT methylation frequencies between 40 to 70% (6, 7, 11, 13, 33, 39, 51). Our data support these observations. We observed MGMT promoter methylation in approximately half of our astrocytoma samples and in most of the cell lines. Treatment of the cell lines with 5′‐aza‐dC restored the expression of the gene, confirming the involvement of promoter methylation in MGMT silencing. However, there might be another mechanism of inactivation of this gene in astrocytomas, as downregulation of the gene was not always associated with a methylated promoter. The epigenetic profile characteristic for each individual cell has to be reestablished and maintained during both embryonic development and following each cell cycle. The same is true for cancer cells.
DNMTs regulate de novo methylation and methylation maintenance. Disruption of this tightly regulated process may lead to epigenetic silencing of single‐tumor suppressor genes and may partly explain the epigenetic profile in gliomas with multiple simultaneously methylated gene promoters in a single tumor. Methylation is mostly maintained by DNMT1, while DNMT3a and DNMT3b regulate de novo methylation. Interestingly enough, it has been reported that DNMT1 is highly expressed in various cancer cells (5, 10, 28) and notable increases in expression of de novo DNMTs have been reported in diverse cancers and cancer cell lines (18, 30, 43, 45), indicating deregulation of both methylation maintenance and de novo methylation in these tumors. We observed higher expression levels of DNMT1, DNMT3a and DNMT3b in tumor samples and glioma cell lines as compared with normal brain. Interestingly, the most overexpressed DNMTs were the de novo DNMTs: DNMT3a and DNMT3b. In our view this would explain the new methylation phenotype of the cancerous cells, simultaneously targeting the promoter of many TSGs. Supporting evidence comes from lung and esophageal squamous cell carcinomas in which a statistically significant correlation of DNMT overexpression and promoter methylation of selected TSG could be observed (37, 47). To date, there is only a single report on DNMT expression in a very limited number of samples (two established glioblastoma cell lines and two primary glioblastomas). Compared with normal controls it described upregulation of DNMT1, downregulation of DNMT3b and no significant changes of DNMT3a (16). It is difficult to interpret the significance of these data because of the low case numbers investigated. Our analysis did not yield a statistically significant correlation between the methylation status of any TSG that we investigated and expression changes of the DNMTs. However, we still think that the observation of an association between DNMT deregulation and the epigenetic phenotype in other tumors, together with our results of overexpression of mainly the de novo DNMTs3a and 3b encourage further studies assessing the expression pattern of the DNMTs and its association with promoter methylation in gliomas.
Three independent techniques for the detection of promoter methylation were implemented here. While all three proofed reliable tools in methylation analysis, they come with respective advantages and shortcomings. These touch upon multiple issues such as the easiness of the technique, its availability at institutions, its feasibility as a diagnostic test in day‐to‐day practice and its ability to provide quantitative or semiquantative data to predict the extent of promoter methylation. We addressed these technical aspects in full detail elsewhere (38). One of the conclusions we were able to draw was that besides its general feasibility in promoter methylation analysis MCA‐Meth may be an interesting initial screening tool for candidate genes because of its ability to provide semiquantitative data of inter‐priming site methylation (38).
Gene expression regulation is complex. Aberrant promoter methylation may only be one of multiple determining factors. For example, glucocorticoids, ionizing radiation, genotoxic agents, and p53 all affect MGMT expression. Therefore, protein‐based assays may be of particular value and interest in cases in which the underlying driving force and the major mechanism of gene expression regulation is obscure or is influenced by or dependent on multiple factors. In these settings, the protein level equals the endpoint of all possible regulatory mechanisms. However, here we hypothesized promoter hypermethylation to be potentially the major driving force to regulate gene expression of the investigated genes. To address this question we investigated if protein expression levels in tumor‐derived tissue predicts the promoter methylation status of the respective gene. However, we did not see any correlation between protein expression levels and promoter methylation status. Our results are more consistent with a multifactorial gene expression regulation for the investigated genes. Thus our data discourage, in our view, attempts to establish immunohistochemically based diagnostic assays for promoter methylation of these genes in particular. Of note, supporting evidence reinforcing our experience come from a publication on PTEN methylation status and immunohistochemistry (3) and recently published data on MGMT promoter methylation and MGMT immunohistochemistry (34).
In conclusion, we introduce MCA‐Meth as a suitable technique for an easy, reliable and fast semiquantitative promoter methylation analysis technique. We show that protein levels alone fail to reflect the promoter methylation status of any investigated gene here and thus conclude that in clinical diagnostic attempts to predict promoter methylation of these genes by protein‐based assays are of no or only limited use. For NORE1A and PTEN we can exclude promoter methylation as the driving force of gene inactivation in gliomas. We confirm the frequency of promoter methylation for MGMT and BLU in a substantial subgroup of high‐grade gliomas. We identify de novo DNMT deregulation in a subset of gliomas that may proof to explain the methylation phenotype of individual gliomas in future investigations. We identified frequent epigenetic RASSF1A and BLU inactivation in low‐ and high‐grade gliomas supporting a TSG cluster on 3p21.3 in gliomas, and we propose RASSF1A promoter methylation analysis for clinical tumor identification and monitoring.
Supporting information
Figure S1. Molecular and immunohistochemical phenotyping of T98G and U87MG glioma cell lines and PTEN promoter methylation status by MSP with PTEN‐specific primers.
Figure S2. Bisulfite sequencing of PTEN‐specific fragment (Set I U‐Primer, Zysman et al (57)). Genomic sequence of PTEN.
Table S1. Primer sequences.
This material is available as part of the online article from: http://www.blackwellsynergy.com
Please note: Blackwell Publishing is not responsible for the content or functionality of any supplementary materials supplied by the authors. Any queries (other than missing material) should be directed to the corresponding author for the article.
Supporting info item
Supporting info item
Supporting info item
ACKNOWLEDGMENTS
We thank Dr Jesús Garibi for donation of surgical material from the Neurosurgery Service of Hospital de Cruces, Barakaldo, Spain. Aiala Lorente received a predoctoral fellowship from the Department of Education, Universities and Research of the Basque Government, Vitoria, Spain. Paula Lázcoz was a predoctoral fellow of the Public University of Navarra, Pamplona, Spain. Edurne Urdangarín received funds from the Department of Industry of the Government of Navarra, Pamplona, Spain. This research was supported in part by grants from the Departments of Health and Education of the Government of Navarra, Pamplona; Fondo de Investigación Sanitaria (PI031356), and Ministerio de Ciencia y Tecnología y Fondo Europeo de Desarrollo Regional (BFI2003‐08775), Madrid, Spain.
REFERENCES
- 1. Agathanggelou A, Honorio S, Macartney DP, Martinez A, Dallol A, Rader J et al (2001) Methylation associated inactivation of RASSF1A from region 3p21.3 in lung, breast and ovarian tumours. Oncogene 20:1509–1518. [DOI] [PubMed] [Google Scholar]
- 2. Agathanggelou A, Dallol A, Zöchbauer‐Müller S, Morrissey C, Honorio S, Hesson L et al (2003) Epigenetic inactivation of the candidate 3p21.3 suppressor gene BLU in human cancers. Oncogene 22:1580–1588. [DOI] [PubMed] [Google Scholar]
- 3. Baeza N, Weller M, Yonekawa Y, Kleihues P, Ohgaki H (2003) PTEN methylation and expression in glioblastomas. Acta Neuropathol 106:479–485. [DOI] [PubMed] [Google Scholar]
- 4. Baylin SB, Esteller M, Rountree MR, Bachman KE, Schuebel K, Herman JG (2001) Aberrant patterns of DNA methylation, chromatin formation and gene expression in cancer. Hum Mol Genet 10:687–692. [DOI] [PubMed] [Google Scholar]
- 5. Belinsky SA, Nikula KJ, Baylin SB, Issa JP (1996) Increased cytosine DNA‐methyltransferase activity is target‐cell‐specific and an early event in lung cancer. Proc Natl Acad Sci USA 93:4045–4050. [DOI] [PMC free article] [PubMed] [Google Scholar]
- 6. Blanc JL, Wager M, Guilhot J, Kusy S, Bataille B, Chantereau T et al (2004) Correlation of clinical features and methylation status of MGMT gene promoter in glioblastomas. J Neurooncol 68:275–283. [DOI] [PubMed] [Google Scholar]
- 7. Brell M, Tortosa A, Verger E, Gil JM, Viñolas N, Villá S et al (2005) Prognostic significance of O6‐methylguanine‐DNA methyltransferase determined by promoter hypermethylation and immunohistochemical expression in anaplastic gliomas. Clin Cancer Res 11:5167–5174. [DOI] [PubMed] [Google Scholar]
- 8. De Kok JB, Roelofs RW, Giesendorf BA, Pennings JL, Waas ET, Feuth T et al (2005) Normalization of gene expression measurements in tumor tissues: comparison of 13 endogenous control genes. Lab Invest 85:154–159. [DOI] [PubMed] [Google Scholar]
- 9. Ehrlich M (2002) DNA methylation in cancer: too much, but also too little. Oncogene 21:5400–5413. [DOI] [PubMed] [Google Scholar]
- 10. El‐Deiry WS, Nelkin BD, Celano P, Yen RW, Falco JP, Hamilton SR, Baylin SB (1991) High expression of the DNA methyltransferase gene characterizes human neoplastic cells and progression stages of colon cancer. Proc Natl Acad Sci USA 88:3470–3474. [DOI] [PMC free article] [PubMed] [Google Scholar]
- 11. Eoli M, Menghi F, Bruzzone MG, De Simone T, Valletta L, Pollo B et al (2007) Methylation of O6‐methylguanine DNA methyltransferase and loss of heterozygosity on 19q and/or 17p are overlapping features of secondary glioblastomas with prolonged survival. Clin Cancer Res 13:2606–2613. [DOI] [PubMed] [Google Scholar]
- 12. Esteller M (2005) Dormant hypermethylated tumour suppressor genes: questions and answers. J Pathol 205:172–180. [DOI] [PubMed] [Google Scholar]
- 13. Esteller M, Garcia‐Foncillas J, Andion E, Goodman SN, Hidalgo OF, Vanaclocha V et al (2000) Inactivation of the DNA‐repair gene MGMT and the clinical response of gliomas to alkylating agents. New Engl J Med 343:1350–1354. [DOI] [PubMed] [Google Scholar]
- 14. Esteller M, Corn PG, Baylin SB, Herman JG (2001) A gene hypermethylation profile of human cancer. Cancer Res 61:3225–3229. [PubMed] [Google Scholar]
- 15. Fan X, Muñoz J, Sanko SG, Castresana JS (2002) PTEN, DMBT1, and p16 alterations in diffusely infiltrating astrocytomas. Int J Oncol 21:667–674. [PubMed] [Google Scholar]
- 16. Fanelli M, Caprodossi S, Ricci‐Vitiani L, Porcellini A, Tomassoni‐Ardori F, Amatori S et al (2008) Loss of pericentromeric DNA methylation pattern in human glioblastoma is associated with altered DNA methyltransferases expression and involves the stem cell compartment. Oncogene 27:358–365. [DOI] [PubMed] [Google Scholar]
- 17. Gao Y, Guan M, Su B, Liu W, Xu M, Lu Y (2004) Hypermethylation of the RASSF1A gene in gliomas. Clin Chim Acta 349:173–179. [DOI] [PubMed] [Google Scholar]
- 18. Girault I, Tozlu S, Lidereau R, Bieche I (2003) Expression analysis of DNA methyltransferases 1, 3A, and 3B in sporadic breast carcinomas. Clin Cancer Res 9:4415–4422. [PubMed] [Google Scholar]
- 19. Greenman C, Stephens P, Smith R, Dalgliesh GL, Hunter C, Bignell G et al (2007) Patterns of somatic mutation in human cancer genomes. Nature 446:153–158. [DOI] [PMC free article] [PubMed] [Google Scholar]
- 20. Harada K, Toyooka S, Maitra A, Maruyama R, Toyooka KO, Timmons CF et al (2002) Aberrant promoter methylation and silencing of the RASSF1A gene in pediatric tumors and cell lines. Oncogene 21:4345–4349. [DOI] [PubMed] [Google Scholar]
- 21. Hegi ME, Diserens AC, Gorlia T, Hamou MF, De Tribolet N, Weller M et al (2005) MGMT gene silencing and benefit from temozolomide in glioblastoma. New Engl J Med 352:997–1003. [DOI] [PubMed] [Google Scholar]
- 22. Herman JG, Graff JR, Myohanen S, Nelkin BD, Baylin SB (1996) Methylation‐specific PCR: a novel PCR assay for methylation status of CpG islands. Proc Natl Acad Sci USA 93:9821–9826. [DOI] [PMC free article] [PubMed] [Google Scholar]
- 23. Hesson L, Dallol A, Minna JD, Maher ER, Latif F (2003) NORE1A, a homologue of RASSF1A tumour suppressor gene is inactivated in human cancers. Oncogene 22:947–954. [DOI] [PubMed] [Google Scholar]
- 24. Hesson L, Bièche I, Krex D, Criniere E, Hoang‐Xuan K, Maher ER, Latif F (2004) Frequent epigenetic inactivation of RASSF1A and BLU genes located within the critical 3p21.3 region in gliomas. Oncogene 23:2408–2419. [DOI] [PubMed] [Google Scholar]
- 25. Horiguchi K, Tomizawa Y, Tosaka M, Ishiuchi S, Kurihara H, Mori M, Saito N (2003) Epigenetic inactivation of RASSF1A candidate tumor suppressor gene at 3p21.3 in brain tumors. Oncogene 22:7862–7865. [DOI] [PubMed] [Google Scholar]
- 26. Hung J, Kishimoto Y, Sugio K, Virmani A, McIntire DD, Minna JD, Gazdar AF (1995) Allele‐specific chromosome 3p deletions occur at an early stage in the pathogenesis of lung carcinoma. JAMA 273:1908. [DOI] [PubMed] [Google Scholar]
- 27. Irimia M, Fraga MF, Sanchez‐Cespedes M, Esteller M (2004) CpG island promoter hypermethylation of the Ras‐effector gene NORE1A occurs in the context of a wild‐type K‐ras in lung cancer. Oncogene 23:8695–8699. [DOI] [PubMed] [Google Scholar]
- 28. Issa JP, Vertino PM, Wu J, Sazawal S, Celano P, Nelkin BD et al (1993) Increased cytosine DNA‐methyltransferase activity during colon cancer progression. J Natl Cancer Inst 85:1235–1240. [DOI] [PubMed] [Google Scholar]
- 29. Jones PA, Takai D (2001) The role of DNA methylation in mammalian epigenetics. Science 293:1068–1070. [DOI] [PubMed] [Google Scholar]
- 30. Kanai Y, Ushijima S, Kondo Y, Nakanishi Y, Hirohashi S (2001) DNA methyltransferase expression and DNA methylation of CPG islands and peri‐centromeric satellite regions in human colorectal and stomach cancers. Int J Cancer 91:205–212. [DOI] [PubMed] [Google Scholar]
- 31. Kanno H, Shuin T, Kondo K, Yamamoto I, Ito S, Shinonaga M et al (1997) Somatic mutations of the von Hippel‐Lindau tumor suppressor gene and loss of heterozygosity on chromosome 3p in human glial tumors. Cancer Res 57:1035–1038. [PubMed] [Google Scholar]
- 32. Kok K, Naylor SL, Buys CH (1997) Deletions of the short arm of chromosome 3 in solid tumors and the search for suppressor genes. Adv Cancer Res 71:27–92. [DOI] [PubMed] [Google Scholar]
- 33. Komine C, Watanabe T, Katayama Y, Yoshino A, Yokoyama T, Fukushima T (2003) Promoter hypermethylation of the DNA repair gene O6‐methylguanine‐DNA methyltransferase is an independent predictor of shortened progression free survival in patients with low‐grade diffuse astrocytomas. Brain Pathol 13:176–184. [DOI] [PMC free article] [PubMed] [Google Scholar]
- 34. Krex D, Klink B, Hartmann C, Von Deimling A, Pietsch T, Simon M et al (2007) Long‐term survival with glioblastoma multiforme. Brain 130:2596–2606. [DOI] [PubMed] [Google Scholar]
- 35. Laird PW (2005) Cancer epigenetics. Hum Mol Genet 14 (Spec No 1):R65–76. [DOI] [PubMed] [Google Scholar]
- 36. Li LC, Dahiya R (2002) MethPrimer: designing primers for methylation PCRs. Bioinformatics 18:1427–1431. [DOI] [PubMed] [Google Scholar]
- 37. Lin RK, Hsu HS, Chang JW, Chen CY, Chen JT, Wang YC (2007) Alteration of DNA methyltransferases contributes to 5′CpG methylation and poor prognosis in lung cancer. Lung Cancer 55:205–213. [DOI] [PubMed] [Google Scholar]
- 38. Lorente A, Mueller W, Urdangarin E, Lazcoz P, Von Deimling A, Castresana JS (2008) Detection of methylation in promoter sequences by melting curve analysis‐based semiquantitative real time PCR. BMC Cancer 8:61. [DOI] [PMC free article] [PubMed] [Google Scholar]
- 39. Martinez R, Schackert G, Yaya‐Tur R, Rojas‐Marcos I, Herman JG, Esteller M (2007) Frequent hypermethylation of the DNA repair gene MGMT in long‐term survivors of glioblastoma multiforme. J Neurooncol 83:91–93. [DOI] [PubMed] [Google Scholar]
- 40. Martinez R, Setien F, Voelter C, Casado S, Quesada MP, Schackert G, Esteller M (2007) CpG island promoter hypermethylation of the pro‐apoptotic gene caspase‐8 is a common hallmark of relapsed glioblastoma multiforme. Carcinogenesis 28:1264–1268. [DOI] [PubMed] [Google Scholar]
- 41. Matsumura T, Malik F, Holliday R (1989) Levels of DNA methylation in diploid and SV40 transformed human fibroblasts. Exp Gerontol 24:477–481. [DOI] [PubMed] [Google Scholar]
- 42. Pfaffl MW (2001) A new mathematical model for relative quantification in real‐time RT‐PCR. Nucleic Acids Res 29:e45. [DOI] [PMC free article] [PubMed] [Google Scholar]
- 43. Robertson KD, Uzvolgyi E, Liang G, Talmadge C, Sumegi J, Gonzales FA, Jones PA (1999) The human DNA methyltransferases (DNMTs) 1, 3a and 3b: coordinate mRNA expression in normal tissues and overexpression in tumors. Nucleic Acids Res 27:2291–2298. [DOI] [PMC free article] [PubMed] [Google Scholar]
- 44. Rozen S, Skaletsky H (2000) Primer3 on the WWW for general users and for biologist programmers. Method Mol Biol 132:365–386. [DOI] [PubMed] [Google Scholar]
- 45. Saito Y, Kanai Y, Sakamoto M, Saito H, Ishii H, Hirohashi S (2001) Expression of mRNA for DNA methyltransferases and methyl‐CpG‐binding proteins and DNA methylation status on CpG islands and pericentromeric satellite regions during human hepatocarcinogenesis. Hepatology 33:561–568. [DOI] [PubMed] [Google Scholar]
- 46. Salvesen HB, MacDonald N, Ryan A, Jacobs IJ, Lynch ED, Akslen LA, Das S (2001) PTEN methylation is associated with advanced stage and microsatellite instability in endometrial carcinoma. Int J Cancer 91:22–26. [DOI] [PubMed] [Google Scholar]
- 47. Simão Tde A, Simões GL, Ribeiro FS, Cidade DA, Andreollo NA, Lopes LR et al (2006) Lower expression of p14ARF and p16INK4a correlates with higher DNMT3B expression in human oesophageal squamous cell carcinomas. Hum Exp Toxicol 25:515–522. [DOI] [PubMed] [Google Scholar]
- 48. Srivastava T, Chosdol K, Chattopadhayay P, Sarkar C, Mahapatra AK, Sinha S (2007) Frequent loss of heterozygosity encompassing the hMLH1 locus in low grade astrocytic tumors. J Neurooncol 81:249–255. [DOI] [PubMed] [Google Scholar]
- 49. Taniyama K, Goodison S, Ito R, Bookstein R, Miyoshi N, Tahara E et al (2001) PTEN expression is maintained in sporadic colorectal tumours. J Pathol 194:341–348. [DOI] [PubMed] [Google Scholar]
- 50. Ullrich SJ, Mercer WE, Appella E (1992) Human wild‐type p53 adopts a unique conformational and phosphorylation state in vivo during growth arrest of glioblastoma cells. Oncogene 7:1635–1643. [PubMed] [Google Scholar]
- 51. Watanabe T, Katayama Y, Yoshino A, Yachi K, Ohta T, Ogino A et al (2007) Aberrant hypermethylation of p14ARF and O6‐methylguanine‐DNA methyltransferase genes in astrocytoma progression. Brain Pathol 17:5–10. [DOI] [PMC free article] [PubMed] [Google Scholar]
- 52. Wiencke JK, Zheng S, Jelluma N, Tihan T, Vandenberg S, Tamgüney T et al (2007) Methylation of the PTEN promoter defines low‐grade gliomas and secondary glioblastoma. Neuro Oncol 9:271–279. [DOI] [PMC free article] [PubMed] [Google Scholar]
- 53. Wistuba II, Behrens C, Virmani AK, Mele G, Milchgrub S, Girard L et al (2000) High resolution chromosome 3p allelotyping of human lung cancer and preneoplastic/preinvasive bronchial epithelium reveals multiple, discontinuous sites of 3p allele loss and three regions of frequent breakpoints. Cancer Res 60:1949–1960. [PubMed] [Google Scholar]
- 54. Xue WC, Chan KY, Feng HC, Chiu PM, Ngan HY, Tsao SW, Cheung AN (2004) Promoter hypermethylation of multiple genes in hydatidiform mole and choriocarcinoma. J Mol Diagn 6:326–334. [DOI] [PMC free article] [PubMed] [Google Scholar]
- 55. Yarosh DB (1985) The role of O6‐methylguanine‐DNA methyltransferase in cell survival, mutagenesis and carcinogenesis. Mutat Res 145:1–16. [DOI] [PubMed] [Google Scholar]
- 56. Yu J, Zhang H, Gu J, Lin S, Li J, Lu W et al (2004) Methylation profiles of thirty four promoter‐CpG islands and concordant methylation behaviours of sixteen genes that may contribute to carcinogenesis of astrocytoma. BMC Cancer 4:65. [DOI] [PMC free article] [PubMed] [Google Scholar]
- 57. Zysman MA, Chapman WB, Bapat B (2002) Considerations when analyzing the methylation status of PTEN tumor suppressor gene. Am J Pathol 160:795–800. [DOI] [PMC free article] [PubMed] [Google Scholar]
Associated Data
This section collects any data citations, data availability statements, or supplementary materials included in this article.
Supplementary Materials
Figure S1. Molecular and immunohistochemical phenotyping of T98G and U87MG glioma cell lines and PTEN promoter methylation status by MSP with PTEN‐specific primers.
Figure S2. Bisulfite sequencing of PTEN‐specific fragment (Set I U‐Primer, Zysman et al (57)). Genomic sequence of PTEN.
Table S1. Primer sequences.
This material is available as part of the online article from: http://www.blackwellsynergy.com
Please note: Blackwell Publishing is not responsible for the content or functionality of any supplementary materials supplied by the authors. Any queries (other than missing material) should be directed to the corresponding author for the article.
Supporting info item
Supporting info item
Supporting info item