

Abstract
Parkinson's disease (PD) is a neurodegenerative disorder characterized by the progressive loss of dopaminergic neurons in the substantia nigra. We have studied alterations in gene expression in the substantia nigra, the caudate nucleus and putamen of four PD patients and four matched controls using custom designed Agilent microarrays. To gain insight into changes in gene expression during early stages of dopaminergic neurodegeneration, we selectively investigated the relatively spared parts of the PD substantia nigra, and correlated gene expression changes with alterations in neuronal density. We identified changes in the expression of 287 transcripts in the substantia nigra, 16 transcripts in the caudate nucleus and four transcripts in the putamen. For selected transcripts, transcriptional alterations were confirmed with qPCR on a larger set of seven PD cases and seven matched controls. We detected concerted changes in functionally connected groups of genes. In the PD substantia nigra, we observed strong evidence for a reduction in neurotrophic support and alterations in axon guidance cues. As the changes occur in relatively spared parts of the PD substantia nigra, they suggest novel disease mechanisms involving neurotrophic support and axon guidance in early stages of cellular stress events, ultimately leading to dopaminergic cell death in PD.
Keywords: axon guidance, microarray, neurodegeneration, neurotrophic support, Parkinson's Disease
INTRODUCTION
Parkinson's disease (PD) is, after Alzheimer's disease, the second most prevalent age‐related neurodegenerative disorder, affecting approximately 1% of the population above the age of 65. The main clinical features of PD are resting tremor, rigidity, slowness of voluntary movement and postural instability 19, 53). Neuropathologically, PD is characterized by the progressive loss of nigrostriatal dopaminergic (DAergic) neurons in the presence of two types of neuronal inclusion bodies: spindle or threadlike Lewy neurites in cellular processes, and globular Lewy bodies in neuronal somata 11, 27). The loss of DAergic neurons in the substantia nigra pars compacta (SN) results in reduced dopamine (DA) levels in the striatum, which in turn causes the majority of the clinical symptoms of PD. Patients with severe neuronal loss in the SN show, generally, also pathology in the neocortex (11). Interestingly, the SN is affected in PD in a heterogeneous way. For example, DAergic neurons in calbindin‐poor regions (the nigrosomes) of the SN are more prone to degenerate than neurons in the calbindin‐rich nigral matrix (18). This suggests that interactions of DAergic neurons with their surroundings might be important in neuronal vulnerability in PD.
In the last decade, mutations in the SNCA, LRRK2, PARK2, PINK1 and DJ‐1 genes have been found to cause inheritable forms of PD, with differences in age of onset and other specific clinical manifestations of the disease. Furthermore, association studies revealed several other genes that alter PD susceptibility, such as UCHL1 and NURR1 (32). On first sight, the genes that are involved in PD are unrelated in function. For example, LRRK2 functions as a cytosolic kinase, PARK2 is an E3 ubiquitin ligase that tags ubiquitin molecules to proteins destined to be degraded by the proteasome, and DJ‐1 is involved in signaling in response to oxidative stress (32). The function of SNCA, although extensively studied, remains relatively unknown. It is likely to be involved in vesicle trafficking and synaptic transmission (13). For SCNA, both a gene triplication and point mutations lead to familial PD 62, 71). These alterations make SCNA more prone to aggregate, and SNCA is indeed a major component of Lewy bodies. Interestingly, UCHL1 and PARK2 are both involved in protein (de)ubiquitination. Dysregulated protein aggregation therefore appears to be an important common factor in PD pathogenesis (33).
Apart from genetic mutations, toxins such as 1‐methyl‐4‐phenyl‐1,2,3,6‐tetrahydropyridine (MPTP), rotenone and 6OH‐DA are known to induce Parkinson‐like pathology (9). Induction of oxidative stress is a common mode of action of these neurotoxins. Mutations in DJ‐1 and PINK1 are also associated with elevated levels of oxidative stress and/or mitochondrial dysfunction. Although discoveries of gene mutations in familial PD and the existence of specific neurotoxic substances inducing parkinsonian phenotypes have provided important insights into familial and sporadic PD, there are still many open questions regarding the specific molecular mechanisms underlying the sporadic form of PD. The etiology of sporadic PD is most likely multifactorial, and the heterogeneous vulnerability of SN DAergic neurons suggests involvement of the surrounding cellular environment. Also, in PD, the loss of presynaptic terminals in the striatum precedes the loss of neuronal cell bodies in the SN (5). We therefore hypothesize that DAergic neurons are under the control of environmental cues in the SN as well as terminal areas. These environmental cues, together with factors intrinsic to DAergic neurons, make up the unique conditions in which SN DAergic neurons selectively degenerate in PD. To investigate these conditions, we have generated gene expression profiles of the caudate nucleus, putamen and SN of four clinically and neuropathologically well‐characterized PD patients and matched controls using custom‐designed high‐density microarrays, and validated genes possibly implicated in PD on a larger set of seven PD patients and seven matched controls.
EXPERIMENTAL PROCEDURES
Subjects
Post‐mortem human brain tissue was obtained from The Netherlands Brain Bank, Netherlands Institute for Neuroscience, Amsterdam (NBB). All material has been collected from donors from whom a written informed consent for a brain autopsy and the use of the material and clinical information for research purposes had been obtained by the NBB. All subjects were clinically diagnosed and treated PD patients, a diagnosis that was neuropathologically confirmed (n = 7), or were controls without neurological or psychiatric disorders and without neuropathological alterations (n = 8). All PD patients received DA replacement therapies during the course of their disease. Both PD patients and controls were neuropathologically systematically investigated as described earlier (75). The controls did not exceed a Braak pathology score for neurofibrillary tangles of 2 (10). Care was taken to match subjects as closely as possible for age, sex, post‐mortem interval and brain pH (see Table 1). As agonal state is one of the most important factors influencing RNA quality, and RNA expression profiles are correlated with brain pH (74), samples with a cerebrospinal fluid pH below 6.3 were excluded. In addition, we excluded patients who were treated with Prednisone at the time of death, unless stated otherwise. Only subjects from whom freshly frozen tissue samples of the caudate nucleus, putamen, as well as SN were available, were included. There were no significant differences between PD and control groups for age, pH, RNA integrity, post‐mortem interval and brain weight (Mann‐Whitney U test, Table 1).
Table 1.
Clinicopathological data of human postmortem samples. Abbreviations: PD/DEM = Parkinson's disease with dementia; PMI = post‐mortem interval (h); BW = brain weight (g); RIN = RNA integrity number; P‐value = Mann‐Whitney U P‐value; SD = standard deviation.
| Subject | Diagnosis | Sex | Age | PMI | pH | BW | RIN | Cause of death | Remarks |
|---|---|---|---|---|---|---|---|---|---|
| 00–115 | PD/DEM | M | 70 | 9:05 | 6.33 | 1258 | 6.2 | Pneumonia, septic shock | |
| 04–045 | PD/DEM | M | 71 | 6:58 | 6.55 | 1358 | 8.4* | Pneumonia | |
| 00–139 | PD/DEM | M | 72 | 7:15 | 6.55 | 1546 | 6.7 | Uremia | |
| 02–003 | PD | F | 75 | 5:00 | 6.52 | 1218 | 9.6* | Euthanasia | |
| 02–011 | PD | F | 79 | 5:45 | 6.37 | 1203 | 8.7* | Myocard infarction | |
| 00–034 | PD | M | 86 | 8:30 | 6.52 | 1178 | 9.2* | Unknown | |
| 02–064 | PD | M | 87 | 7:20 | 6.37 | 1166 | 7.4 | Respiratory insufficiency | |
| Mean ± SD | 5M/2F | 77.1 ± 7.1 | 7.1 ± 1.3 | 6.5 ± 0.1 | 1275 ± 136 | 8.0 ± 1.3 | |||
| 98–126 | CTRL | M | 71 | 6:00 | 6.54 | 1385 | 8.8 | Respiratory insufficiency | |
| 00–049 | CTRL | M | 78 | 6:55 | 6.42 | 1332 | 9.2* | Cardiac failure | |
| 97–144 | CTRL | M | 78 | 4:00 | 6.43 | 1160 | 9.0* | Pulmonary carcinoma | Prednisone |
| 00–142 | CTRL | F | 82 | 5:30 | 6.60 | 1280 | 9.2* | Myocardial infarct | |
| 00–022 | CTRL | F | 83 | 7:45 | 6.52 | 1102 | 9.2* | Acute myocard infarction | |
| 98–062 | CTRL | M | 85 | 4:35 | 6.95 | 1332 | 7.5 | Respiratory insufficiency secondary to metastasized adenocarcinoma | |
| 99–046 | CTRL | F | 89 | 5:10 | 6.62 | 1168 | 9.5 | Cardiac arrest | |
| 01–029 | CTRL | F | 90 | 5:25 | 6.58 | 1066 | 7.6 | Myocard infarction | |
| Mean ± SD | 4M/4F | 82 ± 6.3 | 5.4 ± 1.1 | 6.6 ± 0.2 | 1228 ± 119 | 8.8 ± 0.8 | |||
| P‐value | 0.22 | 0.06 | 0.08 | 0.49 | 0.22 |
Samples used in microarray experiment.
Tissue dissection
For the caudate nucleus and putamen tissue samples, structures were identified macroscopically in the frozen tissue by the gross anatomical features and surrounding white matter. A cylindrical punch of 50–100 mg gray matter was obtained by a hollow dry‐ice cooled drill, collected in prechilled 2 mL tubes and immediately put on dry ice. The SN tissue samples were first treated for 48 h with RNAlater®‐ICE (Ambion, Austin, TX, USA) at −20°C to stabilize the RNA and to soften the tissue to enable dissection using scalpels. The area of interest was the least affected part of the SN of each PD patient that was macroscopically defined by the presence of black pigmentation in the unstained tissue, which represents the neuromelanin in DAergic neurons. Although it was apparent that the SNs from PD patients lost the majority of its pigmentation, for all individuals, pigmented areas could easily be identified. Small portions of the pigmented areas (∼10 mg) were rapidly dissected out by hand on a dry‐ice chilled metal plate, and transferred to prechilled 2 mL tubes and immediately put on dry ice. Dissected samples were stored at −80°C until use.
RNA isolation
Total RNA was extracted from all brain regions using a hybrid protocol of Trizol (Life Sciences, Grand Island, NY, USA) and Qiagen RNeasy Mini Kit™ (Qiagen, Valencia, CA, USA) RNA isolation methods. Briefly, samples were homogenized in Trizol (3 mL per 100 mg tissue). After phase separation by addition of chloroform, the aqueous phase was transferred to a new tube and mixed with an equal amount of 70% ethanol. This mixture was then applied to an RNeasy Mini™ column, and processed according to the RNeasy Mini™ Protocol for RNA Cleanup (version June 2001, from Step 3). RNA purity was determined using a NanoDrop® ND‐1000 spectrophotometer (Nanodrop Technologies, Wilmington, DE, USA). RNA integrity was determined by the RNA Integrity Number (RIN) as measured on the Agilent™ 2100 bioanalyzer (Agilent Technologies, Palo Alto, CA, USA). The RIN values varied, ranging from 6.2 (moderately degraded) to 9.6 (intact RNA). Because RNA quality has strong effects on gene expression profiles, only samples with high RNA quality were selected for microarray experiments (four PD patients and four controls, RIN > 8.3, see Table 1). RNA quality was sufficient for qPCR analysis for all samples under investigation.
Sample labeling and microarray hybridization
For microarray analysis, Agilent custom‐made 22K 60‐mer oligonucleotide arrays were used. Array probes were designed to contain all homo sapiens unigene clusters consisting of at least one mRNA molecule (∼15 K probes) and ∼7.5 K probes for expressed sequence tags known to be expressed in the brain or eye. Array hybridization was performed according to the manufacturer's instructions. Briefly, equal amounts (500 ng for caudate and putamen, 1 µg for substantia nigra) of Cy3 and Cy5‐labeled RNA were hydrolyzed for 30 minutes at 60°C in 1x fragmentation buffer (Agilent Technologies). The fragmented targets were hybridized to a microarray by incubating for 17 h in 1x target solution (Agilent Technologies) at 60°C in a rotating hybridization chamber. Microarrays were washed in 6xSSPE/0.005% N‐Lauroylsarcosine (Sigma‐Aldrich, St Louis, MI, USA) for 5 minutes at room temperature (RT) and 0.06xSSPE/0.005% N‐Lauroylsarcosine for 1 minute at RT. Finally, microarray slides were washed in acetonitril (Sigma‐Aldrich) for 30 s and dried in a nitrogen flow. Microarrays were scanned using an Agilent™ DNA Microarray Scanner (Agilent Technologies) at 5 µm resolution and 100% PMT setting. Microarray scans were quantified using Agilent™ Feature Extraction Software (Agilent Technologies, version 7.5.1). The hybridization setups can be found in Supplementary Table S1.
Single gene analysis
Raw expression data generated by the Feature Extraction Software were imported into the R statistical processing environment (http://www.r‐project.org), and analyzed using the LIMMA package in Bioconductor (http://www.bioconductor.org). Intra‐array normalization was performed using the loess algorithm. The intensity distributions between arrays were normalized using the Aquantile scaling algorithm. For each brain area, significant genes were determined by fitting a linear model to the normalized ratios and determining the contrast between PD and controls. Uncorrected P‐values were corrected for multiple testing using the Bonferroni correction algorithm. Genes with a corrected P‐value < 0.05 were considered significant.
Gene group analysis
For analysis on a gene group level, probes on the microarray were annotated using the Gene Ontology database (GO) (2) and the Kyoto Encyclopedia of Genes and Genomes (KEGG) (59). Briefly, Ensembl gene identifiers for the probe sequences were retrieved using the ProbeLynx probe annotation tool (67). GO annotation for the Ensembl identifiers was retrieved from the Ensembl database using the Bioconductor biomaRt package. Out of the 21 939 probes on the array, 10 813 probes were annotated with one or more GO identifiers, for a total of 3941 unique GO identifiers. The KEGG annotation was retrieved from the Bioconductor KEGG package. 2663 probes were annotated with one ore more KEGG identifiers, for a total of 181 unique KEGG classes. A gene group was then defined as a group of probes with either the same GO or KEGG annotation. Only gene groups with 5 to 150 member genes were selected for subsequent analyses.
Significantly dysregulated gene groups were identified using the functional class scoring approach as described in Pavlidis et al (61). Briefly, for each gene group, a functional class score (FCS) was defined as the mean of the log transformed uncorrected P‐values of differential expression between PD and controls of the gene group members. In order to determine the background distribution of FCSs for each gene group, a random gene set of the same size as the gene group under investigation was chosen, and the FCS was calculated. This procedure was repeated 200.000 times to obtain the simulated background distribution. The FCS P‐value was then defined as the fraction of simulated FCS scores that were higher than the actual FCS score for the gene group under investigation. The smallest possible P‐value therefore was 5e‐06. Groups with smaller P‐values were set to 2.5e‐06. FCS P‐values were corrected for multiple testing with the Benjamini and Hochberg False Discovery Rate model. P‐values < 0.05 were considered significant.
Reverse transcription and quantitative PCR
For the caudate nucleus and putamen, each sample was reversely transcribed using 500 ng RNA, oligo dT primers and SuperScript II™ Reverse Transcriptase (Invitrogen, Carlsbad, CA, USA). 1/200th of the total cDNA yield was used for all quantification reactions. Because of lower yields, 250 ng of SN RNA was used as input for the cDNA synthesis reaction, and 1/100th of the total cDNA yield was used for SN quantification reactions. Transcript quantifications were carried out on an ABI 7300 sequence detection system (Applied Biosystems, Foster City, CA, USA). Each reaction was performed with the appropriate amount of cDNA, 3 pmol of forward and reverse primers and 10 uL 2x SYBR® green ready reaction mix (Applied Biosystems) in a total volume of 20 µL. Forward and reverse primer sequences can be found in Supplementary Table S2. To check for primer dimers, dissociation curves were generated for all wells. For between‐sample normalization, genes were selected for each brain area that were not regulated between PD and control using expression stability measurements and geometric averaging of multiple internal reference genes (76). Briefly, an initial selection of 10 genes was made based on the gene expression data and reference gene data from literature. The most stable genes between paradigms were selected, and for each sample, a normalization factor was determined by geometric averaging of the expression values of these genes. For the SN, ACTB, MRPL24 and DHX16 were used for normalization purposes. For the caudate nucleus, ACTB, GAPDH, PRPSAP1 and UFM1 were used. For the putamen, ACTB, GAPDH, GOT2, DHX16 and FAM96B were used. Genes were selected for quantitative PCR (qPCR) validation in two ways: by random selection from the list of differentially expressed genes to technically validate the microarray data, and by selecting genes based upon their possible involvement in the dysregulated processes as determined by the gene group analysis. Genes of interest were quantified in the following manner. For each primer pair, relative amounts were calculated by means of the formula primer.eff ∧ (Ct‐minimal Ct). The resulting raw relative amounts were scaled using the normalization factor to yield corrected relative amounts. P‐values between PD and control were calculated with the Mann‐Whitney U test using the corrected relative amounts. P‐values < 0.05 were considered significant.
Cell density measurements
In order to estimate the neuron density in the SN, for each of the seven PD and eight control subjects, five 6‐µm thick sections were randomly taken from the formalin‐fixed, paraffin‐embedded mesencephalon contralateral to the frozen side that was used for the microarray and qPCR experiments. Sections were stained with hematoxylin‐eosin. Pictures were taken using a Zeiss Axioskop microscope with Neofluar objectives (Carl Zeiss MicroImaging GmbH, Oberkochen, Germany) and an EvolutionMP™ camera and Image Pro Plus™ (version 5, Media Cybernetics, Bethesda, MD, USA). Pictures were analyzed using a custom‐build macro in Image Pro Plus™.
Two templates were constructed that represented 2 × 1 mm or 1.5 × 1 mm rectangles, which corresponded to the dimensions of dissected tissue samples used in the microarray and qPCR studies. For each section, the part of the SN that contained the highest density of neuromelanin was identified by eye at 2.5× magnification. A composite picture of this area was taken by combining 6 to 12 pictures at 2.5× magnification. In this composite picture, the area with the highest neuromelanin density was outlined using the template best fitting this area. The outlined area was then divided into subsections by a macro for cell counting at 20× magnification. For each subsection, a picture at 20× magnification was made, and structures of interest were counted by visual identification. Two cell types were included in the counting experiment: large neuromelanin‐positive neurons with a nucleolus, and large neuromelanin‐negative neurons with a nucleolus. These two types of neurons were counted separately. To prevent double counting, only neurons containing a nucleolus were counted. This counting procedure, which was judged to be the best for the thin (6 µm) section used 3, 34), is based upon the principle that nucleoli can be considered as hard particles that will not be sectioned by a microtome knife, but instead are pushed either in or out of the paraffin when hit by the knife (12). No nuclei with double nucleoli were observed. The nucleoli could be easily identified at 20× magnification. When in doubt, identification was made using a 40× objective. The estimated densities of the two neuronal types per cubic millimeter were calculated by dividing the number of identified structures by the measured area, and by correcting for section thickness. The final density per subject was defined as the average density of the five sections. As the quantification of neuronal structures based on counting nucleoli might not be related to the actual neuronal number in a one‐to‐one fashion, we expressed all counts as percentages of the average count of all structures in the control subjects (63). P‐values between PD and control were calculated with the Mann‐Whitney U test. P‐values < 0.05 were considered significant.
RESULTS
Clustering of gene expression profiles
In order to identify differences in gene expression between PD and controls, we performed microarray experiments on the SN, caudate nucleus and putamen of four PD patients and four matched controls. First, a hierarchical cluster analysis was applied to the microarray dataset in order to detect possible outliers (Figure 1). Only genes with consistently high expression levels throughout all subjects and brain areas were used (intensity >256 for all measurements, 6952 genes in total) to reduce the possible confounding effects of genes with low signal‐to‐noise ratios. The largest differences in expression were found between brain areas: the SN samples cluster apart from the caudate nucleus and putamen. Within the SN cluster, there was also full separation between PD and control samples, indicating substantial differences in gene expression. Unexpectedly, one control SN sample (sample ID 00‐022, or CTRL2) clustered apart from all samples. A comparison of the expression pattern of CTRL2 with the average expression pattern of all other SN samples (both PD and control) revealed a strong decrease in neuron‐specific transcripts in CTRL2 (data not shown). For example, SYT13 levels were only at 5% of combined PD and control levels. Similar low levels were found for, among others, NEFH (5%), MAP2 (18%) and NSE (20%). In contrast, several white matter‐related genes were overexpressed in CTRL2. These transcripts included VIM (1132% of combined PD and control levels), PMP22 (1392%) and FN1 (373%). We therefore concluded that the sample analyzed from the CTRL2 SN consisted of a different tissue type, and discarded the sample from further analysis.
Figure 1.
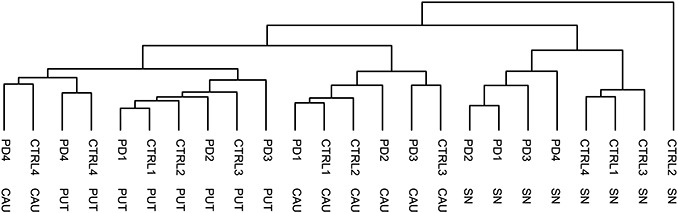
Clustering of microarray data. Hierarchical clustering analysis on array probes with a background corrected intensity >256 for all measurements (6952 genes in total). Note the aberrant position of CTRL2 SN. CAU = caudate nucleus; PUT = putamen; SN = substantia nigra pars compacta.
Detection of transcriptional alterations in the SN, caudate nucleus and putamen in PD
For each area of interest, the microarray data sets were analyzed to detect transcriptional alterations between PD and control. In the SN, 287 genes out of the 21 939 genes on the array were significantly changed in PD. The majority of the significant genes (240) was downregulated in PD, whereas 47 genes were upregulated. Expression changes in the target areas of the nigrostriatal pathway were less pronounced. In the caudate nucleus, 16 genes were found to be differentially expressed (six genes upregulated in PD, 10 genes downregulated). In the putamen, we found two genes significantly upregulated in PD, and two downregulated genes (Table 2 and Supplementary Table S3).
Table 2.
Overview of the most significant expression changes in the PD SN, caudate nucleus and putamen, as determined by microarray analysis. For the SN, only the 50 most significant genes are given (the full list of significantly changed genes in the SN can be found in Supplementary Table S3). Abbreviations: DE = differential expression, as fraction of control levels; P‐value = Bonferroni‐adjusted P‐value; PD = Parkinson's disease; SN = substantia nigra pars compacta.
| Substantia nigra | ||||
|---|---|---|---|---|
| Systematic name | Gene name | Description | DE | P‐value |
| Downregulated genes | ||||
| NM_000158 | GBE1 | Glucan (1,4‐alpha‐), branching enzyme 1 (glycogen branching enzyme, Andersen disease, glycogen storage disease type IV) | 0.18 | 0.00002 |
| NM_033495 | KLHL13 | Kelch‐like 13 (Drosophila) | 0.24 | 0.00003 |
| AL117636 | MRNA; cDNA DKFZp434H205 (from clone DKFZp434H205) | 0.34 | 0.00004 | |
| NM_004411 | DYNC1I1 | Dynein, cytoplasmic 1, intermediate chain 1 | 0.26 | 0.00005 |
| NM_002863 | PYGL | Phosphorylase, glycogen; liver (Hers disease, glycogen storage disease type VI) | 0.26 | 0.00005 |
| AB002376 | CAST1 | CAZ‐associated structural protein | 0.28 | 0.00011 |
| NM_000345 | SNCA | Synuclein, alpha (non A4 component of amyloid precursor) | 0.27 | 0.00016 |
| NM_002928 | RGS16 | Regulator of G‐protein signalling 16 | 0.22 | 0.00017 |
| AB014731 | DENR | Density‐regulated protein | 0.41 | 0.00025 |
| NM_018092 | NETO2 | Neuropilin (NRP) and tolloid (TLL)‐like 2 | 0.46 | 0.00029 |
| NM_014332 | SMPX | Small muscle protein, X‐linked | 0.31 | 0.00031 |
| NM_006670 | TPBG | Trophoblast glycoprotein | 0.18 | 0.00035 |
| NM_017999 | RNF31 | Ring finger protein 31 | 0.32 | 0.00037 |
| NM_006350 | FST | Follistatin | 0.17 | 0.00037 |
| BF035258 | AKAP12 | A kinase (PRKA) anchor protein (gravin) 12 | 0.39 | 0.00043 |
| AW974789 | TTMA | Two transmembrane domain family member A | 0.47 | 0.00047 |
| AF428101 | DACH2 | Dachshund homolog 2 (Drosophila) | 0.35 | 0.00053 |
| NM_018700 | TRIM36 | Tripartite motif‐containing 36 | 0.30 | 0.00054 |
| AK024251 | SLITRK5 | SLIT and NTRK‐like family, member 5 | 0.46 | 0.00056 |
| NM_005639 | SYT1 | Synaptotagmin I | 0.23 | 0.00062 |
| AB020710 | EHBP1 | EH domain binding protein 1 | 0.49 | 0.00063 |
| H06068 | yl72g10.s1 Soares infant brain 1NIB Homo sapiens cDNA clone IMAGE:43489 3‐, mRNA sequence | 0.46 | 0.00064 | |
| AF225987 | SCN3A | Sodium channel, voltage‐gated, type III, alpha | 0.47 | 0.00067 |
| AL390172 | Homo sapiens genomic DNA; cDNA DKFZp547I204 (from clone DKFZp547I204) | 0.35 | 0.00068 | |
| AK055427 | DGKH | Diacylglycerol kinase, eta | 0.31 | 0.00075 |
| NM_022726 | ELOVL4 | Elongation of very long chain fatty acids (FEN1/Elo2, SUR4/Elo3, yeast)‐like 4 | 0.46 | 0.00086 |
| NM_006186 | NR4A2 | Nuclear receptor subfamily 4, group A, member 2 | 0.20 | 0.00089 |
| NM_031850 | AGTR1 | Angiotensin II receptor, type 1 | 0.07 | 0.00095 |
| NM_014309 | RPL41 | Ribosomal protein L41 | 0.38 | 0.00101 |
| R42166 | yf99d08.s1 Soares infant brain 1NIB Homo sapiens cDNA clone IMAGE:30780 3‐, mRNA sequence | 0.25 | 0.00103 | |
| NM_012189 | CABYR | Calcium binding tyrosine‐(Y)‐phosphorylation regulated (fibrousheathin 2) | 0.49 | 0.00112 |
| NM_006113 | VAV3 | Vav 3 oncogene | 0.34 | 0.00113 |
| NM_014905 | GLS | Glutaminase | 0.43 | 0.00141 |
| J04621 | SDC2 | Syndecan 2 (heparan sulfate proteoglycan 1, cell surface‐associated, fibroglycan) | 0.37 | 0.00142 |
| AF070623 | LOC138046 | Hypothetical protein LOC138046 | 0.38 | 0.00144 |
| NM_004796 | NRXN3 | Neurexin 3 | 0.49 | 0.00148 |
| AK025615 | BCAT1 | Branched chain aminotransferase 1, cytosolic | 0.31 | 0.00153 |
| NM_003979 | GPRC5A | G protein‐coupled receptor, family C, group 5, member A | 0.30 | 0.00170 |
| AF339796 | HS6ST3 | Heparan sulfate 6‐O‐sulfotransferase 3 | 0.48 | 0.00172 |
| AL137498 | SCN2A2 | Sodium channel, voltage‐gated, type II, alpha 2 | 0.45 | 0.00174 |
| NM_000809 | GABRA4 | Gamma‐aminobutyric acid (GABA) A receptor, alpha 4 | 0.29 | 0.00182 |
| AW294729 | Transcribed locus, moderately similar to NP_509344.1 HIStone family member (his‐71) [Caenorhabditis elegans] | 0.55 | 0.00185 | |
| NM_003138 | SRPK2 | Homo sapiens SFRS protein kinase 2 (SRPK2), transcript variant 2, mRNA | 0.53 | 0.00186 |
| AF397397 | OLFM3 | Olfactomedin 3 | 0.31 | 0.00197 |
| NM_005100 | AKAP12 | A kinase (PRKA) anchor protein (gravin) 12 | 0.43 | 0.00220 |
| AB046788 | ROBO2 | Roundabout, axon guidance receptor, homolog 2 (Drosophila) | 0.32 | 0.00232 |
| AV707343 | V707343 ADB Homo sapiens cDNA clone ADBBSH02 5‐, mRNA sequence | 0.25 | 0.00238 | |
| Upregulated genes | ||||
| NM_018276 | SSH3 | Slingshot homolog 3 (Drosophila) | 1.66 | 0.00222 |
| BC013923 | SOX2 | SRY (sex determining region Y)‐box 2 | 1.86 | 0.00117 |
| BI823317 | 603041226F1 NIH_MGC_115 Homo sapiens cDNA clone IMAGE:5182015 5‐, mRNA sequence | 2.18 | 0.00136 | |
| Caudate nucleus | ||||
|---|---|---|---|---|
| Downregulated genes | ||||
| NM_001888 | CRYM | Crystallin, mu | 0.43 | 0.02542 |
| NM_006211 | PENK | Proenkephalin | 0.45 | 0.03796 |
| NM_030615 | KIF25 | Kinesin family member 25 | 0.56 | 0.01649 |
| NM_016454 | TMEM85 | Transmembrane protein 85 | 0.61 | 0.00577 |
| NM_006680 | ME3 | Malic enzyme 3, NADP(+)‐dependent, mitochondrial | 0.62 | 0.02043 |
| NM_000783 | CYP26A1 | Cytochrome P450, family 26, subfamily A, polypeptide 1 | 0.64 | 0.02402 |
| AL538117 | CXADR | Coxsackie virus and adenovirus receptor | 0.65 | 0.02382 |
| NM_015417 | C20orf28 | Chromosome 20 open reading frame 28 | 0.68 | 0.03102 |
| NM_004087 | DLG1 | Discs, large homolog 1 (Drosophila) | 0.70 | 0.04833 |
| NM_021252 | RAB18 | RAB18, member RAS oncogene family | 0.71 | 0.03775 |
| Upregulated genes | ||||
| AL136693 | CYBRD1 | Cytochrome b reductase 1 | 1.39 | 0.03087 |
| NM_003243 | TGFBR3 | Transforming growth factor, beta receptor III (betaglycan, 300kDa) | 1.47 | 0.01079 |
| NM_005413 | SIX3 | Sine oculis homeobox homolog 3 (Drosophila) | 1.52 | 0.01266 |
| NM_005859 | PURA | Purine‐rich element binding protein A | 1.54 | 0.04095 |
| AK026152 | CTSH | Cathepsin H | 1.64 | 0.00460 |
| NM_002343 | LTF | Lactotransferrin | 2.57 | 0.00004 |
| Putamen | ||||
|---|---|---|---|---|
| Downregulated genes | ||||
| BF381899 | GNPDA2 | Glucosamine‐6‐phosphate deaminase 2 | 0.52 | 0.00000 |
| AC016696 | Homo sapiens BAC clone RP11‐130P22 from 2, complete sequence. | 0.71 | 0.00313 | |
| Upregulated genes | ||||
| NM_015556 | SIPA1L1 | Signal‐induced proliferation‐associated 1 like 1 | 1.28 | 0.00944 |
| NM_001124 | ADM | Adrenomedullin | 1.80 | 0.02671 |
To validate the transcriptional alterations observed on the microarray, and to extrapolate the observed expression changes to the general PD population, we performed qPCR experiments on an extended set of seven PD patients and seven matched controls (Figure 2 and Supplementary Table S4). We were able to verify the direction of regulation of all transcripts investigated. Importantly, we detected significant differences between PD and controls for 26 out of the 34 genes under investigation (P < 0.05), with a further three genes nearing significance (P < 0.1). Also, qPCR and microarray fold changes exhibited a very strong linear correlation (r 2 = 0.86, P = 2.67e–15, Figure 3). This suggests that the observed alterations in the microarray experiment are indeed of relevance in a larger PD population.
Figure 2.

Transcriptional alterations in the PD SN. Selection of expression changes observed in the PD SN, as determined by qPCR on seven PD patients and seven controls. For each gene, the average of control measurements was set to 100%. All alterations are similar to those observed in the microarray experiment. (A) downregulated transcripts in PD. (B) upregulated transcripts in PD. (C) Alterations in truncated (T1) and full‐length (FL) forms of TrkB. Note the shift in the ratio TrkB.T1/TrkB.FL in PD. P‐values determined by the Mann‐Whitney U test. *P‐value < 0.05; **P‐value < 0.01. Abbreviations: PD = Parkinson's disease; SN = substantia nigra pars compacta.
Figure 3.

Comparison microarray and qPCR data. Correlation between microarray and qPCR fold changes for all 34 transcripts investigated by qPCR in the SN. The line represents the least squares fitted curve through the data points. Fold changes are given as log2 (PD/control). Abbreviations: SN = substantia nigra pars compacta; PD = Parkinson's disease.
Furthermore, several of the observed changes in SN gene expression corroborated earlier observations in PD. The most significantly downregulated gene in our SN dataset, GBE1, was also found to be significantly downregulated in the study performed by Grunblatt et al (30). Other examples of transcriptional alterations that were in agreement with earlier findings in PD include SYT1, TRIM36, MDH1, NSF, SASH1, ALDH1A1, DSCR1L1 and SNX10 30, 52, 81). Furthermore, we report transcriptional downregulation of both SNCA and NURR1, which are well known for their roles in familial PD. It is also noteworthy that in the studies of Miller et al and Moran et al, the number of downregulated genes in the PD SN by far surpasses that of upregulated genes, an observation we corroborated 52, 54).
We have also identified dysregulations in transcription levels of several genes previously not implicated in PD, which might have a role as new players in PD neurodegeneration. The most pronounced changes are described below.
Altered expression of genes involved in neurotrophin signaling
A substantial number of genes involved in neurotrophin signaling are transcriptionally altered in the PD SN. A reduction to 36% of control of RIT2 levels, a specific regulator of neurotrophin signaling (70), was detected. Transcript levels of MAGEE1, possibly involved in neurotrophin signaling via the p75 neurotrophin receptor (1), showed a similar decrease. The expression of NDN was reduced to 38% of normal levels in PD SN. NDN facilitates TrkA signaling to promote neuronal survival (44). Also, we observed a significant downregulation of DOK6, which is involved in the GDNF signaling pathway (17). DLK1, which is known to be regulated by GDNF (15), also exhibited a severe decline in expression (22% of normal levels). Interestingly, the expression of PHLPP was increased. PHLPP is known to decrease intracellular neurotrophin signaling by dephosphorylating Akt (28). We also observed elevated transcript levels of a truncated form of TrkB (TrkB‐T1), the receptor for BDNF. TrkB‐T1 lacks the intracellular kinase domain, and is therefore unable to induce the intracellular BDNF signaling cascade. Interestingly, the splice variants encoding for the full‐length versions of TrkB were significantly reduced in PD, as determined by qPCR (see Figure 2).
Changes in genes encoding axon guidance cues
The expression levels of several genes implicated in axon guidance are changed in the PD SN. The repulsive guidance protein RGMA was upregulated to 197% of control levels. Furthermore, transcript levels of ROBO2, the receptor for Slit2, were significantly reduced. The expression of NETO2 and SLITRK5 were both decreased in the PD SN. Although there is little knowledge on the cellular function of these proteins, their domain structure is suggestive for a role in axon guidance in development. SDC2, a heparan sulfate proteoglycan possibly involved in regulating the function of some axon guidance molecules, was downregulated in the PD SN. Finally, although not significantly changed, a subset of patients showed elevated levels of the axon guidance molecule Sema5A (see Supplementary Table S4).
Other gene changes in PD SN, caudate nucleus and putamen
One of the most strongly upregulated genes in the PD SN was the gene coding for the iron‐binding protein lactotransferrin (LTF), a finding that was replicated in the caudate nucleus. Other noteworthy gene changes in the PD SN include AGTR1, VMAT2, ALDH1A1, DSCR1L1 and PTS. In the PD caudate nucleus, in addition to the upregulation of LTF, CYBRD1, involved in iron homeostasis, was also modestly upregulated. Furthermore, we observed expression changes in the mitochondrial enzyme ME3 and PENK. In the PD putamen, the most significantly changed gene was GNPDA2. Furthermore, a strong increase in transcriptional levels of adrenomedullin was detected.
Identification of dysregulated gene groups in the PD caudate, putamen and SN
One of the main advantages of global gene expression profiling is the ability to detect concerted changes in functionally related groups of genes. We applied an unbiased FCS approach to identify those GO or KEGG classes that were significantly dysregulated in PD. Also, the average expression change for each gene group was calculated to assess its overall directional change in transcript levels. The FCS calculations identified 75 GO classes and 29 KEGG classes as being differentially expressed in the SN between PD and control. Eight KEGG classes and one GO class were found to be changed in the putamen, and for the caudate nucleus, no statistically significant differences were observed (Table 3).
Table 3.
Altered gene groups in the PD SN and putamen. Gene groups identified by functional class scoring as significantly different (False Discovery Rate‐corrected P‐value < 0.05) between PD and control, based on the microarray data. Class size: the number of genes with a particular GO or KEGG annotation on the array. Fold change: the mean fold change of all group members, as fraction of control levels. Abbreviations: PUT = putamen; PD = Parkinson's disease; SN = substantia nigra pars compacta; GO = Gene Ontology database; KEGG = Kyoto Encyclopedia of Genes and Genomes.
| Identifier | Description | P‐value | Class size | Fold change | Brain area |
|---|---|---|---|---|---|
| Synaptic transmission | |||||
| hsa04540 | Gap junction | 0.0002 | 71 | 0.92 | SN |
| GO:0019717 | Synaptosome | 0.0002 | 17 | 0.66 | SN |
| GO:0007264 | Small GTPase mediated signal transduction | 0.0004 | 149 | 0.94 | SN |
| GO:0045211 | Postsynaptic membrane | 0.0007 | 60 | 0.83 | SN |
| GO:0007268 | Synaptic transmission | 0.0016 | 146 | 0.92 | SN |
| GO:00052161 | Ion channel activity | 0.0016 | 96 | 0.94 | SN |
| GO:0045202 | Synapse | 0.0019 | 34 | 0.80 | SN |
| hsa04530 | Tight junction | 0.0027 | 75 | 1.00 | SN |
| GO:0008021 | Synaptic vesicle | 0.0146 | 33 | 0.79 | SN |
| hsa04540 | Gap junction | 0.0179 | 70 | 0.99 | PUT |
| GO:0006887 | Exocytosis | 0.0247 | 31 | 0.81 | SN |
| GO:0001518 | Voltage‐gated sodium channel complex | 0.0247 | 9 | 0.85 | SN |
| GO:0015075 | Ion transporter activity | 0.0293 | 9 | 1.01 | SN |
| GO:0004890 | GABA‐A receptor activity | 0.0304 | 16 | 0.76 | SN |
| GO:0009966 | Regulation of signal transduction | 0.0304 | 12 | 0.87 | SN |
| GO:0005248 | Voltage‐gated sodium channel activity | 0.0304 | 12 | 0.95 | SN |
| GO:0030426 | Growth cone | 0.0320 | 8 | 0.73 | SN |
| GO:0006814 | Sodium ion transport | 0.0325 | 70 | 0.92 | SN |
| GO:0008503 | Benzodiazepine receptor activity | 0.0331 | 6 | 0.59 | SN |
| GO:0005234 | Glutamate‐gated ion channel activity | 0.0341 | 22 | 0.89 | SN |
| GO:0030424 | Axon | 0.0349 | 8 | 0.76 | SN |
| GO:0006904 | Vesicle docking during exocytosis | 0.0367 | 16 | 0.84 | SN |
| GO:0030594 | Neurotransmitter receptor activity | 0.0393 | 19 | 0.77 | SN |
| GO:0008308 | Voltage‐gated ion‐selective channel activity | 0.0440 | 7 | 0.73 | SN |
| GO:0006836 | Neurotransmitter transport | 0.0440 | 28 | 0.80 | SN |
| hsa04070 | Phosphatidylinositol signaling system | 0.0459 | 71 | 0.95 | SN |
| GO:0017137 | Rab interactor activity | 0.0492 | 15 | 0.86 | SN |
| Energy synthesis | |||||
| hsa00193 | ATP synthesis | 0.0002 | 26 | 0.70 | SN |
| hsa00190 | Oxidative phosphorylation | 0.0002 | 79 | 0.75 | SN |
| GO:0046961 | Hydrogen‐transporting atpase activity, rotational mechanism | 0.0002 | 30 | 0.74 | SN |
| GO:0046933 | Hydrogen‐transporting ATP synthase activity, rotational mechanism | 0.0002 | 29 | 0.75 | SN |
| GO:0015986 | ATP synthesis coupled proton transport | 0.0002 | 31 | 0.75 | SN |
| GO:0016469 | Proton‐transporting two‐sector atpase complex | 0.0002 | 29 | 0.75 | SN |
| hsa00190 | Oxidative phosphorylation | 0.0004 | 79 | 0.91 | PUT |
| GO:0015992 | Proton transport | 0.0007 | 37 | 0.79 | SN |
| GO:0003954 | NADH dehydrogenase activity | 0.0037 | 30 | 0.79 | SN |
| GO:0008137 | NADH dehydrogenase (ubiquinone) activity | 0.0040 | 30 | 0.79 | SN |
| GO:0005743 | Mitochondrial inner membrane | 0.0043 | 58 | 0.86 | SN |
| GO:0005753 | Proton‐transporting ATP synthase complex (sensu Eukaryota) | 0.0095 | 7 | 0.68 | SN |
| GO:0019866 | Inner membrane | 0.0157 | 27 | 0.80 | SN |
| GO:0042623 | Atpase activity, coupled | 0.0247 | 16 | 0.90 | SN |
| GO:0004129 | Cytochrome‐c oxidase activity | 0.0304 | 17 | 0.79 | SN |
| hsa00193 | ATP synthesis | 0.0336 | 26 | 0.90 | PUT |
| GO:0006120 | Mitochondrial electron transport, NADH to ubiquinone | 0.0492 | 19 | 0.81 | SN |
| Cytoskeleton | |||||
| GO:0005874 | Microtubule | 0.0002 | 117 | 0.91 | SN |
| hsa04810 | Regulation of actin cytoskeleton | 0.0026 | 144 | 1.02 | SN |
| GO:0007018 | Microtubule‐based movement | 0.0182 | 52 | 0.86 | SN |
| GO:0003774 | Motor activity | 0.0304 | 64 | 0.99 | SN |
| GO:0000776 | Kinetochore | 0.0319 | 15 | 0.79 | SN |
| GO:0008092 | Cytoskeletal protein binding | 0.0320 | 35 | 1.08 | SN |
| GO:0005875 | Microtubule associated complex | 0.0407 | 46 | 0.93 | SN |
| GO:0000146 | Microfilament motor activity | 0.0444 | 11 | 1.03 | SN |
| GO:0030048 | Actin filament‐based movement | 0.0492 | 13 | 0.96 | SN |
| Metabolism | |||||
| GO:0006096 | Glycolysis | 0.0002 | 35 | 0.82 | SN |
| hsa00710 | Carbon fixation | 0.0086 | 18 | 0.74 | SN |
| hsa00020 | Citrate cycle (TCA cycle) | 0.0086 | 14 | 0.90 | SN |
| hsa00260 | Glycine, serine and threonine metabolism | 0.0106 | 33 | 1.05 | SN |
| hsa00564 | Glycerophospholipid metabolism | 0.0153 | 56 | 0.95 | SN |
| hsa00740 | Riboflavin metabolism | 0.0176 | 11 | 0.88 | SN |
| hsa00330 | Arginine and proline metabolism | 0.0226 | 40 | 1.01 | PUT |
| hsa00220 | Urea cycle and metabolism of amino groups | 0.0336 | 15 | 1.01 | PUT |
| hsa00620 | Pyruvate metabolism | 0.0385 | 35 | 0.86 | SN |
| hsa00720 | Reductive carboxylate cycle (CO2 fixation) | 0.0385 | 7 | 0.89 | SN |
| hsa00910 | Nitrogen metabolism | 0.0409 | 18 | 0.99 | PUT |
| hsa00340 | Histidine metabolism | 0.0417 | 35 | 0.94 | SN |
| hsa00480 | Glutathione metabolism | 0.0417 | 18 | 0.97 | SN |
| hsa00410 | Beta‐Alanine metabolism | 0.0431 | 20 | 0.98 | SN |
| hsa00650 | Butanoate metabolism | 0.0459 | 39 | 0.96 | SN |
| hsa00271 | Methionine metabolism | 0.0459 | 14 | 1.02 | SN |
| hsa00251 | Glutamate metabolism | 0.0476 | 24 | 0.91 | SN |
| Extracellular matrix | |||||
| hsa04512 | ECM‐receptor interaction | 0.0013 | 59 | 1.19 | SN |
| hsa04510 | Focal adhesion | 0.0027 | 143 | 1.09 | SN |
| GO:0005518 | Collagen binding | 0.0060 | 11 | 1.16 | SN |
| hsa04514 | Cell adhesion molecules (cams) | 0.0122 | 84 | 1.10 | SN |
| hsa04510 | Focal adhesion | 0.0179 | 137 | 1.01 | PUT |
| GO:0007160 | Cell‐matrix adhesion | 0.0182 | 48 | 1.12 | SN |
| GO:0005201 | Extracellular matrix structural constituent | 0.0222 | 52 | 1.07 | PUT |
| Neurodegeneration | |||||
| hsa05010 | Alzheimer's disease | 0.0086 | 15 | 0.93 | SN |
| hsa01510 | Neurodegenerative disorders | 0.0102 | 26 | 0.89 | SN |
| hsa05020 | Parkinson's disease | 0.0191 | 14 | 0.77 | SN |
| hsa05040 | Huntington's disease | 0.0459 | 18 | 1.06 | SN |
| Ubiquitin‐proteasome system | |||||
| hsa03050 | Proteasome | 0.0002 | 20 | 0.73 | SN |
| GO:0051082 | Unfolded protein binding | 0.0058 | 114 | 0.90 | SN |
| GO:0005839 | Proteasome core complex (sensu Eukaryota) | 0.0146 | 13 | 0.84 | SN |
| GO:0005838 | Proteasome regulatory particle (sensu Eukaryota) | 0.0325 | 7 | 0.78 | SN |
| GO:0006511 | Ubiquitin‐dependent protein catabolism | 0.0393 | 98 | 0.96 | SN |
| Other | |||||
| GO:0005829 | Cytosol | 0.0002 | 134 | 0.89 | SN |
| GO:0043234 | Protein complex | 0.0002 | 30 | 0.74 | SN |
| GO:0007417 | Central nervous system development | 0.0002 | 68 | 0.95 | SN |
| GO:0005516 | Calmodulin binding | 0.0002 | 110 | 1.00 | SN |
| GO:0003924 | Gtpase activity | 0.0002 | 124 | 0.89 | SN |
| hsa04020 | Calcium signaling pathway | 0.0013 | 129 | 0.97 | SN |
| hsa05110 | Cholera—infection | 0.0016 | 35 | 0.85 | SN |
| GO:0007517 | Muscle development | 0.0020 | 96 | 1.05 | SN |
| GO:0004618 | Phosphoglycerate kinase activity | 0.0022 | 6 | 0.89 | SN |
| GO:0051301 | Cell division | 0.0058 | 115 | 1.01 | SN |
| GO:0005386 | Carrier activity | 0.0070 | 9 | 0.84 | SN |
| GO:0004721 | Phosphoprotein phosphatase activity | 0.0093 | 37 | 0.99 | SN |
| GO:0004298 | Threonine endopeptidase activity | 0.0094 | 14 | 0.82 | SN |
| GO:0030145 | Manganese ion binding | 0.0094 | 84 | 0.99 | SN |
| GO:0045786 | Negative regulation of cell cycle | 0.0157 | 65 | 1.07 | SN |
| GO:0004252 | Serine‐type endopeptidase activity | 0.0157 | 12 | 1.00 | SN |
| GO:0051258 | Protein polymerization | 0.0173 | 16 | 0.68 | SN |
| hsa04110 | Cell cycle | 0.0176 | 82 | 1.01 | SN |
| GO:0004553 | Hydrolase activity, hydrolyzing O‐glycosyl compounds | 0.0247 | 8 | 0.72 | SN |
| GO:0030529 | Ribonucleoprotein complex | 0.0247 | 64 | 1.02 | SN |
| GO:0007420 | Brain development | 0.0269 | 31 | 0.96 | SN |
| GO:0016310 | Phosphorylation | 0.0304 | 10 | 0.84 | SN |
| GO:0003705 | RNA polymerase II transcription factor activity, enhancer binding | 0.0333 | 11 | 1.05 | PUT |
| hsa00280 | Valine, leucine and isoleucine degradation | 0.0336 | 36 | 0.99 | PUT |
| hsa00970 | Aminoacyl‐trna synthetases | 0.0385 | 27 | 0.84 | SN |
| GO:0008020 | G‐protein coupled photoreceptor activity | 0.0444 | 6 | 0.80 | SN |
| GO:0006821 | Chloride transport | 0.0444 | 32 | 0.93 | SN |
| GO:0004176 | ATP‐dependent peptidase activity | 0.0451 | 7 | 0.71 | SN |
| hsa00770 | Pantothenate and coa biosynthesis | 0.0457 | 17 | 0.95 | SN |
| hsa00290 | Valine, leucine and isoleucine biosynthesis | 0.0459 | 9 | 0.90 | SN |
| hsa04910 | Insulin signaling pathway | 0.0459 | 97 | 0.94 | SN |
| hsa00960 | Alkaloid biosynthesis II | 0.0496 | 14 | 1.06 | SN |
Alterations in gene groups involved in synaptic transmission in the PD SN
Many gene groups related to synaptic transmission are compromised in the PD SN. For example, the average transcriptional activity of the 17 genes annotated as “synaptosome” (GO:0019717) was reduced to 66% of control levels. Similar changes were detected for, among others, the classes “synapse” (GO:0045202), “long‐term potentiation” (hsa04720) and “long‐term depression” (hsa04730). The average reduction of gene expression in synaptic transmission‐related gene groups in PD was 15%. Although this seems a relatively mild change in expression levels, one should take into account that affected gene groups contain both changed and unchanged genes: the range of transcriptional changes runs up to a 77% reduction (SYT1). Related to lowered synaptic transmission in the SN, a dysregulation of “gap junction” (hsa04540) was detected in the putamen.
Reduction of gene groups involved in oxidative phosphorylation in PD SN and putamen
We observed a strong reduction in transcriptional levels of gene groups involved in oxidative phosphorylation and ATP synthesis in the PD SN. This was reflected, among others, by the dowregulation of the KEGG classes “oxidative phosphorylation” (hsa00190) and “ATP synthesis” (hsa00193), and the GO classes “ATP synthesis coupled proton transport” (GO:0015986) and “NADH dehydrogenase activity” (GO:0003954). Average transcript levels for these gene groups were reduced to ∼70% of control. Interestingly, we also detected a reduction of the KEGG gene groups “oxidative phosphorylation” and “ATP synthesis” in the putamen (∼90% of control levels). Additionally, a number of GO classes involved in oxidative phosphorylation showed a downward trend in the putamen (P < 0.08, data not shown).
Downregulation of ubiquitin‐proteasome gene groups in PD SN
The ubiquitin‐proteasome system (UPS) is dysregulated in PD. We observed a downregulation of the classes “proteasome” (hsa03050), “unfolded protein binding” (GO:0051082), “proteasome core complex (sensu Eukaryota)” (GO:0005839), “proteasome regulatory particle (sensu Eukaryota)” (GO:0005838) and “ubiquitin‐dependent protein catabolism” (GO:0006511). Average transcript levels for these groups were reduced by 15%.
Alterations in gene groups encoding for proteins involved in cytoskeletal structure and microtubule‐based transport in PD SN
Noteworthy is the dysregulation of gene groups involved in cytoskeletal structure and microtubule‐based transport in the PD SN. Some groups were downregulated, such as “microtubule‐based movement” (GO:0007018), whereas we observed an increased average expression of transcripts belonging to “cytoskeletal protein binding” (GO:0008092). Possibly related to this, the gene groups “axon guidance” (hsa04360) and “growth cone” (GO:0030426) were also changed in the PD SN.
Other gene group changes in PD
A transcriptional upregulation (average expression increase of ∼10% over control levels) in the PD SN was found for extracellular matrix (ECM) protein groups such as “collagen binding” (GO:0005518) and “ECM‐receptor interaction” (hsa04512). In the putamen, a similar increase was found for the group “extracellular matrix structural constituent” (GO:0005201). Finally, we report expression changes in the gene groups “Parkinson's disease” (hsa05020), “Alzheimer's disease” (hsa05010) and “neurodegenerative disorders” (hsa01510) in the SN of PD patients.
Cell density measurements
The most typical and striking neuropathological feature of PD is the loss of neuromelanin‐positive neurons from the SN. It is estimated that around 80% of the DAergic neurons in the SN are lost in the end stages of PD (73). We and others found that DAergic neurons that are still present in end‐stage PD tend to appear in clusters (18). We performed cell countings, in order to estimate neuronal densities in the relatively spared parts of the PD SN and in the control SN, on tissue sections of the contralateral SN of the seven PD subjects and eight controls used in the qPCR and microarray experiments. We distinguished large neuromelanin‐positive neuronal profiles and large neuromelanin‐negative neuronal profiles. The number of small neuromelanin‐negative structures was negligible. We observed a significant decrease of 51% in neuromelanin‐positive profiles in the PD SN (Mann‐Whitney U test, P = 0.015) relative to control. Surprisingly, we measured a relative increase of 104% in PD neuromelanin‐negative neurons (Mann‐Whitney U test, P = 0.049). Overall, the relative total neuronal density was estimated to be decreased by 29% in PD as compared with control (Mann‐Whitney U test, P = 0.037) (Figure 4).
Figure 4.

Changes in relative density of neuronal structures in the PD SN. Estimated neuronal densities relative to the average total densities of control, of large neurons in the relatively spared parts of the PD SN that were used in the present study (n = 7), and control SN (n = 8). A distinction was made between neuromelanin‐positive (pigmented) and neuromelanin‐negative (nonpigmented) neurons. Note the relative increase in neuromelanin‐negative neurons in PD, and the rather mild decrease in total neuronal density in the sampled areas of the PD SN. *Mann‐Whitney U test P‐value < 0.05. Abbreviations: PD = Parkinson's disease; SN = substantia nigra pars compacta.
DISCUSSION
To our knowledge, this is the first study to examine global changes in gene expression in relatively spared areas of the PD SN. Cell counting experiment enabled us to relate the microarray data to the degree of neuronal loss. We observed a moderate decrease in total neuronal density of 29% in the sampled part of the PD SN. Subpopulations of the SN are differentially vulnerable in PD. For example, the lateral and dorsal parts of the SN show a 21% and 57% loss of DAergic neurons respectively, whereas the pars compacta is more severely affected, with a decrease of 86% (18). Although differentially affected, all areas of the PD SN do exhibit cell loss during disease progression. Thus, gene expression measurements from less affected parts of the PD SN might provide insight in the molecular biological processes leading to neuronal degeneration in PD. Transcriptional alterations that occur before massive neuronal demise has taken place might represent early, causative molecular changes instead of events that are the consequence of the disease process. The observed 51% decrease in neuromelanin‐positive neurons in the SN in combination with a 104% increase in neuromelanin‐negative neurons shows that many neurons are still present, but are in the process of losing their neuromelanin content, which also explains the presence of extracellular neuromelanin granules in the PD neuropil. The observed decrease (29%) in total neuronal density in the PD SN is a confounding factor for the interpretation of gene expression data. The downregulation of a neuron‐specific transcript by 29% might be explained fully by the loss of neurons. It is thus noteworthy that all of the 240 genes significantly downregulated in the PD SN are reduced by more than 29%, and 149 genes by more than 50%. Moreover, the downregulation of the neuron‐specific transcript NURR1 by 82%, when correcting for the loss of neurons, still translates to a 58% reduction per neuron. Therefore, the observed changes in gene expression are possibly relevant for PD pathogenesis and cannot simply be explained by a loss of DAergic neurons. In apparent contrast, the average downregulation for the most significantly altered gene groups in our study usually does not exceed 29%. However, the mean expression of each gene group is calculated by averaging the expression values for all group members. Therefore, transcripts that are not altered in PD contribute to the gene group expression value, effectively underestimating the “true” transcriptional downregulation for the changed group members. For example, NURR1 is decreased by 82%, whereas the total decrease of the gene group “neurodegenerative disorders” (hsa01510) is 18%. We cannot exclude the possibility that changes in the expression of some genes in particular gene groups are caused by the loss of DAergic neurons, and do not represent PD‐specific transcriptional alterations in DAergic neurons. However, the observation of significant changes in multiple members of a specific gene group provides strong evidence for alterations in the processes in which these genes function.
Whole‐tissue expression studies possibly provide insights into disease mechanisms that would have been missed in a study on DAergic neurons alone. For example, in PD animal models, reactive astrocytes have an essential role in the trophic support of DAergic neurons by secreting neurotrophic factors such as GDNF and NGF 55, 56), and metabolizing potentially harmful extracellular DA by expression of MAOB and COMT. Interestingly, we observed a 50% increase in COMT expression in the PD SN. PD‐induced death of DAergic neurons should therefore be regarded as a disease of the entire SN, not only of the neurons.
It must be noted that we cannot exclude the possible confounding influence of DA replacement therapies on the observed transcriptional alterations between the PD and control, both on the level of the striatum, and the SN. This is, however, a limitation that is likely to be present in all studies comparing gene and protein expression between the PD and control brain.
Gene group changes in the PD SN
We detected significant alterations in several gene groups, notably those involved in oxidative phosphorylation, synaptic transmission, microtubular dynamics and microtubular‐based transport, and the UPS. The reduced levels of transcripts involved in synaptic transmission and ATP synthesis, combined with lowered expression levels of individual genes involved in DA transmission such as VMAT2 and TH, all point to a functionally compromised tissue. This corroborates the idea that the SN in PD is unable to provide sufficient levels of DA to the striatum. Adding to that, the reduced capacity of targeted protein degradation might underlie the formation of Lewy bodies and Lewy neurites 33, 60). Thus, the observed alterations in specific gene groups are consistent with the neuropathological manifestations of PD.
Several of the observed gene group changes are in line with current literature on PD. Mitochondrial dysfunction has long been implicated in PD neuropathology. Two other gene expression studies on the PD SN report reductions in ATP synthesis 30, 81). In the prefrontal cortex of PD patients, mitochondrial complex I subunits are oxidatively damaged and functionally impaired (38). Together with findings on mitochondrial complex I inhibition by rotenone and MPTP, and mutations in genes linked to oxidative phosphorylation, including DJ‐1 and PINK1, there is strong evidence for mitochondrial involvement in PD pathogenesis. Importantly, as we selectively investigated spared parts of the SN, mitochondrial alterations appear to play a role in the relatively early stages of DAergic neurodegeneration.
The severe reductions in synaptic transmission corroborate the microarray studies of Grunblatt et al and Miller et al (52), but now in an area of the SN where a significant number of DAergic neurons has survived. This makes it likely that synaptic transmission is decreased in SN neurons that are still present. Also, SNCA, reduced in the PD SN in our study and in a study by Kingsbury et al as determined by in situ hybridization (39), is thought to play a role in neurotransmission (45). It was recently shown that presynaptic aggregates of SNCA cause neurodegeneration in dementia with Lewy bodies (41). One explanation of the observed reduction might be that the surviving neurons in PD express lower levels of SNCA, making them less vulnerable to SNCA‐induced neurotoxicity.
Finally, the occurrence of protein aggregates suggests involvement of protein degradation pathways in PD neuropathology. We indeed observed reduced levels of transcripts of the UPS in surviving areas of the SN PD. Earlier studies also have shown alterations in proteasomal function within DAergic neurons in the SN in the end stage of PD (51). Duke et al reported on an overall loss of genes encoding for UPS proteins, which was correlated with expression of mitochondrial gene groups (25). In that and our own study, UCHL1 was found to be significantly decreased. UCHL1 is responsible for converting polyubiquitin chains into monomeric ubiquitin molecules. When UCHL1 levels are reduced, the available pool of ubiquitin might become too small to meet the demand for UPS‐mediated protein degradation. Indeed, reduced UPS activity leads to a familial form of PD, and mice expressing the mutant form of UCHL1 show DAergic neuron loss 69, 78).
In addition to UCHL1, several of the observed significant single gene changes are in agreement with previous reports. Examples of these genes include GBE1, SYT1, VMAT2, DSCR1L1 and ALDH1A1 30, 52, 81). There are striking similarities between the single gene and gene group alterations found in this study, literature on sporadic and familial end stage PD, and PD animal model systems. These studies have however not specifically targeted the spared parts of the PD SN. We therefore suggest that the observed alterations are already implicated before massive neuronal loss.
It is noteworthy to address the potential regulation of genes known to be involved in familial PD. Apart from the previously mentioned alterations in SCNA and UCHL1 levels, other genes implicated in familial PD could not be shown to be changed in expression: the expression of PARK2 was too low to be reliably measured, DJ‐1 is reduced by 30% (but this reduction is not statistically significant), PINK1 is not regulated, and a probe for LRRK2 was not present on the array (data not shown). Based on this experiment, it is difficult to draw definitive conclusions on the involvement of the aforementioned genes in sporadic PD, however, other genome‐wide expression studies do not report changes in the expression level of these genes either 30, 52, 81). This does not imply that the biological pathways in which familial PD genes play a role are not important in sporadic PD. For example, aggregation of aberrant proteins is a key feature of sporadic PD (33), and UCHL1 and PARK2 are both involved in protein (de)ubiquitination.
Reduction of neurotrophic support and microtubular alterations in PD
We identified a number of novel single gene changes that are possibly involved in PD pathogenesis. Several genes implicated in neurotrophic support display altered expression. Neurotrophic factors, including BDNF, are reduced in PD, and the role of neurotrophic factors in animal models for PD has been studied extensively [reviewed in (20), (40) and (72)]. GDNF is an important factor in the development and survival of mesencephalic DAergic neurons, and protects DAergic neurons against MPTP‐induced neurotoxic stress 14, 42). We observed reductions in the expression of RIT2, DLK1, NDN, MAGEE1 and DOK6, all involved in neurotrophic signaling 15, 17, 42, 43, 44, 70). DLK1 is strongly coupled to both TH expression and neurotrophic signaling. Silencing of DLK1 causes a reduction in TH and VMAT2 expression (4), and influences the GDNF pathway by a reduction in Ret expression (15). Furthermore, we observed an increase in transcript levels of PHLPP, an inhibitor of Trk signaling by dephosphorylating Akt (28). Interestingly, both NDN and MAGEE1 are located in the chromosomal region deleted in Prader‐Willi syndrome, and mouse models with a deleted paternal copy of the NDN gene show increased apoptosis in NGF‐dependent neurons (44). It might therefore be of interest to study the SN in the aging Prader‐Willi population.
Altered expression of TrkB isoforms is further evidence for a decrease in neurotrophic support in the PD SN. TrkB‐T1, the truncated isoform of the TrkB receptor, functions as a dominant‐negative receptor variant. Interestingly, haploinsufficiency for TrkB and TrkC results in cell loss and accumulation of SNCA in the SN of aged mice (8), and increased levels of TrkB‐T1 expression are known to be associated with neuronal atrophy and death 23, 24). We observed a shift in the ratio TrkB‐T1/TrkB toward more TrkB‐T1 (Figure 2).
Adding to alterations in neurotrophic support, we also observed transcriptional evidence for changes in the endocytosis of activated receptors. AMPH, DNM3, NECAP‐1 and AAK1 are all downregulated, and serve important roles in regulating endocytosis either by interacting with AP‐2 (AAK1 and NECAP‐1) 65, 66), by coupling the PSD to the endocytic zone (DNM3) (48), or by sensing and inducing membrane curvature (AMPH) (31). Interestingly, HIP1R is known to prolong the half‐life of growth factor receptors after endocytosis (35), and is increased in expression. STS‐1, a gene that negatively regulates the endocytosis of receptor tyrosine kinases, is downregulated in PD (64). The regulation of STS‐1 and HIP1R might thus represent a coping mechanism of neurons suffering from reduced neurotrophic support in this disorder. Another transcriptional alteration potentially affecting neurotrophic signaling is the severe decrease of DYNC1I1, a component of the dynein motor complex responsible for retrograde transport of activated Trk receptors (6). Altered expression levels of several gene groups involved in microtubule‐based transport may point to a more general impairment of axoplasmic transport. These simultaneous alterations in transcripts encoding for proteins involved in neurotrophic support and signaling all suggest decreased levels of neurotrophic signaling, possibly directly underlying DAergic neuronal degeneration and death in PD.
Alterations in the expression of genes encoding repulsive axon guidance and outgrowth cues in the PD SN
We observed transcriptional evidence for the involvement of axon guidance molecules in SN PD neuropathology. The role of axon guidance cues in the development of the nervous system has been long appreciated, but recently, they are also believed to be functionally relevant in the adult nervous system. Axon guidance cues might play a role in synaptic plasticity and neurodegeneration 22, 49). Increased expression of the chemorepulsive protein Sema3A or the neurite outgrowth inhibitor Nogo‐A promotes denervation in a model for amyotrophic lateral sclerosis 21, 36), and Sema3A is increased in the cerebellum in schizophrenia (26). In the PD SN, we observed a twofold increase in RGMA expression. RGMA is a membrane‐bound glycoprotein implicated in axon guidance and neural tube closure during development (57). After human brain injury, RGMA expression is enhanced (68). We also observed changes in the expression of SDC2, a member of the heparan sulphate proteoglycan (HSPG) family of extracellular matrix proteins. Some axon guidance molecules bind to HSPGs, and this modulates their repulsive properties. When the axon guidance protein Sema5A binds to the HSPG SDC3, it acts as an axon attractant, and when Sema5A is bound to chondroitin sulphate proteoglycans, it converts to a chemorepulsive protein (37). Thus, the decreased expression of SDC2 might suggest a shift to a more repulsive character of the extracellular matrix. This effect is possibly aggravated by the upregulation of Sema5A in a subset of patients (Supplementary Table S4). An association between Sema5A polymorphisms and PD has been reported, although studies trying to replicate this in different populations were not successful 7, 16, 50). The 68% decrease of ROBO2 expression also suggests a change in axon guidance cue signaling in PD. ROBO2 is the receptor for Slit2, which regulates the outgrowth of developing midbrain DAergic neurons via the ROBO receptors (47). Also noteworthy are the reductions in SLITRK5 and NETO2, which are thought to play a role in axon guidance and outgrowth.
Taken together, transcriptional alterations of multiple genes involved in axon guidance and neurite outgrowth suggest an altered and possibly more chemorepulsive environment around DAergic neurons. Indeed, a recent SNP analysis of axon guidance pathways also implicated these pathways in PD (46). Changes in chemorepulsive signaling might contribute to the loss of synaptic contacts between DAergic neurons, ultimately leading to DAergic cell loss.
Expression changes in the caudate nucleus and putamen
We did not observe large alterations in gene expression in the putamen and caudate nucleus, which may result from the very stringent Bonferroni multiple‐testing correction method applied (to eliminate potential false positives), and/or the DA replacement therapies that all PD patients received during the disease course. We detected several noteworthy changes in gene expression that are apparently not prevented by the DA replacement therapies. Remarkable is the increase of LTF expression in the PD caudate nucleus and SN. LTF is not only involved in iron homeostasis, but also has cell growth and differentiation properties (77). The neuromelanin in SN DAergic neurons contains high levels of iron. Together with the observation that surviving neurons might lose their neuromelanin, the upregulation of LTF is indicative for increased cytosolic and synaptic iron levels. Indeed, increased iron levels are observed in surviving neurons in the PD SN, and raise oxidative stress levels in SN DAergic neurons 58, 80). Furthermore, in our study, CYBRD1, mutated in some iron overload disorders (79), is also upregulated in the caudate nucleus. Thus, increased iron loads in the striatum and SN might contribute to PD‐associated neurodegeneration.
Complex interactions between multiple insults underlie SN DAergic neurons degeneration
Our microarray data point to the impairment in neurotrophic signaling pathways and retrograde transport in PD pathogenesis, and to the involvement of molecules regulating axon guidance and neurite outgrowth. These changes might interact with deleterious processes already recognized to be involved in the etiology of sporadic PD, including mitochondrial dysfunction, reduction of synaptic transmission and impairment of the UPS. Importantly, genes encoding for proteins involved in these processes were also found to be affected in our study. In a recent review, a multiple hit hypothesis for SN DAergic degeneration was proposed, in which neuronal death only occurs after several cellular processes have been compromised (73).
We hypothesize that complex interactions between altered processes such as loss of neurotrophic support and mitochondrial dysfunction together constitute the unique conditions in which SN DAergic neurons are prone to degenerate in PD. It is important to note that our study does not provide insight in the exact sequence of events ultimately leading to SN DA neuronal demise in PD. We propose the following model. Impairment of several neurotrophic support pathways reduces the viability of DAergic neurons. In conjuction, alterations in expression of axon guidance cues exert a negative influence on the synapses of SN DAergic neurons. As synaptic transmission is dependent on viable synaptic contacts, changes in neurotrophic support and axon guidance cue signaling negatively affect DA transmission to the striatum. The reduction of neurotrophic support is aggravated by the disturbance of microtubule‐based transport, which impairs the retrograde transport of activated Trk receptors necessary for neurotrophic signaling. In parallel, mitochondrial dysfunction leads to lower levels of available ATP. As SN DAergic neurons are metabolically more active than their VTA counterparts (29), the greater energy demands might make SN DAergic neurons more vulnerable to metabolic insults. Furthermore, as UPS‐mediated protein degradation is ATP‐dependent, a reduction in oxidative phosphorylation likely negatively affects the cell's capacity to break down proteins, with proteinacious inclusions as a result. The observation that some surviving neurons lose their neuromelanin content, possibly leads to increased iron contents in the SN, and, via the nigrostriatal pathway, in the striatum. This increased iron load raises oxidative stress levels. Finally, the severe reduction of VMAT2 levels causes insufficient packaging of DA in DA vesicles, effectively increasing cytosolic DA concentrations, which also induces oxidative stress. Taken together, this model describes a complex interaction between seemingly unrelated, but most likely intimately related intra‐ and extracellular events, which together lead to selective DAergic vulnerability in PD.
The purpose of this study was to identify genes and gene classes that may be functionally linked to PD neurodegeneration. We have not as yet demonstrated the biological significance of the presented alterations: our observations are predictive of the role of specific molecules and pathways in the process of PD neurodegeneration. Therefore, the challenge for the future lies in the translation of the current findings to functional studies in cellular and animal models of PD.
FUNDING
Royal Dutch Academy of Sciences, Innovation Fund; Solvay Pharmaceuticals.
Supporting information
Table S1. Hybridization setup microarray experiments.
Table S2. qPCR primer sequences.
Table S3. Significantly altered genes in the PD SN.
Table S4. qPCR validation of changed transcripts in the PD SN.
This material is available as part of the online article from: http://www.blackwellsynergy.com
Please note: Blackwell Publishing is not responsible for the content or functionality of any supplementary materials supplied by the authors. Any queries (other than missing material) should be directed to the corresponding author for the article.
Supporting info item
Supporting info item
Supporting info item
Supporting info item
ACKNOWLEDGMENTS
The authors like to thank Anke Essing for technical support, and the Netherlands Brain Bank for providing excellent human brain material and support. The authors also would like to acknowledge the valuable discussion on the work described in this paper with Pieter Houba and Claudia Thaete (Solvay Pharmaceuticals), Peter Burbach, Marten Smidt and Jeroen Pasterkamp (Rudolf Magnus Institute for Neuroscience, Utrecht), Guus Smit (Vrije Universiteit, Amsterdam) and Asia Korecka and Elly Hol (Netherlands Institute for Neuroscience, Amsterdam).
REFERENCES
- 1. Albrecht DE, Froehner SC (2004) DAMAGE, a novel alpha‐dystrobrevin‐associated MAGE protein in dystrophin complexes. J Biol Chem 279:7014–7023. [DOI] [PubMed] [Google Scholar]
- 2. Ashburner M, Ball CA, Blake JA, Botstein D, Butler H, Cherry JM et al (2000) Gene ontology: tool for the unification of biology. The Gene Ontology Consortium. Nat Genet 25:25–29. [DOI] [PMC free article] [PubMed] [Google Scholar]
- 3. Bao AM, Hestiantoro A, Van Someren EJ, Swaab DF, Zhou JN (2005) Colocalization of corticotropin‐releasing hormone and oestrogen receptor‐alpha in the paraventricular nucleus of the hypothalamus in mood disorders. Brain 128:1301–1313. [DOI] [PubMed] [Google Scholar]
- 4. Bauer M, Meixner A, Ueffing M (2005) Investigation of developmental and disease‐related genes in primary neuronal systems using lenti‐viral vector‐based technology, NGFN, Bonn, Germany. [Google Scholar]
- 5. Bernheimer H, Birkmayer W, Hornykiewicz O, Jellinger K, Seitelberger F (1973) Brain dopamine and the syndromes of Parkinson and Huntington. Clinical, morphological and neurochemical correlations. J Neurol Sci 20:415–455. [DOI] [PubMed] [Google Scholar]
- 6. Bhattacharyya A, Watson FL, Pomeroy SL, Zhang YZ, Stiles CD, Segal RA (2002) High‐resolution imaging demonstrates dynein‐based vesicular transport of activated Trk receptors. J Neurobiol 51:302–312. [DOI] [PubMed] [Google Scholar]
- 7. Bialecka M, Kurzawski M, Klodowska‐Duda G, Opala G, Tan EK, Drozdzik M (2006) Polymorphism in semaphorin 5A (Sema5A) gene is not a marker of Parkinson's disease risk. Neurosci Lett 399:121–123. [DOI] [PubMed] [Google Scholar]
- 8. Von Bohlen und Halbach O, Minichiello L, Unsicker K (2005) Haploinsufficiency for trkB and trkC receptors induces cell loss and accumulation of alpha‐synuclein in the substantia nigra. FASEB J 19:1740–1742. [DOI] [PubMed] [Google Scholar]
- 9. Bove J, Prou D, Perier C, Przedborski S (2005) Toxin‐induced models of Parkinson's disease. NeuroRx 2:484–494. [DOI] [PMC free article] [PubMed] [Google Scholar]
- 10. Braak H, Braak E (1991) Neuropathological stageing of Alzheimer‐related changes. Acta Neuropathol (Berl) 82:239– 259. [DOI] [PubMed] [Google Scholar]
- 11. Braak H, Del Tredici K, Rub U, De Vos RA, Jansen Steur EN, Braak E (2003) Staging of brain pathology related to sporadic Parkinson's disease. Neurobiol Aging 24:197–211. [DOI] [PubMed] [Google Scholar]
- 12. Cammermeyer J (1967) Artifactual displacement of neuronal nucleoli in paraffin sections. J Hirnforsch 9:209–224. [PubMed] [Google Scholar]
- 13. Chandra S, Gallardo G, Fernandez‐Chacon R, Schluter OM, Sudhof TC (2005) Alpha‐synuclein cooperates with CSPalpha in preventing neurodegeneration. Cell 123:383–396. [DOI] [PubMed] [Google Scholar]
- 14. Cheng FC, Ni DR, Wu MC, Kuo JS, Chia LG (1998) Glial cell line‐derived neurotrophic factor protects against 1‐methyl‐4‐phenyl‐1,2,3,6‐tetrahydropyridine (MPTP)‐induced neurotoxicity in C57BL/6 mice. Neurosci Lett 252:87–90. [DOI] [PubMed] [Google Scholar]
- 15. Christophersen NS, Gronborg M, Petersen TN, Fjord‐Larsen L, Jorgensen JR, Juliusson B et al (2007) Midbrain expression of Delta‐like 1 homologue is regulated by GDNF and is associated with dopaminergic differentiation. Exp Neurol 204:791–801. [DOI] [PubMed] [Google Scholar]
- 16. Clarimon J, Scholz S, Fung HC, Hardy J, Eerola J, Hellstrom O et al (2006) Conflicting results regarding the semaphorin gene (SEMA5A) and the risk for Parkinson disease. Am J Hum Genet 78:1082–1084. [DOI] [PMC free article] [PubMed] [Google Scholar]
- 17. Crowder RJ, Enomoto H, Yang M, Johnson EM, Jr ., Milbrandt J (2004) Dok‐6, a Novel p62 Dok family member, promotes Ret‐mediated neurite outgrowth. J Biol Chem 279:42072–42081. [DOI] [PubMed] [Google Scholar]
- 18. Damier P, Hirsch EC, Agid Y, Graybiel AM (1999) The substantia nigra of the human brain. II. Patterns of loss of dopamine‐containing neurons in Parkinson's disease. Brain 122:1437–1448. [DOI] [PubMed] [Google Scholar]
- 19. Dauer W, Przedborski S (2003) Parkinson's disease: mechanisms and models. Neuron 39:889–909. [DOI] [PubMed] [Google Scholar]
- 20. Dawbarn D, Allen SJ (2003) Neurotrophins and neurodegeneration. Neuropathol Appl Neurobiol 29:211–230. [DOI] [PubMed] [Google Scholar]
- 21. De Winter F, Vo T, Stam FJ, Wisman LA, Bar PR, Niclou SP et al (2006) The expression of the chemorepellent Semaphorin 3A is selectively induced in terminal Schwann cells of a subset of neuromuscular synapses that display limited anatomical plasticity and enhanced vulnerability in motor neuron disease. Mol Cell Neurosci 32:102–117. [DOI] [PubMed] [Google Scholar]
- 22. De Wit J, Verhaagen J (2003) Role of semaphorins in the adult nervous system. Prog Neurobiol 71:249–267. [DOI] [PubMed] [Google Scholar]
- 23. De Wit J, Eggers R, Evers R, Castren E, Verhaagen J (2006) Long‐term adeno‐associated viral vector‐mediated expression of truncated TrkB in the adult rat facial nucleus results in motor neuron degeneration. J Neurosci 26:1516–1530. [DOI] [PMC free article] [PubMed] [Google Scholar]
- 24. Dorsey SG, Renn CL, Carim‐Todd L, Barrick CA, Bambrick L, Krueger BK et al (2006) In vivo restoration of physiological levels of truncated TrkB.T1 receptor rescues neuronal cell death in a trisomic mouse model. Neuron 51:21–28. [DOI] [PubMed] [Google Scholar]
- 25. Duke DC, Moran LB, Kalaitzakis ME, Deprez M, Dexter DT, Pearce RK, Graeber MB (2006) Transcriptome analysis reveals link between proteasomal and mitochondrial pathways in Parkinson's disease. Neurogenetics 7:139–148. [DOI] [PubMed] [Google Scholar]
- 26. Eastwood SL, Law AJ, Everall IP, Harrison PJ (2003) The axonal chemorepellant semaphorin 3A is increased in the cerebellum in schizophrenia and may contribute to its synaptic pathology. Mol Psychiatry 8:148–155. [DOI] [PubMed] [Google Scholar]
- 27. Forno LS (1996) Neuropathology of Parkinson's disease. J Neuropathol Exp Neurol 55:259–272. [DOI] [PubMed] [Google Scholar]
- 28. Gao T, Furnari F, Newton AC (2005) PHLPP: a phosphatase that directly dephosphorylates Akt, promotes apoptosis, and suppresses tumor growth. Mol Cell 18:13–24. [DOI] [PubMed] [Google Scholar]
- 29. Greene JG, Dingledine R, Greenamyre JT (2005) Gene expression profiling of rat midbrain dopamine neurons: implications for selective vulnerability in parkinsonism. Neurobiol Dis 18:19–31. [DOI] [PubMed] [Google Scholar]
- 30. Grunblatt E, Mandel S, Jacob‐Hirsch J, Zeligson S, Amariglo N, Rechavi G et al (2004) Gene expression profiling of parkinsonian substantia nigra pars compacta; alterations in ubiquitin‐proteasome, heat shock protein, iron and oxidative stress regulated proteins, cell adhesion/cellular matrix and vesicle trafficking genes. J Neural Transm 111:1543–1573. [DOI] [PubMed] [Google Scholar]
- 31. Habermann B (2004) The BAR‐domain family of proteins: a case of bending and binding? EMBO Rep 5:250–255. [DOI] [PMC free article] [PubMed] [Google Scholar]
- 32. Hardy J, Cai H, Cookson MR, Gwinn‐Hardy K, Singleton A (2006) Genetics of Parkinson's disease and parkinsonism. Ann Neurol 60:389–398. [DOI] [PubMed] [Google Scholar]
- 33. Hol EM, Van Leeuwen FW, Fischer DF (2005) The proteasome in Alzheimer's disease and Parkinson's disease: lessons from ubiquitin B + 1. Trends Mol Med 11:488–495. [DOI] [PubMed] [Google Scholar]
- 34. Huitinga I, Van Der CM, Salm L, Erkut Z, Van Dam A, Tilders F, Swaab D (2000) IL‐1beta immunoreactive neurons in the human hypothalamus: reduced numbers in multiple sclerosis. J Neuroimmunol 107:8–20. [DOI] [PubMed] [Google Scholar]
- 35. Hyun TS, Rao DS, Saint‐Dic D, Michael LE, Kumar PD, Bradley SV et al (2004) HIP1 and HIP1r stabilize receptor tyrosine kinases and bind 3‐phosphoinositides via epsin N‐terminal homology domains. J Biol Chem 279:14294–14306. [DOI] [PubMed] [Google Scholar]
- 36. Jokic N, Gonzalez de Aguilar JL, Dimou L, Lin S, Fergani A, Ruegg MA et al (2006) The neurite outgrowth inhibitor Nogo‐A promotes denervation in an amyotrophic lateral sclerosis model. EMBO Rep 7:1162–1167. [DOI] [PMC free article] [PubMed] [Google Scholar]
- 37. Kantor DB, Chivatakarn O, Peer KL, Oster SF, Inatani M, Hansen MJ et al (2004) Semaphorin 5A is a bifunctional axon guidance cue regulated by heparan and chondroitin sulfate proteoglycans. Neuron 44:961–975. [DOI] [PubMed] [Google Scholar]
- 38. Keeney PM, Xie J, Capaldi RA, Bennett JP, Jr . (2006) Parkinson's disease brain mitochondrial complex I has oxidatively damaged subunits and is functionally impaired and misassembled. J Neurosci 26:5256–5264. [DOI] [PMC free article] [PubMed] [Google Scholar]
- 39. Kingsbury AE, Daniel SE, Sangha H, Eisen S, Lees AJ, Foster OJ (2004) Alteration in alpha‐synuclein mRNA expression in Parkinson's disease. Mov Disord 19:162–170. [DOI] [PubMed] [Google Scholar]
- 40. Kirik D, Georgievska B, Bjorklund A (2004) Localized striatal delivery of GDNF as a treatment for Parkinson disease. Nat Neurosci 7:105–110. [DOI] [PubMed] [Google Scholar]
- 41. Kramer ML, Schulz‐Schaeffer WJ (2007) Presynaptic alpha‐synuclein aggregates, not Lewy bodies, cause neurodegeneration in dementia with Lewy bodies. J Neurosci 27:1405–1410. [DOI] [PMC free article] [PubMed] [Google Scholar]
- 42. Kramer ER, Aron L, Ramakers GM, Seitz S, Zhuang X, Beyer K et al (2007) Absence of Ret signaling in mice causes progressive and late degeneration of the nigrostriatal system. PLoS Biol 5:e39 doi:10.1371/journal.pbio.0050039 [DOI] [PMC free article] [PubMed] [Google Scholar]
- 43. Kurita M, Kuwajima T, Nishimura I, Yoshikawa K (2006) Necdin downregulates CDC2 expression to attenuate neuronal apoptosis. J Neurosci 26:12003–12013. [DOI] [PMC free article] [PubMed] [Google Scholar]
- 44. Kuwako K, Hosokawa A, Nishimura I, Uetsuki T, Yamada M, Nada S et al (2005) Disruption of the paternal necdin gene diminishes TrkA signaling for sensory neuron survival. J Neurosci 25: 7090–7099. [DOI] [PMC free article] [PubMed] [Google Scholar]
- 45. Larsen KE, Schmitz Y, Troyer MD, Mosharov E, Dietrich P, Quazi AZ et al (2006) Alpha‐synuclein overexpression in PC12 and chromaffin cells impairs catecholamine release by interfering with a late step in exocytosis. J Neurosci 26:11915–11922. [DOI] [PMC free article] [PubMed] [Google Scholar]
- 46. Lesnick TG, Papapetropoulos S, Mash DC, Ffrench‐Mullen J, Shehadeh L, De Andrade M et al (2007) A genomic pathway approach to a complex disease: axon guidance and Parkinson disease. PLoS Genet 3:e98 doi:10.1371/journal.pgen.0030098 [DOI] [PMC free article] [PubMed] [Google Scholar]
- 47. Lin L, Rao Y, Isacson O (2005) Netrin‐1 and slit‐2 regulate and direct neurite growth of ventral midbrain dopaminergic neurons. Mol Cell Neurosci 28:547–555. [DOI] [PubMed] [Google Scholar]
- 48. Lu J, Helton TD, Blanpied TA, Racz B, Newpher TM, Weinberg RJ, Ehlers MD (2007) Postsynaptic positioning of endocytic zones and AMPA receptor cycling by physical coupling of dynamin‐3 to Homer. Neuron 55:874–889. [DOI] [PMC free article] [PubMed] [Google Scholar]
- 49. Mann F, Chauvet S, Rougon G (2007) Semaphorins in development and adult brain: implication for neurological diseases. Prog Neurobiol 82:57–79. [DOI] [PubMed] [Google Scholar]
- 50. Maraganore DM, De Andrade M, Lesnick TG, Strain KJ, Farrer MJ, Rocca WA et al (2005) High‐resolution whole‐genome association study of Parkinson disease. Am J Hum Genet 77:685–693. [DOI] [PMC free article] [PubMed] [Google Scholar]
- 51. McNaught KS, Belizaire R, Isacson O, Jenner P, Olanow CW (2003) Altered proteasomal function in sporadic Parkinson's disease. Exp Neurol 179:38–46. [DOI] [PubMed] [Google Scholar]
- 52. Miller RM, Kiser GL, Kaysser‐Kranich TM, Lockner RJ, Palaniappan C, Federoff HJ (2006) Robust dysregulation of gene expression in substantia nigra and striatum in Parkinson's disease. Neurobiol Dis 21:305–313. [DOI] [PubMed] [Google Scholar]
- 53. Moore DJ, West AB, Dawson VL, Dawson TM (2005) Molecular pathophysiology of Parkinson's disease. Annu Rev Neurosci 28:57–87. [DOI] [PubMed] [Google Scholar]
- 54. Moran LB, Duke DC, Deprez M, Dexter DT, Pearce RK, Graeber MB (2006) Whole genome expression profiling of the medial and lateral substantia nigra in Parkinson's disease. Neurogenetics 7:1–11. [DOI] [PubMed] [Google Scholar]
- 55. Nakagawa T, Schwartz JP (2004) Gene expression profiles of reactive astrocytes in dopamine‐depleted striatum. Brain Pathol 14:275–280. [DOI] [PMC free article] [PubMed] [Google Scholar]
- 56. Nakagawa T, Yabe T, Schwartz JP (2005) Gene expression profiles of reactive astrocytes cultured from dopamine‐depleted striatum. Neurobiol Dis 20:275–282. [DOI] [PubMed] [Google Scholar]
- 57. Niederkofler V, Salie R, Sigrist M, Arber S (2004) Repulsive guidance molecule (RGM) gene function is required for neural tube closure but not retinal topography in the mouse visual system. J Neurosci 24:808–818. [DOI] [PMC free article] [PubMed] [Google Scholar]
- 58. Oakley AE, Collingwood JF, Dobson J, Love G, Perrott HR, Edwardson JA et al (2007) Individual dopaminergic neurons show raised iron levels in Parkinson disease. Neurology 68:1820–1825. [DOI] [PubMed] [Google Scholar]
- 59. Ogata H, Goto S, Sato K, Fujibuchi W, Bono H, Kanehisa M (1999) KEGG: kyoto Encyclopedia of Genes and Genomes. Nucleic Acids Res 27:29–34. [DOI] [PMC free article] [PubMed] [Google Scholar]
- 60. Olanow CW, McNaught KS (2006) Ubiquitin‐proteasome system and Parkinson's disease. Mov Disord 21:1806–1823. [DOI] [PubMed] [Google Scholar]
- 61. Pavlidis P, Lewis DP, Noble WS (2002) Exploring gene expression data with class scores. Pac Symp Biocomput 474–485. [PubMed] [Google Scholar]
- 62. Polymeropoulos MH, Lavedan C, Leroy E, Ide SE, Dehejia A, Dutra A et al (1997) Mutation in the alpha‐synuclein gene identified in families with Parkinson's disease. Science 276:2045–2047. [DOI] [PubMed] [Google Scholar]
- 63. Popken GJ, Farel PB (1997) Sensory neuron number in neonatal and adult rats estimated by means of stereologic and profile‐based methods. J Comp Neurol 386:8–15. [PubMed] [Google Scholar]
- 64. Raguz J, Wagner S, Dikic I, Hoeller D (2007) Suppressor of T‐cell receptor signalling 1 and 2 differentially regulate endocytosis and signalling of receptor tyrosine kinases. FEBS Lett 581:4767–4772. [DOI] [PubMed] [Google Scholar]
- 65. Ricotta D, Conner SD, Schmid SL, Von Figura K, Honing S (2002) Phosphorylation of the AP2 mu subunit by AAK1 mediates high affinity binding to membrane protein sorting signals. J Cell Biol 156:791–795. [DOI] [PMC free article] [PubMed] [Google Scholar]
- 66. Ritter B, Denisov AY, Philie J, Allaire PD, Legendre‐Guillemin V, Zylbergold P et al (2007) The NECAP PHear domain increases clathrin accessory protein binding potential. EMBO J 26:4066–4077. [DOI] [PMC free article] [PubMed] [Google Scholar]
- 67. Roche FM, Hokamp K, Acab M, Babiuk LA, Hancock RE, Brinkman FS (2004) ProbeLynx: a tool for updating the association of microarray probes to genes. Nucl Acids Res 32:W471–W474. [DOI] [PMC free article] [PubMed] [Google Scholar]
- 68. Schwab JM, Monnier PP, Schluesener HJ, Conrad S, Beschorner R, Chen L et al (2005) Central nervous system injury‐induced repulsive guidance molecule expression in the adult human brain. Arch Neurol 62:1561–1568. [DOI] [PubMed] [Google Scholar]
- 69. Setsuie R, Wang YL, Mochizuki H, Osaka H, Hayakawa H, Ichihara N et al (2007) Dopaminergic neuronal loss in transgenic mice expressing the Parkinson's disease‐associated UCH‐L1 I93M mutant. Neurochem Int 50:119–129. [DOI] [PubMed] [Google Scholar]
- 70. Shi GX, Han J, Andres DA (2005) Rin GTPase couples nerve growth factor signaling to p38 and b‐Raf/ERK pathways to promote neuronal differentiation. J Biol Chem 280:37599–37609. [DOI] [PubMed] [Google Scholar]
- 71. Singleton AB, Farrer M, Johnson J, Singleton A, Hague S, Kachergus J et al (2003) Alpha‐Synuclein locus triplication causes Parkinson's disease. Science 302:841. [DOI] [PubMed] [Google Scholar]
- 72. Smidt MP, Burbach JP (2007) How to make a mesodiencephalic dopaminergic neuron. Nat Rev Neurosci 8:21–32. [DOI] [PubMed] [Google Scholar]
- 73. Sulzer D (2007) Multiple hit hypotheses for dopamine neuron loss in Parkinson's disease. Trends Neurosci 30:244–250. [DOI] [PubMed] [Google Scholar]
- 74. Tomita H, Vawter MP, Walsh DM, Evans SJ, Choudary PV, Li J et al (2004) Effect of agonal and postmortem factors on gene expression profile: quality control in microarray analyses of postmortem human brain. Biol Psychiatry 55:346–352. [DOI] [PMC free article] [PubMed] [Google Scholar]
- 75. Van De Nes JA, Kamphorst W, Ravid R, Swaab DF (1998) Comparison of beta‐protein/A4 deposits and Alz‐50‐stained cytoskeletal changes in the hypothalamus and adjoining areas of Alzheimer's disease patients: amorphic plaques and cytoskeletal changes occur independently. Acta Neuropathol (Berl) 96:129–138. [DOI] [PubMed] [Google Scholar]
- 76. Vandesompele J, De Preter K, Pattyn F, Poppe B, Van Roy N, De Paepe A, Speleman F (2002) Accurate normalization of real‐time quantitative RT‐PCR data by geometric averaging of multiple internal control genes. Genome Biol 3:research0034.1–0034.11. [DOI] [PMC free article] [PubMed] [Google Scholar]
- 77. Ward PP, Paz E, Conneely OM (2005) Multifunctional roles of lactoferrin: a critical overview. Cell Mol Life Sci 62:2540–2548. [DOI] [PMC free article] [PubMed] [Google Scholar]
- 78. Wintermeyer P, Kruger R, Kuhn W, Muller T, Woitalla D, Berg D et al (2000) Mutation analysis and association studies of the UCHL1 gene in German Parkinson's disease patients. Neuroreport 11:2079–2082. [DOI] [PubMed] [Google Scholar]
- 79. Zaahl MG, Merryweather‐Clarke AT, Kotze MJ, Van Der MS, Warnich L, Robson KJ (2005) Gene symbol: dCYTB/CYBRD1. Disease: primary iron overload. Hum Genet 118:548–549. [PubMed] [Google Scholar]
- 80. Zecca L, Youdim MB, Riederer P, Connor JR, Crichton RR (2004) Iron, brain ageing and neurodegenerative disorders. Nat Rev Neurosci 5:863–873. [DOI] [PubMed] [Google Scholar]
- 81. Zhang Y, James M, Middleton FA, Davis RL (2005) Transcriptional analysis of multiple brain regions in Parkinson's disease supports the involvement of specific protein processing, energy metabolism, and signaling pathways, and suggests novel disease mechanisms. Am J Med Genet B Neuropsychiatr Genet 137:5–16. [DOI] [PubMed] [Google Scholar]
Associated Data
This section collects any data citations, data availability statements, or supplementary materials included in this article.
Supplementary Materials
Table S1. Hybridization setup microarray experiments.
Table S2. qPCR primer sequences.
Table S3. Significantly altered genes in the PD SN.
Table S4. qPCR validation of changed transcripts in the PD SN.
This material is available as part of the online article from: http://www.blackwellsynergy.com
Please note: Blackwell Publishing is not responsible for the content or functionality of any supplementary materials supplied by the authors. Any queries (other than missing material) should be directed to the corresponding author for the article.
Supporting info item
Supporting info item
Supporting info item
Supporting info item