

Abstract
Pilocytic astrocytoma (PA) is the most common glioma in the pediatric population. PAs can exhibit variable behavior that does not always correlate with location, yet at present there is no way to predict which tumors will be more aggressive. To address this problem, an institutional cohort of 147 PAs (118 with outcome data) from both cerebellar and noncerebellar locations (spine, diencephalon, midbrain, brainstem and cortex) was utilized. Parameters included quantification of characteristic morphologic variables as well as genes previously shown to be of relevance in high‐grade gliomas, including MIB‐1, p53 and MGMT. In this cohort, the classic biphasic appearance was most common in cerebellar tumors, whereas noncerebellar tumors were predominantly microcystic. Associations with outcome suggest that the presence of degenerative atypia may be a favorable factor in PAs. Oligodendroglial morphology and the absence of leptomeningeal invasion are adverse histologic factors, but only in cerebellar tumors. Conversely, MIB‐1 proliferation index and p53 and MGMT expression do not correlate with outcome. Morphologic biomarkers thus do exist for PAs, but the utility of each biomarker varies according to location. These results suggest that PAs differ fundamentally according to location; therefore, biological behavior may not simply depend on extent of resection.
Keywords: histology, Ki67, MGMT, oligodendroglial, pilocytic astrocytoma, p53
INTRODUCTION
Pilocytic astrocytomas (PAs) are the most common primary brain tumors in children. While many patients with cerebellar and superficial cerebral lesions are cured with gross total resection as befitting their WHO grade 1 status (1), lesions in deep sites, such as the hypothalamus and brainstem, rarely can be removed and carry high risks for recurrence and morbidity. Even some superficial tumors that appear to have a good prognosis based on histology often behave in an unexpectedly aggressive manner 3, 5. In part because it is difficult to acquire sufficient numbers of pediatric low‐grade gliomas (particularly those from deep‐seated, unresectable locations), no consistent panel of markers has been identified that facilitates prognostic or therapeutic stratification.
The histology of PAs has been well described, although studies attempting to correlate microscopic appearance with outcome are fewer. Many of the classic histologic characteristics, such as Rosenthal fibers, eosinophilic granular bodies (EGBs), mitoses, nuclear pleomorphism and vascular proliferation, do not appear to correlate with outcome 7, 12, 20. Necrosis, vascular hyalinization and calcification have recently been proposed as adverse histologic factors (20), though these have not proven consistent among different groups 7, 12. However, PAs with oligodendroglioma‐like areas, a common finding in these tumors, may have a greater risk of recurrence (20).
Other proteins known to be significant in higher grade gliomas have also been studied in PAs. O6‐methylguanine‐DNA methyltransferase (MGMT) promoter methylation appears to be uncommon (21), although protein expression has not been rigorously studied to date. P53 overexpression and occasional TP53 mutations have been described in some PAs 2, 6, 8, 9, 10, 11, 13, 14, 22, but has not been shown to be associated with outcome (20). One study suggested that elevated MIB‐1 proliferation index (PI) was an unfavorable biomarker (4), but this has not proved to be a consistent finding 7, 12, 20.
Herein we describe an analysis of 147 PAs, 118 with matched outcome data extending in some cases for more than 20 years. Our results indicate that certain histologic patterns are more common in cerebellar tumors than noncerebellar tumors. The presence of degenerative atypia trends toward being a favorable factor in pilocytic astrocytomas regardless of location, while leptomeningeal invasion (LMI) and oligodendroglial morphology (ODM) are significant histologic factors associated with biological behavior, albeit only in cerebellar tumors. Our results confirm that p53, MGMT and MIB‐1 PI are not significant biomarkers of outcome. Thus, the histologic characteristics of PAs differ according to location, and the significance of specific biomarkers must therefore also account for location.
METHODS
Cohort
This study used formalin‐fixed paraffin embedded tissue from an institutional Children's Cancer Group Neuropathology Bank. Institutional Review Board approval was obtained before initiating the study. The cohort consisted of 147 PAs, including 97 cerebellar PAs and 50 tumors from other sites (Table 1). Of the 147 cases, 118 had outcome data available; median follow‐up time was 5.2 years. Material was reviewed by 2 neuropathologists (CH and RLH), verifying that the original diagnosis was accurate. Over 75% of cerebellar and cortical cases were judged to have had gross total resection by the neurosurgeons at the time of initial resection, whereas over 90% of midline tumors were judged by the neurosurgeons to have been subtotally resected. Because precise information regarding degree of resection was not available in each case, biomarkers were evaluated, controlling for location as a surrogate for extent of resection. Any case that demonstrated recurrence, progression, neuraxis spread or death was considered an “adverse” outcome. All histologic and immunohistochemical analyses were performed while blinded to outcome and, when possible, location.
Table 1.
Distribution of PAs and outcomes by location in cohort. One hundred forty‐seven cases of PA were collected since 1980, the majority of which had corresponding outcome data available. Pooled together, cerebellar and cortical tumors had a lower rate of adverse outcomes compared with deep‐seated, midline tumors (P = 0.006 by Mann–Whitney test). Abbreviations: PA = pilocytic astrocytoma; DoD = died of disease.
| Location | Total no. | No. with outcome data | No. with adverse outcome (%) | No. with only local recurrence | No. with disseminated/metastatic tumor | DoD |
|---|---|---|---|---|---|---|
| Cerebellum | 97 | 71 | 12 (16.9) | 10 | 2 | 0 |
| Brainstem/Midbrain | 12 | 12 | 6 (50.0) | 6 | 0 | 0 |
| Hypothalamus | 11 | 9 | 4 (44.4) | 1 | 1 | 2 |
| Thalamus | 10 | 9 | 4 (44.4) | 2 | 1 | 1 |
| Spinal | 9 | 9 | 5 (55.6) | 3 | 2 | 1 |
| Cortex | 7 | 7 | 1 (14.3) | 0 | 1 | 1 |
| Basal ganglia | 1 | 1 | 0 (0.0) | 0 | 0 | 0 |
| Total | 147 | 118 | 32 (27.1) | 22 | 7 | 5 |
All biomarkers described in subsequent sections did not significantly differ in tumors amenable to outcome analysis vs. those that were not.
Histology and immunohistochemistry
Paraffin‐embedded specimens were used for all analyses. Slides were reviewed, and blocks that contained PA were sectioned at a thickness of 5 µm. Sections were stained with hematoxylin and eosin to confirm that characteristic tissue had been obtained; adjacent sections were evaluated with microdissection‐based LOH studies or FISH analysis (see next).
The following histologic parameters were semiquanitified for each case: primary pattern (see Results); percent area resembling oligodendroglioma; presence of LMI; sharpness of tumor border; cellularity; degree of nuclear atypia; presence of degenerative‐type nuclear atypia; mitoses per 0.5 cm2; and relative amounts of Rosenthal fibers, EGBs, hyalinized vessels (on an arbitrary scale of 0–3), microvascular proliferation, calcification, inflammation and necrosis. When necrosis was present, it was judged to have either an infarctive or pseudopalisading pattern. All histological assessments were performed by a single neuropathologist (CH) to ensure consistency.
Immunohistochemical studies for p53, MGMT and MIB‐1 were performed and quantified as described previously 15, 16, 17. Briefly, anti‐p53 antibody staining (DOl, Santa Cruz Laboratories, Santa Cruz, CA, USA; 2 ng/mL) was graded as follows: only tumor cells with dense nuclear staining that obscured nuclear detail were graded as positive, and only tumors with p53 positivity in the majority of cells were classified as exhibiting p53 overexpression. Anti‐MGMT labeling (mT23.2, 1:100, Zymed Laboratories, San Francisco, CA, USA) was assessed in 10 high‐power fields; only cells with dense nuclear staining were graded positive, and only tumors with staining in most or nearly all cells were scored as positive. Percent anti‐MIB‐1 labeling (1:100; Immunotech, Westbrook, ME, USA) was determined by counting stained and unstained cells in 10 high‐power fields. To ensure consistency of grading, all immunohistochemical assessments were performed by a single neuropathologist (RLH).
Statistical analysis
Fisher's exact test was used to compare relative risk (RR) of adverse outcome between two groups. Means were compared between multiple groups by Kruskal–Wallis test (nonparametric ANOVA and Dunn's post hoc) or between two groups by Mann–Whitney test where appropriate. Linear regression was used to assess trends between various quantified immunohistochemical and morphologic parameters and risk of adverse outcome. Statistical analysis was performed using GraphPad software (La Jolla, CA, USA) and Microsoft Excel (Redmond, WA, USA).
RESULTS
Cohort characteristics
One hundred forty‐seven PAs were collected over three decades from 1980 through 2007. Median patient age was 7.7 years (range 1 month to 18.8 years). A total of 80.3% had available outcome data, including 73.2% of cerebellar cases and 94.0% of noncerebellar cases (Table 1). A total of 66% of all PAs were located in the cerebellum; 15.0% were in the diencephalon (thalamus and hypothalamus) or basal ganglia; 14.3% arose in the midbrain, brainstem or spinal cord; and 4.8% were located in the cortex. A total of 27.1% had adverse outcomes, 68.8% of which consisted strictly of local recurrence or progression. Consistent with prior studies, tumors in superficial locations (cortex and cerebellum) had a lower rate of adverse outcome compared with deep‐seated midline tumors of the diencephalon, midbrain/brainstem and spinal cord (P = 0.006 by Mann–Whitney test). The median time from initial surgery to an adverse outcome was 1.5 years (range 4 months to 16.2 years).
Morphologic correlation with location and outcome
The four main histologic patterns of PAs are (i) classic biphasic, alternating between areas of dense and loose architecture (Figure 1A); (ii) microcystic, featuring loose architecture with large spaces often filled with proteinaceous fluid (Figure 1B); (iii) dense piloid, often with many Rosenthal fibers (Figure 1C); and diffuse, a “patternless pattern” that can be difficult to distinguish from a grade 2 diffuse astrocytoma (Figure 1D). Cerebellar tumors were more likely to show the classic biphasic pattern, whereas supratentorial and brainstem/spinal PAs were most commonly microcystic (Figure 1E).
Figure 1.

Primary histologic patterns in cerebellar vs. noncerebellar PAs. One hundred forty‐seven pilocytic astrocytomas were scored as to the primary histologic pattern on microscopic examination, including biphasic (A), microcystic (B), dense piloid (C) and diffuse (D). The most common patterns in this cohort of cerebellar tumors were biphasic and microcystic, whereas noncerebellar tumors were more likely microcystic or dense piloid (E).
Despite differences according to location, none of the histologic patterns showed a significant association with adverse outcome. Neither did degree of infiltration into adjacent non‐neoplastic tissue (ie, tumor border sharpness), cellularity, degree of nuclear atypia, mitoses, Rosenthal fibers, EGBs, hyalinized vessels, microvascular proliferation, calcification, inflammation or necrosis (data not shown). A total of 10.9% of all PAs had necrosis, and all showed an infarctive‐type pattern with no pseudopalisading.
However, several morphologic factors did show correlations with outcome. First, the presence of degenerative‐type atypia (27 of 118 cases, Figure 2A) was associated with a trend toward reduced risk of adverse outcome regardless of location (14.8% vs. 30.8%, P = 0.14) (Figure 2B). Of note, degenerative atypia correlated with the presence of hyalinized blood vessels (P < 0.001, Figure 2C) but not with microcystic architecture or necrosis (not shown).
Figure 2.
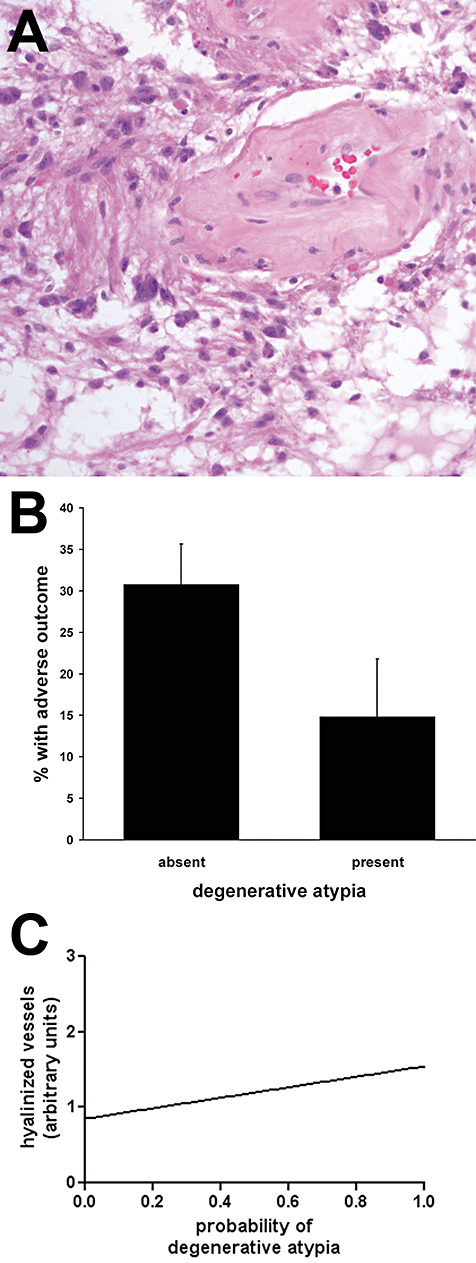
Presence of degenerative atypia trends toward lower rate of adverse outcome in pilocytic astrocytomas (PAs) and correlates with vascular hyalinization. One hundred eighteen PAs were scored as to the presence (27) or absence (91) of degenerative atypia (A). B. Tumors with degenerative atypia had a 52% lower rate of adverse outcomes than those without degenerative atypia (P = 0.14). C. The presence of degenerative atypia significantly correlated with an increase in vascular hyalinization (P < 0.001 via linear regression, see Methods for semiquantitative scoring of vascular hyalinization).
Second, cerebellar tumors in which ODM (Figure 3A) composed ≥25% of the total area (38 of 71) had higher risk of adverse outcome {Figure 3B, 26.3 ± 7.2% vs. 6.1 ± 4.2%, P = 0.03, RR = 3.2 [95% confidence interval (CI) 0.9–11.4]} This did not hold for PAs in other locations, where adverse outcomes were completely independent of ODM [P = 1.000, 14 of 47, RR = 1.005 (95% CI 0.7–1.5)].
Figure 3.
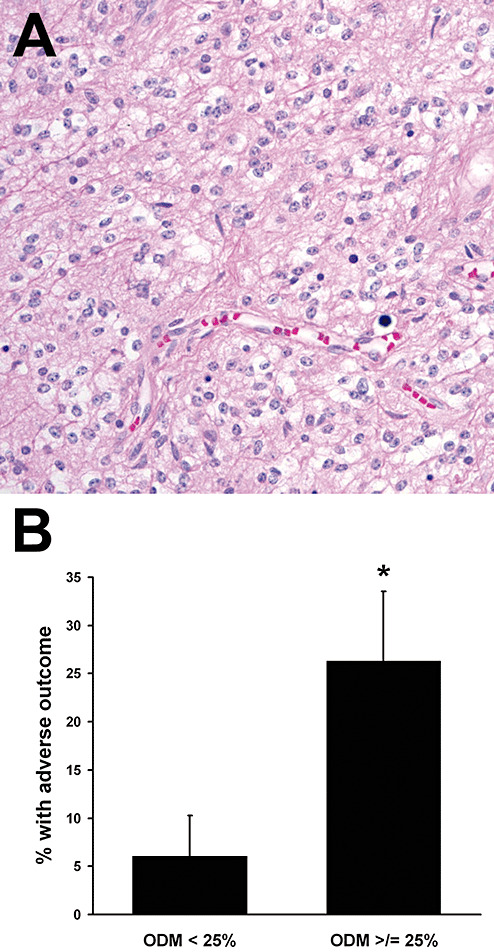
Oligodendroglial morphology (ODM) imparts higher risk of adverse outcome in cerebellar pilocytic astrocytomas (PAs). A total of 82% of cerebellar PAs had at least focal areas of ODM (A). B. Cerebellar PAs with at least 25% ODM had a 4.3‐fold higher rate of adverse outcomes. *P = 0.03, RR = 3.2 (95% CI 0.9–11.4).
Third, LMI was clearly identified in 34.7% of all cerebellar PAs (Figure 4A) and was significantly associated with a lower risk of adverse outcome compared with cases in which tumor did not spread through the leptomeninges (Figure 4B, P = 0.01 via Fisher's exact test, RR = ∞). None of the 21 cases with LMI had an adverse outcome, compared with 24% of cerebellar tumors without LMI. As only 8% of all noncerebellar PAs had definite LMI (most cases did not have sufficient leptomeninges for evaluation), its impact on outcome in noncerebellar tumors could not be determined.
Figure 4.
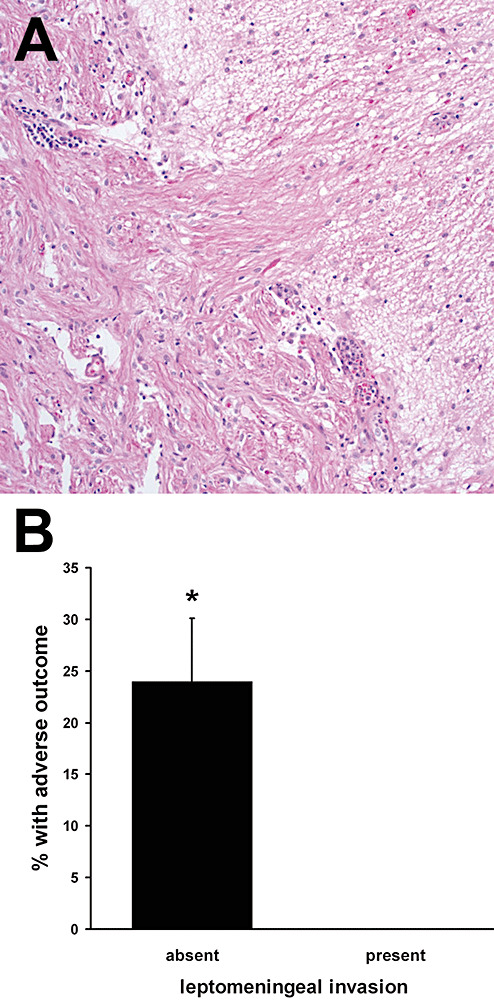
Leptomeningeal invasion (LMI) in cerebellar pilocytic astrocytomas (PAs) imparts lower risk of adverse outcome. None in 21 cerebellar PAs with LMI (A) had an adverse outcome, compared with 12/50 without LMI (B). *P = 0.01, RR = ∞.
Cerebellar tumors that had all three morphologic risk factors (absence of degenerative atypia, presence of ≥25% ODM, absence of LMI) had a 42.1% rate of adverse outcome, higher than the 10.0% of PAs with any 2 risk factors; 6.7% of cases with only 1 risk factor; and 0% of cases with no risk factors (Figure 5).
Figure 5.

Combining all three morphologic risk factors (absence of degenerative atypia, presence of ≥25% oligodendroglial morphology, absence of leptomeningeal invasion) in cerebellar pilocytic astrocytomas. (A) The greatest increase in adverse outcome probability was from two risk factors to three (*P < 0.05 vs. one or two risk factors). (B) The risk of adverse outcome increases with the number of risk factors identified microscopically (P < 0.001).
MIB‐1, p53 and MGMT according to location and outcome in PAs
Elevated MIB‐1 PI correlates with shorter survival in pediatric high‐grade gliomas (15). In this cohort of PAs, mean PI was 6.7% (range 0%–35.7%). PI was not significantly different between supratentorial (cortex, diencephalon, basal ganglia), brainstem/spinal (including midbrain, brainstem and spine) and cerebellar tumors (Figure 6A), although supratentorial PAs had the highest PI at 8.7%. No correlation was identified between PI and outcome (P = 0.94 by linear regression).
Figure 6.
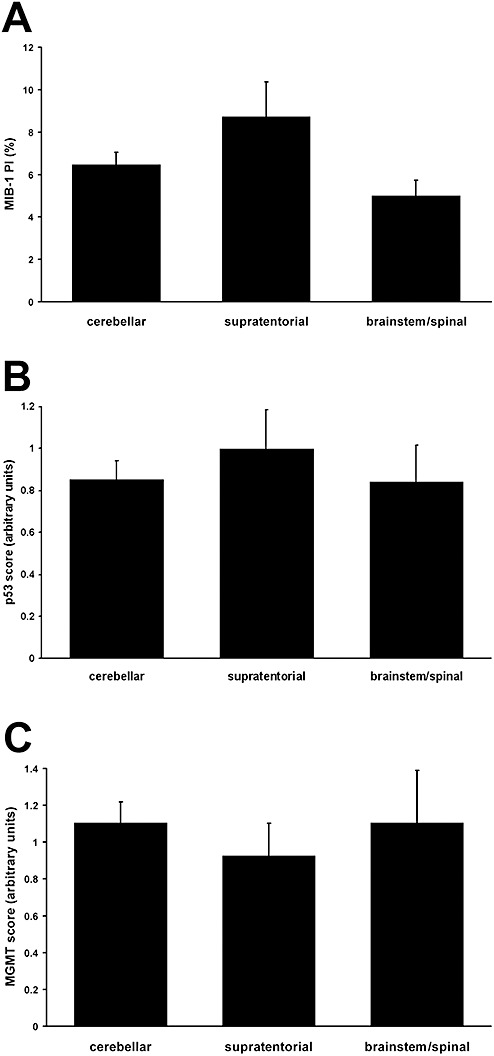
A. Pilocytic astrocytomas in the supratentorium had the highest mean proliferation index, and those of the midbrain/brainstem and spine the lowest, but these differences were not significant (P = 0.39). There was also no significant difference between p53 (B) or MGMT (C) expression and location. None of these factors correlated with outcome (see Results).
P53 overexpression has been identified as a negative prognostic factor in high‐grade pediatric gliomas (16). A total of 78.7% of PAs had no p53 immunoreactivity; 17% had a few cells with strong p53 labeling; 3.5% had the majority of nuclei positive; and only 1 tumor had strong p53 labeling in all nuclei. No correlation was seen between p53 expression or location (Figure 6B) and outcome (P = 0.86 by linear regression).
Low MGMT expression is associated with longer survival in high‐grade pediatric gliomas (17). A total of 87.2% of PAs had little to no MGMT immunostaining, while 12.8% had positivity in most or all tumor nuclei. MGMT status had no association with location (Figure 6C) or outcome (P = 0.98 by linear regression).
DISCUSSION
Studies exploring outcome in PAs are few, in part because these tumors are relatively uncommon, but also because PAs are indolent tumors that require longer follow‐up intervals. While mostly curable through complete excision, PAs do have variable outcomes, particularly when located in sites where gross total resection is not possible. Within this large cohort of PAs, some novel histologic variables were identified, including degenerative atypia and leptomeningeal spread, as well as confirmation that ODM is an adverse prognostic factor, albeit only in cerebellar tumors.
The classic histologic pattern of PAs is biphasic, alternating between dense, piloid areas and loose, microcystic zones. This cohort indicates that this is true only for cerebellar tumors, and that a pure microcystic pattern is more common in noncerebellar tumors. One study employing array technology has found that PA expression profile varies according to tumor site (18), which could manifest in part through differing morphology.
The presence of degenerative atypia, readily distinguishable from malignant atypia by experienced pathologists, trended toward favorable outcome in PAs regardless of location. Clearly, though, it is not a powerful factor, necessitating a multicenter study to confirm this trend. It is interesting to note that shortened telomeres in PAs, which may correspond to degenerative nuclei, are also associated with fewer recurrences (19). The association between degenerative atypia and vascular hyalinization suggests that one may often precipitate the other.
ODM, a common feature of PAs, was found to correlate with increased risk of adverse outcome. This is in good agreement with recent work showing shorter progression‐free survival in PAs with ODM (20). However, this study suggests that ODM is significant only when the tumor is located in the cerebellum. Indeed, noncerebellar tumors did not even show a trend toward increased risk when ODM was present. ODM may not be a strong‐enough factor to contribute to an adverse outcome in deep‐seated tumors of the midline, given that they already have a high risk of recurrence and poor outcome caused by difficulty in achieving full excision.
LMI once was logically suspected to be a potentially adverse factor. Thus, the finding that LMI is actually associated with reduced risk of adverse outcome in cerebellar PAs is surprising. From a surgical perspective, though, such cases often are easier to completely excise, as they are superficial, readily visualized and tend not to invade deeply. Future research could focus on why some tumors prefer to spread on the surface while others penetrate further into the parenchyma.
Unlike what was seen in higher‐grade gliomas 15, 16, 17, neither p53, MIB‐1 PI or MGMT expression correlated with outcome in PAs. The p53 and MIB‐1 data are in good agreement with prior studies featuring larger cohorts 7, 12, 20, and the current study is the first to show that MGMT is not related to outcome. Expression rather than promoter methylation was studied because the exact same immunohistochemical assay was successfully used to identify high MGMT expression as a poor prognostic indicator in pediatric high‐grade gliomas (17).
In contrast to recent work (20), neither necrosis, vascular hyalinization nor calcification proved to be significant factors in PA outcome. Indeed, in this study, vascular hyalinization was associated with degenerative atypia, which in turn associated with reduced risk of recurrence. Aside from variations in cohorts or methodology, explanations for these differences are not apparent.
In conclusion, many characteristics of PAs do vary according to location, including histologic pattern. The worse outcomes seen in midline tumors may therefore be related to more than just the extent of resection. It also may account for why certain variables like ODM are significant only in certain locations. Such factors will therefore need to be considered in future work involving PA biology and novel therapeutics.
ACKNOWLEDGMENTS
This study was funded by a Brain Tumor Society Award from the Pediatric Low Grade Glioma Foundation, and NIH R01 NS37704. CH was supported by a Callie Rohr/American Brain Tumor Association Fellowship.
The authors have no conflicts of interest to declare.
REFERENCES
- 1. Campbell JW, Pollack IF (1996) Cerebellar astrocytomas in children. J Neurooncol 28:223–231. [DOI] [PubMed] [Google Scholar]
- 2. Cheng Y, Pang JC, Ng HK, Ding M, Zhang SF, Zheng J et al (2000) Pilocytic astrocytomas do not show most of the genetic changes commonly seen in diffuse astrocytomas. Histopathology 37:437–444. [DOI] [PubMed] [Google Scholar]
- 3. Dirven CM, Mooij JJ, Molenaar WM (1997) Cerebellar pilocytic astrocytoma: a treatment protocol based upon analysis of 73 cases and a review of the literature. Childs Nerv Syst 13:17–23. [DOI] [PubMed] [Google Scholar]
- 4. Dirven CM, Koudstaal J, Mooij JJ, Molenaar WM (1998) The proliferative potential of the pilocytic astrocytoma: the relation between MIB‐1 labeling and clinical and neuro‐radiological follow‐up. J Neurooncol 37:9–16. [DOI] [PubMed] [Google Scholar]
- 5. Due‐Tonnessen BJ, Helseth E, Scheie D, Skullerud K, Aamodt G, Lundar T (2002) Long‐term outcome after resection of benign cerebellar astrocytomas in children and young adults (0–19 years): report of 110 consecutive cases. Pediatr Neurosurg 37:71–80. [DOI] [PubMed] [Google Scholar]
- 6. Fernandez C, Figarella‐Branger D, Girard N, Bouvier‐Labit C, Gouvernet J, Paz Paredes A, Lena G (2003) Pilocytic astrocytomas in children: prognostic factors–a retrospective study of 80 cases. Neurosurgery 53:544–553; discussion 54–55. [DOI] [PubMed] [Google Scholar]
- 7. Giannini C, Scheithauer BW, Burger PC, Christensen MR, Wollan PC, Sebo TJ et al (1999) Cellular proliferation in pilocytic and diffuse astrocytomas. J Neuropathol Exp Neurol 58:46–53. [DOI] [PubMed] [Google Scholar]
- 8. Hayes VM, Dirven CM, Dam A, Verlind E, Molenaar WM, Mooij JJ et al (1999) High frequency of TP53 mutations in juvenile pilocytic astrocytomas indicates role of TP53 in the development of these tumors. Brain Pathol 9:463–467. [DOI] [PMC free article] [PubMed] [Google Scholar]
- 9. Ishii N, Sawamura Y, Tada M, Daub DM, Janzer RC, Meagher‐Villemure M et al (1998) Absence of p53 gene mutations in a tumor panel representative of pilocytic astrocytoma diversity using a p53 functional assay. Int J Cancer 76:797–800. [DOI] [PubMed] [Google Scholar]
- 10. Liang Y, Bollen AW, Aldape KD, Gupta N (2006) Nuclear FABP7 immunoreactivity is preferentially expressed in infiltrative glioma and is associated with poor prognosis in EGFR‐overexpressing glioblastoma. BMC Cancer 6:97. [DOI] [PMC free article] [PubMed] [Google Scholar]
- 11. Litofsky NS, Hinton D, Raffel C (1994) The lack of a role for p53 in astrocytomas in pediatric patients. Neurosurgery 34:967–972; discussion 72–73. [DOI] [PubMed] [Google Scholar]
- 12. Machen SK, Prayson RA (1998) Cyclin D1 and MIB‐1 immunohistochemistry in pilocytic astrocytomas: a study of 48 cases. Hum Pathol 29:1511–1516. [DOI] [PubMed] [Google Scholar]
- 13. Matsumoto T, Fujii T, Yabe M, Oka K, Hoshi T, Sato K (1998) MIB‐1 and p53 immunocytochemistry for differentiating pilocytic astrocytomas and astrocytomas from anaplastic astrocytomas and glioblastomas in children and young adults. Histopathology 33:446–452. [DOI] [PubMed] [Google Scholar]
- 14. Patt S, Gries H, Giraldo M, Cervos‐Navarro J, Martin H, Janisch W, Brockmoller J (1996) p53 gene mutations in human astrocytic brain tumors including pilocytic astrocytomas. Hum Pathol 27:586–589. [DOI] [PubMed] [Google Scholar]
- 15. Pollack IF, Campbell JW, Hamilton RL, Martinez AJ, Bozik ME (1997) Proliferation index as a predictor of prognosis in malignant gliomas of childhood. Cancer 79:849–856. [PubMed] [Google Scholar]
- 16. Pollack IF, Hamilton RL, Finkelstein SD, Campbell JW, Martinez AJ, Sherwin RN et al (1997) The relationship between TP53 mutations and overexpression of p53 and prognosis in malignant gliomas of childhood. Cancer Res 57:304–309. [PubMed] [Google Scholar]
- 17. Pollack IF, Hamilton RL, Sobol RW, Burnham J, Yates AJ, Holmes EJ et al (2006) O6‐methylguanine‐DNA methyltransferase expression strongly correlates with outcome in childhood malignant gliomas: results from the CCG‐945 Cohort. J Clin Oncol 24:3431–3437. [DOI] [PubMed] [Google Scholar]
- 18. Sharma MK, Mansur DB, Reifenberger G, Perry A, Leonard JR, Aldape KD et al (2007) Distinct genetic signatures among pilocytic astrocytomas relate to their brain region origin. Cancer Res 67:890–900. [DOI] [PubMed] [Google Scholar]
- 19. Tabori U, Vukovic B, Zielenska M, Hawkins C, Braude I, Rutka J et al (2006) The role of telomere maintenance in the spontaneous growth arrest of pediatric low‐grade gliomas. Neoplasia 8:136–142. [DOI] [PMC free article] [PubMed] [Google Scholar]
- 20. Tibbetts KM, Emnett RJ, Gao F, Perry A, Gutmann DH, Leonard JR et al (2009) Histopathologic predictors of pilocytic astrocytoma event‐free survival. Acta Neuropathol (Berl) 117:657–665. [DOI] [PubMed] [Google Scholar]
- 21. Uhlmann K, Rohde K, Zeller C, Szymas J, Vogel S, Marczinek K et al (2003) Distinct methylation profiles of glioma subtypes. Int J Cancer 106:52–59. [DOI] [PubMed] [Google Scholar]
- 22. Willert JR, Daneshvar L, Sheffield VC, Cogen PH (1995) Deletion of chromosome arm 17p DNA sequences in pediatric high‐grade and juvenile pilocytic astrocytomas. Genes Chromosomes Cancer 12:165–172. [DOI] [PubMed] [Google Scholar]