

Abstract
Radial cell minicolumns are basic cytoarchitectonic motifs of the mammalian neocortex. Recent studies reveal that autism is associated with a “minicolumnopathy” defined by decreased columnar width and both a diminished and disrupted peripheral neuropil compartment. This study further characterizes this cortical deficit by comparing minicolumnar widths across layers. Brains from seven autistic patients and an equal number of age‐matched controls were celloidin embedded, serially sectioned at 200 µm and Nissl stained with gallocyanin. Photomicrograph mosaics of the cortex were analyzed with computerized imaging methods to determine minicolumnar width at nine separate neocortical areas: Brodmann Area's (BA) 3b, 4, 9, 10, 11, 17, 24, 43 and 44. Each area was assessed at supragranular, granular and infragranular levels. Autistic subjects had smaller minicolumns whose dimensions varied according to neocortical area. The greatest difference between autistic and control groups was observed in area 44. The interaction of diagnosis × cortical area × lamina (F 16,316 = 1.33; P = 0.175) was not significant. Diminished minicolumnar width across deep and superficial neocortical layers most probably reflects involvement of shared constituents among the different layers. In this article we discuss the possible role of double bouquet and pyramidal cells in the translaminar minicolumnar width narrowing observed in autistic subjects.
Keywords: autistic disorder, cerebral cortex, neuroanatomy
INTRODUCTION
Minicolumns are modular arrangements of neurons oriented perpendicular to the pial surface, which span most or all neocortical layers, and which are a ubiquitous feature of neocortex throughout the mammalian order (13). It has long been recognized that these modules “may vary in cell type and number, in internal and external connectivity, and in mode of neuronal processing between different large entities, but within any single large entity [they] have a basic similarity of internal design and operation”(2). Minicolumns are framed by several distinct radially oriented anatomical elements including pyramidal cell arrays and apical dendritic bundles. Parameters of minicolumnar width are defined by center‐to‐center spacing of like elements in the tangential plane of the cortex 12, 23.
Postmortem studies examining the radial organization of pyramidal cell arrays in autism have revealed significantly narrower minicolumns 14, 18, 22. In these studies, semi‐automated imaging methods have been used to define minicolumnar morphometry using an algorithm based on the Euclidean minimum spanning tree (EMST) 15, 18. After voxel thresholding of the image to screen out smaller cellular elements, including interneurons and glia, the EMST is computed using the minimum total length of segments connecting the centroids of pyramidal cells to index the radial axes of pyramidal cell arrays. The method applied to model 3D morphometry indicated that the smaller minicolumns in autism are also increased in total numbers (15). These results have been replicated using independent populations, alternate measurement techniques and targeting of anatomical elements other than pyramidal cell arrays 18, 19, 22. More recent studies have found a topographical gradient in the cortex of minicolumnar size abnormalities, the most salient of which are observed in heteromodal cortices 14, 21. By contrast, idiotypical cortices appear spared or with minimal noticeable changes (21).
In autism, tangential distances between pyramidal cell arrays have been found to be reduced in studies using as alternative and complimentary algorithms the gray level index and the Delaunay triangulation 19, 22. The EMST is a subset of the Delaunay triangulation for the same set of points. The number and length of vertices on centroids of pyramidal cells determined by Delaunay triangulation yields a bimodal distribution whereby the smaller and larger modes represent vertices within and between minicolumns, respectively. Changes in this distribution implied that the greater cell density observed in the cortex of some autistic patients is due to an increased number of minicolumns rather than an increased number of cells per minicolumn (21). This finding may reflect perturbations of early cortical development affecting the spatiotemporal pattern of neuroepithelial germinal cell divisions that establishes the number and arrangement of progenitors within the protomap of the cortex 48, 49.
Many of the aforementioned studies have focused on cortical lamina III, as the radial orientation of minicolumnar elements is easily discernible in supragranular cortex (18). In deeper laminae, pyramidal cell bodies and apical dendrites may be more obliquely oriented or displaced in relation to the core apical dendritic bundle. Methods for imaging the whole minicolumn across laminae II–VI have used thick Nissl‐stained sections to include displaced minicolumnar elements (22). However, to the authors' knowledge there have been no neuropathologic studies in autism comparing differences in morphometric parameters across different laminae.
In this study we examine for minicolumnar width according to lamina in post‐mortem cortical tissue series of autistic subjects and controls whose brain hemispheres were serially sectioned in full as part of the Autism Tissue Program's (ATP) Human Brain Atlas Project. This is the same series of cases we previously used to report cell density and minicolumnar neuronal numbers (22). The advantage of using this series is the availability of full hemisphere coronal serial sections that allows for the anatomical identification of different brain parcellations using cytoarchitectural criteria (22). Furthermore, tissue processing and embedding in celloidin avoided heating and diminished the amount of shrinkage that often confounds many neuronomorphometric studies (4). Our initial hypothesis was that minicolumnar width differences in autism would be most prominent in the supragranular laminae.
METHODS
Subjects
Postmortem tissue was obtained from seven autistic individuals and an equal number of controls (Table 1). Six of these pairs, excluding the two oldest individuals, comprised the cohort for previous studies (22). The diagnosis for each autistic patient was confirmed postmortem by the ATP. A certified rater and trainer arranged for a postmortem visit with the family to obtain, with written consent, medical and clinical information using a questionnaire that included the Autism Diagnostic Interview‐Revised.
Table 1.
Postmortem material. Abbreviation: Hem. = cerebral hemisphere from which tissue sections were obtained.
| Case pair | Patients with autism | Normative controls | ||||
|---|---|---|---|---|---|---|
| Age | Sex | Hem. | Age | Sex | Hem. | |
| 1. | 4 | Male | Left | 4 | Male | Left |
| 2. | 5 | Female | Left | 4 | Female | Right |
| 3. | 8 | Male | Right | 7 | Female | Right |
| 4. | 13 | Male | Left | 14 | Male | Right |
| 5. | 20 | Female | Right | 23 | Male | Right |
| 6. | 24 | Male | Right | 25 | Male | Right |
| 7. | 67 | Male | Left | 65 | Male | Left |
The Harvard Brain Tissue Resource Center questionnaire was modified to include autism‐specific questions for ATP use. The information obtained included: donor and respondent identifying information; ethnicity, handedness and known exposure to hazardous materials; diagnostic information including dates and physician; genetic testing results; pre‐ and postnatal medical history; immunizations, medication and hospitalization information; and family history and additional information about donor participation in any training or research studies such as imaging, medication trials and/or genetic studies. The supporting documents such as autopsy reports, death certificates, medical, clinical and/or educational records were obtained at the time of the home visit or by sending written requests, signed by the legal next‐of‐kin, to named providers.
Brain specimens
Tissue sources comprised several brain banks in the United States and Germany (see Acknowledgments). Clinical records were available, indicating that all donors had no history of other neurologic or developmental disorders. In all of the cases, autopsy was performed after informed consent was obtained from a relative. The use of these autopsy cases was approved by the relevant Institutional Review Boards.
Tissue processing
Cerebral hemispheres were fixed in 10% formalin for at least 3 months, embedded in celloidin and cut into 200 or 500 µm thick sections. One of every three sections was stained with gallocyanin for cell somata, according to the method of Heinsen and Heinsen (34). One section per brain per cortical area was selected according to gross anatomical landmarks. Nine cortical areas of interest were identified according to cytoarchitectural criteria 10, 45: dorsolateral prefrontal area 9, frontopolar area 10, orbitofrontal area 11, primary sensory area 3b, primary motor area 4, primary visual area 17, anterior cingulate area 24, subcentral area 43 and Broca's area 44.
Digital micrographic equipment consisted of a modified BX50 light microscope with UPlanApo objectives (Olympus, Tokyo, Japan), a motorized specimen stage for automatic sampling (Ludl Electronics, Hawthorne, NY, USA), HV‐C20AMP CCD color video camera (Hitachi, Tokyo, Japan) and StereoInvestigator software (MicroBrightField, Williston, VT, USA). Regions of interest were delineated using a 10× objective (numerical aperture 0.4) and photographed using a 40× liquid immersion objective (numerical aperture 1.0). Several hundred images were captured per region of interest so as to cover the whole cortical thickness. Images were assembled into mosaics using the Virtual Slice module of the StereoInvestigator software (MicroBrightField). Only slight adjustments of contrast and brightness were made, without altering the appearance of the original materials.
Image analysis
Accurate segmentation of the digitized images into neuron and background regions (i.e. neurons at a deeper plane of focus and other brain tissue) is difficult to achieve through thresholding alone. The gray‐level distribution corresponding to the neurons and the background regions overlap (Figure 1), so simply choosing only the pixels below a certain threshold value would cause many of them to be incorrectly classified. Additionally, there is significant variation within each region due to electronic noise from the camera and the inhomogeneous subcellular structure of the neurons. Again, if a simple threshold was applied, these small variations would introduce errors.
Figure 1.

The Gibbs energy function of a sample neighborhood (outlined gray boxes) is illustrated, left. Also shown is the neighborhood system, in the form of the weight b assigned to each pixel adjacent to the central pixel X. The range of the function is determined by the lowest and highest intensities of the pixels in the neighborhood, N. The energy is calculated for every integer value in the range, and the intensity corresponding to the minimum is chosen as the new gray level. An image is shown before (center) and after (right) five iterations of the noise reduction algorithm. No contrast enhancement was done, in order to illustrate the effects of smoothing alone.
To solve these problems we implemented a two‐step approach in which we smoothed the image, thereby reducing variance within each region, and then enhanced the contrast between the neurons and the background. With this method, smoothing is achieved by modeling the image as a Markov–Gibbs random field (MGRF), and using a Gibbs energy function to find the gray level that minimizes the difference in intensity between each pixel and its eight surrounding neighbors. The advantage of using Gibbs energy over other image smoothing methods, such as median filtering, is that it better preserves the region boundaries. We then compare the optimized gray level to a threshold value and increase or decrease its intensity, making the neuron regions darker and the background lighter. Each iterate of the process is described by the following equations:
 |
 |
Here  is the intensity of pixel s at iterate k, each pixel in the neighborhood N(s) of pixel s is given weight br
−s, β and T determine the degree of contrast enhancement and the remaining variables parameterize the MGRF model (9). The small, eight‐pixel size of the neighborhood system reflects the small size of the neurons in the image and ensures that the optimum gray level is calculated mostly from pixels within the true boundaries of each region. The threshold, T, is estimated from the average intensity of several neurons in each slide, and this is done on an image by image basis as the contrast and brightness of the original images varies greatly. The process is repeated for five iterations, using the same threshold and bias value, until adequate separation between the regions is achieved (Figure 2).
is the intensity of pixel s at iterate k, each pixel in the neighborhood N(s) of pixel s is given weight br
−s, β and T determine the degree of contrast enhancement and the remaining variables parameterize the MGRF model (9). The small, eight‐pixel size of the neighborhood system reflects the small size of the neurons in the image and ensures that the optimum gray level is calculated mostly from pixels within the true boundaries of each region. The threshold, T, is estimated from the average intensity of several neurons in each slide, and this is done on an image by image basis as the contrast and brightness of the original images varies greatly. The process is repeated for five iterations, using the same threshold and bias value, until adequate separation between the regions is achieved (Figure 2).
Figure 2.

The low contrast of a raw image (top) is evident in the narrow range of its gray level histogram. Although two peaks (modes) are present, each corresponding to one region, the boundary between them is indistinct. A threshold placed at the local minimum separating the peaks would cause many pixels to be mislabeled. After five iterations of noise reduction and contrast enhancement (bottom), there is a clear separation between modes associated with each region of the image.
Our method for measuring minicolumnar width requires that the center of each neuron be determined. To accomplish this, the neurons must first be segmented from the background, and each region corresponding to a single neuron must be identified. The smoothed, contrast‐enhanced images obtained from the previous steps are segmented by thresholding, which produces a binary color image. The individual neurons are then identified using a region growing algorithm that distinguishes all of the contiguous regions of the image from one another (Figure 3).
Figure 3.

Boundaries of cells from the segmented, contrast‐enhanced image are superposed on the original image (left). Objects are classified by size such that anything smaller than 10 µm in diameter (black outlines) is considered not a pyramidal cell and excluded from measurement. Cell centerpoints (middle) are determined as the point inside each pyramidal cell profile with relative maximum Euclidean distance from the boundary. In the case of multiple relative maxima, the centerpoint is the centroid of the set of maximizers. The line tracing method finds two minimal distance paths (right), from centerpoint to centerpoint, spanning the lamina, for each seed point on the laminar boundary. Core width is the average distance between the boundary lines and their median (not shown), or simply half the average distance between boundary lines.
Once the individual neurons have been identified, their edges are detected, and the resulting boundaries are used to find the distance map inside each segmented region. The distance map is calculated by finding the nearest point on the boundary to each pixel inside, finding the Euclidian distance between them, and then assigning this value to the pixel. When the distance map has been calculated for the entire region, the pixel with the maximum distance is chosen as the centroid of the neuron (Figure 3).
Measures
We identified the minicolumns in each image using a line tracing method that groups cells into minicolumns by finding the shortest cell‐to‐cell paths from one end of the layer to the next. Start and end cells (represented by center points) were chosen at each end of the layer, and the algorithm traced the shortest paths between the start cell and several endpoints within a certain margin of the end cell. The two shortest of these paths were chosen as the lateral boundaries of the minicolumn, and all cells between them were grouped into the minicolumn. Once the boundaries were identified for a single minicolumn, its cells were removed from the image, and the entire process was repeated until all of the minicolumns were detected. Minicolumnar core widths (w) were measured by finding the average distance between the center line and both boundary lines for each minicolumn (Figure 3).
Statistics
Values of w were pooled to produce three estimates in each cortical area: one for each of laminae II–III together, lamina IV and laminae V–VI together. Autistic cases and normative controls were grouped into age‐matched pairs. Statistical analysis employed a linear mixed effects model, with case‐control pair as a random effect and fixed effects diagnosis (autistic disorder or none), cortical area, and lamina together with all interaction effects and also sex and cerebral hemisphere. Interactions of any two of sex, hemisphere or diagnosis were not testable given our sample. Inclusion of those terms led to degeneracy of the linear model.
In order to assess the possible confounding effects of the uneven sampling of sex and cerebral hemisphere, a principal components regression (PCR) was performed. The starting point was the linear model above, plus a sex × hemisphere interaction term. Degeneracy in the design matrix X does not pose a problem here, as the data were fit to models comprising the first N principal components X, where N = 1, . . . , rank(X). A particular model, that is, a specific value of N, was selected to minimize the corrected Akaike information criterion (36). The coefficients of the selected model were then transformed back into a set of coefficients on the original design. The whole procedure of PCR and model selection was repeated for R = 9999 bootstrap samples generated by resampling residuals from the fit to the original data. Basic bootstrap confidence limits (27) were computed for the sex and hemisphere effects and their interaction.
RESULTS
Statistically significant differences were found by diagnosis (F 1,316 = 373.7; P < 0.0001), cortical area (F 8,316 = 4.93; P < 0.0001), lamina (F 2,316 = 940.9; P < 0.0001), diagnosis × cortical area interaction (F 8,316 = 6.38; P < 0.0001) and diagnosis × lamina interaction (F 2,316 = 16.19; P < 0.0001). The interactions of cortical area × lamina (F 16,316 = 1.38; P = 0.149) and diagnosis × cortical area × lamina (F 16,316 = 1.33; P = 0.175) were not significant.
Core width averaged across all cortical areas was 11.5 µm in laminae II–III in controls [standard deviation (SD) 1.23 µm], 14.3 µm in lamina IV (SD 1.89 µm), and 20.6 µm in laminae V–VI (SD 2.35 µm). In patients with autism, mean w in supragranular laminae was 8.67 µm (SD 1.34 µm), 11.8 µm (SD 1.39 µm) in lamina IV and 16.0 µm (SD 1.75 µm) in the infragranular laminae. Within each cortical area and diagnostic category, it held without exception that w increased with depth in the cortex (Figure 4). Considering only normal controls, and averaging over all laminae, core width was greatest in area 44 (mean 16.5 µm; SD 4.16 µm), while the narrowest column cores were found in area 11 (mean 14.3 µm; SD 4.38 µm). The greatest difference between autistic and control groups was observed in area 44, where core width in autism averaged 10.3 µm (SD 2.69 µm).
Figure 4.
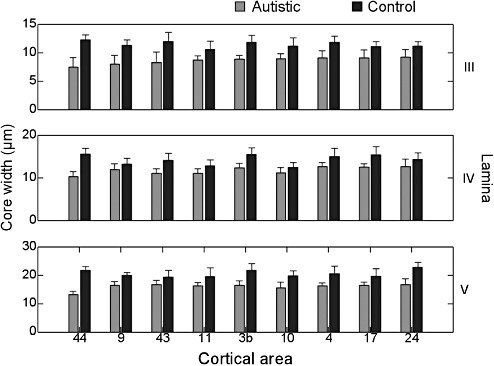
Mean minicolumnar core width by lamina and cortical area. Errorbars are +1 standard deviation.
Core width measured in the right hemisphere was 0.013 µm greater than in the left hemisphere on average across the whole group of autistic patients and controls, a nonetheless statistically significant result (F 1,316 = 59.94; P < 0.0001). In male subjects, w was 0.29 µm greater than in females (F 1,316 = 6.54; P = 0.011), again averaged over all cases. The follow‐up analysis using PCR estimated a 95% confidence interval of (−0.86 µm, 0.10 µm) for the difference between right and left hemispheres. The confidence limit for the difference between males and females was (−0.67 µm, 0.58 µm) and that for the interaction term was (−0.17 µm, 0.95 µm). The cumulative effect of these factors on w ranges from −1.69 µm to +1.62 µm, or on the order of ±1 within‐cortical‐area SD, to at least 95% confidence.
DISCUSSION
As in previous investigations, the present study used a line tracing method that grouped cells into minicolumns by finding the shortest cell‐to‐cell paths between the end points of a lamina. Results of the study corroborate and provide credence to previous findings indicating a reduction of minicolumnar width in autism. Similar differences were found in all compartments/laminae examined but varied according to brain parcellation, being most salient in Brodmann area 44. No pairwise comparisons were done among different cortical regions, but deficits were widespread. Variation of minicolumnar widths between regions indicates the usefulness of this parameter as an index of brain parcellation. The limited sample size prevented us from drawing firm conclusions regarding the significance of our laterality and gender findings. However, the secondary analysis indicated that any effect these have on minicolumnar core width should be less in absolute value than the observed differences between cortical areas, between laminae and between autistic and control groups.
Brodmann area 44 corresponds to the pars opercularis of the inferior frontal gyrus, which in humans is part of Broca's area. This association cortex is a homologue of F5 in monkeys where mirror neurons were first described electrophysiologically (52). The role of this area in language processing, speech production and understanding the intention behind observed motor acts lends support to the present finding as a potential clinicopathologic correlate to autism 26, 43, 51. Thus far, mirror neurons have not been identified anatomically as a particular cell subtype.
Previous studies have reported topographical patterns of minicolumnar abnormalities in the anterior cingulate gyrus, frontopolar region and dorsolateral prefrontal cortex of autistic patients 14, 18, 21. All of these areas are characterized by the presence of von Economo cells (30). These large, spindle‐shaped cells give rise to long, extensively‐distributed processes 1, 30 which, given their cortical distribution, may mediate integration of distributed emotional, social and executive cognitive functions. The role of these cells in the pathophysiology of autism is currently debated in the literature 1, 39, 53. It seems possible that the significance of previous minicolumnar findings within different cortical areas relate to their prominent corticocortical connectivity of which the presence of von Economo cells seems to be an expression.
Results from the present study are striking when considered in terms of heterogeneity in the properties of cortical laminae (see below). Differences in core minicolumnar widths in test cases compared with controls were observed across laminae; these were smallest in lamina II/III and largest in lamina V/VI. The results, however, do not imply abnormalities of lamina thickness related to dysplastic processes affecting cortical gyrification or manifesting heterotopic development, that is, defects of glioneuronal migration (44). Qualitative and quantitative studies related to this aspect of cortical lamination in autism have yielded ambiguous results 3, 37, 42. Rather, our findings relate to minicolumnar width per lamina within the flat face of gyri. Minicolumnar abnormalities different from the ones presently reported for autism may exist in the sulci or crests of gyri.
Significance of lamina findings
A potential limitation of this study stems from the fact that variability in cytoarchitectural landmarks across different brain regions made us group laminae together into three compartments: supragranular (II–III), granular (IV) and infragranular (V–VI). This organizational scheme conforms to the division of the isocortex into “super layers” as proposed by Swanson (54). Supragranular and infragranular lamine vary both in regards to the type of germinal/stem cell that engenders them as well as to the migratory path taken by neuroblasts to the cortical plate. During cortical maturation laminae can be distinguished by multiple immunocytochemically labeled molecular markers (17). Molecular markers and morphometric features are shared by infragranular laminae and archicortex suggesting commonalities in development (17). Infragranular laminae may thus provide a homologue to the cortex of non‐mammalian vertebrates, whereas the stratified layering of supragranular laminae confer upon mammals the advantages of a small‐world, scale‐free network of connectivity (16). It is not surprising therefore that genes associated with brain size and encephalization may independently regulate formation of different cortical laminae. Mutations in either the microcephalin or Abnormal Spindle‐like Microcephaly‐associated (ASPM) genes, which have exhibited strong positive selection in hominids, result in primary microcephaly or microcephaly vera 8, 38. This type of microcephaly is associated with the decreased numbers of neurons in laminae II and III (32). Despite these salient ontogenetic differences among laminae, the most parsimonious explanation to our findings is that minicolumnar narrowing in autism results from disruption of an anatomical constituent common to multiple layers, for example, double bouquet or pyramidal cells. An alternative account based on compensatory reactions among different cellular elements would introduce additional assumptions likely to compound any mechanistic explanation.
Peripheral neuropil and double bouquet cells
Previous studies suggest that decreased peripheral neuropil space is the major contributor to decreased width of minicolumns in the cortex of autistic individuals (18). This compartment contains glial and vascular cellular elements and modulatory monoaminergic and catecholaminergic collaterals, and the interneurons and projections that help frame any activation of the modules by an inhibitory surround (12). Anatomists and physiologists have long emphasized the nature of activity within the peripheral neuropil space of minicolumns by calling it a strong vertical flow of inhibition or, more graphically, a shower curtain of inhibition 41, 55. Although our studies suggest that the neocortex of autistic subject's has a defect in the inhibitory surround of minicolumns, proof of the same was only recently obtained from studies of tactile resolution and habituation to stimuli 31, 56, 57. A deficit in the inhibitory surround of minicolumns thus appear to account for the phenomenon of sensory (whether hyper or hypo) abnormalities and seizures in autism (20).
The dimensions and cell composition of peripheral neuropil space are highly variable among different primate species. In a recent study (24), this compartment accounted for most of the variation in minicolumnar size among different primate species, with the core pyramidal cell compartment exhibiting relatively limited cross‐species size differences. The peripheral inhibitory surround of minicolumns is primarily the result of serially arranged double bouquet cells whose horsetail‐like projections run perpendicular to the cortical surface (29). Double bouquet cells are readily apparent within the primate cortex but appear absent in the rodent brain 28, 35, 40. This cellular speciation calls into question the validity of using rodent animal models in autism.
Pyramidal cells
Besides double bouquet cells another motif of the minicolumn that is readily found across different laminae is the presence of pyramidal cells. These cells are found in laminae II–VI, within the core of the minicolumn, and constitute approximately 80% of all cortical neurons. Early during gestation precursor cells reach their cortical position from the periventricular germinal zone by migrating along a glial/stem cell projection. The resultant inside‐out scaffolding of neurons within the cortex exhibit early interconnectivity via gap junctions 46, 47. The initial wiring or connectivity among neurons may provide for Hebbian learning, thus engendering a canonical circuit based on the minicolumn.
Several neuropathologic studies in both typical and syndromic autism have shown a slight diminution in the size of cortical and subcortical pyramidal cells 5, 6, 11, 22, 50, 58. This shift toward smaller size may render longer corticocortical connections less metabolically efficient. In autism, functions that rely on short arcuate fibers may therefore be preserved or overrepresented. Contrariwise, functions that rely on the interconnection of disparate brain regions may be dysfunctional 7, 22, 25, 33.
In summary, minicolumns are the smallest among all hierarchically arranged modules of the neocortex. The present study describes minicolumnar changes widely distributed throughout the neocortex of autistic individuals. Changes were equally observed across different laminae suggesting involvement of a common anatomical element(s). Two such possibilities, both offering clinicopathologic correlates to the condition, have been discussed, that is, double bouquet and pyramidal cells.
ACKNOWLEDGMENTS
Digital micrographs were provided by Imke van Kooten and Christoph Schmitz at the University of Maastricht, the Netherlands. We are grateful to the following institutions for provision of the specimens: University of Würzburg Morphological Brain Research Unit (Würzburg, Germany), University of Maryland Brain and Tissue Bank for Developmental Disorders (Baltimore, MD, USA) and the Harvard Brain Tissue Research Center (Belmont, MA, USA).
REFERENCES
- 1. Allman JM, Watson KK, Tetreault NA, Hakeem AY (2005) Intuition and autism: a possible role for Von Economo neurons. Trends Cogn Sci 9:367–373. [DOI] [PubMed] [Google Scholar]
- 2. Arbib MA, Érdi P (2000) Précis of Structure, function, and dynamics: An integrated approach to neural organization . Behav Brain Sci 23:513–533. [DOI] [PubMed] [Google Scholar]
- 3. Bailey A, Luthert PJ, Dean AF, Harding B, Janota I, Montgomery M et al (1998) A clinicopathological study of autism. Brain 121:889–905. [DOI] [PubMed] [Google Scholar]
- 4. Bancroft JD, Gamble M (2002) Theory and Practice of Histological Techniques, 5th edn. Churchill Livingstone: New York. [Google Scholar]
- 5. Bauman M, Kemper T (1985) Histoanatomic observations of the brain in early infantile autism. Neurology 35:866–874. [DOI] [PubMed] [Google Scholar]
- 6. Bauman M, Kemper T (1994) Structural Brain Anatomy in Autism: What is the Evidence? In: The Neurobiology of Autism. Bauman M, Kemper T (eds), pp. 121–135. Johns Hopkins University Press: Baltimore. [Google Scholar]
- 7. Belmonte MK, Allen G, Beckel‐Mitchener A, Boulanger LM, Carper RA, Webb SJ (2004) Autism and abnormal development of brain connectivity. J Neurosci 24:9228–9231. [DOI] [PMC free article] [PubMed] [Google Scholar]
- 8. Bond J, Roberts E, Mochida GH, Hampshire DJ, Scott S, Asjham JM et al (2002) ASPM is a major determinant of cerebral cortical size. Nat Genet 32:316–320. [DOI] [PubMed] [Google Scholar]
- 9. Bouman C, Sauer K (1993) A generalized Gaussian image model for edge‐preserving MAP estimation. IEEE Trans Image Process 2:296–310. [DOI] [PubMed] [Google Scholar]
- 10. Braak H (1980) Architectonics of the Human Telencephalic Cortex. Springer‐Verlag: Berlin. [Google Scholar]
- 11. Brown W, London E, Cohen I, Nowicki K, Ma S, Wegiel J (2008) Neuropathologic changes in subjects with chromosome 15 duplication and autism. Abstr Soc Neurosci 34:§446.23. [Google Scholar]
- 12. Buxhoeveden DP, Casanova MF (2002) The minicolumnar hypothesis in neurosciences. Brain 125:935–951. [DOI] [PubMed] [Google Scholar]
- 13. Buxhoeveden DP, Casanova MF (2005) The cell column in comparative anatomy. In: Neocortical Modularity and the Cell Minicolumn. Casanova MF (ed.), pp. 93–116. Nova Biomedical: New York. [Google Scholar]
- 14. Buxhoeveden DP, Semendeferi K, Buckwalter J, Schenker N, Switzer R, Courchesne E (2006) Reduced minicolumns in the frontal cortex of patients with autism. Neuropathol Appl Neurobiol 32:483–491. [DOI] [PubMed] [Google Scholar]
- 15. Casanova MF, Switala AE (2005) Minicolumnar morphometry: computerized image analysis. In: Neocortical Modularity and the Cell Minicolumn. Casanova MF (ed.), pp. 161–180. Nova Biomedical: New York. [Google Scholar]
- 16. Casanova MF, Tillquist C (2008) Encephalization, emergent properties, and psychiatry: a minicolumnar perspective. Neuroscientist 14:101–118. [DOI] [PubMed] [Google Scholar]
- 17. Casanova MF, Trippe J (2006) Regulatory mechanisms of cortical laminar development. Brain Res Brain Res Rev 51:72–84. [DOI] [PubMed] [Google Scholar]
- 18. Casanova MF, Buxhoeveden DP, Switala AE, Roy E (2002) Minicolumnar pathology in autism. Neurology 58:428–432. [DOI] [PubMed] [Google Scholar]
- 19. Casanova MF, Buxhoeveden DP, Switala AE, Roy E (2002) Neuronal density and architecture (gray level index) in the brains of autistic patients. J Child Neurol 17:515–521. [DOI] [PubMed] [Google Scholar]
- 20. Casanova MF, Buxhoeveden DP, Gomez J (2003) Disruption in the inhibitory architecture of the cell minicolumn: implications for autism. Neuroscientist 9:496–507. [DOI] [PubMed] [Google Scholar]
- 21. Casanova MF, Van Kooten IAJ, Switala AE, Van Engeland H, Heinsen H, Steinbusch HWM et al (2006) Abnormalities of cortical minicolumnar organization in the prefrontal lobes of autistic patients. Clin Neurosci Res 6:127–133. [Google Scholar]
- 22. Casanova MF, Van Kooten IAJ, Switala AE, Van Engeland H, Heinsen H, Steinbusch HWM et al (2006) Minicolumnar abnormalities in autism. Acta Neuropathol (Berl) 112:287–303. [DOI] [PubMed] [Google Scholar]
- 23. Casanova MF, Konkachbaev AI, Switala AE, Elmaghraby AD (2008) Recursive trace line method for detecting myelinated bundles: a comparison study with pyramidal cell arrays. J Neurosci Methods 168:367–372. [DOI] [PMC free article] [PubMed] [Google Scholar]
- 24. Casanova MF, Trippe J, Tillquist C, Switala AE (2009) Morphometric variability of minicolumns in the striate cortex of Homo sapiens, Macaca mulatta, and Pan troglodytes . J Anat 214:226–234. [DOI] [PMC free article] [PubMed] [Google Scholar]
- 25. Courchesne E, Pierce K (2005) Why the frontal cortex in autism might be talking only to itself: local overconnectivity but long‐distance disconnection. Curr Opin Neurobiol 15:225–230. [DOI] [PubMed] [Google Scholar]
- 26. Dapretto M, Davies MS, Pfeifer JH, Scott AA, Sigman M, Bookheimer SY, Iacoboni M (2006) Understanding emotions in others: mirror neuron dysfunction in children with autism spectrum disorder. Nat Neurosci 9:28–30. [DOI] [PMC free article] [PubMed] [Google Scholar]
- 27. Davison AC, Hinkley DV (1997) Bootstrap Methods and Their Application. Cambridge University Press: Cambridge. [Google Scholar]
- 28. DeFelipe J (1997) Types of neurons, synaptic connections and chemical characteristics of cells immunoreactive for calbindin‐D28K, parvalbumin and calretinin in the neocortex. J Chem Neuroanat 14:1–19. [DOI] [PubMed] [Google Scholar]
- 29. DeFelipe J, Hendry SHC, Hashikawa T, Molinari M, Jones EG (1990) A microcolumnar structure of monkey cerebral cortex revealed by immunocytochemical studies of double bouquet cell axons. Neuroscience 37:655–673. [DOI] [PubMed] [Google Scholar]
- 30. Fajardo C, Escobar MI, Buriticá E, Arteaga G, Umbarila J, Casanova MF, Pimienta H (2008) Von Economo neurons are present in the dorsolateral (dysgranular) prefrontal cortex of humans. Neurosci Lett 435:215–218. [DOI] [PubMed] [Google Scholar]
- 31. Favorov OV, Awan OM, Tommerdahl M (2008) Minicolumnar model of somatosensory perceptual abnormalities in autism. Abstr Soc Neurosci 34:§346.5. [Google Scholar]
- 32. Ferrer I, Armstrong J (2004) Microcephaly. In: Developmental Neuropathology. Golden JA, Harding BN (eds), pp. 26–31. Wiley‐Blackwell: Hoboken. [Google Scholar]
- 33. Geschwind DH, Levitt P (2007) Autism spectrum disorders: developmental disconnection syndromes. Curr Opin Neurobiol 17:103–111. [DOI] [PubMed] [Google Scholar]
- 34. Heinsen H, Heinsen YL (1991) Serial thick, frozen, gallocyanin stained sections of human central nervous system. J Histotechnol 14:167–173. [Google Scholar]
- 35. Hof PR, Sherwood CC (2005) Morphomolecular neuronal phenotypes in the neocortex reflect phylogenetic relationships among certain mammalian orders. Anat Rec 287A:1153–1163. [DOI] [PubMed] [Google Scholar]
- 36. Hurvich CM, Tsai C‐L (1989) Regression and time series model selection in small samples. Biometrika 76:297–307. [Google Scholar]
- 37. Hutsler JJ, Love T, Zhang H (2007) Histological and magnetic resonance imaging assessment of cortical layering and thickness in autism spectrum disorders. Biol Psychiatry 61:449–457. [DOI] [PubMed] [Google Scholar]
- 38. Jackson AP, Eastwood H, Bell SM, Adu J, Toomes C, Carr IM et al (2002) Identification of microcephalin, a protein implicated in determining the size of the human brain. Am J Hum Genet 71:136–142. [DOI] [PMC free article] [PubMed] [Google Scholar]
- 39. Kennedy DP, Semendeferi K, Courchesne E (2007) No reduction of spindle neuron number in frontoinsular cortex in autism. Brain Cogn 64:124–129. [DOI] [PubMed] [Google Scholar]
- 40. Morrison JH, Hof PR, Huntley GW (1998) Neurochemical organization of the primate visual cortex. In: The Primate Nervous System. Bloom FE, Björklund A, Hökfelt T (eds), pp. 299–430. Elsevier: New York. [Google Scholar]
- 41. Mountcastle VB (1998) Perceptual Neuroscience: The Cerebral Cortex. Harvard University Press: Cambridge, MA. [Google Scholar]
- 42. Mukaetova‐Ladinska E, Jaros A, Perry R, Perry E (2004) Depletion of MAP2 expression and laminar cytoarchitectonic changes in dorsolateral prefrontal cortex in adult autistic individuals. Neuropathol Appl Neurobiol 30:615–623. [DOI] [PubMed] [Google Scholar]
- 43. Oberman LM, Hubbard EM, McCleery JP, Altschuler EL, Ramachandran VS, Pineda JA (2005) EEG evidence for mirror neuron dysfunction in autism spectrum disorders. Brain Res Cogn Brain Res 24:190–198. [DOI] [PubMed] [Google Scholar]
- 44. Pal L, Shankar SK, Santosh V, Yasha TC (2002) Glioneuronal migration and developmental disorders: histological and immunohistochemical study with a comment on evolution. Neurol India 50:444–451. [PubMed] [Google Scholar]
- 45. Paxinos G, Mai JK (2004) The Human Nervous System, 2nd edn. Elsevier: Amsterdam. [Google Scholar]
- 46. Peinado A, Yuste R, Katz LC (1993) Extensive dye coupling between rat neocortical neurons during the period of circuit formation. Neuron 10:103–114. [DOI] [PubMed] [Google Scholar]
- 47. Peinado A, Yuste R, Katz LC (1993) Gap junctional communication and the development of local circuits in neocortex. Cereb Cortex 3:488–498. [DOI] [PubMed] [Google Scholar]
- 48. Rakic P (1988) Specification of cerebral cortical areas. Science 241:170–176. [DOI] [PubMed] [Google Scholar]
- 49. Rakic P, Kornack D (2001) Neocortical expansion and elaboration during primate evolution: a view from neuroembryology. In: Evolutionary Anatomy of the Primate Cerebral Cortex. Falk D, Gibson KR (eds), pp. 30–56. Cambridge University Press: Cambridge. [Google Scholar]
- 50. Raymond GV, Bauman M, Kemper T (1995) Hippocampus in autism: a Golgi analysis. Acta Neuropathol (Berl) 91:117–119. [DOI] [PubMed] [Google Scholar]
- 51. Rizzolatti G, Fabbri‐Destro M (2008) The mirror system and its role in social cognition. Curr Opin Neurobiol 18:179–184. [DOI] [PubMed] [Google Scholar]
- 52. Rizzolatti G, Fadiga L, Gallese V, Fogassi L (1996) Premotor cortex and the recognition of motor actions. Brain Res Cogn Brain Res 3:131–141. [DOI] [PubMed] [Google Scholar]
- 53. Simms ML, Timbie CM, Kemper TL, Bauman ML, Blatt GJ (2008) Number of von Economo neurons in the anterior cingulate cortex in autism. Abstr Soc Neurosci 34:§446.2. [Google Scholar]
- 54. Swanson LW (2003) Brain Architecture: Understanding the Basic Plan. Oxford University Press: New York. [Google Scholar]
- 55. Szentágothai J, Arbib MA (1975) Conceptual Models of Neural Organization. MIT Press: Cambridge, MA. [PubMed] [Google Scholar]
- 56. Tannan V, Holden JK, Zhang Z, Baranek GT, Tommerdahl M (2008) Perceptual metrics of individuals with autism provide evidence for disinhibition. Autism Res 1:223–230. [DOI] [PMC free article] [PubMed] [Google Scholar]
- 57. Tommerdahl M, Tannan V, Cascio CJ, Baranek GT, Whitsel BL (2007) Vibrotactile adaptation fails to enhance spatial localization in adults with autism. Brain Res 1154:116–123. [DOI] [PMC free article] [PubMed] [Google Scholar]
- 58. Van Kooten IAJ, Palmen SJ, Von Cappeln P, Steinbusch HWM, Korr H, Heinsen H et al (2008) Neurons in the fusiform gyrus are fewer and smaller in autism. Brain 131:987–999. [DOI] [PubMed] [Google Scholar]