

Abstract
Aicardi–Goutières syndrome (AGS) is a rare interferon (IFN)‐related encephalopathy with onset during the first year of life. AGS, is clinically characterized by progressive microcephaly, bilateral basal ganglia calcification, cerebral atrophy, cerebrospinal fluid (CSF), lymphocytosis, delayed development of psychomotor abilities with pyramidal–extrapyramidal syndrome and mimics congenital viral infections. Microarray analysis examining the expression of 18 880 human genes has been applied to the CSF lymphocytes of 20 AGS cases (age 4.5 ± 4.4 years, mean ± standard deviation) characterized by high IFN‐alpha levels in CSF and 20 matched controls (age 4.4 ± 4.3 years, mean ± standard deviation). Gene‐expression data reveal significant differences between AGS cases and controls for all controls and 18 AGS cases. The two AGS cases unclassified as compared with controls were both older than 7 years. AGS cases presented upregulation of genes involved in IFN‐dependent pathways and lymphocyte functions, paralleled by the downregulation of genes encoding for angiopoietic activities. The cystatin F and DNAJ genes, having a negative feedback on IFN pathways, underwent a progressive age‐related increase in their expression. These gene‐expression signature parallels a progressive attenuation of clinical symptoms with age. Obtained results provide evidence that exposure to IFN‐alpha is harmful for developing brain.
Keywords: Aicardi–Goutières syndrome, cerebrospinal fluid, gene regulation, interferon‐alpha, neuroimmunology, T‐cells
INTRODUCTION
Aicardi–Goutières syndrome (AGS) is a rare encephalopathy arising during the first year of life (1). AGS is characterized by marked cerebral atrophy, leukodystrophy, calcifications of basal ganglia, raised level of IFN‐alpha in the cerebrospinal fluid (CSF), CSF lymphocytosis and negative serological findings for common perinatal infections 22, 33. Clinical features include progressive microcephaly, spasticity, dystonic features, psychomotor delay, feeding difficulties and irritability (30). Aicardi and Goutières correctly predicted the genetic origin of the disorder but emphasized that “some features, especially the pleocytosis, may erroneously suggest an inflammatory condition”(1). The increased interferon (IFN)‐alpha in affected children (34) mimicks a congenital viral infection, but the associated chilblains suggest an autoimmune pathogenic mechanism (16).
AGS is a rare genetic disease characterizsed by genetic locus heterogeneity. Crow et al identified two AGS loci: the first (AGS1) on chromosome 3p21 (15) encoding mammalian exonuclease TREX1 (14); and the second (AGS2) on chromosome 13q14.3 (4), and demonstrated that the disorder is genetically heterogeneous. Recently, the same group has identified a third locus (AGS3) on chromosome 11q13.2 and mutations in the three components of the RNaseH2 protein complex in individuals with AGS (17). Rice et al identified non‐allelic mutations in subunits of the RNASEH2 protein complex (AGS2, AGS3, and AGS4, respectively) in patients with AGS (42). Yang et al demonstrated that TREX1‐deficiency results in intracellular accumulation of single‐strand DNA causing chronic activation of DNA‐damage response network (53). The activation of this mechanism has been also demonstrated in cells collected from Trex1‐mutated AGS patients (38).
RNaseH2 is the major RNaseH activity hydrolyzing the RNA strand of an RNA : DNA hybrid in yeast and mammalian cells and, although its cellular function is not clearly defined, it might aid DNA2 and FEN1 in removing Okazaki fragments and RNA primers (5). Pedigree analysis showed that biallelic mutations occur in 80% of AGS families at the AGS1‐4 genes whereas in 17% no mutations were found, a finding suggesting that at least one further gene for AGS remains to be discovered (42). In AGS IFN‐alpha levels are consistently raised (22) and, accordingly, tubuloreticular inclusions, which are intracellular structures related to the presence of IFN‐alpha (43), are typically represented in biopsies from AGS patients (22). IFN‐alpha is remarkably higher in CSF than in serum although elevated levels of IFN‐alpha in CSF are not always accompanied by CSF lymphocytosis (16). These observations suggest a primary intrathecal synthesis of IFN‐ alpha by undefined cells of the central nervous system, potential sources including astrocytes (35) and microglia (2). Recently, it has been demonstrated that IFN‐alpha is produced in the glial cells of AGS patients (50).
Elevated levels of IFN‐alpha in AGS and systemic lupus erythematosus (SLE) (33) are reminiscent of antiviral‐like immune responses (48). CSF pterins are also elevated in AGS, most likely driven by IFN‐alpha (11). IFN‐alpha production in the central nervous system, although protecting against viral infection (45), can cause significant brain injury 3, 39 as demonstrated in lymphocytic choriomeningitis infection (52). Long‐lasting intrathecal overproduction of IFN‐alpha can cause neurodegenerative diseases in brain. As an example, in human HIV encephalopathy IFN‐alpha levels correlate with the severity of dementia (41).
Campbell et al developed a transgenic mouse strain [glial fibrillary acidic protein (GFAP)‐IFN‐alpha mice] constitutively expressing IFN‐alpha in the central nervous system (12). These mice spontaneously develop degenerative phenomena similar to those observed in the brain of AGS patients including calcium depots around blood vessels and inside endothelial cells, endothelial alterations, thickening of basal laminae and inflammatory infiltrates of T‐lymphocytes. An overexpression of genes involved in leukocyte recruitment was detected in the brain of GFAP‐IFN‐alpha mice. Basing on these scientific evidences, IFN‐alpha is nowadays considered the primary factor causing AGS in humans (3).
Although being a rare disease, AGS pathogenic mechanisms are common with other neuropathological conditions triggered by infective and autoimmune causes. Neuroimaging (10), neuropathological findings (37) and IFN‐alpha levels (28) in newborns transplacentally infected by HIV are similar to those observed in AGS patients. In HIV postnatally acquired infection, the pathologic outline is completely different (10), an observation suggesting the existence of a specific susceptibility of the developing brain to intrauterine exposure to HIV. In SLE, which may also result in severe brain damages, an IFN‐alpha increase in serum (9) and an upregulation of IFN‐inducible genes in peripheral blood cells were demonstrated (6).
The phenotypic similarities shared by AGS, congenital viral infection and cerebral SLE relate to the abnormally high levels of IFN‐alpha seen in all these diseases. Therefore, the identification of the pathogenic mechanism underlying the AGS phenotype may provide novel insights into neurodegenerative mechanisms triggered by the exposure of developing human brain to high levels of IFN‐alpha.
Accordingly, we deem it of interest to explore gene‐expression in the CSF lymphocytes of AGS patients using cDNA microarray technology seeking for disease‐specific gene expression signatures.
Obtained results shad light on the pathogenic mechanisms displayed by IFN‐alpha in inducing damage to the developing brain.
MATERIALS AND METHODS
Patient recruitment: inclusion criteria and clinical assessment
CSF aliquots have been collected from AGS patients, and controls from those undergoing lumbar puncture because of diagnostic purposes. Inclusion criteria for AGS patients were clinical assessment with an established diagnosis of AGS accompanied by the detection of IFN‐alpha increase in CSF. The study was approved by the Ethical Committee of the IRCSS Mondino, University of Pavia, Italy. In collaboration with the International Aicardì–Goutières Syndrome Association, 20 AGS patients from all over the world were collected in 5 years. This is a quite difficult task taking into account the rarity of this disease. AGS patients, 12 males and 8 females, have been identified by the presence of an appropriate clinical picture, according to the criteria proposed by Aicardi and Goutières (22), including recurrent fever in the first year of life, feeding difficulties, pyramidal and extrapyramidal signs, psychomotor delay, irritability, brain leukodystrophy, cerebral atrophy and microcephaly, bilateral basal ganglia calcifications, CSF lymphocytosis (>5 cells/mm3), raised levels of IFN‐alpha in the CSF (>2 IU/mL), [i.e. 52.95 ± 12.15 IU/mL, mean ± standard error (SE)], and negative investigations for common perinatal infections (toxoplasmosis, rubella, cytomegalovirus, herpes simplex, syphilis). Lymphocyte was the main cell type detected (>90%) in the CSF of all recruited subjects, the cell count being 40.8 ± 8.66 cells/mm3 in patients with AGS and 2.0 ± 1.13 cells/mm3 in controls (mean ± SE). Depending on IFN‐alpha levels, AGS patients were divided in two categories: the first characterized by dramatic increases (>10 IU/mL), and the other characterized by less increase (<10 IU/mL).
Two AGS patients underwent two serial CSF analyses at different ages. CSF samples were collected at the Department of Child Neurology and Psychiatry of “C. Mondino Institute of Neurology” of Pavia, and at the Virology Laboratory of the Hospital St. Vincent de Paul in Paris.
Controls, 11 males and 9 females, matched to AGS cases by gender, age and number (n = 20), were collected at the Neurosurgery Unit of the Institute G. Gaslini, Department of Paediatric Sciences, University of Genoa. These subjects underwent CSF sampling because of diagnostic or therapeutic purposes (e.g. shunt‐insertion in congenital hydrocephalus). The finding of any alteration in the CSF and mainly the presence of infective, immune, inflammatory, metabolic and genetic derangements was the major exclusion criterion for controls. Controls included 13 subjects affected by congenital hydrocephalus, three by endocranial tumor, two by myelo‐meningocele with hydrocephalus, one by choroid plexus papilloma and one by upper sella turcica cyst.
RNA isolation
CSF samples (1 mL) were resuspended in denaturating buffer containing guanidinium thiocyanate, digested by proteinase K and DNase, washed in phenol and chloroform, and RNA pelleted by isopropanol precipitation and ethanol washings on nitrocellulose filters incorporated into sterile‐sealed cartridges. The whole extraction procedure was performed in a sealed environment under helium atmosphere using an automatic nucleic‐acid extractor (Genepure 341, Applied Biosystems, Foster City, CA, USA).
RNA absorbance was quantified at 260 and 280 nm and the 260/280 ratio calculated. A 260/280 ratio > 1.9 was accepted as indicator of RNA purity. Analysis of RNA structural integrity was performed by capillary electrophoresis using the Bioanalyzer Agilent 2100 equipped with Agilent RNA 6000 nano chips (Agilent Technologies, Hewlett‐Packard‐Straße 8, Waldbronn, Germany). RNA underwent reversere transcription to cDNA, PCR amplification and microarray analysis as described in the following discussion.
cDNA synthesis and purification
The experimental protocol applied is based on the methods proposed by Eberwine to analyze gene expression of single neurons (21). Purified RNA underwent reverse transcription and amplification using quantitative real‐time PCR (qPCR) (27). Dried RNA was resuspended in water, buffer, and target sequence was then added at 3′ and 5′ modified oligo‐dG and oligo‐dT (SuperSMART, Clontech, Palo Alto, CA, USA). After incubation at 72°C for 5 minutes, a master‐mix solution containing reverse transcriptase was added and samples were incubated at 42°C for 90 minutes. Reaction was terminated by adding ethylenediaminetetraacetic acid, mixture diluted in phosphate buffer and synthesized cDNA purified by column chromatography using a commercially available purification kit (QIAquick PCR purification kit, Qiagen, Chatsworth, CA, USA).
Pre‐plateau cDNA amplification by qPCR
A PCR mix, including specific primers for the target sequences, DNA‐dependent DNA‐polymerase, the fluorescent tracers SYBR GREEN, was added to the purified cDNA. The PCR reaction was performed at 95°C × 1 minute, 50 amplification cycles at 95°C × 15 s, 65°C × 30 s and 68°C × 3 minutes. The amplification curve was observed in real time by recording fluorescence. For each sample the whole amplification curve was recorded and the pre‐plateau amplification cycle identified using the same conditions. This procedure was applied to all samples in order to standardize the amplification process thus allowing reliable comparisons of microarray data among different samples. PCR reactions were performed in a thermocycler equipped with rotating support for microvials (Rotorgene, Corbett Research, Mortlake, Australia). An example of the results obtained is reported in Figure 1.
Figure 1.
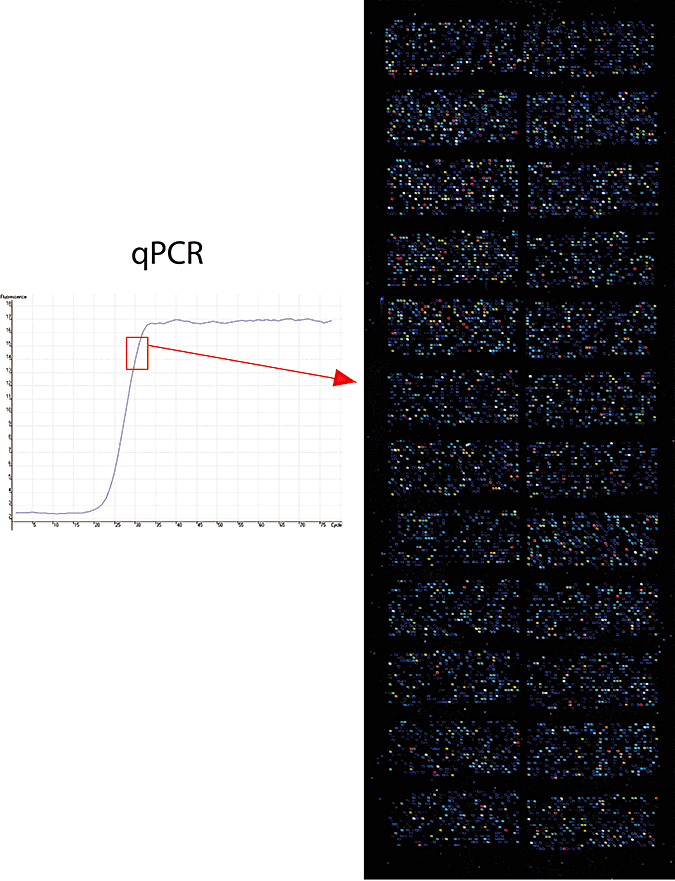
Analysis of gene expression by mRNA reverse‐transcription to cDNA; amplification of cDNA by quantitative real‐time polymerase chain reaction (qPCR); oligonucleotides hybridisation on cDNA microarray. An example of qPCR amplification (left panel) and cDNA microrray result (right panel) as obtained for an Aicardi–Goutières syndrome patient is reported. All cDNA samples have been amplified in a standardized manner by qPCR up to the pre‐plateau amplification cycle (left panel, rectangle) in order to allow intersample comparison.
Synthesis of fluorescent oligonucleotides
Amplified cDNA (2 µg), as purified by column chromatography, was mixed with primers corresponding to gene expression‐sequences tags, nucleotides and DNA‐dependent DNA polymerase. The reaction was performed at 95°C × 5 minutes, 94°C × 1 minute, 25°C × 90 s, 50°C × 10 minutes and 68°C × 5 minutes. Synthesized oligonucleotides were purified by column chromatography and alcohol precipitation then labelled with fluorescent tracers Cy3 or Cy5 by incubation at room temperature in the dark for 90 minutes. Fluorescent oligonucleotides were precipitated by cold ethanol and sodium acetate, and then purified by column chromatography. The efficacy of the procedure was checked by spectrophotometric analysis measuring abosorbance at 550 (Cy3), 650 (Cy5). Standardized amounts (25 ρmol) of labelled oligonucleotides were hybridized on glass cDNA microarrays.
Glass microarray hybridization
Fluorescent‐labelled oligonucleotides were suspended in a hybridization solution and mixed with glass microarray in a hybridization chamber. Hybridization was performed overnight at 50°C. After 16 h microarrays were extensively washed, dried by centrifugation and analyzed for emitted fluorescence by a gas‐laser scanner (ScanArray Lite, Packard Bioscience, Meriden, CA, USA). Used microarrays have been made available by the Microarray Department of the University of Amsterdam (http://www.micro‐array.nl). The whole list of genes included in the used microarray is available on the Gene Expression Omnibus database (registration number requested). Cy3/Cy5 swapped analysis was performed for each one of the tested samples. Each gene was spotted in duplicate on the microarray adopted. Thus each one of the 18 880 analyzed genes was tested for a total of four times.
Microarray data analysis
Microarray were analyzed by Scanarray Express and QuantArray softwares (Packard Bioscience). Raw data were log‐transformed and normalized both per gene and per array using Genespring 7.2 software normalization options (Silicongenetics, Redwood City, CA, USA). Genes whose expression was altered in AGS patients as compared with unaffected controls were identified using supervised methods (k‐nearest neighbor algorithm). Genes differing in their expression intensity by at least twofold and below the statistical significant threshold (P < 0.05) as evaluated by ANOVA and Bonferroni multiple testing correction were considered dysregulated in AGS cases as compared with controls. The microarray data discussed in this publication have been deposited in the GEO (http://www.ncbi.nlm.nih.gov/geo/info/linking.html) of the National Center for Biotechnology Information and are accessible (GEO series accession number requested).
Confirmation of microarray data by qPCR
A subset of five genes found altered in AGS patients as compared with controls was analyzed by qPCR to substantiate the results obtained by cDNA microarray. These genes were Cathepsin D, IFRG28, BAI2, VEGFB and GAPDH. The last gene, not altered in AGS, was used as a housekeeping gene to standardize the results among different samples. For each gene, total RNA was reversally transcribed to first‐strand DNA and quantified by qPCR using gene‐specific primers (Tib MolBiol, Genoa, ItalyBerlin, Germany) recording the fluorescent signal emitted by the SYBRGREEN incorporated into the synthesizing double‐strand DNA. Primers sequences and qPCR conditions were determined by using Beacon Designer software (Premier Biosoft International, Palo Alto, CA, USA). Results specificity was tested analyzing the melting curves of PCR products.
RESULTS
Comparison between AGS cases and controls
Remarkable (up to 10‐fold) differences between AGS cases and controls in gene‐expression intensity were detected, as also influenced by the level of gene expression. By applying the supervised k‐nearest neighbor algorithm, AGS cases and controls were correctly classified obtaining 38 correct predictions of the disease status and no incorrect prediction, whereas two AGS cases were not classified in any category. Therefore, the performances of microarray analysis to discriminate between AGS cases and controls were 100% for specificity (no incorrect classification) and 90% for sensitivity (2 unrecognized AGS cases out a total of 20 tested).
Biological functions of AGS‐dysregulated genes
Comparing gene expression between AGS cases and controls, 198 genes varied their expression by more than twofold and in a statistically significant manner (P < 0.05 as tested by ANOVA). No significant difference was detected in the expression of 344 viral cycle‐related genes whose expression is altered in case of infection by the following viruses: Herpesviridae (e.g. Herpesvirus‐associated ubiquitin‐specific protease), Epstein Barr virus (e.g. Epstein Barr virus receptor 2), Hepatitis A (e.g. hepatitis A virus receptor 1), B (e.g. Hepatitis B virus X‐associated protein 4), D (e.g. hepatitis delta antigen‐interacting protein A) viruses, Cytomegaloviridae (e.g. cytomegalovirus partial fusion receptor), Orthomyxoviridae (e.g. influenza resistance protein 1), Polioviridae (e.g. poliovirus receptors), HIV (e.g. HIV RNA‐binding protein 1), HTLV (e.g. human T‐cell leukemia virus enhancer factor), Coxsackie and Adenoviridae (e.g. coxsackie virus and adenovirus receptor), Newcastle disease virus (e.g. 12S RNA induced by Newcastle disease virus), and ectopic viral integrations sites (e.g. ectopic viral integration site 5). The expression of all these genes was less than twofold different between AGS cases and controls without any statistical significance.
The most robust and reproducible differences in gene expression between AGS patients and controls were restricted to a subset of genes identified by the k‐nearest neighbor algorithm (1, 2). In addition, leukocyte alpha IFN (V00539) was also found to be significantly increased (2.8‐fold, P < 0.05) but is not reported in Table 1 because this is a pseudogene. IFN‐related genes and lymphocyte‐activating genes were upregulated in AGS cases as compared with controls (Table 1). Conversely, RNases activities, cell cycle suppression and pro‐apoptotic activities were strikingly downregulated in AGS cases as compared with controls (Table 2).
Table 1.
List of Aicardi–Goutières syndrome (AGS) predictor genes upregulated in AGS cases as compared to unaffected controls. Genes are ranked following the intensity of the difference in the expression between AGS cases and controls (AGS/control ratio).
| Gene name | GenBank | AGS/controls ratio | Function and notes |
|---|---|---|---|
| Cathepsin D | NM_001909 | ↑10.7 (2.1–20.8) | Proteolysis and peptidolysis lysosomal aspartyl The Val‐58 allele is significantly overrepresented in demented patients compared with non‐demented controls. Carriers of the Val‐58 allele have a 3.1‐fold increased risk for developing Alzheimer disease than non‐carriers. |
| YG40‐1A | AJ227864 | ↑9.5 (1.8–19.5) | Abundant protein normally expressed mainly in leukocytes Actin‐bindling protein Actin cytoskeleton Calcium ion binding |
| Histone deacetylase 3 | NM_003883 | ↑6.7 (2.5–15.0) | Gene‐transcription activator. Anti‐apoptotic Responsible for the deacetylation of lysine residues on the N‐terminal part of the core histones (H2A, H2B, H3 and H4). Plays an important role in transcriptional regulation, cell cycle progression. |
| Ganglioside expression factor 2 (GEF2) | NM_007285 | ↑6.3 (1.2–9.8) | Proteolysis and peptidolysis. Involved in intra‐Golgi traffic. Microtubule organizing center. GABA(A) receptor‐associated protein‐like 2. |
| KIAA0367 | AB002365 | ↑5.7 (1.4–8.7) | |
| SEC22 (vesicle trafficking protein sec22b) | NM_004892 | ↑5.5 (1.3–7.8) | Involved in endoplasmic reticulum/Golgi membrane trafficking. Involved in exocytosis, phagocytisis, endocytisis. |
| Choline dehydrogenase | AJ272267 | ↑4.7 (1.2–7.0) | Polysaccharide metabolism. Betaine biosynthesis from choline. Electron transport, FAD (Flavin Adenin Dinucleotide) binding. |
| Interferon (IFN) receptor 1 | X60459 | ↑4.0 (1.3–6.1) | Receptor for IFNs alpha and beta. Binding to type I IFNs triggers tyrosine phosphorylation of a number of proteins including JAKs, TYK2, STAT proteins and IFNR alpha‐ and beta‐ subunits themselves. Cytokine receptor family II member. |
| Thrombospondin type I (THSD1) | NM_018676 | ↑3.6 (1.1–5.8) | Defense response. Brain angiogenesis inhibitor. Naturally occurring angiostatic factors inhibiting angiogenesis in vivo. Thrombospondin network specific variant for brain |
| IFN‐alpha 8 | NM_002170 | ↑3.5 (2.1–7.1) | IFN‐alpha subtype leukocyte |
| DnaJ‐like heat shock protein 40 | NM_006260 | ↑3.5 (1.5–7.9) | IFN‐induced, double‐stranded RNA‐activated protein kinase inhibitor. Activated in response to viral infections |
| Clone YR58F06 | AF085936 | ↑3.4 (1.1–5.2) | Transcription. Hematopietic cell diffentiation |
| Brain Specific Angiogenesis Inhibitor 2 (BAI2) | NM_001703 | ↑3.0 (1.2–5.8) | Brain specific angiogenesis inhibitor |
| IFRG28 (28kD IFN responsive protein) | AJ251832 | ↑2.9 (1.8–5.7) | Induced by IFNs |
| Hyaluronoglucosaminidase 3 | NM_003549 | ↑2.7 (1.1–4.3) | Glycosaminoglycan catabolism IFN‐related protein. IFN‐related developmental regulator Carbohydrate metabolism Hyalurononglucosaminidase activity Cell differentiation Cell proliferation |
| Myosin‐IF | X98411 | ↑2.6 (1.4–4.4) | Cytoskeleton organization and biogenesis. Actin‐based motor molecules with ATPase activity Calmodulin binding Microfilament motor activity |
| Cystatin F | NM_003650 | ↑2.4 (1.1–4.1) | Leukocystatin playing a role in immune regulation through inhibition Cysteine protease inhibitor activity |
| IFN‐induced cellular resistance protein | M30818 | ↑2.3 (1.3–4.2) | IFN‐induced GTP‐binding protein Mx2. Belongs to the dynamin family |
| IFN related factor 3 | NM_001571 | ↑2.3 (1.1–4.3) | Mediates IFN‐stimulated response element (ISRE) promoter activation. Functions as a molecular switch for antiviral activity |
| Interleukin‐13 receptor | U62858 | ↑2.1 (1.0–3.4) | Binds IL13 with a low affinity. Together with IL4R‐alpha can form a functional receptor for IL13. Also serves as an alternate accessory protein to the common cytokine receptor gamma chain for IL4 signaling |
| IFN related factor 7 | NM_004031 | ↑2.0 (1.1–3.2) | Transcriptional activator. Binds to the ISRE in IFN promoters. Functions as a molecular switch for antiviral activity. Activated by phosphorylation in response to infection. Induced by type I IFNs |
Table 2.
List of Aicardi–Goutières syndrome (AGS) predictor genes downregulated in AGS cases as compared to unaffected controls. Genes are ranked following the intensity of the difference in the expression between AGS cases and controls (AGS/control ratio).
| Gene name | GenBank | AGS/controls ratio | Function and notes |
|---|---|---|---|
| RNase A family 1 | NM_002933 | ↓6.9 (2.1–9.4) | Endonuclease that catalyzes the cleavage of RNA |
| KIAA (lifeguard KIAA0950) | NM_012306 | ↓6.6 (1.8–8.7) | Glutamate signaling pathway. Protects cells from Fas‐induced apoptosis Apoptotic inhibitory molecule. |
| AGTR2 | NM_000686 | ↓6.3 (1.3–8.1) | Receptor for angiotensin II. May have a role in cell morphogenesis and related events in growth and development |
| Mesenchymal stem cell protein DSC54 | NM_016644 | ↓6.1 (1.6–8.5) | Stem cell recruitment |
| VEGFB | NM_003377 | ↓5.5 (1.5–7.4) | Vascular endothelial growth factor B. angiogenesis |
| mRNA; cDNA DKFZp762G113 | AL390153 | ↓3.3 (1.2–6.0) | Recruits DNA methyltransferases. Acts as transcriptional repressor and plays a role in gene silencing. |
| RNase P 40 kDa subunit | AF079567 | ↓3.2 (1.3–6.1) | Endonuclease that catalyzes the cleavage of RNA |
| 4‐alpha‐ hydroxy‐tetrahydropterin dehydratase | GC05P134269 | ↓3.1 (1.1–5.7) | Pterin metabolism |
| RNase A family k6 | NM_005615 | ↓3.1 (1.2–5.6) | Endonuclease that catalyzes the cleavage of RNA |
| ATPase vacuolar 14kD mRNA | NM_004231 | ↓2.9 (1.9–4.4) | ATPase, H+ transporting, lysosomal 14kD, V1 subunit F involved in neurotransmitter accumulation in synaptic vesicles first, and then release from these organelles during synaptic activity |
| AAMP | NM_001087 | ↓2.9 (1.1–5.1) | Angio‐associated migratory cell protein. |
| Never in mitosis gene a (NIMA)‐related kinase 4 | NM_003157 | ↓2.7 (1.2–4.7) | Protein phosphorylation Serine/threonine protein kinase‐2 Mitosis |
| ANGPTL3 | NM_014495 | ↓2.2 (1.3–4.4) | Angiopoietin‐like 3. |
| RNase A family 2 | NM_002934 | ↓2.1 (1.5–4.0) | Non‐secretory ribonuclease. pyrimidine specific nuclease. Selectively chemotactic for dendritic cells |
Time‐course variation
Age was the main factor affecting gene‐expression changes in AGS patients. In fact differences in the expression of the 198 genes differently expressed between AGS cases and controls were dramatic in patients <3 years whereas these differences were remarkably attenuated in older patients. This trend was specifically analyzed in two patients undergoing two serial CSF samplings at 2.2 and 5.8 years (AGS 18) and 0.1 and 1.1 year (AGS 65). A trend towards the decrease in the expression of IFN‐alpha related genes was clearly observed in the first patient (Figure 2, upper panel) and a similar trend, although to a lower extent, was detected in the second patient. An opposite trend was observed for angiogenesis‐related genes tending to increase their expression with age, as mainly observed in patient AGS 18 (Figure 2, lower panel).
Figure 2.
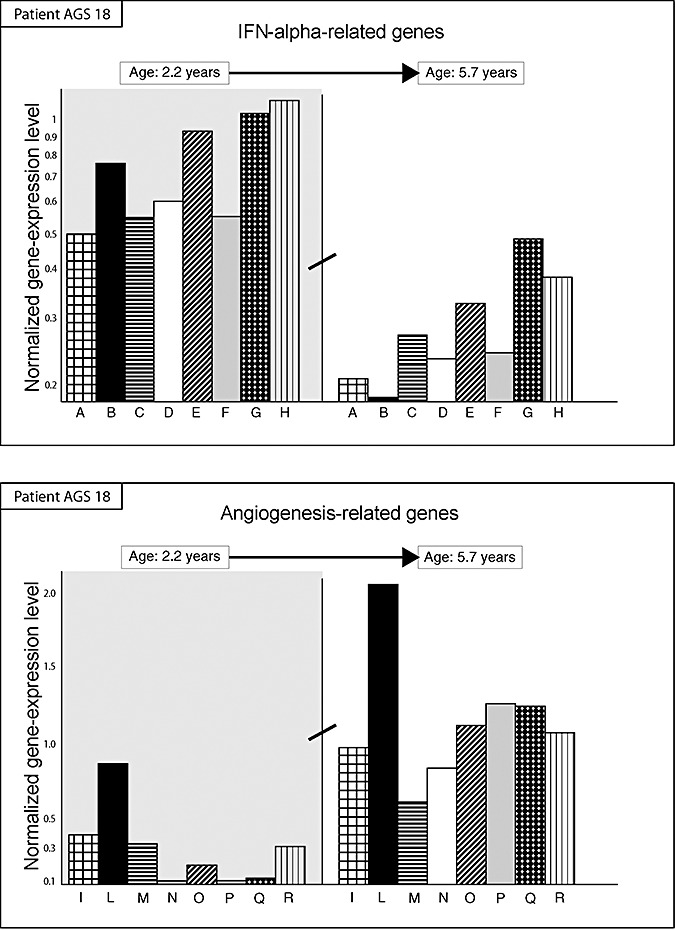
Time course variation in the transcriptional activity (vertical axis) of genes in a single patient with Aicardi–Goutières syndrome (AGS) (AGS18) undergoing serial microarray analyses at 2.2‐ (left part, gray background) and 5.7‐year (right part, white background). A significant trend towards the decrease in the expression of 8 interferon (IFN)‐alpha‐related genes (columns) was observed (upper panel). These genes include from left to right: (A) interleukin‐13 receptor; (B) IFN‐responsive protein 28 kD; (C) leukocyte alpha‐interferon; (D) IFN‐alpha 8; (E) IFN‐related factor 3; (F) IFN‐related factor 7; (G) IFN‐induced cellular resistance protein; (H) IFN‐receptor 1. An opposite significant trend was observed for eight angiogenesis‐related genes (lower panel). These genes include from left to right: (I) microvascular endothelial differentiation gene 1; (L) vascular mucosa molecule 1; (M) angiopoietin‐like factor 7; (N) vascular endothelial junction‐associated molecule; (O) vascular endothelial growth factor C; (P) endothelial angiotensinase C; (Q) angiopoietin 1; (R) angiomotin promoting endothelial cell migration and vessel formation.
The most relevant age‐related decrease was observed for brain specific angiogenesis inhibitor 2 and thrombospondin type I (Figure 3). These genes, further to be significantly higher in AGS cases as compared with controls (Table 1), were also significantly (P < 0.05) higher in AGS patients having high (>10 IU/mL) as compared with those having less (<10 IU/mL) IFN‐alpha levels. In fact brain‐specific angiogenesis inhibitor 2 (BAI2) was 2.25‐fold higher in AGS patients with high (>10 IU/mL) IFN‐alpha levels and thrombospondin type I (THSD1) was >2.11‐fold higher in AGS patients with high (>10 IU/mL) IFN‐alpha levels as compared with AGS patients with lower IFN increase (<10 IU/mL). Conversely, the two genes undergoing the most remarkable age‐related increase in AGS cases were DNAJ (NM_006260) and cystatin F (NM_003650) (Figure 3). These genes were also significantly (P < 0.05) and remarkably lower in AGS patients having high (>10 IU/mL) as compared with those having low (<10 IU/mL) IFN‐alpha levels (<4.10‐fold and <6.19‐fold for DNAJ and cystatin F, respectively).
Figure 3.
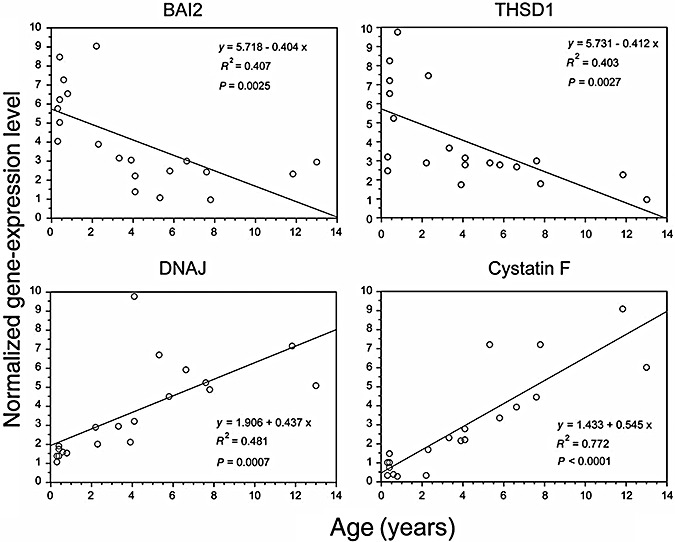
Age‐related variation in the expression of genes encoding for brain‐specific angiogenesis‐inhibitor 2 (BAI2, upper left panel), thrombospondin type I (THSD1, upper right panel), DNAJ (lower left panel) and cystatin F (lower right panel) in the 20 AGS patients tested. Each dot represents the gene expression level (vertical axis) in a single patient whose age is reported on the horizontal axis. Equation of the regression line, R 2 and P values of regression analysis between gene expression and age are reported.
DISCUSSION
Obtained results provide evidence of the dramatic effects exerted by high IFN‐alpha levels on CSF lymphocytes in brain. These effects mainly result in lymphocyte activation paralleled by inhibition of angiogenesis. These two main pathogenic mechanisms cause the severe brain damage observed in AGS patients.
AGS is a genetically determined disease that can be genetically diagnosed 15, 17. However, a remarkable genetic heterogeneity exists in AGS, with AGS patients being characterized by a relevant variability of their clinical attributes. Provided data herein indicate that the variability of AGS does not only occur among different patients but also in the same patient at different ages. Microarray analysis of CSF aliquots may represent an additional tool contributing to AGS management integrating clinical, genetic and laboratory data. Comparison with mutational spectra evaluating AGS1‐4 mutations in each patient will be performed in future studies to detect the specific effect of specific AGS mutations that can further contribute to variability among AGS patients.
Gene expression alterations characterizing CSF cells of AGS patients are related to qualitative differences in CSF lymphocytes as compared with controls. These differences render CSF lymphocytes more active cells in AGS patients than in controls and also result in increased lymphocyte recruitment and decreased removal, for example through apoptosis, thus inducing quantitative difference in CSF lymphocytes whose number is dramatically increased in AGS patients as compared with controls.
The substantial stillness of genes involved in viral replication confirms that this disease does not have an infective origin. The finding that these genes are not altered in AGS support the view that detected alterations are amenable to IFN‐alpha intrathecal production having genetic origin and not to silent viral infections. The comparison of gene expression alteration detected in AGS patients with those of patients affected by congenital viral encephalopathies will be performed in future studies in order to identify overlap and differences between these two conditions. However, it should be noted the finding that no genes involved in viral replication was found altered in AGS patients in the present study, suggesting that observed changes in gene expression are quite specific for AGS.
Conversely, dramatic changes were detected for IFN‐ and angiogenesis‐related activities. These results are consistent with the established hallmark for AGS diagnosis regarding IFN‐alpha increase in CSF in absence of viral infections.
The intrathecal production of IFN‐alpha in AGS is known to be located in glial cells (45). Accordingly, detected IFN‐alpha‐related alteration in gene expression of CSF lymphocytes represents the consequence of this pathogenic mechanism on the main effector cells, which contribute to the arising of brain damage. IFN‐alpha in CSF is the AGS hallmark although its increase is not always accompanied by CSF lymphocytosis (16). The results obtained by the herein presented study indicate that IFN‐alpha intrathecal overproduction characterizing AGS may result in brain damages both per se, by inhibiting vessel growth and/or triggering lymphocyte activation and related proteases activities. These two pathogenic mechanism may variously contribute to AGS pathogenesis during the different stages of the disease.
Gene‐expression data highlight a remarkable activation of CSF lymphocytes, whose number is typically increased in AGS, as demonstrated by the increased expression of genes involved in cell proliferation, phagocytosis, intracellular vescicle traffic, mitochondrial ATP production, proteases and cathepsin D‐related activities. The observed increase in the expression of genes amenable to mitochondrial ATP production is in line with previous in vitro data demonstrating that IFN‐alpha enhances the expression of these genes (19). Conversely, a downregulation of genes involved in cell cycle suppression and apoptosis was detected. This finding indicates that CSF lymphocytes of AGS patients do not undergo inhibition of proliferation and cell removal through apoptotic pathways.
On the whole, these data provide evidence that lymphocytes in the CSF of AGS patients are not the only ones that increased in their number but also extremely active cells producing proteolytic enzymes, such as cathepsin D, with an established attitude to damage the neurological tissue.
Downregulation in the expression of genes encoding for angiopoietic activities suggests that AGS patients may bear difficulties in angiogenesis. This finding parallels the established occurrence of vascular alteration resembling an insufficient blood vessel development known to occur in AGS patients and in the brain of engineered mice mimicking AGS development (3). This is highlighted by a downregulation of proangiogenic factors such as VEGFs, angiopoietins and vessel‐related antigens, paralleled by the upregulation of specific brain‐angiogenesis inhibitors, that is BAI2 and THSD1. BAI2 is an established inhibitor of brain‐angiogenesis whose expression is inversely related to those of proangiogenic genes including VEGFs (26). THSD1 is known to specifically induce apoptosis in proliferating endothelial cells (24). It is likely that the downregulation of angiogenesis observed in AGS patients is a direct effect of IFN‐alpha increase in CSF. In fact it is established that IFN‐alpha hampers tumor angiogenesis by inhibiting VEGFs expression (44). Also the anatomo‐pathological aspect of AGS‐affected brain is in line with the inhibition of angiogenesis as a main pathogenic mechanism. This pathological picture includes wedge‐shaped infarctions, patchy myelin loss and calcified depots in the media, adventitia and perivascular space of small blood vessels, thus suggesting that this disease represents a genetic cerebral angiopathy caused by hypoxia/ischemia 7, 22. Brain microvasculitis is recognized as a typical consequence of IFN‐alpha overproduction in transgenic mice (12). It may be also hypothesized that the downregulation of angiotensin‐related genes in AGS patients may result in neurotransmission deficit, angiotensin II being required for neurotransmitter release in the striatum, as demonstrated in animal models (49).
IFNs are recognized as transcriptional modulators and their effect on the transcriptome of several cell types has been investigated in a number of studies mainly conducted under in vitro conditions (20). The transcriptional effects of these cytokines on endothelial cells, however, have been only partially addressed (46) despite the broad evidence of their anti‐angiogenic effects. The fact that “stimulation of lymphocytes with TLR ligands leads to the production of many of the IFN subtypes (Ito et al, 2008), whereas only IFN‐alpha 8 was reported as upregulated in AGS patients (Table 1), may be ascribed to the highly restrictive criteria used to identify the AGS‐related genes. As an example, other IFN‐alpha subtypes such as IFN‐alpha 2 (M54886) (increased 1.8‐fold), IFN‐alpha receptor 1 (J03171) (increased 1.7‐fold), IFN regulatory factors 3, 5 and 7 (average increase 1.5‐fold) were increased in their expression but less than twofold or below the statistical significance threshold (P < 0.05).
As an established anti‐angiogenic agent, IFN‐alpha has been proposed for the therapy of diseases characterized by abnormal vessel growth including solid tumours, angiomas, proliferative diabetic retinopathy and Kaposi's sarcoma. In future studies, the balancing of proangiogenic and anti‐angiogenic factors could represent a possible target for therapeutical attempts in experimental models mimicking AGS pathogenesis.
On the whole, the results obtained by the study presented herein provide evidence that AGS is an idiopathic IFN‐induced microangiopathy, and that the resulting brain damage is caused by lymphocyte activation and insufficient development of brain vessels. This phenomenon appears to be particularly severe in a developing organ characterized by a high‐energy requirement, such as the human brain during the initial period of life. The pathogenic relevance for AGS of the IFN‐induced microangiopathy could also explain why AGS lesions are selectively located in brain areas highly sensitive to wanes in energy availability, that is nuclei and putamen. The selective localization of AGS lesions in specific brain areas could also be explained by the changes that IFN‐alpha causes in mitochondrial ATP production, as established in in vitro studies (20).
In addition to the insofar discussed issues, it is also conceivable that further mechanisms contribute to AGS pathogenesis. The IFN‐related downregulation of genes involved in stem cell recruitment—that is DSC54—observed in our study suggests the existence of difficulties for AGS patients to recruit stem cells for brain tissue development. Factors delivered from infiltrating lymphocytes, which of course are not per se the source of stem cells, may be involved in stem cell recruitment and microglia cell replacement (47).
The downregulation of genes encoding for RNases we observed is in line with recent studies demonstrating in AGS patients the presence of RNAse genes mutations (17). The accumulation of abnormal amount of double RNA and DNA–RNA strands is a powerful stimulus for IFN‐alpha production. Obtained results support the view that lack of RNAse activity in AGS is the cause of IFN‐alpha expression because its increase the persistence of nucleic acid hybridis and G/C‐rich oligonucleotides that are potent stymula for IFN‐alpha production (23). Notably, autoimmunity is a feature of TREX1‐deficient inflammatory disease 18, 36, characterized by an inappropriate activation of antiviral‐like immune responses leading to elevated levels of IFN‐α in absence of infection (22). In Trex1‐deficient cells extratranuclear ssDNA arising from nascent DNA at the replication fork does not undergo de novo methylation or chromatin assembly. The immune system reacts against infectious pathogen as well as against unnecessary/abnormal host (self) nucleic acids via complementary receptor systems. This process culminates in the production of type‐I IFNs or NF‐κB‐dependent proinflammatory cytokines (25). A member of the family of Toll‐like receptors (TLRs), that is TLR3, TLR7 and TLR9, located in the endoplasmic reticulum of immune cells, recognize nucleic acids and respond to endocytosed or transfected DNA, including ssDNA that contains unmethylated CpG motifs (8). Microarray analysis has been performed in peripheral blood monocyte stimulated in vitro with small interfering RNAs (13), detecting TLR‐dependent and independent effects resulting in upregulation of IFN and cytokine‐related genes including STATs, CXLCs, etc. By comparison our results indicate that in the CSF lymphocyte of AGS patient, these genes known to be upregulated in response to IFN‐alpha were found to be increased in their expression but by less than twofold or below the statistical significance threshold (P < 0.05), thus not being reported in Table 1. As an example this was the case for related signal transducers and activators of transcription STAT1‐6 genes (average fold increase 3.2‐fold, variation intervals 0.8–6.1), transmembrane chemokine CXCL16 (average fold increase 2.6‐fold, variation intervals 0.7–5.8). This finding remarks the high interindividual variability characterizing different AGS patients.
Gene‐expression alterations detected in AGS patients tend to attenuate with age, as specifically observed in the two patients examined at different ages. These time‐related transcriptome stabilization in AGS patients reflects a trend towards an age‐related decrease of IFN‐alpha in CSF during the first years of life (50). Mainly two genes, that is DNAJ and cystatin F, underwent a remarkable and significant age‐related increase in their expression. DNAJ, also identified as P58 (IPK), has been demonstrated in vitro to be an inhibitor of the IFN‐induced double‐stranded RNA‐activated protein kinase, indicating P58 (IPK) as an important component of a negative feedback loop used by the cell to inhibit IFN‐alpha signalling (51). Cystatin F is a leukocystatin whose pathway is upregulated in younger AGS patients (as seen in this study). Cystatin F, although is not known to have any direct effect on IFN‐alpha pathway, attenuate lymphocyte activation by inhibiting the proteolytic activity of cathepsin (29), a pathway remarkably activated in the CSF lymphocytes of AGS patients, especially those younger than 3 years. The upregulation of DNAJ and cystatin F is particularly evident in AGS patients older than 3 years. Therefore, it appears that the abnormal production of IFN‐alpha, triggered by genetic defects in RNases, is progressively counteracted by the upregulation of genes attenuating lymphocytes activation and IFN‐alpha effects.
These molecular findings are in agreement with clinical data collected during the follow‐up of 11 out of 20 AGS patients included in the study presented herein. These results highlight that neurological symptoms are progressive in the first year of life but become stable by the end of the second year in 10 out of 11 patients (32). Two typical hallmarks of AGS, that is basal ganglia calcification and leukodistrophy, also appear to be progressive but only during the first 3 years of life (31). Furthermore, serial follow‐up of IFN‐alpha levels in CSF in four AGS patients up to 4 years of age demonstrated a remarkable age‐related trend to decrease (32). Similar findings have been also reported by other authors (40).
Altogether, results of gene expression analysis, of IFN‐alpha in CSF, and of neurological and radiological examinations provide evidence that AGS is not a fully progressive disease. A negative feedback is activated after the first years of life in AGS patients resulting in an attenuation of AGS pathogenic mechanisms. Clearly these protective mechanisms curbs AGS progression but cannot recovery brain damages already occurred during the previous years of life.
In conclusion, the herein presented data indicate that: (i) microarray analysis of gene expression in CSF is able to explore in vivo IFN‐related molecular alterations induced in brain‐infiltrating cells; and (ii) AGS is a biphasic disease characterized by a dramatic progression during the first 3 years of life and thereafter becoming a more stable pathological condition.
The identification of genes whose expression is altered in AGS discloses the possibility of performing in future studies, both in vitro and in genetically engineered mice, with the modulation of these pathways by suitable drugs or RNA interference methods.
The concept of AGS as a primary genetic interferonopathy highlights a possible unifying theme in the neuropathogenesis of AGS, congenital viral infection and cerebral SLE. Consequently, identification of the genes whose altered expression is responsible for AGS may provide a novel insight into common neurodegenerative mechanisms resulting from exposure of the developing human brain to abnormally high levels of IFN‐alpha.
ACKNOWLEDGMENTS
We thank Yanick J. Crow, Leeds Institute of Molecular Medicine, University of Leeds, UK for his appreciated contribution to the interpretation and discussion of the results obtained.
Grant Support: This study was supported by the International Aicardi–Goutières Syndrome Association (IAGSA) and by the CARIPLO Foundation of Milan, Italy.
REFERENCES
- 1. Aicardi J, Goutieres F (1984) A progressive familial encephalopathy in infancy with calcifications of the basal ganglia and chronic cerebrospinal fluid lymphocytosis. Ann Neurol 15:49–54. [DOI] [PubMed] [Google Scholar]
- 2. Akiyama H, Ikeda K, Katoh M, McGeer EG, McGeer PL (1994) Expression of MRP14, 27E10, interferon‐α and leukocyte common antigen by reactive microglia in postmortem human brain tissue. J Neuroimmunol 50:195–201. [DOI] [PubMed] [Google Scholar]
- 3. Akwa Y, Hassett DE, Eloranta ML, Sandberg K, Masliah E, Powell H et al (1998) Transgenic expression of IFN‐alpha in the central nervous system of mice protects against lethal neurotropic viral infection but induces inflammation and neurodegeneration. J Immunol 161:5016–5026. [PubMed] [Google Scholar]
- 4. Ali M, Highet LJ, Lacombe D, Goizet C, King MD, Tacke U et al (2006) A second locus for Aicardi‐Goutieres syndrome at chromosome 13q14‐21. J Med Genet 43:444–450. [DOI] [PMC free article] [PubMed] [Google Scholar]
- 5. Arudchandran A, Cerritelli SM, Narimatsu SK, Itaya M, Shin DY, Shimada Y et al (2000) The absence of ribonuclease H1 or H2 alters the sensitivity of Saccharomyces cerevisiae to hydroxyurea, caffeine and ethyl methanesulphonate: implications for roles of RNases H in DNA replication and repair. Genes Cells 5:789–802. [DOI] [PubMed] [Google Scholar]
- 6. Baechler EC, Batliwalla FM, Karypis G, Gaffney PM, Ortmann WA, Espe KJ et al (2003) Interfern‐inducible gene expression signature in peripheral blood cells of patients with severe lupus. Proc Natl Acad Sci USA 100:2610–2615. [DOI] [PMC free article] [PubMed] [Google Scholar]
- 7. Barth P, Walter A, Van Gelderen I (1999) Aicardi‐Goutieres syndrome: a genetic microangiopathy? Acta Neuropathol 98:212–216. [DOI] [PubMed] [Google Scholar]
- 8. Barton GM, Kagan JC, Medzhitov R (2006) Intracellular localization of the Toll‐like receptor 9 prevents recognition of self DNA but facilitates access to viral DNA. Nat Immunol 7:49–56. [DOI] [PubMed] [Google Scholar]
- 9. Batteux F, Palmer P, Daeron M, Weill B, Lebon P (1999) FCgammaRII (CD32)‐dependent induction of interferon‐alpha by serum from patients with lupus erythematosus. Eur Cytokine Netw 10:509–514. [PubMed] [Google Scholar]
- 10. Belman AL, Lantos G, Horoupian D, Novick BE, Ultmann MH, Dickson DW et al (1986) AIDS: calcification of the basal ganglia in infants and children. Neurology 36:1192–1199. [DOI] [PubMed] [Google Scholar]
- 11. Blau N, Bonafé L, Krägeloh‐Mann I, Thöny B, Kierat L, Häusler M et al (2003) Cerebrospinal fluid pterins and folates in Aicardi‐Goutieres syndrome. Neurology 61:642–647. [DOI] [PubMed] [Google Scholar]
- 12. Campbell IL, Krucker T, Steffensen S, Akwa Y, Powell HC, Lane T et al (1999) Structural and functional neuropathology in transgenic mice with CNS expression of IFN‐alpha. Brain Res 835:46–61. [DOI] [PubMed] [Google Scholar]
- 13. Cekaite L, Furset G, Hovig E, Sioud M (2007) Gene expression analysis in blood cells in response to unmodified and 2′‐modified siRNAs reveals TLR‐dependent and independent effects. J Mol Biol 365:90–108. [DOI] [PubMed] [Google Scholar]
- 14. Chowdhury D, Beresford PJ, Zhu P, Zhang D, Sung JS, Demple B et al (2006) The exonuclease TREX1 is in the SET complex and acts in concert with NM23‐H1 to degrade DNA during granzyme A‐mediated cell death. Mol Cell 23:133–142. [DOI] [PubMed] [Google Scholar]
- 15. Crow YJ, Jackson AP, Roberts E, Van Beusekom E, Barth P, Corry P et al (2000) Aicardi‐Goutieres syndrome displays genetic heterogeinity with one locus (AGS1) on chromosome 3p21. Am J Hum Genet 67:213–221. [DOI] [PMC free article] [PubMed] [Google Scholar]
- 16. Crow YJ, Black DN, Ali M, Bond J, Jackson AP, Lefson M et al (2003) Cree encephalitis is allelic with Aicardi‐Goutieres syndrome: implications for the pathogenesis of disorders of interpheron alpha metabolism. J Med Genet 40:183–187. [DOI] [PMC free article] [PubMed] [Google Scholar]
- 17. Crow YJ, Leitch A, Hayward BE, Garner A, Parmar R, Griffith E, Ali M et al (2006a) Mutations in genes encoding ribonuclease H2 subunits cause Aicardi‐Goutieres syndrome and mimic congenital viral brain infection. Nat Genet 38:910–916. [DOI] [PubMed] [Google Scholar]
- 18. Crow YJ, Hayward BE, Parmar R, Robins P, Leitch A, Ali M et al (2006b) Mutations in the gene encoding the 3′‐5′ DNA exonuclease TREX1 cause Aicardi‐Goutieres syndrome at the AGS1 locus. Nat Genet 38:917–920. [DOI] [PubMed] [Google Scholar]
- 19. Der S, Zhou A, Williams B, Silverman R (1998) Identification of genes differentially regulated by interferon alpha, beta, or gamma using oligonucleotide arrays. Proc Natl Acad Sci USA 95:15623–15628. [DOI] [PMC free article] [PubMed] [Google Scholar]
- 20. De Veer MJ, Holko M, Frevel M, Walker E, Der S, Paranjape JM et al (2001) Functional classification of interferon‐stimulated genes identified using microarrays. J Leukoc Biol 69:912–920. [PubMed] [Google Scholar]
- 21. Eberwine J (2001) Single‐cell molecular biology. Nat Neurosci 4s:1155–1156. [DOI] [PubMed] [Google Scholar]
- 22. Goutières F, Aicardi J, Barth P, Lebon P (1998) Aicardi‐Goutieres syndrome: an updated and results of interferon‐alpha studies. Ann Neurol 44:900–907. [DOI] [PubMed] [Google Scholar]
- 23. Guzylack‐Piriou L, Balmelli C, McCullough KC, Summerfield A (2004) Type‐A CpG oligonucleotides activate exclusively porcine natural interferon‐producing cells to secrete interferon‐alpha, tumour necrosis factor‐alpha and interleukin‐12. Immunology 112:28–23. [DOI] [PMC free article] [PubMed] [Google Scholar]
- 24. Hamano Y, Sugimoto H, Soubasakos MA, Kieran M, Olsen BR, Lawler J et al (2004) Thrombospondin‐1 associated with tumor microenvironment contributes to low‐dose cyclophosphamide‐mediated endothelial cell apoptosis and tumor growth suppression. Cancer Res 64:1570–1574. [DOI] [PubMed] [Google Scholar]
- 25. Ishii KJ, Akira S (2006) Innate recognition of, and regulation by, DNA. Trends Immunol 27:525–532. [DOI] [PubMed] [Google Scholar]
- 26. Kee HJ, Koh JT, Kim MY, Ahn KY, Kim JK, Bae CS et al (2002) Expression of brain‐specific angiogenesis inhibitor 2 (BAI2) in normal and ischemic brain: involvement of BAI2 in the ischemia‐induced brain angiogenesis. J Cereb Blood Flow Metab 22:1054–1067. [DOI] [PubMed] [Google Scholar]
- 27. Klein D (2002) Quantification using real‐time PCR technology: applications and limitations. Trends Mol Med 8:257–260. [DOI] [PubMed] [Google Scholar]
- 28. Krivine A (1992) Endogenous interferon‐alpha in newborns from HIV seropositive mothers. J Interferon Res 12: S151. [Google Scholar]
- 29. Langerholc T, Zavasnik‐Bergant V, Turk B, Turk V, Abrahamson M, Kos J (2005) Inhibitory properties of cystatin F and its localization in U937 promonocyte cells. FEBS J 272:1535–1545. [DOI] [PubMed] [Google Scholar]
- 30. Lanzi G, Fazzi E, Arrigo S (2002) Aicardi‐Goutieres syndrome: a description of 21 new cases and a comparison with the literature. Eur J Paediatr Neurol 6s:1–14. [DOI] [PubMed] [Google Scholar]
- 31. Lanzi G, D'Arrigo S, Drumbl G, Uggetti C, Fazzi E (2003) Aicardi‐Goutieres syndrome: differential diagnosis and ethiopathogenesis. Funct Neurol 18:71–75. [PubMed] [Google Scholar]
- 32. Lanzi G, Fazzi E, D'Arrigo S, Orcesi S, Maraucci I, Uggetti C et al (2005) The natural history of Aicardi‐Goutieres syndrome: follow‐up of 11 Italian patients. Neurology 64:1621–1624. [DOI] [PubMed] [Google Scholar]
- 33. Lebon P, Badoual J, Ponsot G, Goutieres F, Hemeury‐Cukier F, Aicardi J (1988) Intrathecal synthesis of interferon‐alpha in infants with progressive familial encephalopathy. J Neurol Sci 84:201–208. [DOI] [PubMed] [Google Scholar]
- 34. Lebon P, Meritet JF, Krivine A, Rozenberg F (2002) Interferon and Aicardi‐Goutières syndrome. Eur J Paediatr Neurol 6 (Suppl. A):A47–A53. [DOI] [PubMed] [Google Scholar]
- 35. Lieberman AP, Pitha P, Shin HS, Shin ML (1989) Production of tumour necrosis factor and other cytokines by astrocytes stimulated with lipopolysaccharide or a neurotropic virus. Proc Natl Acad Sci USA 86:6348–6352. [DOI] [PMC free article] [PubMed] [Google Scholar]
- 36. Morita M, Stamp G, Robins P, Dulic A, Rosewell I, Hrivnak G et al (2004) Gene‐targeted mice lacking the Trex1 (DNase III) 3′→5′ DNA exonuclease develop inflammatory myocarditis. Mol Cell Biol 24:6719–6727. [DOI] [PMC free article] [PubMed] [Google Scholar]
- 37. Mueller BU, Pizzo PA (2001) Acquired immunodeficiency syndrome in the infant. In: Infectious Diseases of the Fetus and the Newborn Infant, 5th edn. Remington JS, Klein JO (eds), p. 457. WB Saunders: Philadelphia. [Google Scholar]
- 38. O'Driscoll M (2008) TREX1 DNA exonuclease deficiency, accumulation of single stranded DNA and complex human genetic disorders. DNA Repair (Amst) 7:997–1003. [DOI] [PubMed] [Google Scholar]
- 39. Pfau CJ, Gresser I, Hunt KD (1983) Lethal role of interferon in lymphocytic choriomeningitis virus‐induced encephalitis. J Gen Virol 64:1827–1830. [DOI] [PubMed] [Google Scholar]
- 40. Polizzi A, Pavone P, Parano E, Incorpora G, Ruggirei M (2001) Lack of progression of brain atrophy in Aicardi‐Goutières syndrome. Pediatr Neurol 24:300–302. [DOI] [PubMed] [Google Scholar]
- 41. Rho MB, Wesselingh S, Glass JD, McArthur JC, Choi S, Griffin J et al (1995) A potential role for interferon‐alpha in the pathogenesis of HIV‐associated dementia. Brain Behav Immun 9:366–375. [DOI] [PubMed] [Google Scholar]
- 42. Rice G, Patrick T, Parmar R, Taylor CF, Aeby A, Aicardi J et al (2007) Clinical and molecular phenotype of Aicardi‐Goutieres syndrome. Am J Hum Genet 81:713–725. [DOI] [PMC free article] [PubMed] [Google Scholar]
- 43. Rich SA (1981) Human lupus inclusions and interferon. Science 213:772–775. [DOI] [PubMed] [Google Scholar]
- 44. Rosewicz S, Detjen K, Scholz A, Von Marschall Z (2004) Interferon‐alpha: regulatory effects on cell cycle and angiogenesis. Neuroendocrinology 80 (Suppl. 1):85–93. [DOI] [PubMed] [Google Scholar]
- 45. Samuel CE (1991) Antiviral actions of interferon: interferon‐regulated cellular proteins and their surprisingly selective antiviral activities. Virology 183:1–11. [DOI] [PubMed] [Google Scholar]
- 46. Sana TR, Janatpour MJ, Sathe M, McEvoy LM, McClanahan TK (2005) Microarray analysis of primary endothelial cells challenged with different inflammatory and immune cytokines. Cytokine 29:256–269. [DOI] [PubMed] [Google Scholar]
- 47. Simard AR, Rivest S (2004) Role of inflammation in the neurobiology of stem cells. Neuroreport 15:2305–2310. [DOI] [PubMed] [Google Scholar]
- 48. Stetson DB, Medzhitov R (2006) Type I interferons in host defense. Immunity 25:373–381. [DOI] [PubMed] [Google Scholar]
- 49. Stragier B, Sarre S, Vanderheyden P, Vauquelin G, Fournié‐Zaluski MC, Ebinger G et al (2004) Metabolism of angiotensin II is required for its in vivo effect on dopamine release in the striatum of the rat. J Neurochem 90:1251–1257. [DOI] [PubMed] [Google Scholar]
- 50. Van Heteren JT, Rozenberg F, Aronica E, Troost D, Lebon P, Kuijpers TW (2008) Astrocytes produce interferon‐alpha and CXCL10, but not IL‐6 or CXCL8, in Aicardi‐Goutières syndrome. Glia 56:568–578. [DOI] [PubMed] [Google Scholar]
- 51. Van Huizen R, Martindale JL, Gorospe M, Holbrook NJ (2003) P58IPK, a novel endoplasmic reticulum stress‐inducible protein and potential negative regulator of eIF2alpha signalling. J Biol Chem 278:15558–15564. [DOI] [PubMed] [Google Scholar]
- 52. Wright R, Johnson D, Neumann M, Ksiazek TG, Rollin P, Keech RV, et al (1997) Congenital lymphocytic choriomeningitis virus syndrome: a desease that mimics congenital toxoplasmosis or cytomegalovirus infection. Pediatrics 100:E9. [DOI] [PubMed] [Google Scholar]
- 53. Yang YG, Lindahl T, Barnes DE (2007) Trex1 exonuclease degrades ssDNA to prevent chronic checkpoint activation and autoimmune disease. Cell 131:836–838. [DOI] [PubMed] [Google Scholar]