

Abstract
FTY720 (fingolimod) is an oral sphingosine‐1 phosphate (S1P) receptor modulator in phase III development for the treatment of multiple sclerosis. To further investigate its mode of action, we analyzed gene expression in the central nervous system (CNS) during experimental autoimmune encephalomyelitis (EAE). FTY720 downregulated inflammatory genes in addition to vascular adhesion molecules. It decreased the matrix metalloproteinase gene MMP‐9 and increased its counterregulator—tissue inhibitor of metalloproteinase, TIMP‐1—resulting in a proteolytic balance that favors preservation of blood‐brain‐barrier (BBB) integrity. Furthermore, FTY720 reduced S1P lyase that increases the S1P concentration in the brain, in line with a marked reversal of neurological deficits and raising the possibility for enhanced triggering of S1P receptors on resident brain cells. This is accompanied by an increase in S1P1 and S1P5 in contrast with the attenuation of S1P3 and S1P4. Late‐stage rescue therapy with FTY720, even up to 1 month after EAE onset, reversed BBB leakiness and reduced demyelination, along with normalization of neurologic function. Our results indicate rapid blockade of ongoing disease processes by FTY720, and structural restoration of the CNS parenchyma, which is likely caused by the inhibition of autoimmune T cell infiltration and direct modulation of microvascular and/or glial cells.
Keywords: EAE, experimental autoimmune encephalomyelitis, fingolimod, FTY720, gene expression, multiple sclerosis, sphingosine‐1 phosphate
INTRODUCTION
Clinical expression of the neurological disease multiple sclerosis (MS) comprises acute inflammatory demyelination as well as neurodegenerative aspects involving prolonged demyelination, gliosis and axonal loss, all of which can occur simultaneously based on the detection of cortical atrophy early in disease and axon transaction in inflammatory lesions (27). Specific aspects of chronic MS pathogenesis are reproduced in animal models of experimental autoimmune encephalomyelitis (EAE), especially in certain mouse strains and in the Dark Agouti (DA) rat. For the optimal treatment of MS, future therapeutic agents must obviously aim to target as many of the pathogenic processes as possible. The new oral investigational drug, FTY720 (fingolimod), is a sphingosine‐1 phosphate (S1P) receptor modulator under development for the treatment of relapsing MS 6, 22, representing the first of a new class of immunomodulatory agents. The in vivo efficacy of FTY720 is mainly reliant on its phosphate ester metabolite (FTY720‐P), which acts as a high‐affinity ligand for the G‐protein‐coupled receptors S1P1 and S1P3–5 9, 30.
Impressive results with FTY720 in phase II trials with MS patients (25) mirror the striking efficacy of this agent in experimental models of MS, as shown by various EAE studies employing preventive and therapeutic treatment modalities 3, 9, 19, 26, 45. While the clinical and neurohistological benefits of FTY720 are clearly demonstrated in these settings, there is no information on the gene expression profile during EAE under FTY720 treatment. In fact, only a limited number of gene expression studies have been performed in rat EAE models using central nervous system (CNS) tissues from diseased animals (13). On the other hand, a considerable number of comprehensive microarray analyses have been performed in mouse models of EAE, some involving the isolation of specific brain regions, such as the microvascular compartment (1).
In the present study, our first aim was to induce acute and chronic EAE in the DA rat to examine the time course of gene expression in the brain stem, cerebellum and spinal cord (cervical, thoracic, lumbar segments) in comparison with FTY720‐treated animals, using real‐time polymerase chain reaction (PCR) analysis. Previous expression analyses in rodent EAE studies and in MS patients have identified a significant linkage in the major histocompatibility complex (MHC), in addition to a strong association with polymorphisms in a number of non‐HLA inflammatory and immune response genes, such as the interleukin (IL)‐2 receptor α and IL‐7 receptor α20, 37. We selected a broad spectrum of genes for evaluation, extending far beyond the immune response genes, to encompass certain neuroregenerative aspects and also some components of the sphingolipid‐modifying pathways as FTY720 acts as a sphingolipid mimetic. The next goal was to determine if FTY720 could effectively reverse EAE symptoms as a late‐stage rescue therapy, considering that this drug shows evidence for long‐term reversal of functional neurological deficits (3). Here we show that FTY720 not only suppressed early and late‐phase inflammatory genes, but also appeared to enhance the expression of key neuroregenerative genes. Most impressively, our results further demonstrate that rescue therapy with FTY720 resulted in a reversal of blood‐brain‐barrier (BBB) leakage and almost complete attenuation of neurological deficits. These findings indicate that this drug is able to effectively target multiple processes during the pathogenesis of MS and help to explain why FTY720 shows such promise (25) in the clinical management of MS patients.
MATERIAL AND METHODS
Animals
Female DA rats from Harlan Winkelmann (Borchen, Germany), 8 to 10 weeks of age, were kept under standardized light and climate‐controlled conditions with free access to food and water. All procedures were approved by the Austrian health authorities in compliance with international animal welfare standards according to the European Communities Council Directive and the guidelines set forth in the National Institutes of Health Guide for the Care and Use of Laboratory Animals (Institute of Laboratory Animal Resources, 1996).
EAE induction and clinical scoring
DA rats were lightly anesthetized by isoflurane inhalation (0.5% Forane®; Abbott Laboratories, Vienna, Austria) and given a single intradermal 200 µL inoculation in the dorsal base of the tail root. The immunization mixture was modified from Lorentzen et al (28) and consisted of syngeneic CNS antigen (4 parts brain to 6 of spinal cord) in phosphate‐buffered saline (PBS) emulsified 1:1 in incomplete Freund's adjuvant supplemented with 200‐µg heat‐inactivated Mycobacterium tuberculosis (strain H37 RA; DIFCO™, BD Diagnostics, Oxford, UK); the adjuvant is henceforth referred to as complete Freund's adjuvant (CFA). As an adjuvant control for all EAE studies, animals were injected with CFA alone and vehicle treated. The rats were weighed every other day and scored daily for neurological signs as follows: 0, no symptoms, 1, complete loss of tail tonus, 2, limb weakness or ataxia, 3, full paralysis of hind or forelimbs, and 4, tetraparalysis or moribund. Animals with a score of 4 were sacrificed if weight loss indicated little chance of recovery, in accordance with animal welfare standards. Mortality because of sacrifice or spontaneous EAE‐related death was recorded as a 4, which continued to be included in the clinical assessment; body weight measurements were not carried forward.
Test compound and study design
FTY720 {2‐amino‐2‐[2‐(4‐octylphenyl)ethyl]propane‐1,3‐diol hydrochloride} was provided as a powder (Novartis Pharma AG, Basel, Switzerland) and dissolved in water, hereafter designated as vehicle. The drug was freshly prepared and given per os once daily by gavage at a dosing volume of 5‐mL/kg body weight. Age‐matched DA rats were acclimatized for a minimum of 1 week before distribution into four groups: naïve, CFA/vehicle, CNS antigen/vehicle, and CNS antigen/FTY720. For preventive therapy, oral dosing with 0.3 mg/kg FTY720 or vehicle started on day 0 at immunization and continued until day 11; animals were sacrificed and CNS samples were taken for real‐time PCR analysis, as indicated in Figure 1. For therapeutic treatment in fully established EAE, vehicle or 0.3‐mg/kg FTY720 dosing began on day 12 and continued until day 28; CNS samples were taken for real‐time PCR on day 29. For late rescue therapy in chronically diseased animals, vehicle or 0.3‐mg/kg FTY720 treatment started on day 40 and continued for 2 weeks; animals were perfusion fixed for paraffin embedment on day 40 to evaluate neuropathology at treatment initiation and on day 54 after dosing ended (n = 6 per group).
Figure 1.
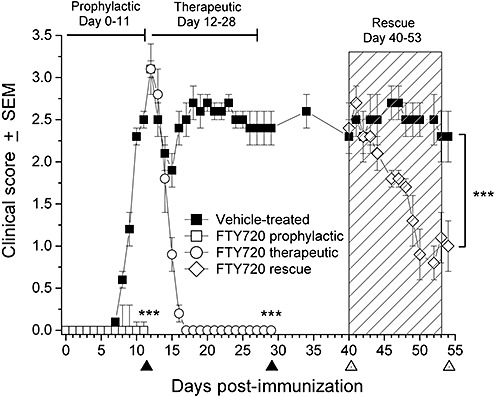
FTY720 efficacy in DA rat model of chronic‐protracted EAE, actively induced by syngeneic neuroantigens. Data are shown as mean clinical score ± SEM. All animals developed full hind limb paralysis by day 12 and continued to show strong neurologic deficits by the initiation of treatment on days 12 and 40. In contrast with vehicle (▪), oral FTY720 at 0.3 mg/kg completely prevented onset of EAE symptoms upon prophylactic treatment (□). FTY720 0.3 mg/kg therapeutic dosing (○) from days 12 to 28 rapidly and fully curtailed further development of EAE symptoms. Even more importantly, FTY720 rescue therapy at 0.3 mg/kg (◊) from days 40 to 53 significantly reversed neurological impairment to a deficit in tail tonus. On days 11 and 29 (▴ along x‐axis), rats were sacrificed for real‐time PCR (n = 6 per group, including naïve rats). On days 40 and 54 (▵ along x‐axis), animals were sacrificed for neuropathology (n = 6 per group) as shown in 8, 9. Level of significance between the vehicle and FTY720 groups was determined by one‐way ANOVA of area‐under‐the‐curve values from days 0–11, 12–29 and 40–54 for the prophylactic, therapeutic and rescue therapy arms, respectively, followed by a post‐hoc Tukey test. ***P ≤ 0.001. Abbreviations: FTY720 = fingolimod; DA = Dark Agouti; EAE = experimental autoimmune encephalomyelitis; SEM = standard error of mean; PCR = polymerase chain reaction; ANOVA = analysis of variance.
Expression profiling by real‐time PCR
Rat CNS samples were snap frozen in liquid nitrogen and stored at −80 C until gene expression profiling was performed by real‐time PCR. Frozen tissues included brain stem, cerebellum and spinal cord (cervical, thoracic, lumbar segments), which were homogenized in 1.5 mL of Trizol® (Invitrogen, Paisley, UK) using a Polytron® homogenizer with a PTA10S generator (Kinematica AG, Lucerne, Switzerland). Total RNA was isolated according to the manufacturer protocol (Life Technologies, Paisley, UK) utilizing Phase Lock Gel™ extraction tubes (Eppendorf AG, Hamburg, Germany). cDNA was prepared using Sprint™ PowerScript™ PrePrimed Single Shots/Random Hexamer Primers cDNA kit (Clontech, Takara, Japan) according to the manufacturer protocol.
Expression profiling was performed on an ABI PRISM® 7900HT Sequence Detection System (Applied Biosystems, Weiterstadt, Germany) with the SYBR green dye as previously described (31). Primers were designed with Primer Express® software v2.0 (Applied Biosystems), and, when possible, span exon‐intron boundaries so that the primers do not detect signals from coamplified DNA. Primer sequences are listed in Appendix S1. For some low copy genes, the second primer pair was used in parallel to ensure reproducibility of results. Housekeeping genes included glyceraldehyde‐3‐phosphate dehydrogenase and hypoxanthine phosphoribosyl transferase. Each PCR reaction was performed in duplicate in a 25‐µL final volume. Based on melting curve analysis, no primer‐dimers were generated during the applied 40 real‐time PCR amplification cycles. For relative quantification, data were analyzed by the ΔΔCT method in MS Excel (formulas described in Applied Biosystems User Bulletin #2). Expression levels of target genes were normalized to the average of housekeeping genes.
Western blot for cytosolic phospholipase 2 (cPLA2)
Organ samples (cerebellum and spinal cord) were homogenized in Tris‐buffered saline (10 mM Tris pH 7.5, 150 mM NaCl) containing 1 mM dithiothreitol (DTT), a cocktail of protease inhibitors (Complete™ Mini with EDTA, Roche Applied Science, Vienna, Austria), and a cocktail of phosphatase inhibitors (Sigma‐Aldrich, St. Louis, MO, USA; catalog no. P‐2850). Cerebellum samples were homogenized in 600‐µL buffer with 10 to 15 strokes in a Dounce homogenizer. Spinal cord was homogenized in 1.5‐mL buffer using a Medimachine™ device equipped with a Medicon™ 35‐µm disaggregator unit (Becton Dickinson, Schwechat, Austria). Homogenates were mixed with an equal volume of NuPAGE LDS sample buffer (Invitrogen) and heated for 5 minutes at 70°C. DNA was sheared by further vortexing after the addition of glass beads (Sigma‐Aldrich). Protein amounts were quantified in 10 µL of the denatured samples after precipitation with 1‐mL ethanol using a bicinchoninic acid assay (BCA; Pierce, Rockford, IL, USA). Samples were adjusted to reach equivalent protein concentrations and were loaded on 4% to 12% NuPAGE Bis‐Tris gels run with a MOPS‐based buffer (Invitrogen). After electrophoresis, wet transfer was performed on nitrocellulose 0.2‐µm membranes. For immunodetection of cPLA2, the membrane was blocked overnight at 4°C in PBS containing 0.05% v/v Tween 20 (PBST) and 5% defatted milk. Primary detection was made using 1‐µg/mL anti‐cPLA2 (Upstate, Dundee, UK) in PBST with 2.5% milk, incubating for 1 h at room temperature. After several washes in PBST, secondary detection was achieved using an antimouse immunoglobulin (Ig), horseradish peroxidase‐linked F(ab’)2 fragment (GE Healthcare, Vienna, Austria) diluted 1:7500 in PBST. After final washes in PBST, the membrane was treated with enhanced chemiluminescence (ECL) reagents and exposed to Hyperfilm™ ECL (GE Healthcare).
S1P lyase (SPL) activity measurement
SPL activity was measured as described (44), with minor modifications. The spinal cord tissue was emulsified on ice in 1‐mL SPL reaction buffer (100 mM potassium phosphate pH 7.4, containing 50 mM sucrose, 1 mM EDTA, 1 mM DTT, 0.1% Triton X‐100, 30 mM NaF, 300 µM pyridoxal phosphate, Complete™ protease inhibitors) using an Ultra‐Turrax® homogenizer (IKA, Staufen, Germany). Following a 5‐minute centrifugation at 1200 × g, the homogenates (50 µg of total protein) were blended with [4,5‐3H]‐dihydro‐S1P (0.08 µM final concentration, 0.5 µCi; American Radiolabeled Chemicals, Saint Louis, MO, USA) prepared in mixed micelles with 0.1% Triton X‐100 in a total reaction volume of 100‐µL SPL reaction buffer and incubated at 37°C for 30 minutes. Then, 400‐µL PBS was added to the reaction, and lipids were extracted by addition of 707‐µL chloroform/methanol/HCl/5M NaCl (300:300:7:100 v/v) with mixing. After sonication for 15 minutes, phases were separated by centrifugation, and the organic phase was recovered, dried and dissolved in chloroform/methanol (19:1, v/v). The labeled lipids were resolved by thin‐layer chromatography (TLC) on SilicaGel 60 high performance TLC plates (Merck, Darmstadt, Germany) with chloroform/methanol/acetic acid (50/50/1, v/v/v). TLC plates were exposed to Kodak® BioMax™ MR film for 1–3 days at −80°C, then routinely developed by an automatic film processor. Bands were quantified by AlphaImager™ 2200 (Alpha Innotech Corporation, San Leandro, CA, USA). Lyase activity was estimated by the degree of formation of hexadecenal. A fluorescently labeled, shorter‐chain variant of hexadecenal was used as a reference compound (prepared by Peter Nussbaumer, Novartis Institutes for BioMedical Research, Vienna, Austria). Protein concentrations in tissue homogenates were determined using Bradford reagent (BioRad, Munich, Germany) with bovine serum albumin as a reference.
Histopathology
For perfusion fixation, animals were euthanized with a 0.5‐mL overdose of sodium pentobarbital intraperitoneally (60‐mg/mL Nembutal®; Serva Feinbiochemica, Heidelberg, Germany) and allowed to enter respiratory arrest before transcardial perfusion. Using a peristaltic pump (MityFlex® Series 913; Anko Products Inc., Bradenton, FL, USA), rats were infused via the left ventricle and bled via the right atrium. CNS tissue was rapidly removed, postfixed and embedded in paraffin as described (41).
Serial 4‐µm‐thick cross‐sections prepared from the spinal cord and brain were stained with hematoxylin and eosin (H&E), luxol fast blue (LFB), and Bielchowsky's silver impregnation as reported (41) to assess inflammation, demyelination, and axonal loss, respectively. Immunocytochemical staining was performed on adjacent sections using a peroxidase‐conjugated streptavidin‐biotin method (41) against the following targets: ED1 (macrophages/activated microglia; Serotec, Oxford, UK), W3/13 (T cells; Serotec), 2’‐3’‐cyclic nucleotide phosphodiesterase (CNPase; SMI 91; Sternberger Monoclonals, Lutherville, MD, USA), myelin basic protein (anti‐MBP; Sigma‐Aldrich), proteolipid protein (anti‐PLP; Serotec), β‐amyloid precursor protein (anti‐APP; Chemicon, Temecula, CA, USA) and rat Ig (Amersham Pharmacia Biotech, Uppsala, Schweden). Negative control sections were incubated with irrelevant mAb of the appropriate Ig isotype or with nonimmune serum. Sections were lightly counterstained in hematoxylin. Photographs were taken with an Axioplan™ 2 microscope (Carl Zeiss GmbH, Jena, Germany).
Histopathological parameters were evaluated as follows: the inflammatory index was based on the mean number of perivascular inflammatory infiltrates derived from an average of 15 complete cross‐sections of spinal cord of an individual animal. Demyelination was determined by overlaying a morphometric grid on the LFB‐stained cross‐sections of spinal cord at a magnification of ×900. The total cross sectional area was determined at a magnification of ×40. Cervical, thoracic and lumbar cord sections were evaluated for each animal, and then an average value was calculated. Values are expressed as a percentage of the total cross‐section of the spinal cord.
Evaluation of lesional activity was based on the following categories according to published criteria 10, 29, 38: (i) actively demyelinating lesions are defined by the presence of macrophages containing LFB‐positive myelin degradation products, which are immunoreactive for myelin proteins—in general, such lesions are infiltrated by T cells and macrophages; (ii) inactive lesions are those with no evidence for ongoing myelin destruction and where macrophages prevail over T cells. Macrophages may be loaded with periodic acid Schiff‐positive degradation products or sudanophilic lipids, but do not contain degradation products stained by LFB and are not immunoreactive for myelin proteins; (iii) early remyelinating lesions are similar to inactive demyelinated plaques but contain myelin fibers positive for myelin proteins; and (iv) late remyelinating lesions refer to classical “shadow plaques” where conventional myelin stains depict a reduced staining intensity of the plaque (myelin pallor caused by thin myelin sheaths) compared with the periplaque white matter.
The investigator (MKS) who read the slides was blinded to the preclinical results.
Statistical analysis
For EAE, a one‐way analysis of variance (ANOVA) was used to compare the datasets using SigmaStat™ for Windows® version 3.11 (Systat Software Inc., Richmond, CA, USA). Differences between groups were analyzed using the post‐hoc Tukey test for pairwise multiple comparison. Area‐under‐the‐curve values for body weight loss and clinical grade scores were evaluated during the entire prophylactic treatment period or after the initiation of therapeutic dosing. Differences in gene expression were analyzed using the student's t‐test. Histopathological results were evaluated with the nonparametric Mann–Whitney U‐test. Probabilities (P) ≤ 0.05 were considered to be statistically significant.
RESULTS
FTY720 efficacy in EAE includes prophylactic and therapeutic therapy
Vehicle‐treated DA rats given a single injection of syngeneic CNS antigen develop an ascending and chronic disease beginning 8 to 10 days postimmunization (Figure 1), which is clinically characterized by progressive paraplegia and weight loss. In our initial efforts, we investigated an 11‐day prophylactic dosing regimen with 0.3‐mg/kg FTY720 starting on day 0 that completely prevented the onset of EAE. To evaluate the gene expression profile, CNS tissue samples were taken on day 11 and examined by real‐time PCR. A second arm of the experiment analyzed a 2‐week therapeutic treatment with FTY720, again at 0.3 mg/kg, starting on day 12 at the peak of established disease. This dosing regimen rapidly and fully reversed neurological symptoms (Figure 1), accompanied by an increase in body weight under FTY720 therapy (data not shown). In contrast, the positive controls (vehicle‐treated) exhibited a fully developed disease with sustained paraplegia (Figure 1) and a severe wasting syndrome. To investigate gene expression in this part of the study, CNS tissue samples were taken on day 29 and evaluated by real‐time PCR.
Gene expression profile during EAE
Our primary aim was to determine if FTY720 would differentially influence gene expression during EAE as a consequence of early prophylactic treatment vs. later therapeutic dosing, both at 0.3 mg/kg (Figure 1). CNS samples from FTY720‐treated DA rats on days 11 and 29 were evaluated by real‐time PCR in comparison with naïve and vehicle controls. Spinal cord evaluation was performed individually on cervical, thoracic and lumbar segments; brain samples included separate analysis of brain stem and cerebellum. Analyzed genes were selected to represent the immunological component of this disease (inflammatory mediators and immune response‐related molecules/group A genes), the extravasation/endothelial barrier complex (group B genes), myelinating and neuroplasticity aspects (group C genes), as well as—with FTY720 being a sphingolipid mimetic—S1P/LPA receptors and sphingolipid‐modifying enzymes (group D genes). All data obtained by real‐time PCR are shown in the Appendix S2. 2, 3, 4, 5, 6 show selected results that are discussed in more detail.
Figure 2.
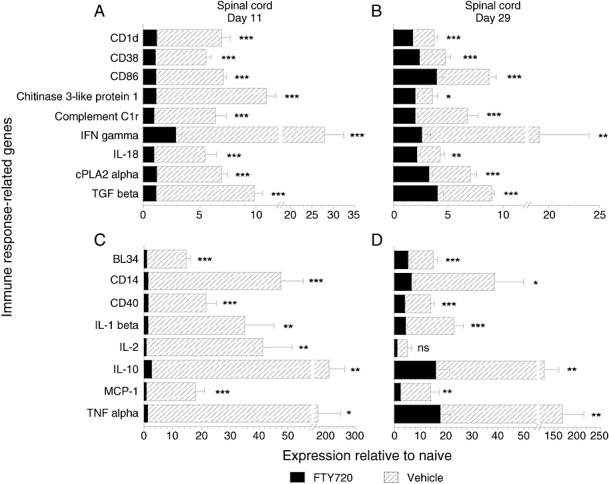
Real‐time PCR expression profile of representative inflammatory and leukocyte‐associated genes in EAE‐diseased spinal cord of DA rats, compared with FTY720 treatment. The two time points represent tissue sampling on days 11 and 29 following preventive and therapeutic treatment respectively, as depicted in Figure 1. Data represent pooled samples from cervical, thoracic and lumbar spinal cord segments (n = 3 rats/group, nine samples each), indicated as mean expression ± SEM relative to the naïve group. Panels A and B show five to 10‐fold differences between vehicle ( ) and FTY70 (▪) on days 11 and 29. Panels C and D demonstrate differences between the two groups that are >10‐fold at one or both time points. Expression levels with <fivefold differences (Appendix 2), even if significant for one or both days, are not shown. Level of significance between the vehicle and FTY720 groups was determined by a student t‐test for each gene. *P ≤ 0.05; **P ≤ 0.01; ***P ≤ 0.001. Abbreviations: PCR = polymerase chain reaction; EAE = experimental autoimmune encephalomyelitis; DA = Dark Agouti; FTY720 = fingolimod; SEM = standard error of mean.
Figure 3.
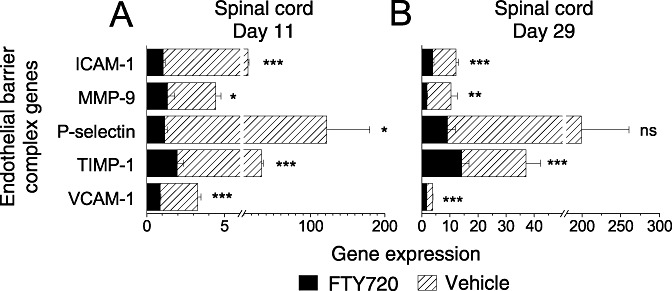
Expression of extravasation and endothelial barrier complex genes by real‐time PCR in EAE‐diseased spinal cord from DA rats on days 11 and 29 postimmunization, compared with FTY720 treatment. Data represent pooled samples from cervical, thoracic and lumbar spinal cord segments (n = 3 rats/group, nine samples each), depicted as mean expression ± SEM. Gene induction levels that we referred to in the Results were calculated as the fold‐increase relative to naïve (not shown); these sometimes differed to the absolute expression values shown here. For example, spinal cord expression ± SEM in the naïve animals (n = 6 rats) ranged from 0.93 ± 0.08 (ICAM‐1), 1.53 ± 0.46 (MMP‐9), 1.67 ± 0.15 (P‐selectin), 1.52 ± 0.14 (TIMP‐1) to 0.77 ± 0.03 (VCAM‐1). Significant differences between gene expression in the vehicle ( ) versus FTY70 (▪) groups are indicated, as determined by student t‐test. *P ≤ 0.05; **P ≤ 0.01; ***P ≤ 0.001. Abbreviations: PCR = polymerase chain reaction; EAE = experimental autoimmune encephalomyelitis; DA = Dark Agouti; FTY720 = fingolimod; SEM = standard error of mean; ns = not significant.
Figure 4.
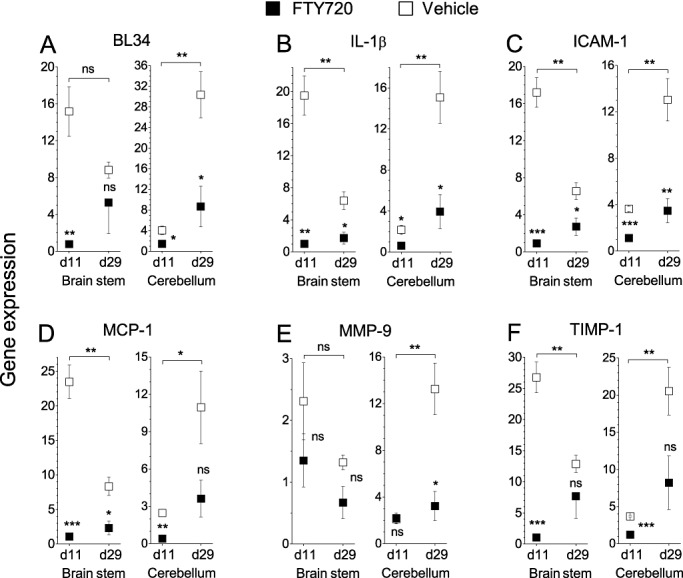
Time course of gene expression ± SEM in the brain stem and cerebellum. In most cases, vehicle‐treated animals showed a significant and reversed temporal difference in genes expressed in the brain stem and cerebellum at day 11 compared with day 29, indicated by brackets on the top of each panel. There was no significant variation in the six genes examined between day 11 and 29 in the FTY720 treatment group or compared with the naïve animals, except for a difference on day 11 in the brain stem (P = 0.04) for MCP‐1 between naïve animals. Expression ± SEM in the naïve animals (n = 6 rats) included the following for brain stem and cerebellum respectively: 0.75 ± 0.06 and 1.19 ± 0.08 (BL34), 0.39 ± 0.13 and 0.66 ± 0.14 (IL‐1β), 0.82 ± 0.05 and 1.20 ± 0.06 (ICAM‐1), 0.66 ± 0.09 and 0.80 ± 0.05 (MCP‐1), 0.31 ± 0.15 and 0.95 ± 0.14 (MMP‐9), 0.89 ± 0.04 and 1.19 ± 0.04 (TIMP‐1). Moreover, gene induction levels that we referred to in the Results were calculated as the fold‐increase relative to naïve (not shown); these sometimes differed to the absolute expression values shown here. Significant differences in gene expression between the vehicle and FTY720 groups, as determined by student t‐test, are shown at days 11 and 29 after prophylactic and therapeutic treatment, respectively. *P ≤ 0.05; **P ≤ 0.01; ***P ≤ 0.001. Abbreviations: d = day; ns = not significant.
Figure 5.
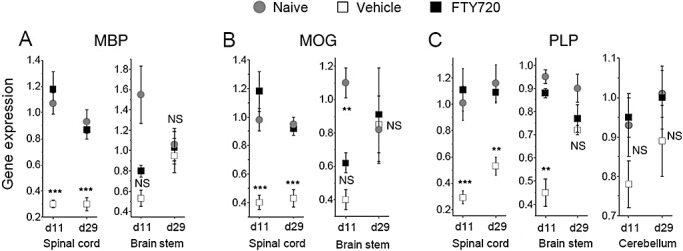
Expression of genes encoding myelin proteins. Data are depicted as mean expression ± SEM in the spinal cord and brain stem for (A) myelin basic protein (MBP), (B) myelin oligodendrocyte glycoprotein (MOG), and (C) proteolipid protein (PLP); the latter also included assessment in the cerebellum. There was no difference between FTY720 and naïve animals except for MOG on day 11 in the brain stem. Compared with the vehicle group, FTY720‐treated animals displayed a significant increase in all 3 myelin proteins in the spinal cord samples following prophylactic and therapeutic dosing (A–C). There was, in addition, a marked difference in PLP expression between vehicle and FTY720 in the brain stem on day 11. Otherwise, in the cerebellar and remaining brain stem samples expression values for naïve, FTY720 and vehicle all converged at a similar level, especially by day 29. *P ≤ 0.05; **P ≤ 0.01; ***P ≤ 0.001. Abbreviations: SEM = standard error of mean; FTY720 = fingolimod; EAE = experimental autoimmune encephalomyelitis; NS = not significant.
Figure 6.
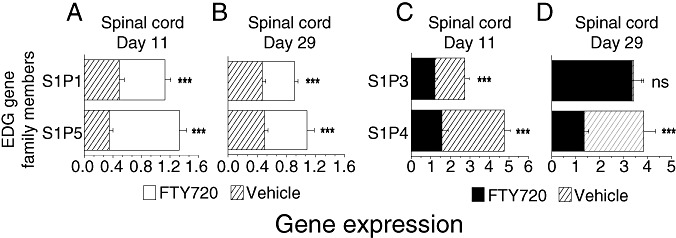
Expression of EDG family genes that are modulated by FTY720, shown as mean ± SEM. (A–B) S1P1 and S1P5 expression in the spinal cord is downregulated in the diseased animals ( ; n = 6) and significantly increased by FTY720 0.3 mg/kg treatment (□; n = 6). (C–D) The reciprocal situation occurs for S1P3 and S1P4 expression in the spinal cord, as these receptors are upregulated in the vehicle controls (
 ; n = 6) and reduced by FTY720 treatment (▪; n = 6); an exception is no difference in S1P3 on day 29. Spinal cord expression ± SEM of the S1P receptors in naïve animals (n = 6 rats) ranged from 1.16 ± 0.05 (S1P1), 1.07 ± 0.06 (S1P3), 0.60 ± 0.051 (S1P4) to 1.20 ± 0.06 (S1P5). ***P ≤ 0.001. Abbreviations: FTY720 = fingolimod; DA = Dark Agouti; EAE = experimental autoimmune encephalomyelitis; S1P = sphingosine‐1 phosphate; SEM = standard error of mean; ns = not significant.
Real‐time PCR analysis revealed low intragroup variability of gene expression and comparable results for all three spinal cord segments, which proved to be useful as an additional internal control and allowed for pooling of data. The kinetics and modulation of differentially expressed genes in the spinal cord (2, 3) and brain stem (Figure 4) followed a similar pattern; significant modulation in the cerebellum was typically delayed and restricted to the chronic phase, as shown on day 29 (Figure 4).
Most prominent changes in the prophylactic and therapeutic settings were seen in the group A genes, which were clearly upregulated in the majority of vehicle controls compared with near baseline levels with FTY720 (Appendix S2). Expression differences >10‐fold between vehicle and FTY720 were especially pronounced for B cell activation protein BL34, lipopolysaccharide (LPS) receptor CD14, costimulatory molecule CD40, cytokines IL‐1β, IL‐10 and TNFα, monocyte chemoattractant MCP‐1, and the T cell growth factor IL‐2 (Figure 2C,D). Five to 10‐fold differences between the two groups were seen for MHC class 1‐like member CD1, ectoenzyme CD38, costimulatory molecule B7‐2 (CD86), chitinase 3‐like protein 1, complement component C1r (CD35), cytosolic phospholipase 2α (cPLA2α), and cytokines IFNγ, IL‐18 and TGFβ (Figure 2A,B). FTY720‐treated animals consistently showed markedly lower expression of all 23 inflammatory and immune response‐related genes of group A, which were similar to levels in naïve rats and coincident with 100% clinical efficacy at day 11. For example, Western blot analysis (Figure 7) confirmed that FTY720 significantly normalized cPLA2α gene expression during EAE (Figure 2A,B). On the other hand, an increase of TGFβ and IL‐10 under FTY720 treatment from day 11 to 29 is consistent with their beneficial role as anti‐inflammatory cytokines during the recovery phase in DA rats. Finally, to assess the balance of pro and anti‐inflammatory cytokines under FTY720 therapy, we compared the ratio of IFNγ with TGFβ gene expression because of their differential roles as immune response mediators. Following prophylactic dosing, the brain stem IFNγ/TGFβ ratio ± standard error of mean (SEM) from the vehicle‐treated animals was markedly higher than in the FTY720 group (12.4 ± 1.9 vs. 2.0 ± 0.5 respectively; P = 0.006), primarily because of massive levels of IFNγ in the vehicle control; there was no significant change on day 11 in the cerebellar or spinal cord samples. By day 29, the IFNγ/TGFβ ratio was consistently higher in the vehicle group compared with FTY720 therapeutic treatment, both in the spinal cord (0.67 ± 0.06 vs. 0.21 ± 0.03; P = 0.002) and cerebellum (0.38 ± 0.02 vs. 0.17 ± 0.02; P = 0.002), respectively.
Figure 7.
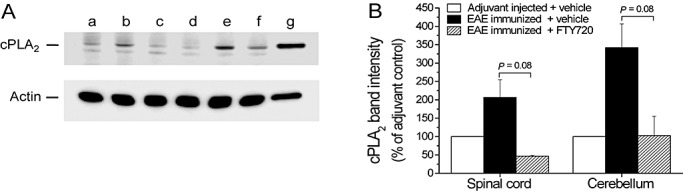
Western blot analysis of cPLA2 protein levels in the cerebellum and spinal cord from an EAE study in DA rats, immunized with syngeneic CNS antigens. (A) Nitrocellulose membrane with cerebellum samples, probed with anti‐cPLA2 antibodies or antibodies to actin as a control for total protein input. The samples were pooled from two to three rats in each experimental group and include CFA‐injected adjuvant control (lane a), EAE‐immunized/vehicle treated (lanes b, e, f), EAE‐immunized/treated with 0.05 mg/kg FTY720 (lane c), or with 0.3 mg/kg FTY720 (lane d); RBL‐2H3 cell lysate was used as a positive control (lane g). FTY720 and vehicle treatment was performed in a therapeutic setting from days 12 to 28 postimmunization. (B) Scans of cPLA2 Western blotting signals ± SEM for cerebellum and spinal cord samples. The band intensity was adjusted to 100% for the negative (adjuvant) control. Diseased animals showed a clear trend toward elevated cPLA2, in contrast with a reduction to background levels under FTY720 (0.3 mg/kg) treatment. Differences between the vehicle and FTY720 were analyzed by a one‐way ANOVA, followed by a post‐hoc Tukey test. Abbreviations: EAE = experimental autoimmune encephalomyelitis; DA = Dark Agouti; CNS = central nervous system; CFA = complete Freund's adjuvant; FTY720 = fingolimod; SEM = standard error of mean; PCR = polymerase chain reaction; ANOVA = analysis of variance.
Extravasation of immune cells from vessels into the CNS parenchyma occurs across a leaky BBB during EAE development 1, 23, illustrated in addition by the Ig disposition shown in Figure 8B–C. As vascular adhesion molecules facilitate the transendothelial cell migration of leukocytes, we evaluated the expression of ICAM‐1, P‐selectin and VCAM‐1. All three genes showed significantly higher expression in diseased animals compared with the naïve control (Figure 3, Appendix S2). Following preventive and therapeutic dosing with FTY720, expression of these adhesion molecule genes was normalized to levels that were only slightly elevated above the naïve background, as detailed in the legend for Figure 3.
Figure 8.
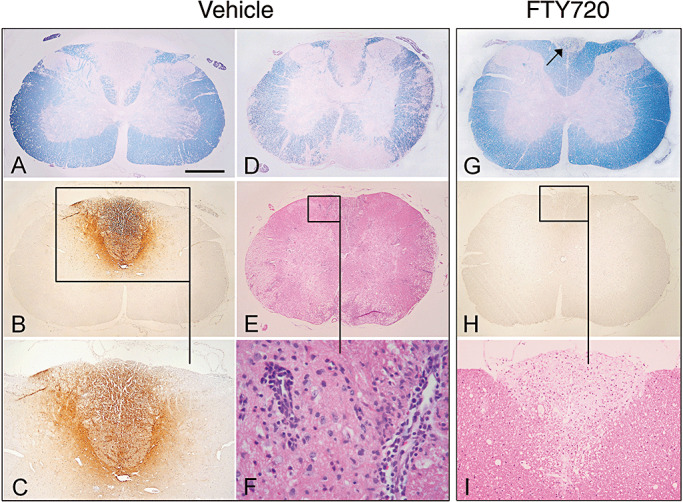
Representative EAE spinal cord histopathology in DA rats treated on days 40–53 with vehicle (A–F) or 0.3 mg/kg FTY720 (G–I). Luxol fast blue staining of cervical and thoracic cross‐sections of the spinal cord shows large areas of confluent demyelination in control rats (A,D). Following FTY720 therapy, confluent demyelination is restricted to the dorsal column of the cervical cord (G, arrow); traces of perivascular demyelination are found in the thoracic cord (data not shown). Serial cross‐sections from spinal cords A,D (vehicle) and G (FTY720) also were stained with H&E and for antirat Ig. In the vehicle controls, active demyelination is associated with extensive Ig precipitation (B,C), reflecting BBB damage; perivascular infiltrates are present within the lesion, as well as in nondemyelinated areas (F). In contrast, FTY720‐treated animals show inactive demyelination with no Ig deposition (H). H&E reveals only sparse infiltration of the lesion (I), mainly containing ED1+ macrophages (data not shown); no perivascular inflammatory infiltrates are present within the lesion. Scale bar, depicted in A for all = 500 µm (A,B,D,E,G,H), 260 µm (C,I), and 30 µm (F). Abbreviations: EAE = experimental autoimmune encephalomyelitis; DA = Dark Agouti; FTY720 = fingolimod; BBB = blood‐brain‐barrier; H&E = hematoxylin and eosin; Ig = immunoglobulin.
Further invasion of immunocompetent cells into the CNS, that is, leukocyte passage across the glia limitans by cleavage of dystroglycan, was recently shown to be fully dependent on the matrix metalloproteinase MMP‐9 (32). To examine this process more closely by real‐time PCR, we concentrated on MMP‐9 and its counterregulator—tissue inhibitor of metalloproteinase, TIMP‐1. The serum ratio of these two molecules is reported to be impaired (high MMP‐9/TIMP‐1) in patients with relapsing–remitting MS (7). It is interesting to note that in the EAE spinal cord (vehicle control), a threefold induction of MMP‐9 at day 11 and a sevenfold increase at day 29 (Figure 3) is well counterbalanced by TIMP‐1 expression (22 and 24‐fold induction at day 11 and 29, respectively). Likewise in the brain stem and cerebellum of vehicle controls at day 11, MMP‐9 was induced by eight and twofold respectively, in concert with a 30‐fold (brain stem) and threefold (cerebellum) induction of TIMP‐1 (Figure 4E,F). By day 29, the cerebellum expressed a marked increase in MMP‐9 and TIMP‐1 genes (14 and 17‐fold induction respectively); on this same day in the brain stem, we observed a fourfold induction of MMP‐9 and 14.5‐fold increase in TIMP‐1 (Figure 4E,F). In contrast, FTY720 normalized the aberrant expression for MMP‐9 in the spinal cord and cerebellum after prophylactic and therapeutic dosing (3, 4), showing no difference to the background expression in naïve animals. This was counterbalanced by an upregulation of TIMP‐1 expression in the spinal cord between day 11 and 29, including an increase on day 29 under FTY720 therapy compared with naïve animals. Moreover, the MMP‐9/TIMP‐1 ratio ± SEM was 53%, 15% and 39% lower in the spinal cord (0.13 ± 0.01), brain stem (0.09 ± 0.03) and cerebellum (0.39 ± 0.15) respectively, compared with the vehicle on day 29. Therefore, the proteolytic balance between MMP‐9 and TIMP‐1 in FTY720‐treated animals would favor preservation of BBB integrity.
Because FTY720 effectively reversed clinical and neuropathologic symptoms in fully established EAE (Figure 1), we investigated the expression of genes encoding myelin proteins. Whereas the diseased controls (vehicle) showed a marked decrease in MBP, MOG and PLP expression, FTY720 treatment restored expression levels of these genes to that comparable in the naïve DA rats (Figure 5). This effect was most pronounced in the spinal cord, and, more importantly, was also evident after therapeutic treatment by day 29.
For the sphingolipid‐modifying enzymes in group D, a pronounced modulation by FTY720 was only observed for the S1P degrading‐enzyme SPL. An approximate fivefold increase in SPL was seen in all spinal cord segments in the vehicle‐treated group at days 11 and 29, with a twofold increase in both brain segments by day 29 (Appendix S2). FTY720 significantly reduced SPL expression in the spinal cord, brain stem and cerebellum following prophylactic and therapeutic treatment. Ex vivo analysis of brain tissue homogenates showed a concomitant increase in SPL enzyme activity in the EAE‐diseased samples (DM, data not shown). In the context of resident CNS cells, it is interesting that the relative expression of four S1P receptors in normal, diseased and FTY720‐treated animals also grossly changes. While S1P1 and S1P5 receptors in the spinal cord are two to threefold downregulated by the disease, FTY720 treatment restored expression levels (Figure 6A,B). On the other hand, the S1P3 and S1P4 in the spinal cord are upregulated two to fourfold and six to eightfold, respectively. FTY720 normalized the expression of these S1P receptors, except for no difference in S1P3 at day 29 (Figure 6C,D); a similar profile was observed in both the brain stem and cerebellum.
Neuropathology at the beginning and end of late‐stage FTY720 rescue therapy
With the above results in mind, a late‐stage rescue therapy with FTY720 (0.3 mg/kg) was undertaken whereby rats with protracted and severe EAE were randomized and treated from day 40 to 53 vs. vehicle. In agreement with our hypothesis, derived from the gene profiling experiment, that delayed therapy would also translate into a clinical benefit, FTY720 was able to markedly reverse the established neurologic symptoms to a residual deficit in tail tonus during the 2‐week treatment (Figure 1). These animals were sacrificed on day 54 and compared with the histopathological profile on day 40 at the initiation of treatment.
EAE‐diseased animals exhibited demyelination in the spinal cord and brain at around day 40 in addition to inflammatory cell infiltration (Figure 9); actively demyelinating and inactive demyelinated lesions occurred side by side based on the criteria 10, 29, 38 defined in the Methods. At day 54, vehicle‐treated rats displayed large confluent demyelination in the spinal cord, medulla oblongata and cerebellar white matter. The largest lesions occurred in the spinal cord, with minor ones at other CNS sites (Figure 8A–F). Active demyelinating lesions containing myelin degradation products positive for myelin proteins were seen in five of the six rats (Table 1). Plaques with actively demyelinating edges and an inactive plaque center were frequently detected; one control animal showed only inactive lesions. In addition to active and inactive lesions, early and late remyelinating lesions in the brain and Schwann cell remyelinated areas in the spinal cord were found. Active demyelination was associated with Ig precipitation (Figure 8B,C), reflecting BBB damage. Active lesions were heavily infiltrated by T cells and macrophages, while macrophages prevailed in the inactive lesions.
Figure 9.
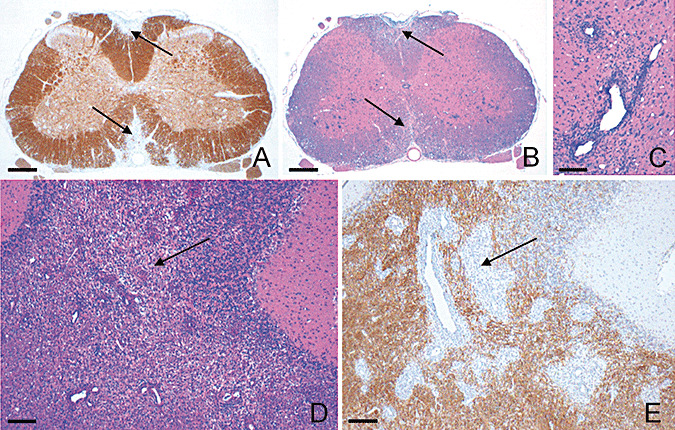
Neuropathology in EAE‐diseased DA rats (n = 4) on day 40, demonstrating representative images of brain and spinal cord damage after immunization with syngeneic CNS antigens and prior to initiation of FTY720 rescue therapy. Sequential cross‐sections of spinal cord show overlying areas of focal demyelination (A, anti‐MBP) and inflammation (B, H&E), as highlighted by the arrows; (C) high‐power H&E depicts typical perivascular inflammation. Sections of the cerebellum illustrate areas of extensive inflammation (D, H&E) which coincides with demyelination (E, anti‐MBP), exemplified by the arrows. Scale bars: A, B = 330 µm; C = 60 µm; D,E = 200 µm. Abbreviations: DA = Dark Agouti; EAE = experimental autoimmune encephalomyelitis; CNS = central nervous system; FTY720 = fingolimod; anti‐MBP = myelin basic protein; H&E = hematoxylin and eosin.
Table 1.
Summary of inflammation and demyelination in vehicle vs. FTY720 groups. Abbreviations: FTY720 = fingolimod; SEM = standard error of the mean.
| Inflammatory index ± SEM | % demyelination of spinal cord ± SEM | Status of lesions | Precipitation of immunoglobulin | |
|---|---|---|---|---|
| Vehicle | 1.12 ± 0.3 | 23.15 ± 3.6 | Active (5/6) | Yes (5/6) |
| Inactive (6/6) | No (6/6) | |||
| FTY720 | 0.09 ± 0.01 | 3.48 ± 0.8 | Active (0/6) | No (6/6) |
| Inactive (6/6) | No (6/6) | |||
| P value* | P = 0.007 | P = 0.004 |
Results were evaluated with the nonparametric Mann–Whitney U‐test.
FTY720 rescue therapy for 2 weeks dramatically reversed the incidence of inflammatory infiltrates, as well as the extent of other neuropathological findings (Table 1, Figure 8G–I). Quantification revealed that spinal cord demyelination was significantly less than in the vehicle (Table 1), with confluent areas of demyelination restricted to the dorsal column (Figure 8G); some perivascular demyelination was found in the thoracic and lumbar spinal cord. Importantly, none of these animals showed active demyelinating lesions. As seen in the vehicle controls, we also found remyelinating lesions—including Schwann cell remyelinated areas in the spinal cord; these were consistently observed, but not formally quantitated as the propensity for remyelination in our EAE model does not follow an exact temporal sequence of remyelinating events. Most impressively, there was no evidence for Ig precipitation, and therefore BBB breakdown, in any of the FTY720‐treated animals (Figure 8H; Table 1).
DISCUSSION
A frequent impediment in the treatment of neurological diseases is the BBB, which can preclude the entry of therapeutic molecules from blood to brain. We recently showed that FTY720 is unique in this respect as its physicochemical profile allows the drug to readily cross the BBB, resulting in similar brain trough levels of FTY720 and FTY720‐P (18). To more directly investigate the mode of action for FTY720 in the CNS, we analyzed the expression of 70 diverse genes after preventive and therapeutic treatment in EAE using real‐time PCR. Most inflammatory and immune response‐associated genes examined were downregulated or normalized by FTY720 (Figure 2). For example, inflammatory infiltrates in the CNS during chronic EAE typically comprise ED1+ macrophages, while T cells are less common at this late stage 41, 46. Upregulated expression of the myeloid lineage genes CD1d and CD14 in control animals reflects this pattern, which is driven by the high levels of monocyte chemoattractant MCP‐1; in contrast, these genes in the CNS were expressed at a significantly lower extent in the FTY720 group. CD1 molecules are unique in their ability to present lipid/glycolipid antigens to a variety of T cells, especially natural killer T cells (5). Of note, lipid antigens comprising the myelin sheath are thought to be important targets for autoimmune T cells and contribute to the pathogenesis of MS (39). The disease‐driven increase in CD1d expression is likely caused by in situ upregulation on microglia (11) and/or an influx of myeloid cells. Microglia are the major source of IL‐18, which induces MCP‐1 production in macrophages (48) and promotes the expression of matrix metalloproteinases along with other proinflammatory cytokines (17). The fact that FTY720 treatment leads to a reduction in IL‐18 (Figure 2) could help to interrupt the inflammatory cascade within the CNS. In addition, the ability of FTY720 to normalize levels of cPLA2α would further dampen early and late inflammatory processes, taking into account that this mediator activates the release of arachidonic acid (processed by cyclooxygenase to generate prostaglandins). For this reason, cPLA2 induction facilitates T cell differentiation toward the Th1 phenotype and plays a key role in the pathogenesis of EAE and MS (15).
During later stage of EAE development (day 29), upregulation of genes such as TNFα and the anti‐inflammatory mediators IL‐10 and TGFβ was only partially affected by FTY720 (Figure 2); the enhancement in diseased animals and the residual increased level under FTY720 therapy is consistent with the action of IL‐10 and TGFβ during recovery from a Th1‐mediated disease 34, 36. In fact, the gene expression ratio of pro to anti‐inflammatory cytokines, for example, IFNγ/TGFβ, is significantly reduced in the CNS of FTY720‐treated animals; similar findings were made in a colitis model (16). The residual TNFα expression after FTY720 treatment is in line with the concept that a modest level of this inflammatory mediator is beneficial to disease recovery 2, 47.
Intriguingly, FTY720 therapy reduced gene and protein expression of the S1P‐degrading enzyme SPL. Our findings agree with a previous study in mice that demonstrated a decrease of SPL protein levels 24 h after a single in vivo dose (1 mg/kg) of FTY720 (4). Reduction of this S1P‐degrading enzyme would be expected to raise the S1P concentration in the brain, which, together with the FTY720‐P levels (18), could result in an enhanced or altered triggering of S1P receptors expressed by neuronal progenitor cells and resident glial cells.
Regarding resident CNS cells, the expression pattern of S1P receptors in the brain during EAE differed from the one of naïve animals. In fact, the nervous system is a major locus for constitutive S1P receptor expression in glial cells (astrocytes, microglial, oligodendrocytes) and neurons (21). Fascinating is the observation that FTY720 enhanced the CNS expression of S1P1 and S1P5 receptors while reducing S1P3 and S1P4, thus normalizing the aberrant expression pattern of these receptors. Our data suggest that FTY720 upregulates S1P levels, which, together with FTY720‐P (18), might preferentially trigger the reinforced S1P1 and S1P5 signaling cascades while attenuating signals from the S1P3 and S1P4 receptors. The S1P1 receptor is involved in neurogenesis and widely expressed on CNS cells (21). In contrast, the CNS expression pattern of S1P5 is restricted to myelin‐producing oligodendrocytes 42, 49. Subsequent to the discovery that S1P acts as a key regulator of cell growth, it has become increasingly clear that this sphingolipid mediator may induce the survival of such cells in the CNS. Indeed, studies have demonstrated that FTY720‐P promotes the survival of oligodendroglial lineage cells in vitro 12, 24, 33. Of note, FTY720 therapy also restored the disease‐driven downregulation of neuroplasticity‐related genes encoding (i) the neurotrophins NTF3 and NTF5 that act as modulators of neuronal function and survival (43); (ii) plasticity‐related enzymes (8); and (iii) neuronal pentraxin 1, which is critical for recruiting the neurotransmitter receptor GluR4 to synapses (40) (Appendix S2).
Normal clinical recovery from EAE is attributable to remyelination of fibers in both the CNS and the peripheral nervous system where most demyelinated fibers have been at least partially repaired by oligodendrocytes or Schwann cells, respectively (35). Our histology findings on day 54 did indeed show that FTY720 rescue therapy resulted in remyelination, but only at a level that also was found in the vehicle‐treated animals. Considering this and the fact that FTY720 exhibits remarkable reversal of late‐stage neurological deficits, it was relevant to evaluate its effect on myelin genes. In the spinal cord, we observed normalization of MBP, MOG and PLP expression by day 29 compared with a reduction in the diseased animals (Figure 5); interestingly, this coincided with an upregulation in the spinal cord of the oligodendrocyte‐expressing receptor S1P5 (Figure 6). In the brain, however, FTY720 did not significantly influence the expression of S1P5 (Appendix S2) or myelin genes at day 29. As neurological recovery classically takes place in a rostral to caudal fashion, we suggest that our real‐time PCR analyses failed to capture the time point when oligodendrocytes in the brain stem and cerebellum would be involved in remyelination. For future studies, a demyelinating model must be used where the temporal sequence of remyelination can be precisely quantified.
To investigate if the observed influence of FTY720 on myelin proteins, S1P receptors and SPL would translate into a clinical benefit at chronic phases of the disease, a late‐stage rescue therapy with FTY720 was undertaken, whereby DA rats with protracted and severe EAE were treated from day 40 to 53. Here we show that oral monotherapy with FTY720, even 1 month after disease onset, effectively rescued the paralyzed animals and reversed neurological deficits. The significant reduction in actively demyelinating lesions in the spinal cord following FTY720 treatment (Table 1) implies rapid blockade of ongoing disease processes and structural restoration of the CNS parenchyma in keeping with its ability to repair damage to the nerve conductance pathways (3). FTY720 also fully stopped and reversed leakiness of the BBB, as indicated by the lack of Ig deposits.
Leukocyte penetration of the BBB is dependent on vascular adhesion molecules in concert with matrix metalloproteinases such as MMP‐9, which degrade basement membranes surrounding the blood vessels 1, 14. MMP‐9 activity in turn is counterregulated by TIMP‐1. During the course of FTY720 therapy, we observed a trend toward a decrease in MMP‐9 and an increase in TIMP‐1 gene expression (2, 3), resulting in a proteolytic balance that would favor preservation of BBB integrity. FTY720‐mediated downregulation of ICAM‐1, P‐selectin and VCAM‐1 would also reduce the entry of pathogenic lymphocytes into the CNS. As expected, decreased levels of the gene encoding Edg6/S1P4 receptor (selective for rat leukocytes) following FTY720 therapy directly correlated with a marked reduction in inflammatory infiltrates and an improvement in the neuropathology profile.
In conclusion, prophylactic treatment with FTY720 clearly results in complete suppression of EAE. Therapeutic treatment is also similarly efficient, as shown by our clinical and histopathological results in addition to the normalized expression for most of the genes examined. Even more impressively, our data demonstrate for the first time that late‐stage rescue therapy with FTY720 is remarkably effective in reversing neurologic deficits. The protective effects of FTY720 on demyelination and BBB permeability are believed to be caused, at least in part, by direct modulation of microvascular and/or glial cells in the CNS (18) and inhibition of autoimmune cell infiltration. Our data also suggest that neuroplasticity and regenerative genes are positively influenced by FTY720 therapy, a finding which is under further investigation.
CONFLICT OF INTEREST DISCLOSURE
The authors declare no competing financial interests.
Supporting information
Appendix S1. Sequences of rat primers for real‐time PCR.
Appendix S2. Gene expression by real‐time PCR. Shaded values represent a ≥twofold significant difference between vehicle and naïve or between FTY720 and vehicle (n = 3 rats/group). Outlined values indicate a ≥twofold significant difference between FTY720 and naïve. Outlined and shaded values show a ≥twofold significant difference between FTY720 compared with both naïve and vehicle; all analyses were performed by a pairwise t‐test.
This material is available as part of the online article from: http://www.blackwellsynergy.com
Please note: Blackwell Publishing is not responsible for the content or functionality of any supplementary materials supplied by the authors. Any queries (other than missing material) should be directed to the corresponding author for the article.
Supporting info item
Supporting info item
ACKNOWLEDGMENTS
We thank Andreas Billich for the review of the manuscript, Peter Nussbaumer for preparing the hexadecenal reference compound, Robert Weissert and Sara Mangialaio for helpful discussions, Marijke Nefzger for statistical analysis, as well as Christine Graf, Agnieszka Koziel, Philip Price, Eva‐Marie Swoboda and Vinzenz Schönborn‐Buchheim for their steadfast technical assistance. This study was supported by Novartis Pharma AG.
REFERENCES
- 1. Alt C, Duvefelt K, Franzén B, Yang Y, Engelhardt B (2005) Gene and protein expression profiling of the microvascular compartment in experimental autoimmune encephalomyelitis in C57Bl/6 and SJL mice. Brain Pathol 15:1–16. [DOI] [PMC free article] [PubMed] [Google Scholar]
- 2. Arnett HA, Wang Y, Matsushima GK, Suzuki K, Ting JP‐Y (2003) Functional genomic analysis of remyelination reveals importance of inflammation in oligodendrocyte regeneration. J Neurosci 23:9824–9832. [DOI] [PMC free article] [PubMed] [Google Scholar]
- 3. Balatoni B, Storch MK, Swoboda EM, Schönborn V, Koziel A, Lambrou GN et al (2007) FTY720 sustains and restores neuronal function in MOG‐induced experimental autoimmune encephalomyelitis. Brain Res Bull 74:307–316. [DOI] [PubMed] [Google Scholar]
- 4. Bandhuvula P, Tam YY, Oskouian B, Saba JD (2005) The immune modulator FTY720 inhibits sphingosine‐1‐phosphate lyase activity. J Biol Chem 280:33697–33700. [DOI] [PubMed] [Google Scholar]
- 5. Barral DC, Brenner MB (2007) CD1 antigen presentation: how it works. Nat Rev Immunol 7:929–941. [DOI] [PubMed] [Google Scholar]
- 6. Baumruker T, Billich A, Brinkmann V (2007) FTY720, an immunomodulatory sphingolipid mimetic: translation of a novel mechanism into clinical benefit in multiple sclerosis. Expert Opin Investig Drugs 16:283–289. [DOI] [PubMed] [Google Scholar]
- 7. Boz C, Ozmenoglu M, Velioglu S, Kilinc K, Orem A, Alioglu Z, Altunayoglu V (2006) Matrix metalloproteinase‐9 (MMP‐9) and tissue inhibitor of matrix metalloproteinase (TIMP‐1) in patients with relapsing‐remitting multiple sclerosis treated with interferon beta. Clin Neurol Neurosurg 108:124–128. [DOI] [PubMed] [Google Scholar]
- 8. Bräuer AU, Savaskan NE, Kühn H, Prehn S, Ninnemann O, Nitsch R (2003) A new phospholipid phosphatase, PRG‐1, is involved in axon growth and regenerative sprouting. Nat Neurosci 6:572–578. [DOI] [PubMed] [Google Scholar]
- 9. Brinkmann V, Davis MD, Heise CE, Albert R, Cottens S, Hof R et al (2002) The immune modulator FTY720 targets sphingosine 1‐phosphate receptors. J Biol Chem 277:21453–21457. [DOI] [PubMed] [Google Scholar]
- 10. Brück W, Porada P, Poser S, Rieckmann P, Hanefeld F, Kretzschmar HA, Lassmann H (1995) Monocyte/macrophage differentiation in early multiple sclerosis lesions. Ann Neurol 38:788–796. [DOI] [PubMed] [Google Scholar]
- 11. Bußhoff U, Hein A, Iglesias A, Dörries R, Régnier‐Vigouroux A (2001) CD1 expression is differentially regulated by microglia, macrophages and T cells in the central nervous system upon inflammation and demyelination. J Neuroimmunol 113:220–230. [DOI] [PubMed] [Google Scholar]
- 12. Coelho RP, Payne SG, Bittman R, Spiegel S, Sato‐Bigbee C (2007) The immunomodulator FTY720 has a direct cytoprotective effect in oligodendrocyte progenitors. J Pharmacol Exp Ther 323:626–635. [DOI] [PubMed] [Google Scholar]
- 13. Comabella M, Martin R (2007) Genomics in multiple sclerosis—current state and future directions. J Neuroimmunol 187:1–8. [DOI] [PubMed] [Google Scholar]
- 14. Cunningham LA, Wetzel M, Rosenberg GA (2005) Multiple roles for MMPs and TIMPs in cerebral ischemia. Glia 50:329–339. [DOI] [PubMed] [Google Scholar]
- 15. Cunningham TJ, Yao L, Oetinger M, Cort L, Blankenhorn EP, Greenstein JI (2006) Secreted phospholipase A2 activity in experimental autoimmune encephalomyelitis and multiple sclerosis. J Neuroinflammation 3:26–33. [DOI] [PMC free article] [PubMed] [Google Scholar]
- 16. Daniel C, Sartory N, Zahn N, Geisslinger G, Radeke HH, Stein JM (2007) FTY720 ameliorates Th1‐mediated colitis in mice by directly affecting the functional activity of CD4+CD25+ regulatory T cells. J Immunol 178:2458–2468. [DOI] [PubMed] [Google Scholar]
- 17. Felderhoff‐Mueser U, Schmidt OI, Oberholzer A, Bührer C, Stahel PF (2005) IL‐18: a key player in neuroinflammation and neurodegeneration? Trends Neurosci 28:487–493. [DOI] [PubMed] [Google Scholar]
- 18. Foster CA, Howard LM, Schweitzer A, Persohn E, Hiestand PC, Balatoni B et al (2007) Brain penetration of the oral immunomodulatory drug FTY720 and its phosphorylation in the central nervous system during experimental autoimmune encephalomyelitis: consequences for mode of action in multiple sclerosis. J Pharmacol Exp Ther 323:1–8. [DOI] [PubMed] [Google Scholar]
- 19. Fujino M, Funeshima N, Kitazawa Y, Kimura H, Amemiya H, Suzuki S, Li X‐K (2003) Amelioration of experimental autoimmune encephalomyelitis in Lewis rats by FTY720 treatment. J Pharmacol Exp Ther 305:70–77. [DOI] [PubMed] [Google Scholar]
- 20. Hafler DA, Compston A, Sawcer S, The International Multiple Sclerosis Genetics Consortium (2007) Risk alleles for multiple sclerosis identified by a genomewide study. N Engl J Med 357:851–862. [DOI] [PubMed] [Google Scholar]
- 21. Herr DR, Chun J (2007) Effects of LPA and S1P on the nervous system and implications for their involvement in disease. Curr Drug Targets 8:155–167. [DOI] [PubMed] [Google Scholar]
- 22. Hiestand PC, Rausch M, Piani Meier D, Foster CA (2008) Ascomycete derivative to MS therapeutic: S1P receptor modulator FTY720. In: Natural Products as Drugs. Prog Drug Res. Petersen F, Amstutz R (eds), 66:362–381. Springer‐Birkhäuser Verlag: Basel, Switzerland. [DOI] [PubMed] [Google Scholar]
- 23. Jorgensen SH, Storm N, Jensen PE, Laursen H, Sorensen PS (2007) IVIG enters the central nervous system during treatment of experimental autoimmune encephalomyelitis and is localised to inflammatory lesions. Exp Brain Res 178:462–469. [DOI] [PubMed] [Google Scholar]
- 24. Jung CG, Kim HJ, Miron VE, Cook S, Kennedy TE, Foster CA et al (2007) Functional consequences of S1P receptor modulation in rat oligodendroglial lineage cells. Glia 55:1656–1667. [DOI] [PubMed] [Google Scholar]
- 25. Kappos L, Antel J, Comi G, Montalban X, O'Connor P, Polman CH et al (2006) Oral fingolimod (FTY720) for relapsing multiple sclerosis. N Engl J Med 355:1124–1140. [DOI] [PubMed] [Google Scholar]
- 26. Kataoka H, Sugahara K, Shimano K, Teshima K, Koyama M, Fukunari A, Chiba K (2005) FTY720, sphingosine 1‐phosphate receptor modulator, ameliorates experimental autoimmune encephalomyelitis by inhibition of T cell infiltration. Cell Mol Immunol 2:439–448. [PubMed] [Google Scholar]
- 27. Kutzelnigg A, Faber‐Rod JC, Bauer J, Lucchinetti CF, Sorensen PS, Laursen H et al (2007) Widespread demyelination in the cerebellar cortex in multiple sclerosis. Brain Pathol 17:38–44. [DOI] [PMC free article] [PubMed] [Google Scholar]
- 28. Lorentzen JC, Issazadeh S, Storch M, Mustafa MI, Lassmann H, Linington C et al (1995) Protracted, relapsing and demyelinating experimental autoimmune encephalomyelitis in DA rats immunized with syngeneic spinal cord and incomplete Freund's adjuvant. J Neuroimmunol 63:193–205. [DOI] [PubMed] [Google Scholar]
- 29. Lucchinetti C, Brück W, Parisi J, Scheithauer B, Rodriguez M, Lassmann H (1999) A quantitative analysis of oligodendrocytes in multiple sclerosis lesions. A study of 113 cases. Brain 122:2279–2295. [DOI] [PubMed] [Google Scholar]
- 30. Mandala S, Hajdu R, Bergstrom J, Quackenbush E, Xie J, Milligan J et al (2002) Alteration of lymphocyte trafficking by sphingosine 1‐phosphate receptor agonists. Science 296:346–349. [DOI] [PubMed] [Google Scholar]
- 31. Mechtcheriakova D, Wlachos A, Sobanov J, Kopp T, Reuschel R, Bornancin F et al (2007) Sphingosine 1‐phosphate phosphatase 2 is induced during inflammatory responses. Cell Signal 19:748–760. [DOI] [PubMed] [Google Scholar]
- 32. Michaluk P, Kolodziej L, Mioduszewska B, Wilczynski GM, Dzwonek J, Jaworski J et al (2007) β‐dystroglycan as a target for MMP‐9, in response to enhanced neuronal activity. J Biol Chem 282:16036–16041. [DOI] [PubMed] [Google Scholar]
- 33. Miron VE, Jung CG, Kim HJ, Kennedy TE, Soliven B, Antel JP (2008) FTY720 modulates human oligodendrocyte progenitor process extension and survival. Ann Neurol 63:61–71. [DOI] [PubMed] [Google Scholar]
- 34. O'Garra A, Vieira P (2007) TH1 cells control themselves by producing interleukin‐10. Nat Rev Immunol 7:425–428. [DOI] [PubMed] [Google Scholar]
- 35. Pender MP (1989) Recovery from acute experimental allergic encephalomyelitis in the Lewis rat. Early restoration of nerve conduction and repair by Schwann cells and oligodendrocytes. Brain 112:393–416. [DOI] [PubMed] [Google Scholar]
- 36. Rubtsov YP, Rudensky AY (2007) TGFβ signalling in control of T‐cell‐mediated self‐reactivity. Nat Rev Immunol 7:443–453. [DOI] [PubMed] [Google Scholar]
- 37. Sawcer S, Ban M, Maranian M, Yeo TW, Compston A, Kirby A et al (2005) A high‐density screen for linkage in multiple sclerosis. Am J Hum Genet 77:454–467. [DOI] [PMC free article] [PubMed] [Google Scholar]
- 38. Seifert T, Bauer J, Weissert R, Fazekas F, Storch MK (2005) Differential expression of sonic hedgehog immunoreactivity during lesion evolution in autoimmune encephalomyelitis. J Neuropathol Exp Neurol 64:404–411. [DOI] [PubMed] [Google Scholar]
- 39. Shamshiev A, Donda A, Carena I, Mori L, Kappos L, De Libero G (1999) Self glycolipids as T‐cell autoantigens. Eur J Immunol 29:1667–1675. [DOI] [PubMed] [Google Scholar]
- 40. Sia G‐M, Béïque J‐C, Rumbaugh G, Cho R, Worley PF, Huganir RL (2007) Interaction of the N‐terminal domain of the AMPA receptor GluR4 subunit with the neuronal pentraxin NP1 mediates GluR4 synaptic recruitment. Neuron 55:87–102. [DOI] [PubMed] [Google Scholar]
- 41. Storch MK, Stefferl A, Brehm U, Weissert R, Wallström E, Kerschensteiner M et al (1998) Autoimmunity to myelin oligodendrocyte glycoprotein in rats mimics the spectrum of multiple sclerosis pathology. Brain Pathol 8:681–694. [DOI] [PMC free article] [PubMed] [Google Scholar]
- 42. Terai K, Soga T, Takahashi M, Kamohara M, Ohno K, Yatsugi S et al (2003) Edg‐8 receptors are preferentially expressed in oligodendrocyte lineage cells of the rat CNS. Neuroscience 116:1053–1062. [DOI] [PubMed] [Google Scholar]
- 43. Tucker KL, Meyer M, Barde Y‐A (2001) Neurotrophins are required for nerve growth during development. Nat Neurosci 4:29–37. [DOI] [PubMed] [Google Scholar]
- 44. Van Veldhoven PP (2000) Sphingosine‐1‐phosphate lyase. Methods Enzymol 311:244–254. [DOI] [PubMed] [Google Scholar]
- 45. Webb M, Tham C‐S, Lin F‐F, Lariosa‐Willingham K, Yu N, Hale J et al (2004) Sphingosine 1‐phosphate receptor agonists attenuate relapsing‐remitting experimental autoimmune encephalitis in SJL mice. J Neuroimmunol 153:108–121. [DOI] [PubMed] [Google Scholar]
- 46. Weissert R, Wallström E, Storch MK, Stefferl A, Lorentzen J, Lassmann H et al (1998) MHC haplotype‐dependent regulation of MOG‐induced EAE in rats. J Clin Invest 102:1265–1273. [DOI] [PMC free article] [PubMed] [Google Scholar]
- 47. Wyss‐Coray T, Mucke L (2002) Inflammation in neurodegenerative disease—a double‐edged sword. Neuron 35:419–432. [DOI] [PubMed] [Google Scholar]
- 48. Yoo JK, Kwon H, Khil L‐Y, Zhang L, Jun H‐S, Yoon J‐W (2005) IL‐18 induces monocyte chemotactic protein‐1 production in macrophages through the phosphatidylinositol 3‐kinase/Akt and MEK/ERK1/2 pathways. J Immunol 175:8280–8286. [DOI] [PubMed] [Google Scholar]
- 49. Yu N, Lariosa‐Willingham KD, Lin F‐F, Webb M, Rao TS (2004) Characterization of lysophosphatidic acid and sphingosine‐1‐phosphate‐mediated signal transduction in rat cortical oligodendrocytes. Glia 45:17–27. [DOI] [PubMed] [Google Scholar]
Associated Data
This section collects any data citations, data availability statements, or supplementary materials included in this article.
Supplementary Materials
Appendix S1. Sequences of rat primers for real‐time PCR.
Appendix S2. Gene expression by real‐time PCR. Shaded values represent a ≥twofold significant difference between vehicle and naïve or between FTY720 and vehicle (n = 3 rats/group). Outlined values indicate a ≥twofold significant difference between FTY720 and naïve. Outlined and shaded values show a ≥twofold significant difference between FTY720 compared with both naïve and vehicle; all analyses were performed by a pairwise t‐test.
This material is available as part of the online article from: http://www.blackwellsynergy.com
Please note: Blackwell Publishing is not responsible for the content or functionality of any supplementary materials supplied by the authors. Any queries (other than missing material) should be directed to the corresponding author for the article.
Supporting info item
Supporting info item