

Abstract
Chronic neuroinflammation correlates with cognitive decline and brain atrophy in Alzheimer's disease (AD), and cytokines and chemokines mediate the inflammatory response. However, quantitation of cytokines and chemokines in AD brain tissue has only been carried out for a small number of mediators with variable results. We simultaneously quantified 17 cytokines and chemokines in brain tissue extracts from controls (n = 10) and from patients with and without genetic forms of AD (n = 12). Group comparisons accounting for multiple testing revealed that monocyte chemoattractant protein‐1 (MCP‐1), interleukin‐6 (IL‐6) and interleukin‐8 (IL‐8) were consistently upregulated in AD brain tissue. Immunohistochemistry for MCP‐1, IL‐6 and IL‐8 confirmed this increase and determined localization of these factors in neurons (MCP‐1, IL‐6, IL‐8), astrocytes (MCP‐1, IL‐6) and plaque pathology (MCP‐1, IL‐8). Logistic linear regression modeling determined that MCP‐1 was the most reliable predictor of disease. Our data support previous work on significant increases in IL‐6 and IL‐8 in AD but indicate that MCP‐1 may play a more dominant role in chronic inflammation in AD.
Keywords: Alzheimer's Disease, inflammation, Monocyte Chemotactic Protein‐1
INTRODUCTION
Chronic neuroinflammation is considered a propagating factor for neurodegeneration in Alzheimer's disease (AD), (1, 16, 19) with the severity of neuroinflammation correlating with the degree of tissue loss (6) and cognitive decline (32). Cytokines and chemokines are important mediators of inflammation. The identification of interleukin‐1β (IL‐1β) (17), interleukin‐6 (IL‐6) (3, 20), tumor necrosis factor‐α (TNF‐α, (8), monocyte chemoattractant protein‐1 (MCP‐1) (22) and macrophage inflammatory protein‐1β (50) in senile plaques and/or associated microglia has further highlighted the importance of inflammation in AD.
Only a few studies have quantified cytokine protein levels in AD brain tissue with inconsistent results. While two studies reported an increase in IL‐1β in AD (2, 5), others could not confirm this increase using similar assays (25, 48). This is also the case for IL‐6 (25, 48). To date, only one study has quantified soluble TNF‐α in AD brain tissue and, contrary to immunohistochemical data (52), found a decrease compared to non‐AD cases (25). Similar variability has been reported using mRNA analyses of AD brain tissue. Luterman and colleagues (28) reported no detectable expression of TNF‐α in elderly patients with variable clinical dementia ratings and, in contrast to IL‐6, found very low expression levels of IL‐1β. Other studies have found no significant increase in IL‐1β, IL‐6 or TNF‐α mRNA in AD (26, 46). Despite these variable results, IL‐1β, IL‐6 and TNF‐α are considered major mediators of the inflammatory response in AD (34).
The greatest neurodegeneration occurs in AD patients with presenilin‐1 (PS1) mutations. Such patients have greater tissue (15) and neuronal (39) loss with more severe, variant neuropathology and neuroinflammation (13, 37, 38) than other forms of AD. However, inflammatory mediators have not been quantified in patients with PS1 AD.
The aim of this study was to carry out a comprehensive analysis of inflammatory mediators in AD to identify important factor(s) underpinning the neurodegenerative pathology and to determine predictors of disease. Simultaneous measurements of 17 cytokines and chemokines in brain tissue extracts from the most diverse forms of AD (PS1 and sporadic) were compared to age‐matched controls.
MATERIALS AND METHODS
Cases
Brain tissue from 12 AD (six PS1 and six sporadic) cases, and 10 age‐matched controls (five old and five young) was available for multiplex analysis (Table 1) and immunohistochemistry (Table 2). No cases or controls had evidence of systemic blood infections at autopsy, although five out of 12 AD cases died of pneumonia (Table 1). Brain tissue was obtained from the Prince of Wales Medical Research Institute Tissue Resource Centre and the University of Sydney Tissue Resource Centre. PS1 AD cases were participants in the Network for Brain Research into Mental Disorders with mutations determined using a previously described DNA screening method (24). Sporadic AD cases and controls were participants in the Australian Brain Donor Programmes. Consent for autopsy and the use of tissue for research purposes were obtained for all cases by these programs approved by the ethics committees of participating institutions and funded by the National Health and Medical Research Council of Australia. Diagnosis of AD (and no other neurodegenerative condition) or control (without neurological or neuropathological disease) was based on longitudinal clinical and systematic neuropathological assessments, as previously described (36). Clinically, all AD cases had severe end‐stage dementia (clinical dementia rating 4–5).
Table 1.
Demographics of cases used for multiplex analysis. Abbreviations: M = male; F = female; PM = post‐mortem; AD = Alzheimer's disease; PS1 = presenilin‐1.
| Case | Diagnosis | Sex | Age (years) | Disease duration (years) | PM delay (h) | Cause of death |
|---|---|---|---|---|---|---|
| 1 | AD | M | 67 | 10 | 60 | Drowning |
| 2 | AD | F | 68 | 4 | 44 | Myocardial infarction |
| 3 | AD | F | 75 | 14 | 80 | Pulmonary embolism |
| 4 | AD | F | 78 | 6 | 24 | Pneumonia |
| 5 | AD | M | 83 | 8 | 36 | Pneumonia |
| 6 | AD | F | 84 | 6 | 74 | Myocardial infarction |
| 7 | PS1 AD | F | 44 | 5 | 20 | Pneumonia |
| 8 | PS1 AD | F | 46 | 5 | 8 | Pneumonia |
| 9 | PS1 AD | M | 50 | 9 | 10 | Cardiorespiratory death |
| 10 | PS1 AD | F | 51 | 10 | 22 | Cardiorespiratory death |
| 11 | PS1 AD | M | 56 | 10 | 25 | Pneumonia |
| 12 | PS1 AD | F | 61 | 6 | 7 | Pulmonary embolism |
| 13 | Control | M | 43 | 13 | Aortic thrombosis | |
| 14 | Control | M | 46 | 25 | Myocardial infarction | |
| 15 | Control | M | 48 | 17 | Heart disease | |
| 16 | Control | M | 50 | 29 | Heart disease | |
| 17 | Control | M | 51 | 20 | Cardiac tamponade | |
| 18 | Control | F | 73 | 60 | Myocardial infarction | |
| 19 | Control | M | 74 | 48 | Ruptured aneurysm | |
| 20 | Control | F | 77 | 36 | Myocardial infarction | |
| 21 | Control | M | 79 | 60 | Pulmonary oedema | |
| 22 | Control | M | 82 | 43 | Metabolic acidosis | |
| 23 | Control | F | 83 | 24 | Carcinoma |
Table 2.
Demographics of cases used for immunohistochemistry (mean ± standard error). Abbreviations: M = male; F = female; PM = post‐mortem delay; AD = Alzheimer's disease; PS1 = presenilin‐1.
| Diagnosis | Sex (M/F) | Age ± SE (years) | Duration ± SE (years) | PM delay ± SE (h) |
|---|---|---|---|---|
| Sporadic AD | 3/3 | 84 ± 3 | 7 ± 1 | 16 ± 4.5 |
| PS1 AD | 3/3 | 48 ± 2 | 6 ± 1 | 15 ± 4.0 |
| Young controls | 5/0 | 48 ± 1 | — | 21 ± 3.0 |
| Old controls | 2/3 | 80 ± 4 | — | 24 ± 6.0 |
Protein extraction
Approximately 250 mg of tissue from the inferior temporal cortex of each case was homogenized on ice using a Potter S homogenizer (B. Braun Biotech International, Melsungen, Germany) in 2.5 mL of ice‐cold Tris‐buffered saline (TBS, pH 7.2) containing 0.02% sodium azide and the protease inhibitor cocktail, Complete™ (Roche Diagnostics, Mannheim, Germany). Homogenates were centrifuged in an ultracentrifuge (Beckman Instruments Inc., Palo Alto, CA, USA) at 120 000 g for 2 h at 4°C, and the supernatant (soluble fraction) containing soluble proteins (including soluble cytokines and chemokines) was collected and stored at −80°C. Total protein was determined using a bicinchoninic acid (BCA) protein assay kit (Pierce Biotechnology, Rockford, IL, USA) according to the manufacturer's instructions.
Determination of cytokine concentrations
Soluble fractions were assayed for the presence of 17 cytokines simultaneously using a Bio‐Plex bead‐based immunoassay kit (Bio‐Plex Human Cytokine 17‐plex panel, Bio‐Rad Laboratories, Hercules, CA, USA) according to the manufacturer's instructions. A list of all the analytes measured is shown in Table 3. All standards, blanks and unknown samples were run in duplicates. The completed immunoassay was read by the Bio‐Plex array reader (Bio‐Rad), which utilizes Luminex xMAP technology (Luminex Corporation, Austin, TX, USA). Standard curves for each analyte were constructed using five‐parameter logistic regression modeling, and the generated equations from the standard curves were used to predict the concentrations (pg/mL) of the 17 cytokines in unknown samples. According to a previously published method (21), final cytokine concentrations were expressed as picogram cytokine per milligram total protein. Spearman's rank‐order correlation analysis demonstrated no correlation between protein loading and cytokine concentrations (data not shown), confirming that observed changes in cytokine expression were specifically related to disease status.
Table 3.
Mean cytokine and chemokine levels measured as picogram per milligram total protein ± standard error of the mean for Alzheimer's disease (AD) and control groups. Abbreviations: MCP‐1 = monocyte chemoattractant protein‐1; IL = interleukin; TNF‐α = tumor necrosis factor‐α; IFN‐γ = interferon‐γ; G‐CSF = granulocyte colony‐stimulating factor; GM‐CSF = granulocyte macrophage colony‐stimulating factor; MIP‐1β = monocyte inhibitory protein‐1β.
| Inflammatory mediator | AD | Control |
|---|---|---|
| G‐CSF | 69.5 ± 21.0 | 7.4 ± 2.5 |
| GM‐CSF | 50.0 ± 17.0 | 13.0 ± 4.0 |
| IL‐1β | 3.9 ± 1.5 | 1.8 ± 0.6 |
| IL‐2 | 17.0 ± 11.0 | 1.2 ± 0.5 |
| IL‐4 | 1.4 ± 1.0 | 0.02 ± 0.02 |
| IL‐5 | 0.5 ± 0.1 | 0.30 ± 0.03 |
| IL‐6 | 59.0 ± 18.0* | 8.3 ± 1.7 |
| IL‐7 | 80.0 ± 45.0 | 22.5 ± 7.0 |
| IL‐8 | 46.0 ± 9.0* | 10.0 ± 2.0 |
| IL‐10 | 2.6 ± 1.4 | 0.24 ± 0.20 |
| IL‐12 | 29.0 ± 11.0 | 6.0 ± 4.0 |
| IL‐13 | 4.1 ± 1.9 | 0.9 ± 0.4 |
| IL‐17 | — | — |
| IFN‐γ | — | — |
| MCP‐1 | 86.0 ± 15.0* | 15.0 ± 1.0 |
| MIP‐1β | 57.0 ± 12.0 | 26 ± 3.5 |
| TNF‐α | 38.0 ± 15.0 | 14.0 ± 4.0 |
P < 0.0029.
Statistical analysis
Statistical analysis was performed using SPSS software (version 14.0 for Microsoft Windows, SPSS Inc., Chicago, IL, USA). Mean and standard errors are given for all significant values. In order to identify the most significant common inflammatory factors measured across all forms of AD, PS1 and sporadic cases were considered together as a single group and were compared to the control group (which were matched for age, student t‐test, AD vs. control, P = 0.8; Table 1). Independent Mann–Whitney U tests were used to determine significant differences between AD and control groups. Because of the number of statistical tests performed, Bonferroni correction for multiple analyses required a P‐value of <0.0029 for statistical significance. However, as the expectation is for significant interactions between cytokines, all cytokine measures were assessed using stepwise logistic regression analysis to determine the most consistently and significantly upregulated factors that predict AD. Post‐mortem delay and age at death were included as covariates in the regression model and a P‐value of <0.05 was considered significant.
Immunohistochemistry
For immunohistochemical analysis, 10‐µm‐thick sections were cut from paraffin‐embedded formalin‐fixed tissue blocks of the inferior temporal association cortex from 12 AD cases (PS1 and sporadic) and 10 controls (young and old, Table 2). Peroxidase immunohistochemistry was carried out using antibodies against MCP‐1 (mouse monoclonal, 1/400 dilution, R&D Systems, Minneapolis, MN, USA), IL‐6 (rabbit polyclonal, 1/600 dilution, Abcam, Cambridge, UK) and IL‐8 (goat polyclonal, 1/5 dilution, R&D Systems). All histochemical and immunological procedures were carried out according to previously described protocols (40). Briefly, antigen retrieval was carried out by microwaving on high for 3 minutes in a citrate‐based buffer (0.2 M citric acid solution, pH 6.0) followed by inhibition of endogenous peroxidase activity (1% H2O2 in ethanol for 30 minutes) and by blocking in 10% serum to eliminate non‐specific binding. Primary antibodies were incubated for 1 h at 37°C (MCP‐1 and IL‐6) or overnight at 4°C (IL‐8). Sections were then sequentially incubated with biotinylated secondary antibodies (Vector biotinylated secondary IgG antibodies, Vector Laboratories, Burlingame, CA, USA) for 30 minutes at 37°C, streptavidin‐conjugated horseradish peroxidase (Vector Elite ABC, Vector Laboratories) for 30 minutes at 25°C and with 3,3′‐diaminobenzidine (DAB) in H2O2 until the reaction products were visualized (5–10 minutes). All sections were lightly counterstained with cresyl violet (0.5% aqueous solution) then were rapidly dehydrated through alcohol (70%, 95% and 100% twice), cleared in xylene and coverslipped with DPX. The specificity of the immunohistochemical reactions was tested by omitting the primary antisera. No reactions were observed in these negative control sections.
RESULTS
Sixteen out of the 17 measured cytokines were detected in the soluble fraction of the inferior temporal cortex of AD patients, with 11 of these also detected in controls. These included eight cytokines—IL‐1β, IL‐5, IL‐6, IL‐7, interleukin‐12p70 (IL‐12p70), TNF‐α, granulocyte colony‐stimulating factor (G‐CSF) and granulocyte macrophage colony‐stimulating factor (GM‐CSF), and three chemokines—IL‐8, MCP‐1 and MIP‐1β. Levels of interferon‐γ (IFN‐γ) were below the detection limit of the assay for this cytokine, and only one case had detectable concentrations of IL‐17; therefore, these two cytokines were not analyzed further. There was considerable variance in some of the measurements that were not attributable to obvious infections (cases were free of systemic blood infection at autopsy) or to cause of death (eg, high vs. low MCP‐1 levels in AD cases 4 = 115 pg/mg vs. 8 = 14 pg/mg who both died of pneumonia, or in AD 2 = 103 pg/mg vs. control 14 = 14 pg/mg who both died of myocardial infarction). In particular, assessment of AD cases with pneumonia vs. those without showed similar variance and no significant differences (Mann–Whitney U, P > 0.05). Mann–Whitney U tests with Bonferroni correction for multiple analyses revealed significant increases only in the levels of IL‐6, IL‐8 and MCP‐1 in AD compared to controls (Table 3).
Stepwise logistic regression modeling covarying for post‐mortem delay and age at death determined the cytokines and/or chemokines most closely associated with AD. This analysis revealed that a single dominant factor, MCP‐1, predicted AD across all cases (Figure 1, R 2 = 0.483, P < 0.001). No effect of post‐mortem delay or age was seen (data not shown).
Figure 1.
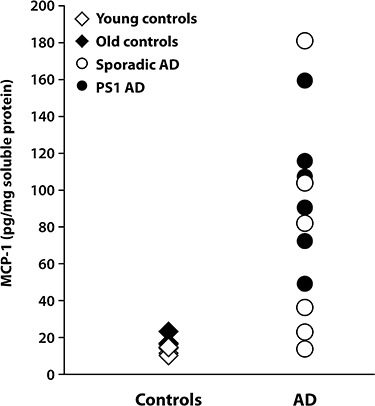
Monocyte chemoattractant protein‐1 (MCP‐1) levels (expressed as picogram per milligram protein) in the soluble protein fraction of the inferior temporal cortex of control (young and old) and Alzheimer's disease (AD) [sporadic and presenilin‐1 (PS1)] brains measured with the Bio‐Plex bead‐based immunoassay kit.
Immunohistochemical analysis using antibodies against MCP‐1, IL‐6 and IL‐8 demonstrated intense staining in sporadic and PS1 AD compared to controls (young and old). In the controls, all three cytokines were found in some cortical pyramidal neurons (Figure 2C,F,I) with no staining in any age‐related plaque pathology (data not shown). In both PS1 and sporadic AD cases, a larger number of neurons demonstrated more intense immunoreactivity for these cytokines. MCP‐1 and IL‐6 immunoreactivity was found in astrocytes in both PS1 and sporadic AD (Figure 2). A proportion of plaques (predominantly, although not exclusively, mature plaques) contained MCP‐1 (Figure 2A,B) and IL‐8 immunoreactivity (Figure 2G,H) in both PS1 and sporadic AD. In general, the pattern of cytokine immunoreactivity was similar in both PS1 and sporadic AD; however, consistent with multiplex data, the intensity of the immunoreactivity was generally greater and more widespread in the PS1 cases (Figure 2).
Figure 2.
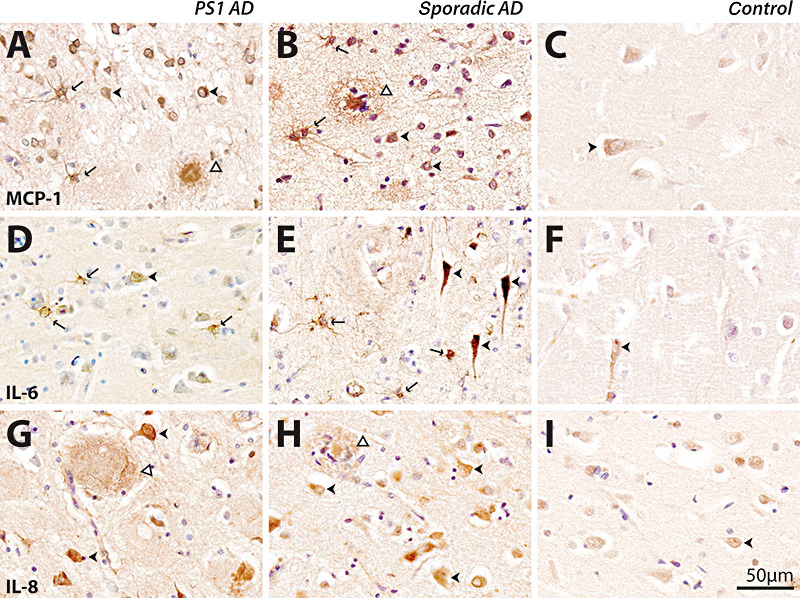
Immunohistochemical detection of monocyte chemoattractant protein‐1 (MCP‐1) (A–C), interleukin‐6 (IL‐6) (D–F) and interleukin‐8 (IL‐8) (G–I) in presenilin‐1 (PS1) AD (A,D,G), sporadic AD (B,E,H) and old controls (C,F,I). Immunoreactivity in young and old controls was similar, so only representative cases from old controls are shown. The scale bar (50 µm) applies to all panels. MCP‐1 immunoreactivity was seen in neurons (arrowheads, A,B), astrocytes (arrows, A,B) and plaques (open arrowheads, A,B) in PS1 (A) and sporadic (B) AD. MCP‐1 immunoreactivity was predominantly observed in neurons in controls (arrowhead, C). Within the cortex IL‐6, immunoreactivity was seen in neurons (arrowheads, D,E) as well as astrocytes (arrows, D,E) in PS1 (D) and sporadic (E) AD. IL‐6 immunoreactivity was predominantly located in neurons in controls (arrowhead, F). IL‐8 immunoreactivity was predominantly seen in plaques (open arrowheads, G,H) and neurons (arrowheads, G,H) in PS1 (G) and sporadic (H) AD. IL‐8 immunoreactivity was predominantly located within neurons in controls (arrowhead, I). AD = Alzheimer's disease.
DISCUSSION
Inflammation is an important feature of many neurodegenerative conditions and is characterized by glial activation and the expression of inflammatory mediators such as chemokines and cytokines. Our simultaneous comparison of 17 of these inflammatory mediators in the same tissue samples has confirmed significant increases in IL‐6, IL‐8 and MCP‐1 in AD, and has further identified that MCP‐1 is a reliable predictor of AD. MCP‐1 (CCL2) is a member of the CC chemokine family that was first identified by its role in promoting infiltration of macrophages into tumors. It plays an important role in the regulation of repair processes and cellular interactions in the central nervous system (CNS) and can be expressed by many cell types including astrocytes, microglia and axotomized neurons (44).
Mediators of inflammation do not usually work in isolation, but in a coordinated fashion necessary in different stages of any inflammatory response. Despite this knowledge, few studies have assessed multiple inflammatory cytokines in the same assays synchronously. Only by performing a simultaneous analysis of multiple cytokines in a single assay were we able to determine the factor(s) most strongly associated with AD. In these comparative assays, we were unable to substantiate that IL‐1β and TNF‐α are major mediators of the inflammatory response in all types of AD as previously reported (2, 48, 52). This is despite demonstrating levels of expression of these cytokines similar to those reported previously by others [0.35–0.66 pg/mg compared to 0.74–1.68 pg/mg (5)] and is most likely caused by the high expression observed in some of our age‐matched controls. In general, we found high variability in the cerebral levels of IL‐1β in our AD cases that did not support a strong association with disease. This is consistent with a number of studies investigating IL‐1β mRNA and protein expression in AD (25, 26, 28, 46, 47, 48).
In contrast, levels of IL‐6, IL‐8 and MCP‐1 were consistently higher in AD cases compared with controls (Table 3, 1, 2), with MCP‐1 identified as a reliable predictor of disease, suggesting a major role for this cytokine in the detrimental neuroinflammatory processes. Increased IL‐6 protein in AD has previously been observed by enzyme‐linked immunosorbent assay (ELISA), but no studies have quantified soluble protein levels of IL‐8 or MCP‐1 in AD brain tissue. Histological studies have previously associated both interleukin‐8 receptor (IL‐8R) and MCP‐1 with AD pathology (22, 49), and our findings are consistent with these studies. Our findings are also consistent with in vitro studies demonstrating significant increases in IL‐8 and MCP‐1 mRNA and secreted protein in AD microglia stimulated with amyloid‐β (Aβ) protein (27, 45). In addition, significant induction of secreted IL‐6 but not mRNA is also seen following Aβ stimulation (27).
In order to identify the cellular structures associated with increased cytokine production, we carried out a comprehensive immunohistochemical analysis of MCP‐1, IL‐6 and IL‐8 in the same brain tissue region. Both young and old controls demonstrated MCP‐1, IL‐6 and IL‐8 immunoreactivities in neurons. As these cytokines have previously been found in axotomized neurons (44), this may suggest that with aging, a proportion of “normal” neurons increase cytokine production to decrease such vulnerability. In AD, there was significantly enhanced immunoreactivity in neurons, consistent with increased neuronal vulnerability and the role these factors play in cell–cell communication between neurons, astrocytes and microglia (7). While MCP‐1 was also found in cortical plaques and glia in AD, IL‐8 was not seen in astrocytes and IL‐6 was not seen in plaque pathology. These findings are consistent with previous immunohistochemical studies of MCP‐1 (14, 22) and IL‐6 (3, 20), although we are the first to confirm these findings in PS1 cases and to localize IL‐8 in AD brain tissue. In contrast to previous reports (30, 35), neither our multiplex results nor our immunohistochemical data demonstrated significantly increased inflammation in normal aging, a finding that is likely to be reflective of “successful” aging in these cases.
Although MCP‐1, IL‐6 and IL‐8 were all upregulated in AD brains, multiple linear regression analysis identified only one factor, MCP‐1, as the major predictor of AD, consistent with a dominant role for this cytokine in the inflammatory process. Recent studies modeling AD using triple transgenic mice (amyloid precursor protein (APP)/tau/PS1) also demonstrate a similar and striking 10.8‐fold upregulation of MCP‐1 (23). Increased levels of MCP‐1 are found in the sera and cerebrospinal fluid of AD patients, as well as in patients with mild cognitive impairment who later develop AD (11, 12). The major stimulus for this response is currently unknown, although Aβ‐induced upregulation of MCP‐1 has been reported in vitro (42) and studies have shown that intracerebroventricular infusion of Aβ in mice increases MCP‐1 within the ipsilateral hippocampi (42). Furthermore, APP transgenic mice that overexpress MCP‐1 have increased plaque formation in association with an increased inflammatory response compared to APP transgenic counterparts (51).
However, MCP‐1 has also been shown to play a crucial role in macrophage recruitment and plaque clearance in animal models of AD, suggesting a potentially reparative role (9, 41) consistent with our observation of MCP‐1 in healthy controls (Figure 2). Like many inflammatory molecules, brain MCP‐1 likely plays pleiotropic roles, which under optimal regulation result in healing and repair, but under excessive, chronic upregulation stimulates neurodegeneration. Indeed, persistent upregulation of MCP‐1 has been identified in various neurodegenerative conditions with underlying tissue destruction including multiple sclerosis (43), amyotrophic lateral sclerosis (18) and HIV dementia (33). The precise role of MCP‐1 in these disorders is not yet known, although a recent study suggests that perturbations in MCP‐1 can have potent effects on other chemokines and chemokine receptors, severely altering the inflammatory cascade (10). MCP‐1 receptor antagonists have been shown to reduce disease severity in animal models of multiple sclerosis (4), an effect not seen with an antagonist against the chemokine RANTES (Regulated upon Activation, Normal T cell Expressed and presumably Secreted) (29). In contrast, MCP‐1 has been shown to be decreased or unchanged in the frontal gray and white matter, respectively, of cases with vascular dementia (31), suggesting that changes in MCP‐1 may discriminate between some dementia disorders. These studies demonstrate the need to identify specific neuroinflammatory targets for therapeutic intervention in different neurodegenerative diseases.
Our multiplex data demonstrate that significant increases in MCP‐1 predict AD, consistent with this chemokine playing a crucial role in the disease process. While future studies using larger numbers of well‐characterized cases are required to confirm our findings, a significant body of evidence exists to support a role for MCP‐1 in AD neurodegeneration. In addition, recent data provide promising results for neurological disease treatment using chemokine antagonists. Greater potential for mechanistic treatments will be achieved by identifying crucial factors responsible for the detrimental neuroinflammatory responses in neurodegeneration. Targeting MCP‐1 may provide one such avenue for therapy in AD.
ACKNOWLEDGMENTS
We would like to thank the participants in the Brain Donor Programs and Dr William Brooks, Dr John Kwok and Professor Peter Schofield for clinical and genetic information on the PS1 cases. The project was funded by the National Health and Medical Research Council of Australia (project grant 300467) and by a grant from the JO and JR Wicking Trust and Mason Foundation, which are managed by ANZ Trustees.
REFERENCES
- 1. Akiyama H, Barger S, Barnum S, Bradt B, Bauer J, Cole G et al (2000) Inflammation and Alzheimer's disease. Neurobiol Aging 21:383–421. [DOI] [PMC free article] [PubMed] [Google Scholar]
- 2. Araujo D, Lapchak P (1994) Induction of immune system mediators in the hippocampal formation in Alzheimer's and Parkinson's diseases: selective effects on specific interleukins and interleukin receptors. Neuroscience 61:745–754. [DOI] [PubMed] [Google Scholar]
- 3. Bauer J, Strauss S, Schreiter‐Gasser U, Ganter U, Schlegel P, Witt I et al (1991) Interleukin‐6 and alpha‐2‐macroglobulin indicate an acute‐phase state in Alzheimer's disease cortices. FEBS Lett 285:111–114. [DOI] [PubMed] [Google Scholar]
- 4. Brodmerkel C, Huber R, Covington M, Diamond S, Hall L, Collins R et al (2005) Discovery and pharmacological characterisation of a novel rodent‐active CCR2 antagonist—INCB3344. J Immunol 175:5370–5378. [DOI] [PubMed] [Google Scholar]
- 5. Cacabelos R, Alvarez X, Fernandez‐Novoa L, Franco A, Mangues R, Pellicer A, Nishimura T (1994) Brain interleukin‐1 beta in Alzheimer's disease and vascular dementia. Methods Find Exp Clin Pharmacol 16:141–151. [PubMed] [Google Scholar]
- 6. Cagnin A, Gerhard A, Banati R (2002) In vivo imaging of neuroinflammation. Eur Neuropsychopharmacol 12:581–586. [DOI] [PubMed] [Google Scholar]
- 7. De Haas A, Van Weering H, De Jong E, Boddeke H, Biber K (2007) Neuronal chemokines: versatile messengers in central nervous system cell interaction. Mol Neurobiol 36:137–151. [DOI] [PMC free article] [PubMed] [Google Scholar]
- 8. Dickson DW, Lee SC, Mattiace LA, Yen S‐HC, Brosnan C (1993) Microglia and cytokines in neurological disease, with special reference to AIDS and Alzheimer's disease. Glia 7:75–83. [DOI] [PubMed] [Google Scholar]
- 9. El Khoury J, Toft M, Hickman S, Means T, Terada K, Geula C, Luster A (2007) CCR2 deficiency impairs microglial accumulation and accelerates progression of Alzheimer‐like disease. Nat Med 13:432–438. [DOI] [PubMed] [Google Scholar]
- 10. Ferreira A, Rollins B, Faunce D, Burns A, Zhu X, DiPietro L (2005) The effect of MCP‐1 depletion on chemokine and chemokine‐related gene expression: evidence for a complex network of acute inflammation. Cytokine 30:64–71. [DOI] [PubMed] [Google Scholar]
- 11. Galimberti D, Fenoglio C, Lovati C, Venturelli E, Guidi I, Corra B et al (2006) Serum MCP‐1 levels are increased in mild cognitive impairment and mild Alzheimer's disease. Neurobiol Ageing 27:1763–1768. [DOI] [PubMed] [Google Scholar]
- 12. Galimberti D, Schoonenboom N, Scheltens P, Fenoglio C, Bouwman F, Venturelli E et al (2006) Intrathecal chemokine synthesis in mild cognitive impairment and Alzheimer disease. Arch Neurol 63:538–543. [DOI] [PubMed] [Google Scholar]
- 13. Gomez‐Isla T, Growdon W, McNamara M, Nochlin D, Bird T, Arango J et al (1999) The impact of different presenilin 1 and presenilin 2 mutations on amyloid deposition, neurofibrillary changes and neuronal loss in the familial Alzheimer's disease brain. Evidence for other phenotype‐modifying factors. Brain 122:1709–1719. [DOI] [PubMed] [Google Scholar]
- 14. Grammas P, Ovase R (2001) Inflammatory factors are elevated in brain microvessels in Alzheimer's disease. Neurobiol Aging 22:837–842. [DOI] [PubMed] [Google Scholar]
- 15. Gregory G, Macdonald V, Schofield P, Kril J, Halliday G (2006) Differences in regional brain atrophy in genetic forms of Alzheimer's disease. Neurobiol Aging 27:387–393. [DOI] [PubMed] [Google Scholar]
- 16. Griffin W (2006) Inflammation and neurodegenerative diseases. Am J Clin Nutr 83:470S–474S. [DOI] [PubMed] [Google Scholar]
- 17. Griffin W, Stanley L, Ling C, White L, MacLeod V, Perrot L et al (1989) Brain interleukin 1 and S‐100 immunoreactivity are elevated in Down syndrome and Alzheimer disease. Proc Natl Acad Sci USA 86:7611–7615. [DOI] [PMC free article] [PubMed] [Google Scholar]
- 18. Henkel J, Beers D, Siklos L, Appel S (2006) The chemokine MCP‐1 and the dendritic and myeloid cells it attracts are increased in the mSOD1 mouse model of ALS. Mol Cell Neurosci 31:427–437. [DOI] [PubMed] [Google Scholar]
- 19. Ho G, Drego R, Hakimian E, Masliah E (2005) Mechanisms of cell signaling and inflammation in Alzheimer's disease. Curr Drug Targets Inflamm Allergy 4:247–256. [DOI] [PubMed] [Google Scholar]
- 20. Huell M, Strauss S, Volk B, Berger M, Bauer J (1995) Interleukin‐6 is present in early stages of plaque formation and is restricted to the brains of Alzheimer's disease patients. Acta Neuropathol 89:544–551. [DOI] [PubMed] [Google Scholar]
- 21. Hulse R, Kunkler P, Fedynyshyn J, Kraig R (2004) Optimization of multiplexed bead‐based cytokine immunoassays for rat serum and brain tissue. J Neurosci Methods 136:87–98. [DOI] [PMC free article] [PubMed] [Google Scholar]
- 22. Ishizuka K, Kimura T, Igata‐yi R, Katsuragi S, Takamatsu J, Miyakawa T (1997) Identification of monocyte chemoattractant protein‐1 in senile plaques and reactive microglia of Alzheimer's disease. Psychiatry Clin Neurosci 51:135–138. [DOI] [PubMed] [Google Scholar]
- 23. Janelsins M, Mastrangelo M, Oddo S, LaFerla F, Federoff H, Bowers W (2005) Early correlation of microglial activation with enhanced tumor necrosis factor‐alpha and monocyte chemoattractant protein‐1 expression specifically within the entorhinal cortex of triple transgenic Alzheimer's disease mice. J Neuroinflammation 2:23. [DOI] [PMC free article] [PubMed] [Google Scholar]
- 24. Kwok J, Taddei K, Hallupp M, Fisher C, Brooks W, Broe G et al (1997) Two novel (M233T and R278T) presenilin‐1 mutations in early‐onset Alzheimer's disease pedigrees and preliminary evidence for association of presenilin‐1 mutations with a novel phenotype. Neuroreport 8:1537–1542. [DOI] [PubMed] [Google Scholar]
- 25. Lanzrein A, Johnston C, Perry V, Jobst K, King E, Smith A (1998) Longitudinal study of inflammatory factors in serum, cerebrospinal fluid, and brain tissue in Alzheimer disease: interleukin‐1beta, interleukin‐6, interleukin‐1 receptor antagonist, tumor necrosis factor‐alpha, the soluble tumor necrosis factor receptors I and II, and alpha1‐antichymotrypsin. Alzheimer Dis Assoc Disord 12:215–227. [DOI] [PubMed] [Google Scholar]
- 26. Loring J, Wen X, Lee J, Seilhamer J, Somogyi R (2001) A gene expression profile of Alzheimer's disease. DNA Cell Biol 20:683–695. [DOI] [PubMed] [Google Scholar]
- 27. Lue L, Rydel R, Brigham E, Yang L, Hampel H, Murphy G et al (2001) Inflammatory repetoire of Alzheimer's disease and nondemented elderly microglia in vitro . Glia 35:72–79. [DOI] [PubMed] [Google Scholar]
- 28. Luterman J, Haroutunian V, Yemul S, Ho L, Purohit D, Aisen P et al (2000) Cytokine gene expression as a function of the clinical progression of Alzheimer disease dementia. Arch Neurol 57:1153–1160. [DOI] [PubMed] [Google Scholar]
- 29. Matsui M, Weaver J, Proudfoot A, Wujek J, Wei T, Richer E et al (2002) Treatment of experimental autoimmune encephalomyelitis with the chemokine receptor antagonist met‐RANTES. J Neuroimmunol 128:16–33. [DOI] [PubMed] [Google Scholar]
- 30. Miguel‐Hidalgo J, Nithuairisg S, Stockmeier C, Rajkowska G (2007) Distribution of ICAM‐1 immunoreactivity during aging in the human orbitofrontal cortex. Brain Behav Immun 21:100–111. [DOI] [PMC free article] [PubMed] [Google Scholar]
- 31. Mulugeta E, Molina‐Holgado F, Elliott M, Hortobayagi T, Perry R, Kalaria R et al (2007) Inflammatory mediators in the frontal lobe of patients with mixed and vascular dementia. Dement Geriatr Cogn Disord 25:278–286. [DOI] [PubMed] [Google Scholar]
- 32. Parachikova A, Agadjanyan M, Cribbs D, Blurton‐Jones M, Perreau V, Rogers J et al (2006) Inflammatory changes parallel the early stages of Alzheimer disease. Neurobiol Ageing 28:1821–1833. [DOI] [PMC free article] [PubMed] [Google Scholar]
- 33. Pulliam L, Sun B, Rempel H (2004) Invasive chronic inflammatory monocyte phenotype in subjects with high HIV‐1 viral load. J Neuroimmunol 157:93–98. [DOI] [PubMed] [Google Scholar]
- 34. Sastre M, Klockgether T, Heneka M (2006) Contribution of inflammatory processes to Alzheimer's disease: molecular mechanisms. Int J Dev Neurosci 24:167–176. [DOI] [PubMed] [Google Scholar]
- 35. Sheng J, Mrak R, Rovanghi C, Kozlowska E, Van Eldik L, Griffin W (1996) Human brain S100B and S100B mRNA expression increases with age: pathogenic implications for Alzheimer's disease. Neurobiol Aging 17:359–363. [DOI] [PubMed] [Google Scholar]
- 36. Shepherd C, McCann H, Thiel E, Halliday G (2002) Neurofilament‐immunoreactive neurons in Alzheimer's disease and dementia with Lewy bodies. Neurobiol Dis 9:249–257. [DOI] [PubMed] [Google Scholar]
- 37. Shepherd C, Gregory G, Vickers J, Brooks W, Kwok J, Schofield P et al (2004) Positional effects of presenilin‐1 mutations on tau phosphorylation in cortical plaques. Neurobiol Dis 15:115–119. [DOI] [PubMed] [Google Scholar]
- 38. Shepherd C, Gregory G, Vickers J, Halliday G (2005) Novel inflammatory plaque pathology in presenilin 1 Alzheimer's disease. Neuropathol Appl Neurobiol 31:503–511. [DOI] [PubMed] [Google Scholar]
- 39. Shepherd C, Grace E, Mann D, Halliday G (2007) Relationship between neuronal loss and “inflammatory plaques” in early onset Alzheimer's disease. Neuropathol Appl Neurobiol 33:328–333. [DOI] [PubMed] [Google Scholar]
- 40. Shepherd CE, Thiel E, McCann H, Harding TJ, Halliday GM (2000) Cortical inflammation in Alzheimer's disease but not dementia with Lewy bodies. Arch Neurol 57:817–822. [DOI] [PubMed] [Google Scholar]
- 41. Simard A, Soulet D, Gowing G, Julien J, Rivest S (2006) Bone marrow‐derived microglia play a critical role in restricting senile plaque formation in Alzheimer's disease. Neuron 49:489–502. [DOI] [PubMed] [Google Scholar]
- 42. Szczepanik A, Rampe D, Ringheim G (2001) Amyloid‐beta peptide fragments p3 and p4 induce pro‐inflammatory cytokine and chemokine production in vitro and in vivo . J Neurochem 77:304–317. [DOI] [PubMed] [Google Scholar]
- 43. Tanuma N, Sakuma H, Sasaki A, Matsumoto Y (2006) Chemokine expression by astrocytes plays a role in microglia/macrophage activation and subsequent neurodegeneration in secondary progressive multiple sclerosis. Acta Neuropathol 112:195–204. [DOI] [PubMed] [Google Scholar]
- 44. Ubogu E, Cossoy M, Ranshoff R (2006) The expression and function of chemokines involved in CNS inflammation. Trends Pharmacol Sci 27:48–54. [DOI] [PubMed] [Google Scholar]
- 45. Walker D, Lue L, Beach T (2001) Gene expression profiling of amyloid beta peptide‐stimulated human post‐mortem brain microglia. Neurobiol Aging 22:957–966. [DOI] [PubMed] [Google Scholar]
- 46. Wang G, Zhang Y, Chen B, Cheng J (2003) Preliminary studies on Alzheimer's disease using cDNA microarrays. Mech Ageing Dev 124:115–124. [DOI] [PubMed] [Google Scholar]
- 47. Weeraratna A, Kalehua A, DeLeon I, Bertak D, Maher G, Wade M et al (2007) Alterations in immunological and neurological gene expression patterns in Alzheimer's disease tissues. Exp Cell Res 313:450–461. [DOI] [PMC free article] [PubMed] [Google Scholar]
- 48. Wood J, Wood P, Ryan R, Graff‐Radford N, Pilapil C, Robitaille Y, Quirion R (1993) Cytokine indices in Alzheimer's temporal cortex: no changes in mature IL‐1 beta or IL‐1RA but increases in the associated acute phase proteins IL‐6, alpha 2‐macroglobulin and C‐reactive protein. Brain Res 629:245–252. [DOI] [PubMed] [Google Scholar]
- 49. Xia M, Qin S, McNamara M, Mackay C, Hyman BT (1997) Interleukin‐8 receptor B immunoreactivity in brain and neuritic plaques of Alzheimer's disease. Am J Pathol 150:1267–1274. [PMC free article] [PubMed] [Google Scholar]
- 50. Xia M, Qin S, Wu L, Mackay C, Hyman B (1998) Immunohistochemical study of the beta‐chemokine receptors CCR3 and CCR5 and their ligands in normal and Alzheimer's disease brains. Am J Pathol 153:31–37. [DOI] [PMC free article] [PubMed] [Google Scholar]
- 51. Yamamoto M, Horiba M, Buescher J, Huang D, Gendelman H, Ranshoff R, Ikezu T (2005) Overexpression of monocyte chemotactic protein—1/CCL2 in B‐amyloid precursor protein transgenic mice show accelerated diffuse B‐amyloid deposition. Am J Pathol 166:1475–1485. [DOI] [PMC free article] [PubMed] [Google Scholar]
- 52. Zhao M, Cribbs D, Anderson A, Cummings B, Su J, Wasserman A, Cotman C (2003) The induction of the TNF‐alpha death domain signaling pathway in Alzheimer's disease brain. Neurochem Res 28:307–318. [DOI] [PubMed] [Google Scholar]