

Abstract
Recent studies have revealed extensive neocortical pathology in multiple sclerosis (MS). The hippocampus is a unique archaeocortical structure understudied in MS. It plays a central role in episodic and anterograde memory—the most frequently impaired cognitive modalities in MS. This histopathological study aimed to investigate inflammatory demyelination and neurodegenerative changes in the MS archaeocortex. A detailed quantitative analysis was performed on hippocampal autopsy tissue from 45 progressive MS cases and seven controls. Forty‐one lesions were identified in 28 of the 45 hippocampal MS‐blocks examined, with percentage area of demyelination averaging 30.4%. The majority of lesions were chronic and subpially or subependymally located. Compared to controls, neuronal numbers were decreased by 27% in CA1 and 29.7% in CA3‐2. Furthermore, the size of neurones was decreased by 17.4% in CA1. There was evidence of gross hippocampal atrophy with a 22.3% reduction in the average cross‐sectional area, which correlated with neuronal loss. Our study provides evidence of substantial archaeocortical pathology largely resembling patterns seen in the neocortex and suggests that hippocampal involvement could contribute to memory impairments often seen in MS.
Keywords: atrophy, cortical demyelination, hippocampus, multiple sclerosis, neuronal loss
INTRODUCTION
Multiple sclerosis (MS) is a chronic immune‐mediated disease characterized by disseminated plaques of inflammatory demyelination in the brain and spinal cord. Although MS has traditionally been considered a disease of the white matter (WM), early studies revealed that gray matter (GM) is also commonly affected (11).
Neuropathological investigations have confirmed the abundance of demyelinating plaques in the MS neocortex 8, 33. Neocortical plaques most commonly extend from the pial surface to the outermost 3–5 cortical layers (type III subpial lesions, 49) often involving multiple gyri (8). At the microscopic level, cortical lesions differ considerably from their WM counterparts. They are generally hypocellular, containing fewer lymphocytes and are dominated by microglia with activated ramified morphology, with macrophages being almost absent. GM lesions also display evidence of axonal and dendritic transection, deafferentation and neuronal loss 49, 69. However, data suggests that GM atrophy and neuronal loss may also occur in a more diffuse manner not associated with focal demyelination (67) and that in addition to the neocortex, MS‐related pathological changes may also be found in the deep cerebral nuclei 6, 14, 28.
Cortical plaque formation is associated with disease progression as GM plaques appear to be more common in primary and secondary progressive forms of MS than in relapsing‐remitting MS (35). Several studies have demonstrated significant correlations between GM changes and physical disability (54), fatigue (48) and cognitive deficits 3, 46, suggesting that GM involvement in MS is of great clinical relevance. Furthermore, neocortical GM atrophy has been shown to exhibit a stronger association with cognitive dysfunction in MS patients compared with WM lesion load (53).
A cortical structure that has not been systematically studied in MS is that of the hippocampal archaeocortex. It comprises several subfields with the two main regions being Ammon's horn (CA) or hippocampus proper and the dentate gyrus (DG) and has rich afferent and efferent cortical and subcortical connections (29). Unlike the six‐layered neocortex, which forms the convex outer surface of the brain, the hippocampus is structurally unique. It consists of a phylogenetically older three‐layered cortex that forms the floor of the temporal horn of the lateral ventricle and is thus encompassed by cerebrospinal fluid (CSF). However, the hippocampus proper is lined by ependyma rather than being covered with pia mater.
In addition to its structural peculiarity, the hippocampus has a functional role that could potentially explain some of the cognitive deficits commonly seen in MS patients. Cognitive deficits are present in 40%–60% of MS patients (51) and have a profound impact on the quality of life (52), sometimes despite minimal physical disability (4). The hippocampus is implicated in the processes of learning and memory including anterograde and episodic memory (15), which are frequently impaired in MS (32).
To date, the pathological changes taking place in the MS hippocampus have not been elucidated. Poor sensitivity of imaging methods for cortical lesions, in particular the hippocampus (26), necessitated a histopathological approach for its examination. The present study undertaken on human post‐mortem tissue aimed to investigate the pathological changes in the MS hippocampus with special reference to lesion distribution, inflammation, atrophy and neuronal loss, and to correlate these measures with clinical MS parameters.
MATERIALS and METHODS
Tissue samples
MS and control formalin‐fixed, paraffin‐embedded hippocampal tissue blocks were obtained from the UK Multiple Sclerosis Tissue Bank (66). Two additional control hippocampal blocks were provided by the UK Parkinson's Disease Society Tissue Bank. Fully informed consent for all the tissue and clinical information was obtained, via a prospective donor scheme, with approval from the Multicentre Research Ethics Committee (ref. number 02/2/39).
One hippocampal block per case from a total of 52 cases were included in the study; 45 MS cases and seven controls (Table 1). The MS cases [13 men and 32 women; mean age 61 ± 12.9 years (range 37–88); mean post‐mortem interval (PMI) 19 ± 10.4 h (range 7–61); mean disease duration 27.8 ± 10.7 years (range 6–56)] were neuropathologically confirmed. The seven control blocks (four women and three men) with similar age [mean 63 ± 15.1 years (range 35–84)] and PMI [mean 20.1 ± 7 h (range 13–33)] corresponded to coronal hippocampal sections at the level of the lateral geniculate nucleus (LGN). Starting with an initial selection of blocks that corresponded as accurately as possible to the coronal plane of the LGN, a one‐to‐one matching on age between MS cases and controls was not possible with the hippocampal blocks available. However, to prevent age from becoming a confounding factor the MS blocks (10 women and five men) used for estimating atrophy, neuronal morphometric characteristics and loss, synaptic density and HLA class II immunoreactivity were carefully selected to have closely similar mean age and range [61 ± 13.4 years (range 37–80)] (Table 1) to that of the control cohort. The same is true for the PMI of the MS blocks used for quantification [21.6 ± 14.3 h (range 8–61)]. No MS or control cases with a history of seizures or other neurological or psychiatric disease were included in the study. The neuropathological examination reports provided by the MS and PD tissue banks were used to exclude all cases with findings suggestive of Alzheimer's or other neurodegenerative disease and metastatic brain disease from the study.
Table 1.
Clinical and post‐mortem data for MS and control subjects. Abbreviations: C = control; SP = secondary progressive; PP = primary progressive; PMI = post‐mortem interval; EDSS = expanded disability status scale; R = right hippocampus; L = left hippocampus; M = male; F = female; PE = pulmonary embolism; MI = myocardial infarct; GI = gastrointestinal; IHD = ischemic heart disease; Ca = cancer.
| Case | Sex/age (years) | Cause of death | PMI (h) | Brain weight (g) | Fixation time | Side | Course/ Duration | Time to EDSS 7 | Relapses | Age at onset |
|---|---|---|---|---|---|---|---|---|---|---|
| MS14 | F/78 | MI | 30 | 1084 | 23 | R | SP/44 | 28 | 3 | 34 |
| MS43* | M/67 | PE | 11 | 1100 | 7 | R | SP/40 | 33 | 10 | 27 |
| MS54 | F/69 | Acute pyelonephritis | 7 | 855 | 7 | L | SP/31 | 12 | 2 | 38 |
| MS55* | F/47 | Pneumonia | 15 | 1075 | 9 | L | SP/32 | 4 | 3 | 15 |
| MS56* | M/63 | Pneumonia | 11 | 1150 | 7 | L | SP/40 | 16 | 3 | 23 |
| MS60 | M/55 | Aspiration, MS | 24 | 1359 | 7 | R | SP/43 | 43 | 2 | 12 |
| MS62 | F/49 | Respiratory infection | 9 | 935 | 11 | L | SP/19 | 41 | 12 | 29 |
| MS63 | F/66 | Aspiration, MS | 15 | 1050 | 8 | L | SP/29 | 27 | 3 | 37 |
| MS64* | M/66 | Pneumonia | 44 | 1285 | 51 | R | SP/28 | 13 | 4 | 37 |
| MS66* | F/86 | Pneumonia | 21 | 894 | 7 | R | SP/56 | 45 | 2 | 29 |
| MS68* | F/63 | MI | 61 | 1078 | 66 | R | PP/22 | 21 | – | 40 |
| MS70 | F/77 | MS | 17 | 1206 | 25 | R | PP/21 | 21 | – | 56 |
| MS71 | F/78 | Bronchial Ca | 25 | 1062 | 23 | L | SP/42 | 10 | 4 | 35 |
| MS72 | F/78 | IHD | 21 | 1174 | 28 | R | SP/24 | 14 | – | 53 |
| MS73* | F/80 | Bronchopneumonia | 20 | 1045 | 26 | L | SP/50 | 18 | 5 | 29 |
| MS80 | F/71 | Bowel Obstruction | 7 | 1133 | 12 | R | SP/34 | 25 | 8 | 36 |
| MS81* | M/72 | Bronchopneumonia | 23 | 1273 | 39 | L | SP/48 | 30 | 7 | 24 |
| MS82 | F/49 | Aspiration pneumonia | 24 | 1057 | 7 | R | SP/28 | 21 | 8 | 21 |
| MS86 | F/81 | Bladder cancer | 22 | 1100 | 9 | R | RP/30 | 14 | 5 | 51 |
| MS88* | F/54 | Bronchopneumonia | 22 | 1185 | 10 | R | SP/20 | 6 | 10 | 33 |
| MS90 | M/62 | MS | 10 | 1127 | 8 | L | SP/28 | 16 | 11 | 34 |
| MS93 | F/57 | Pneumonia | 20 | 930 | 11 | R | SP/26 | 5 | 3 | 31 |
| MS98 | M/58 | MS | 13 | 1280 | 15 | R | SP/13 | 6 | 7 | 44 |
| MS103 | F/77 | Bronchopneumonia | 21 | 1183 | 24 | R | SP/21 | 15 | 8 | 55 |
| MS121 | F/49 | MS | 24 | 1006 | 11 | L | RP/13 | 9 | 3 | 36 |
| MS129* | F/66 | Metastatic lung Ca | 8 | 1147 | 21 | R | PP/24 | 4 | – | 42 |
| MS130 | F/57 | MS | 28 | 1150 | 19 | L | SP/30 | 23 | – | 27 |
| MS136 | M/40 | Respiratory failure | 10 | 1170 | 17 | R | SP/12 | 11 | 10 | 28 |
| MS141 | M/66 | Carcinomatosis | 7 | 1314 | 17 | L | SP/37 | – | 13 | 29 |
| MS143 | F/62 | PE, MS | 22 | 1072 | 13 | L | SP/19 | 7 | 5 | 43 |
| MS146 | F/63 | Pneumonia, MS | 25 | 1228 | 13 | R | SP/31 | 17 | 5 | 31 |
| MS159 | F/55 | Amitryptilene overdose | 9 | 1000 | 20 | R | SP/24 | 16 | 4 | 30 |
| MS162* | F/58 | Upper GI bleed | 14 | 1193 | 18 | L | SP/21 | 6 | 4 | 36 |
| MS163 | F/45 | Multiple organ failure | 28 | 1014 | 20 | L | SP/6 | 2 | 7 | 39 |
| MS165 | F/59 | Respiratory failure | 10 | 1380 | 16 | L | SP/20 | 17 | 4 | 38 |
| MS166 | F/52 | Bronchopneumonia | 7 | 891 | 17 | L | SP/31 | 25 | 10 | 21 |
| MS168 | F/88 | Bronchopneumonia | 22 | 1032 | 27 | L | PP/30 | 17 | 1 | 58 |
| MS170 | M/56 | Carcinomatosis | 25 | 1300 | 23 | R | SP/29 | 7 | 1 | 26 |
| MS176* | M/37 | Intestinal obstruction | 12 | 1210 | 21 | L | SP/27 | 10 | 4 | 10 |
| MS179* | F/70 | Aspiration pneumonia | 20 | 1100 | 15 | R | SP/25 | 4 | 2 | 44 |
| MS180 | M/44 | MS | 9 | 1103 | 20 | R | SP/18 | – | 10 | 26 |
| MS191 | F/48 | Pneumonia | 28 | 1393 | 34 | L | SP/31 | 2 | 4 | 16 |
| MS216* | F/53 | Breast cancer | 9 | 1220 | 27 | L | PP/11 | – | – | 47 |
| MS230* | F/42 | MS | 31 | 1029 | 20 | R | SP/20 | 14 | 4 | 22 |
| MS255 | M/45 | Bronchopneumonia | 24 | 1170 | 15 | R | SP/25 | 15 | – | 20 |
| n = 45 | 32F:13M/61(12.9) | 19 | 1128 | 18.7 | 24R/ | 38SP:7PP/ | 16.4 | 5.5 | 33.1 | |
| (10.4) | (128.8) | (11.7) | 21L | 27.8(10.7) | (10.8) | (3.3) | (11.5) | |||
| n = 15* | 10F:5M/61(13.4) | 21.6 | 1132.3 | 22.9 | 8R/ | 12SP:3PP/ | 16.0 | 4.8 | 30.5 | |
| (14.3) | (102.5) | (17.2) | 7L | 30.9(13) | (12.5) | (2.7) | (10.7) | |||
| C5(PD)* | M/58 | Cardiac failure | 13 | 1256 | 18 | R | – | – | – | – |
| C8(PD)* | F/71 | Cardiac failure | 18 | 1367 | 30 | R | – | – | – | – |
| C14* | M/64 | Cardiac failure | 18 | 1431 | 22 | L | – | – | – | – |
| C20* | F/84 | Cardiac failure | 24 | 1320 | 24 | R | – | – | – | – |
| C22* | F/69 | Lung Cancer | 33 | 1130 | 20 | L | – | – | – | – |
| C25* | M/35 | Tongue Ca | 22 | 1670 | 22 | L | – | – | – | – |
| C28* | F/60 | Ovarian cancer | 13 | 1132 | 68 | L | – | – | – | – |
| n = 7* | 4F:3M/63(15.1) | 20.1 | 1329.4 | 29.1 | 3R/ | – | – | – | – | |
| (7.0) | (188) | (17.54) | 4L | – | – | – | – |
Values represent mean (SD) where appropriate.
The asterisks denote cases used for quantitative analysis.
Histochemistry and immunohistochemistry
Paraffin‐embedded hippocampal tissue blocks were sectioned coronally. Serial sections of 10 μm were stained with hematoxylin and eosin, Luxol‐fast blue and cresyl fast violet (LFB/CFV) as well as LFB and periodic acid Schiff (LFB/PAS). Immunohistochemistry for myelin basic protein (MBP), CD3, HLA class II antigens, 200 kD neurofilament protein and β‐APP were performed on 10 µm sections and synaptophysin on 5 µm sections. Immunohistochemical staining was performed with the standard avidin‐biotin‐horseradish peroxidize method (Vectastain ABC Elite, Vector Labs, UK). Table 2 summarizes the specific primary antibodies used. Sections used for automated HLA class II and synaptophysin quantification were not counterstained. HLA negative controls included omission of primary antibodies.
Table 2.
Primary antibodies used for immunohistochemistry. Abbreviations: MW = microwave; RT = Room temperature.
| Antigen | Antibody type | Source | Dilution | Clone | Antigen retrieval method |
|---|---|---|---|---|---|
| MBP | Polyclonal | R.Reynolds | 1:250 | – | – |
| Synaptophysin | Polyclonal | Dako | 1:200 | – | MW (15 minutes), Dako solution (S1700) |
| Neurofilament | Monoclonal | Chemicon | 1:1000 | RT97 | – |
| HLA Class II | Monoclonal | Dako | 1:50 | CR3/43 | MW (20 minutes), EDTA buffer (pH 8.0) |
| CD3 | Polyclonal | Dako | 1:500 | – | MW (20 minutes), Tris‐EDTA buffer (pH 9.0) |
| β‐APP | Monoclonal | Chemicon | 1:500 | 22C11 | RT (10 minutes), 80% formic acid |
LFB/CFV, MBP and HLA class II‐stained coronal sections were scanned with a QiCAM digital camera fitted to a Nikon E50i microscope with a motorized stage using the 10× objective. Image Scope Pro software (Media Cybernetics, Bethesda MA, USA) was used to reconstruct complete coronal sections of the hippocampus. All captured images were coded and analyzed blind.
Hippocampal anatomy and cytoarchitectonics
The subdivisions of the hippocampal formation are the CA or hippocampus proper, the DG, the subicular complex (SIC) and the entorhinal cortex (EC), the latter two comprising of transitional juxtallocortex rather than archaeocortex (Figure 1). The CA1, CA2‐3 and CA4 hippocampal fields were distinguished based on their cytoarchitectonic characteristics (29). The boundaries between hippocampal fields were delineated in 10 µm CFV‐stained sections in accordance with the definitions of West and Gundersen (72). Fields CA2 and CA3 were considered together because of difficulty in reliably distinguishing the border between the two in Nissl‐stained sections. The CA forms part of the floor of the temporal horn of the lateral ventricle and is therefore lined with ependyma, whereas the DG is lined with pia matter.
Figure 1.
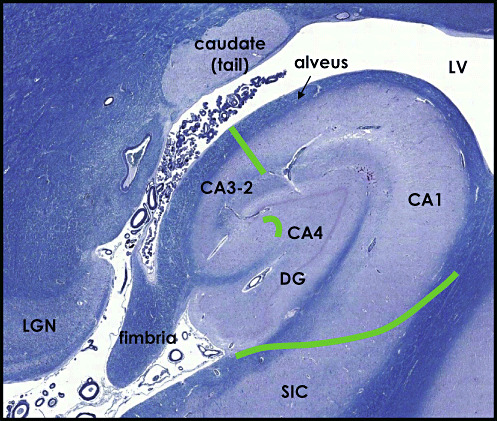
LFB/CFV‐stained section illustrating the major subdivisions of the hippocampal formation: Ammon's horn (CA) comprising of fields CA1, CA3‐2 and CA4 and the dentate gyrus (DG). Borders were delineated based on cytoarchitectonic characteristics in accordance with the definitions of West and Gundersen (1990) (75). SIC = subicular complex, LV = lateral ventricle, LGN = lateral geniculate nucleus.
Staging of multiple sclerosis lesions
Cortical lesions were classified according to their level of microglial activation on the basis of density and distribution of HLA class II‐positive cells as active, chronic active or chronic inactive using the staging criteria described by Peterson et al (49). MBP, LFB/HLA class II and LFB/PAS‐stained serial sections were used to detect products of myelin breakdown in macrophages and assess ongoing demyelinating activity.
Neuronal counts in Ammon's horn
Neurones were counted using the empirical method 16, 50. The number of neurones (N) was estimated from the formula: N = n/g. Firstly, the total number of neuronal segments (n) were counted in 10 µm LFB/CFV sections from the MS cases in CA1 (n = 13), CA3‐2 (n = 15) and CA4 (n = 13) and controls (n = 7) (Table 1). All neuronal segments identified in fields CA1, CA3‐2 and CA4 were manually tagged and counted on images of five serial hippocampal sections per case, using Image Pro‐plus 6.0 software (Media Cybernetics). Neurones were identified by the presence of their CFV‐stained cytoplasm, large, lucent, centrally placed nucleus with a single nucleolus. Secondly, to determine the g number, neurones were followed through the images of the serial sections by tracking their segments using Adobe Photoshop 5.0 software. An unbiased sample of neurones was chosen by systematic sampling. The number of images that each neurone appeared on was determined for a total of 50 neurones (50) and averaged to calculate the g number per case. Total neuronal counts per case were defined as the sum of neuronal counts in CA1, CA3‐2 and CA4. To evaluate intra‐observer reproducibility, neuronal counts were performed in 10 randomly selected blocks on two separate occasions (coefficient of error (CE)CA1 = 0.034, CECA3‐2 = 0.025, CECA4 = 0.031). Independent quantification by two operators (SD and RP) in 10 randomly selected blocks, revealed a high level of inter‐rater agreement in all three hippocampal fields (rPCA1 = 0.93, rPCA3‐2 = 0.95 and rPCA4 = 0.96, at P < 0.001).
Neuronal morphometry
Quantitative morphometric analysis was performed on digital images of 10 µm thick LFB/CFV sections captured with the 20× objective of a Nikon E1000M microscope fitted with a QiCAM digital camera (QImaging Inc, Surrey BC, Canada). Sections from 15 MS and seven control hippocampal blocks were used (Table 1). A consecutive series of images were captured from CA4, CA3‐2 and CA1 fields. Images were then coded for blinding. One hundred neurones with a visible nucleolus were tagged and randomly sampled from each hippocampal field. Neuronal size (µm2) was measured as neuronal cell body cross‐sectional area by tracing the outline of the soma. The “fcircle” function, defined by 4π[area/perimeter2], was used as a measure of neuronal shape changes (38). According to the fcircle formula, increasing fcircle values correspond to objects that are increasingly circular rather than elliptical and vice versa.
Measurement of hippocampal atrophy
Estimation of hippocampal atrophy was performed on digital reconstructions of LFB/CFV‐stained coronal sections from 13 MS and seven control hippocampal blocks at the level of the LGN (Table 1). The total area of the hippocampus was manually outlined and measured on five LFB/CFV‐stained sections from each block using Image Pro‐plus 6.0 software. The total coronal hippocampal cross‐sectional area included the DG and the CA (fields CA1, CA2, CA3) but not the subiculum or the fimbria (Figure 1). The average total coronal hippocampal area was calculated for each case. Independent quantification of total hippocampal area by two operators (SD and DP) in 20 randomly selected blocks revealed a high level of inter‐rater agreement (rP = 0.92, P < 0.001). Intra‐observer reproducibility was evaluated by outlining the total hippocampal area in 10 randomly selected blocks on two separate occasions (CE = 0.046).
Quantification of demyelination
To achieve maximal sensitivity in detecting GM demyelination MBP immunohistochemistry was used in addition to routine Luxol fast blue staining (30). Areas of complete myelin loss were traced manually on three sections per block using Image Pro‐Plus 6.0 software and their surface areas measured and averaged. Measurements were expressed as a percentage of the demyelinated area of the total coronal hippocampal area, which included the DG and the CA (fields CA1, CA2, CA3) but not the subiculum or the fimbria. MS055 was omitted from the quantification because part of its CA1 was missing. Independent quantification of total areas of demyelination by two operators (SD and DP) in 10 randomly selected blocks revealed a high level of inter‐rater agreement (rP = 0.90, P < 0.001). Intra‐observer reproducibility was evaluated by outlining the total hippocampal areas of demyelination in 10 randomly selected blocks on two separate occasions (CE = 0.049).
Quantification of HLA class II immunoreactivity
HLA class II immunohistochemistry was performed on 10 µm thick coronal hippocampal sections from 15 MS and seven control hippocampal blocks corresponding to the level of the LGN (Table 1). The area covered by HLA class II immunoreactivity was measured on images from three coronal sections per block using Image Pro‐Plus 6.0 software by counting the number of pixels above a set threshold. Images were converted to gray scale 8bpp. Signal intensity segmentation thresholds were defined to optimize accuracy and reproducibility. Vessels and artefacts were manually excluded. The total area of the hippocampus and the cross‐sectional areas of CA1, CA3‐2, CA4, the DG and the fimbria were outlined on CFV/LFB stained coronal sections and transferred to HLA class II stained images in order to delineate the boundaries of the above structures. HLA class II immunoreactivity was quantified in CA1, CA3‐2, CA4 and the DG and expressed as a percentage of the sampled area covered by HLA class II immunostaining.
Quantification of synaptic density
Synaptic density was quantified using synaptophysin immunohistochemistry according to a modification of the method described by Masliah et al (43). Digital images of synaptophysin‐stained 5 µm sections were captured with the 20× objective of a Nikon E1000M microscope with a QiCAM camera (QImaging Inc.). Light settings were kept constant. Vessels and neuronal perikarya were manually excluded. For each hippocampal field, optical density (OD) of pixels was measured in three images of the neuropil and an image of non‐demyelinated WM (alveus). The OD for each hippocampal field was calculated by averaging the ODs of the three neuropil images and subtracting the OD of the image of the WM, which was considered background. Quantification was performed on sections from the 15 MS and the seven matching control hippocampal blocks at the level of the LGN (Table 1).
Statistical analysis
Means were tested for significance with the student's t‐test. Mean neuronal counts were compared among hippocampal fields with demyelinated lesions, fields without lesions and controls using ANOVA and pairwise comparisons were performed with Tukey's post‐hoc test. Fisher's exact test was used for comparisons of lesion incidence between female or male gender and the chi‐square test to examine lesion distribution in the different hippocampal areas. Analysis of covariance (ANCOVA) and the LSD post‐hoc test were used to compare hippocampal cross‐sectional areas between MS cases and controls with brain weight as a covariate. Age was not used as a covariate in comparing hippocampal cross‐sectional areas because the two groups do not differ significantly in age (61 ± 13.4 years for MS and 63 ± 15.1 for controls, P = 0.82), correlation analysis revealed no association between age and hippocampal cross‐sectional area (r = −0.22, P = 0.35) and exploratory ANCOVA analysis of cross‐sectional areas with age as a covariate showed that it does not influence hippocampal cross‐sectional area (P = 0.16). Correlation analysis was performed with the Spearman's rank correlation test. Multiple linear regression analysis was used to determine the relative strength of the correlations using the pathological parameters determined as the dependent variables and the clinical and post‐mortem parameters (Table 1) as the independent variables. Significance was assessed at P < 0.05. The Pearson's correlation coefficient was used as a measure of inter‐rater variability. All values are reported as mean ± SD. PRISM‐4 (GraphPad) and SPSS (version 14) were used for statistical analysis.
RESULTS
Demyelination in the MS archaeocortex
Demyelinated lesions affecting the hippocampus were detected in 24 of the 45 MS cases examined (53.3%; Table 3). A total of 41 demyelinated lesions were identified (35 hippocampal lesions and six involving only the fimbria). The mean number of lesions per hippocampus affected by demyelination was 1.5 ± 0.88 and ranged from one to four lesions per case. The size of these lesions varied considerably. Demyelination was expressed as percentage of hippocampal coronally sectioned area that showed myelin loss. Demyelination averaged 30.4% ± 22% of the total cross‐sectional area of the hippocampus and ranged from 1.8% to 95.4% (Table 3).
Table 3.
Demyelinating lesions in the hippocampal formation. Abbreviations: C.A. = chronic active; C.I. = chronic inactive; A. = active; DG = dentate gyrus; SIC = subicular complex; EC = entorhinal cortex.
| Case | Lesions | Pattern | Stage | Choroid plexus/ Meninges | Hippocampal fields and related structures involved | %DM | % HLA class II IR | ||||||
|---|---|---|---|---|---|---|---|---|---|---|---|---|---|
| CA1 | CA3‐2 | CA4 | DG | SIC | EC | Fimbria | |||||||
| MS014 | 1 | III | C.I. | −/− | + | 1.8 | − | ||||||
| MS043* | 2 | III | C.I. | −/− | + | 18.6 | 22.8 | ||||||
| MS055* | 3 | I | C.I. | 0/0 | + | + | † | 7.9 | |||||
| MS056* | 4 | IV | C.I. | 0/0 | + | + | + | + | 26.5 | 7.3 | |||
| MS060 | 5 | II | C.A. | −/− | + | + | 15.4 | – | |||||
| MS063 | 6 | – | – | −/− | + | – | – | ||||||
| MS064* | 7 | IV | C.A. | −/+ | + | + | + | + | 28.1 | 8.8 | |||
| MS066* | 8 | II | C.I. | 0/+ | + | 2 | 7.8 | ||||||
| MS068* | 9 | III | C.I. | −/− | + | 47.1 | 9.9 | ||||||
| 10 | I | C.I. | + | + | |||||||||
| 11 | – | – | + | ||||||||||
| MS070 | 12 | – | – | −/− | + | 28.5 | – | ||||||
| 13 | IV | C.I. | + | ||||||||||
| 14 | III | C.I. | + | ||||||||||
| MS080 | 15 | III | C.I. | +/+ | + | + | + | 44.7 | – | ||||
| 16 | IV | C.I. | + | ||||||||||
| MS082 | 17 | III | C.I. | 0/0 | + | 8.4 | – | ||||||
| MS086 | 18 | – | – | −/+ | + | – | |||||||
| MS088* | 19 | III | C.I. | 0/+ | + | + | + | 29.9 | 10.9 | ||||
| 20 | II | C.I. | + | ||||||||||
| MS093 | 21 | II | C.I. | −/+ | + | 49.7 | – | ||||||
| MS098 | 22 | IV | C.A. | −/− | + | + | + | + | + | + | 69.2 | – | |
| MS121 | 23 | I | C.A. | +/+ | + | + | + | + | 39.3 | – | |||
| MS129* | 24 | I | C.I. | −/+ | + | + | 27.1 | 12.7 | |||||
| MS130 | 25 | IV | C.I. | 0/+ | + | 27 | – | ||||||
| MS136 | 26 | II | C.I. | +/+ | + | 19 | – | ||||||
| MS146 | 27 | IV | C.A. | 0/0 | + | + | + | 31.2 | – | ||||
| 28 | II | C.A. | + | ||||||||||
| MS170 | 29 | – | – | 0/− | + | – | – | ||||||
| MS176* | 30 | I | C.I. | −/− | + | + | + | + | 8.9 | 12.1 | |||
| MS179* | 31 | IV | C.A. | −/+ | + | + | 15.2 | 14.1 | |||||
| 32 | III | C.I. | + | ||||||||||
| MS180 | 33 | II | C.I. | −/+ | + | 50.6 | – | ||||||
| 34 | IV | C.I. | + | ||||||||||
| 35 | II | C.I. | + | ||||||||||
| 36 | II | A. | + | ||||||||||
| MS216* | 37 | – | +/+ | + | – | 12.1 | |||||||
| MS230* | 38 | IV | C.I. | −/− | + | + | + | + | + | + | + | 95.4 | 9.6 |
| MS255 | 39 | II | C.A. | +/+ | + | + | + | 15.7 | – | ||||
| 40 | II | C.I. | + | ||||||||||
| 41 | III | C.A. | + | ||||||||||
| Cortical | 35 | I:5, II:1 | C.I.:25 | ||||||||||
| Fimbrial | 6 | 1, | C.A.:9 | 18 | 11 | 4 | 11 | 7 | 8 | 16 | 30.4 ± 22 | 10.5 ± 2.2 | |
| Total lesions | 41 | III:9, IV:10 | A.:1 | ||||||||||
Demyelination was not quantified for MS055 because part of the hippocampus was missing.
Demyelination was detected in a total of 28 out of the 45 blocks examined. The asterisks denote cases used for quantitative analysis. Demyelination (%DM) is expressed as percentage of the DG and CA coronal cross‐sectional area showing myelin loss. HLA class II immunoreactivity (% HLA class II IR) is expressed as percentage of the DG and Ammon's horn fields covered by HLA class II immunostaining. Values are available only for the cases used for quantification of neuronal loss and hippocampal atrophy. Three more MS cases with estimated HLA class II immuoreactivity (MS073: 6.0%, MS081: 6.5%, MS162: 10.0%) are not presented in the table because they exhibited no demyelinated lesions. Meningeal and choroid plexus inflammation detected with HLA class II and CD3 staining. ‘+’ denotes inflammation; ‘−‘ denotes control levels of staining; 0 = choroid plexus or meninges missing.
Lesion distribution in the MS archaeocortex
Several lesions were not restricted to the hippocampal formation but also affected adjacent structures (e.g. parahippocampal gyrus). In some cases hippocampal plaques appeared to be part of periventricular lesions involving the temporal horns of the lateral ventricle also affecting structures on the opposite side of the ventricular lumen (Figure 2A,B,E). No hippocampal region (DG, CA4, CA3‐2, CA1, SIC, EC) or the fimbria was spared in our group of cases (Table 3). Demyelination commonly affected more than one hippocampal area and was not limited by anatomical borders. The CA1 field exhibited the highest frequency of involvement (18/24), which may at least partly reflect its size (Table 3). Plaques affecting CA1 occurred in some cases as isolated lesions and in others as parts of larger lesions extending medially to the subiculum and laterally to CA3‐2 and CA4. The medial aspect of the DG was affected in 11 out of the 24 cases that displayed demyelination. Field CA4 showed the lowest frequency of involvement (4/24) and in all cases it appeared to be affected by lesions extending inwards from the pial lining of the DG. Statistical analysis of lesion distribution revealed that the different hippocampal regions and fields may not be randomly affected by demyelination with a greatest predilection for lesion formation in CA1 (P = 0.0014).
Figure 2.

Patterns of hippocampal lesions. A. Control hippocampus. B. Extensive demyelinated lesion not restricted to the hippocampus but also involving neighboring periventricular structures. C. Type I lesion affecting the CA1 gray matter and the parahippocampal gyrus white matter, D. type II intracortical lesion involving the stratum pyramidale of CA3‐2. E. Type III lesion in the medial aspect of the dentate gyrus (DG), and a type IV subependymal lesion extending throughout the alveus to the the CA1 cortex. Extensive periventricular demyelination. F. Higher magnification of the DG type III lesion showing demyelination extending from the pial surface to the hilus (CA4) of the dentate gyrus. MBP immunohistochemistry.
Patterns of gray and white matter involvement
A modification of the cortical lesion classification system by Böet al (8) was adopted in order to accommodate for the peculiarities of hippocampal architecture. When parts of the same lesion affected different cortical layers, these lesions were classified according to the most extensive pattern encountered. Four lesion patterns were distinguished: (i) those affecting both GM and WM but not extending to the ependymal or pial surface (type I), noted in five of the 35 lesions identified (14.3%; Figure 2C); (ii) those restricted to the GM (type II) seen in 11 out of the 35 cortical lesions found (31.4%; Figure 2D); (iii) those involving the ependymal or pial surface but affecting only the most superficial layer of GM or WM (type III; Figure 2E,F), encountered in nine out of the 35 lesions (25.7%) detected; and finally (iv) those involving the ependymal surface and affecting both underlying layers of GM and WM (type IV), a pattern seen in 10 out of 35 cortical lesions (28.5%) found in our sample (Figure 2E). Thus, the majority of lesions exhibited a subpial or subependymal pattern of demyelination (54.3%; types III and IV together; Table 3). All DG lesions involved its pial surface and tended to extend into the molecular and granular layer (type III).
Lesion staging
The majority of cortical lesions (25/35, 71.4%) were chronic inactive with a density of HLA class II+ cells similar to or lower than that seen in normal appearing cortex (Figure 3A,B; Table 3). Inactive lesion edges appeared indistinguishable from normal appearing tissue surrounding the lesion in terms of cellularity, HLA class II+cell density and microglial morphology. In chronic inactive cortical lesions the morphology of the HLA class II+ cells was that of resting ramified microglia with slender processes (Figure 3B, inset). No CD3+ cells were seen in the lesion centers (Figure 3C).
Figure 3.

Lesion staging. Chronic inactive lesion: MBP immunostaining showing demyelination in CA1 (A), with HLA class II+ cell density the same or lower than surrounding normal appearing tissue (B). HLA class II+cells have a ramified microglial morphology (B‐inset). Few CD3+ cells in the alveus affected by the lesion (C). The majority of hippocampal cortical lesions 25/35 (71.4%) were at this stage. D. Chronic active lesion affecting the dentate gyrus (MBP immunostaining) Inset: Higher magnification of lesion edge. E. HLA class II staining illustrating a lesion center with reduced density of HLA class II+ cells in the form of ramified microglia and a lesion edge exhibiting an increased density of HLA class II+ activated microglia and macrophages (inset). F. Perivascular (inset) and parenchymal CD3+ cells were noted. G. Active lesion: MBP staining of an MS lesion in the CA1 gray matter (type II). H. Increased density of class II+ cells throughout the demyelinated lesion, the predominant cell type being macrophages (inset). I. Many CD3+ cells within the parenchyma of the lesion and adjacent alveus (inset showing CD3+cell at higher magnification).
Nine cortical chronic active lesions (9/35, 25.7%) with an inactive lesion center and an active lesion edge were identified. The lesion center was characterized by reduced density of HLA class II+ cells in the form of ramified microglia (Figure 3D,E,F). HLA class II+ cells at the active lesion edge exhibited an increased density and an activated microglial and macrophage‐like morphology (Figure 3E inset). Only one acute active cortical lesion was detected (2.86%), characterized by hypercellularity throughout the lesion (Figure 3G,H,I). HLA class II+cells had macrophage‐like and activated microglial morphologies and perivascular CD3+cells were common (Figure 3H inset, I). Statistical analysis revealed no significant difference in HLA class II expression between MS cases and controls in any of the hippocampal regions examined.
Inflammation of the meninges and the choroid plexus
Examination of the temporal horn choroid plexus, which lies adjacent to CA3‐2 and CA1 alveus, revealed small numbers of perivascular HLA class II+process‐bearing cells with small cell bodies, reminiscent of dendritic cells (Figure 4E). CD3+T cells were sparse in the connective tissue stroma of control choroid plexi (Figure 4G). In contrast, increased numbers of CD3+ T cells and cells exhibiting HLA class II upregulation were seen in some MS cases, suggestive of inflammatory infiltration (Figure 4F,H). Inflammation of the choroid plexus was present in four out of the 15 cases with CA1 and /or CA3‐2 lesions, whose choroid plexi were preserved (Table 3). The inflamed choroid plexi were seen in association with both chronic active (2/4) and chronic inactive CA1 and/or CA3‐2 lesions (2/4). Only one of the four inflamed choroid plexi were adjacent to a subependymal (type III) lesion (Table 3). Examination of the leptomeninges lining the DG revealed very few HLA class II+cells and CD3+T lymphocytes in controls (Figure 4A,C). Increased numbers of CD3+ and HLA class II+ cells with monocytic morphology were seen in the meningeal lining of some MS cases (Figure 4B,D). Meningeal inflammation was present in five of the nine MS cases with DG lesions, whose meningeal lining was preserved. Of these, two were chronic active and three were chronic inactive (Table 3). Meningeal inflammatory infiltration (but no choroid plexus inflammation) was also seen in five cases without hippocampal lesions, but these were associated either with demyelination affecting structures of the roof of the temporal horn of the lateral ventricle or the parahippocampal gyrus.
Figure 4.

Inflammation of the choroid plexus of the temporal horn of the lateral ventricle and meninges lining the dentate gyrus. A. HLA class II+cells in the pia matter of a control hippocampus. HLA class II+resting microglia can be seen in the underlying dentate gyrus. B. Abundant HLA class II+ cells in the pia matter lining the dentate gyrus of an multiple sclerosis subject. HLA class II+ activated microglia are visible in the underlying dentate gyrus. C. T cells in the pia matter (arrows) in a section from the same control hippocampal block as (A). CD3 immunohistochemistry. D. Section from the same MS block as (B) showing pial infiltration by numerous CD3+T cells. E. HLA class II+immunoreactivity in the choroid plexus stroma of a control subject. HLA class II+process‐bearing cells, reminiscent of dendritic cells (inset) F. Upregulation of HLA class II immunoreactivity in a choroid plexus overlying a demyelinated lesion. HLA class II immunoreactivity appears to cover most of the choroid plexus stroma. G. Sparse CD3+T cells (arrows) in the choroid plexus stroma of a control subject. H. Numerous CD3+ T cells in the choroid plexus stroma of an MS case. C–H counterstained with LFB. Scale bar: 100 µm.
Neuronal loss in the MS archaeocortex
A marked reduction in neuronal profiles on LFB/CFV sections was evident in different areas of the hippocampus in the MS group compared with the controls (Figure 6A,B). In order to assess the extent of neuronal loss in the MS hippocampus, the total number of neurones counted in the CA1, CA3‐2 and CA4 regions was compared between MS and control cases. An average reduction of 27.0% was observed in CA1 neuronal counts between MS cases and controls (P = 0.04), and a 29.7% reduction between MS cases and controls was found in CA3‐2 (P = 0.002; Table 4). No statistically significant reduction in neuronal counts was found in CA4.
Figure 6.

Neuronal, synaptic and axonal loss in multiple sclerosis (MS) cases. A. Reduced numbers of neuronal profiles in the demyelinated CA2–CA1 junction of MS230, compared with a control (C32) B. LFB/CFV staining. C. Control anti‐synaptophysin immunostaining (SYN) exhibiting a punctate perineuronal staining pattern in CA1 [C22, post‐mortem interval (PMI) = 33 h]. D. MS case exhibiting a marked reduction in synaptophysin positive elements in the same field, despite shorter PMI (MS230, PMI = 31 h). E. Neurofilament staining (RT97) in a cross‐section of control fimbria. F. Substantial reduction in neurofilament immunostaining (RT97) in a cross‐section of the fimbria on an MS case. G. APP+elements (arrows) in longitudinal section in the CA1 alveus of an MS case. H. Cross‐section of two APP+ elements (arrows) in a cross‐section of the fimbria of an MS case. Scale bars represent 100 µm for A–B and 10 µm for C–H.
Table 4.
Summary of neuronal measures. Abbreviations: CA = Ammon's horn; nss = not statistically significant.
| CA field | Measure | Controls Mean (SD) | MS Cases Mean (SD) | % difference (P‐value) |
|---|---|---|---|---|
| CA1 | Numbers | 4805 (1223) | 3508 (1263) | −27.0 (0.04) |
| Size (µm2) | 297.4 (50) | 245.6 (44) | −17.4 (0.022) | |
| Shape (fcircle) | 0.750 (0.04) | 0.757 (0.04) | nss | |
| CA3‐2 | Numbers | 1060 (178) | 746 (203) | −29.7 (0.002) |
| Size (µm2) | 352.3 (25.2) | 317.5 (44) | nss | |
| Shape (fcircle) | 0.639 (0.05) | 0.624 (0.05) | nss | |
| CA4 | Numbers | 634 (142) | 630 (172) | nss |
| Size (µm2) | 353 (42) | 322 (45) | nss | |
| Shape (fcircle) | 0.723 (0.05) | 0.771 (0.05) | +6.57 (0.038) | |
| Total CA | Numbers | 6499 (1276) | 5017 (1194)* | −22.8 (0.021) |
calculated from cases with data for all CA fields (n = 13).
NMSCA1 = 13, NMSCA3‐2 = 15 and NMSCA4 = 13. Ncontrols = 7. Four of the cases used to estimate the neuronal measures: MS073, MS081, MS162 and MS216 exhibited no hippocampal demyelination.
Correlation analysis was used to assess a possible association between neuronal loss and HLA class II immunoreactivity. Neuronal counts in CA3‐2 exhibited a significant correlation with levels of HLA class II immunoreactivity in the same field (rS = −0.534, P = 0.04). Neuronal counts in CA3‐2 and CA4 exhibited a significant negative correlation with the extent of total hippocampal demyelination (rS = −0.66, P = 0.01 and rS = −0.652, P = 0.016, respectively). To further analyze the relationship between demyelination and neuronal loss in the MS hippocampus, we examined whether neuronal counts differed among hippocampal fields affected by lesions, fields not affected by lesions and controls. Total neuronal counts only differed significantly between hippocampi with lesions and controls (P = 0.027). However, in CA3‐2 MS cases with demyelinated lesions (681 ± 288, 35.7% reduction, P = 0.032) and those without lesions (761 ± 189, 28.2% reduction, P = 0.014) exhibited significantly lower neuronal counts than controls (1060 ± 178) (Figure 5C). No significant difference was observed in the number of neurones between the right and left hippocampi in MS or in controls.
Figure 5.

(A) Comparison of hippocampal coronal cross‐sectional area (dentate gyrus and Ammon's horn) at the level of the lateral geniculate nucleus between multiple sclerosis (MS) cases (n = 13) and controls (n = 7) using ANCOVA with brain weight as a covariate (P = 0.004). The regression slopes do not differ significantly (P = 0.85). (B) Mean hippocampal cross‐sectional areas in MS blocks with plaques (n = 9), MS blocks without plaques (n = 4) and controls (n = 7). Both MS blocks with plaques and MS blocks without plaques differed significantly from the controls. Statistical testing performed with ANCOVA and the LSD post‐hoc test using brain weight as a covariate (P = 0.021). (C) Comparison of neuronal counts in different CA fields in MS cases with lesions, MS cases without lesions and controls. Statistical significance in comparing the means of neuronal counts was examined with ANOVA and pairwise comparisons were done with the Tukey's post‐hoc test. (D) Correlation between cross‐sectional area and total CA neuronal counts was examined with the Spearman's rank correlation test and revealed a significant association between the two parameters (rs = 0.58, P = 0.044). (E) Optical density of synaptophysin immunoreactivity in control and MS cases in different hippocampal fields. Synaptophysin microdensity only differed significantly from controls in CA4 (P = 0.014). Synaptophysin microdensity in different fields was tested for significance with the unpaired Student's t test. Asterisks denote statistical significance (* < 0.05, ** < 0.01).
Neuronal atrophy in CA1
Morphometric analysis was used to examine whether hippocampal neurones undergo changes in size and shape that may precede or accompany neuronal loss. A 17.4% reduction in average neuronal size was observed in CA1 (P = 0.022) compared with the controls (Table 4). Significantly higher fcircle values were found only in MS CA4 (P = 0.038), suggesting that neurones there were more rounded than those of the controls (Table 4). Furthermore, neuronal size and fcircle values exhibited no significant association with the extent of HLA class II expression in different hippocampal regions.
The hippocampus in MS exhibits significant atrophy
Comparison of the average hippocampal coronal cross‐sectional area between MS cases (n = 13) and controls (n = 7), using brain weight as a covariate, revealed a 22.3% reduction in the MS blocks, which indicates a significant degree of atrophy in the MS hippocampus (ANCOVA, P = 0.004; Figure 5A). The average hippocampal cross‐sectional area exhibited no significant correlation either with the level of HLA class II immunoreactivity or with the extent of demyelination seen in the MS hippocampal blocks. To further analyze the relationship between demyelination and hippocampal atrophy in the MS hippocampus, we examined whether hippocampal cross‐sectional area differed among MS cases with demyelinated lesions, MS cases not affected by lesions and controls, using brain weight as a covariate. Cross‐sectional area was decreased by 22.2% in MS hippocampal blocks with lesions (n = 9, LSD post‐hoc test P = 0.007) and by 17.9% in MS blocks without lesions (n = 4, LSD post‐hoc test P = 0.036), compared with controls (n = 7, ANCOVA, P = 0.021) (Figure 5B). The average cross‐sectional area correlated with the total neuronal counts (rS = 0.58, P = 0.044) (Figure 5D) as well as with neurone size in CA1 (rS = 0.691, P = 0.009), suggesting that hippocampal atrophy is largely determined by neuronal atrophy and loss.
Synaptic density changes, axonal damage and loss
Synaptophysin immunostaining was used as a marker of neuronal afferent connectivity. In control tissue, anti‐synaptophysin immunohistochemistry exhibited a perineuronal and diffuse neuropil punctate pattern of staining (Figure 6C), which has been shown to represent clusters of synaptic vesicles (40). In some MS cases there was a marked reduction in the intensity and density of synaptophysin staining observed by microscopic examination (Figure 6C,D). Quantification of the density of the synaptophysin immunolabeled neuropil revealed a 46.1% reduction in synaptic terminals in MS CA4 (P = 0.014) compared with the controls (Figure 5E). Synaptophysin microdensity did not correlate with demyelination, neuronal loss or HLA class II immunoreactivity.
Neurofilament staining showed relative sparing of axons in demyelinated lesions. In some cases a marked decrease of neurofilament immunoreactivity was observed, indicating extensive axonal loss (Figure 6E, F). Assessment of β‐APP immunostaining revealed scarce β‐APP+ elements in the alveus and fimbria, suggestive of ongoing axonal damage (22). The few β‐APP+ elements detected were seen in chronic demyelinated lesions (Figure 6H).
Pathological changes and clinical parameters
The relationship between the pathological findings and the available clinical parameters (disease duration, age, relapse rate, time to EDSS7 or age at presentation) was examined using correlation analysis. A significant negative correlation between total HLA class II immunoreactivity (in CA1, CA3‐2 and CA4) and disease duration was revealed (rS = −0.557, P = 0.031).
In addition, there was no significant difference in the size of demyelinated lesions, HLA class II immunoreactivity, neuronal counts, neuronal size or shape, total hippocampal coronal cross‐sectional area or synaptophysin staining between right and left hemisphere or male and female gender in either the MS cases or controls.
Post‐mortem conditions did not significantly affect the pathological parameters measured as correlation analysis revealed no significant association with PMI and fixation time either in the MS cases or in the control group. Synaptophysin immunoreactivity exhibited a negative correlation with fixation time in the control group (rS = −0.793, P = 0.033). However, there was no significant difference in fixation time between MS cases and controls.
DISCUSSION
Our data confirms that the hippocampus is a CNS structure commonly affected by demyelinated plaques and provides evidence of substantial hippocampal cortical atrophy and neuronal pathology. To our knowledge, this is the most detailed investigation to date of the pathological changes occurring in the archaeocortex in progressive MS. A number of pathological features were examined in order to compare and contrast archaeocortical pathology to that of the MS neocortex.
Demyelinating plaques were detected in more than half of our MS hippocampal samples (53.3%) with a mean disease duration of 27.8 years. Another recent study on paraffin‐embedded MS hippocampal blocks with comparable disease duration (mean = 25.4 years), identified demyelinating lesions in 15 out of 19 sampled hippocampal blocks (79%) using PLP immunostaining (25). This difference in the frequency of hippocampal involvement may reflect sampling differences in the two data sets. Nevertheless, both estimates indicate that the hippocampus is a common site for lesion formation. The CA1‐3 fields of the hippocampal formation are covered by ependyma and form the floor of the temporal horn of the lateral ventricle, whereas the DG forms part of the external surface of the brain and is lined by pia mater. The high frequency of hippocampal involvement is consistent with the documented predilection for lesion formation in periventricular and subpial areas 33, 62.
In the MS neocortex, type III subpial lesions that extend from the pial surface into the cortex have been found to be most abundant (8). These lesions rarely contain perivascular cuffs (49) and are often associated with inflammatory infiltration of the overlying meninges (36). Their pathogenesis is thought to be associated with humoral factors, presumably diffusing into the outer cortical layers from the pial surface (8). This view is supported by studies demonstrating that exposure to CSF taken from MS patients causes cultured neurones to undergo apoptosis 2, 13.
As reported for neocortical lesions, our data indicates that the majority of archaeocortical lesions (54.3%) involve its ependymal and pial surface and extend into the underlying WM, GM (type III) or both (type IV). The most commonly affected hippocampal areas (CA1 and DG) form most of the free hippocampal surface that is encompassed by CSF. The ependymal and pial hippocampal surfaces were affected with equal frequency, which indicates that the CSF–brain interface is equally permeable to CSF‐borne cytotoxic factors on both pial and ependymal sides. The analogy between the subpial neocortical lesions and the subpial and subependymal archaeocortical lesions corroborates the CSF humoral factor hypothesis of subpial cortical demyelination. The high prevalence of subependymal hippocampal lesions that are not lined by pia matter suggests that the meninges themselves may not have a role in the pathogenesis of hippocampal subpial demyelination. In light of this, the pathogenetic mechanism of subpial cortical lesion formation may not differ from that of the periventricular WM plaques.
Recently, subpial cortical lesions in patients with severe progressive MS were found to be associated with ectopic B cell follicles in the overlying meninges 42, 58. The formation of such lymphoid tissue may signify the development of an autonomous immune reaction, independent from the peripheral lymphoid organs, localized within the limits of the blood–brain barrier. Choroid and meningeal inflammatory infiltration were only observed in 4/15 and 5/9 cases with lesions in the adjacent CA3‐1 or the DG, respectively, which suggests that in the remaining blocks there was no ectopic follicle formation. Nevertheless, the possibility of B cell follicle formation in the choroid plexus merits investigation.
Most lesions were chronic inactive as described in neocortical lesions from progressive MS patients (69). In keeping with previously reported observations from the MS neocortex, archaeocortical lesions are characterized by a relative paucity of inflammatory cells, with activated microglia being the main inflammatory cell type 9, 10, 49. Nonetheless, macrophages were occasionally seen in the active edge of chronic active lesions when these involved fiber bundles (alveus or perforant pathway in the stratum lacunosum‐moleculare) and in a single active lesion in the CA1 stratum pyramidale. In the hippocampal formation, two main cortical structures (the CA and the DG) are apposed in the absence of a clearly defined underlying WM layer. Input tracts and association fibers run within the cortical layers. The hippocampal archaeocortex exhibits a lower level of differentiation than the neocortex at the histological level and it is possible it may be sharing common features with WM in comprising an environment permissive to the conversion of local microglia to macrophages and the trafficking of blood‐borne monocytes.
Brain and spinal cord atrophy is an established feature of MS. It exhibits a strong association with physical disability (41) and evidence suggests that it may start early in the disease course (17). Atrophy affects both white 12, 23 and GM (54) and is thought to result from myelin and neuronal and/or axonal loss. In this study, hippocampal cross‐sectional area exhibited a strong correlation with neuronal counts but no significant association with the extent of demyelination, which suggests that atrophy in the MS archaeocortex may be largely determined by neuronal atrophy and loss.
Imaging data indicates that cognitive impairments are related to cortical atrophy (46). Reduced hippocampal volume associated with cognitive deficits is an early feature of Alzheimer's disease (AD) (31). The 22.3% reduction in the cross‐sectional area of the hippocampal formation described by this study is in accordance with previously reported mean reductions of 10% (18) and 31% (27) in the hippocampal coronal cross‐sectional area in AD patients. Neocortical thinning by 9% has been reported in the MS motor cortex, compared with controls (69).
Brain volume reduction, assessed by MRI, has been shown to correlate better than lesion load with speed of cognitive processing; suggesting that pathology beyond focal lesions may be important in MS (39). The notion of more diffuse pathological changes taking place in the normal appearing GM and WM was confirmed by the observation that neuronal loss occurs in the medial dorsal nucleus of the thalamus in the absence of demyelinating plaques (14). Our finding of significant atrophy and neuronal loss not only in MS hippocampal fields affected by lesions but also in the ones without evidence of demyelination supports the concept of diffuse neuronal injury in the normal appearing GM.
This is the first study to present quantitative evidence of neuronal loss, the most conclusive evidence of irreversible damage, in the MS archaecortex. A recent quantitative single voxel MRS study investigated changes in NAA (N‐acetyl aspartate) concentrations in the MS hippocampus (26). Reduction in the NAA signal intensity is considered to reflect neuronal and/or axonal loss (7). No significant reduction in the NAA concentration was detected, suggesting that neuro‐axonal damage did not occur. However, this could have been caused by the particularly poor spectral quality of the hippocampus as the authors pointed out, in combination with the considerably lower mean age of the MS patients that were included in the study.
The exact mechanism of neuronal death in MS has not been clearly established and most data come from animal models of MS. TUNEL labeling and caspase‐3 staining of neurones in cortical MS lesions implicates some apoptotic cell death in chronic active and chronic inactive lesions 49, 65. Neuronal apoptosis in an environment of inflammatory demyelination has also been described in animal models 1, 45. Neuronal injury in archaeocortical lesions may be brought about by inflammatory mediators like nitric oxide (60), matrix metaloproteinases (47) or direct CD8 T cell cytotoxic action (44). Given that glutamate is the major excitatory transmitter in the three major pathways of the hippocampal formation: the perforant pathway terminating in the DG and forming an passant synapses with distal apical dendrites of CA neurones, the mossy fibers terminating in the CA3 pyramidal cell layer and the Schaeffer collaterals terminating in the CA1 pyramidal cell layer, excitotoxicity is likely to play an important role in hippocampal neuronal loss 61, 64.
In addition, retrograde neuronal degeneration secondary to axotomy taking place in WM lesions (63) is a plausible explanation for diffuse neuronal loss leading to generalized cortical atrophy (37). Demyelinated lesions in the fimbria were found in 18 out of the 45 MS blocks examined and in several cases displayed evidence of axonal damage and loss. Following axotomy and depending on the distance of the point of transection to the cell body, axotomized neurones may either die or survive to undergo degenerative changes including shrinkage and de‐afferentation (21). The reduced mean neuronal size in MS CA1 is consistent with the possibility of CA neurones undergoing slow degeneration following axonal transection and in keeping with reports from neocortical lesions (69). Field CA1 is generally considered the most vulnerable area of CA, being particularly susceptible to ischemia, excitotoxicity and pathological changes in AD, whereas CA3‐2 is generally considered more resistant 5, 24. The almost equal degree of neuronal loss observed in CA1 and CA3‐2 is suggestive of a specific pathogenetic mechanism rather than a general increased susceptibility to insults and is compatible with cell death following axotomy.
Normal ageing is unlikely to have contributed to the estimated extent of neuronal loss, not only because the MS cases are age‐matched with the controls but also because of the fact that we detected significant neuronal loss in CA1 and CA3‐2 while age‐related loss of hippocampal neurones is known to affect only CA4 (70).
It is highly likely that the majority of our cohort of patients were given high‐dose glucocorticoid pulse therapy as treatment for MS exacerbations at some stage in their disease course. Recently, high‐dose glucocorticoid treatment was reported to aggravate retinal ganglion cell apoptosis in MOG‐EAE in the rat (19). Evidence suggests that prolonged exposure of hippocampal neurones to high levels of glucocorticoids leads to irreversible pathological changes including hippocampal atrophy and neurone loss in rodents and primates 55, 56, 68. The fields thought to be most susceptible to glucocorticoids are CA3 and CA2 (56). Despite the lack of direct evidence of hippocampal pathology secondary to exposure to supraphysiologic levels of glucocorticoids in humans, this possibility merits consideration.
Dendritic transection (49) and loss of synaptic input (69) are well documented in neocortical MS lesions. CA4 was not found to be frequently affected by demyelinating plaques. However, it receives its synaptic input from the granule cell layer of the DG (29), a common site for lesion formation. This indicates that the significant reduction in synaptic density found in CA4 may at least partly reflect neuronal injury and loss in the granule cell layer. Although de‐afferentation may indicate severe failure of neuronal circuits (57), evidence suggests that it may be largely reversible (73). Compensatory synaptic remodeling may at least partly explain why no significant reduction of synaptophysin OD was observed in CA1 and CA3‐2 in the presence of severe neuronal loss.
Although severe dementia is uncommon in MS patients, cognitive deficits are frequent, occurring in all disease subtypes and often appearing in the early stages of MS (4). The cognitive domains reported to be affected in MS include memory, attention, speed of information processing, abstract reasoning, several components of executive function and visuospatial abilities (51). The selective impairment of cognitive functions in the absence of generalized dementia is indicative of the involvement of specific neuronal circuits. Lesions restricted to the hippocampus have been proven sufficient to produce clinically significant and long‐lasting memory impairment (74, 75). In the context of this notion, selective hippocampal malfunction could potentially explain episodic memory loss, the cognitive deficit most frequently encountered in MS patients (20).
Neuronal loss ranging from 23% to 69% in different fields of the hippocampus have been reported in patients with established AD, the most common cause of dementia 34, 59, 71. Therefore, the magnitude of neuronal loss found in our MS patient cohort (∼23%) is within the range seen in AD, which suggests that it may sufficiently contribute to the development of memory deficits. However, evidence suggests that other anatomical structures implicated in memory functions like some thalamic nuclei and/or their interconnections may also be affected in MS (26). Unfortunately, no clinical information was available that could allow us to reliably correlate the pathological changes seen in this particular cohort of patients with a measurable level of cognitive impairment. Nevertheless, the extent of hippocampal pathology observed in this study may represent the clinicopathological substrate of memory‐related deficits seen in some MS patients.
In conclusion, our data suggests that the hippocampal archaeocortex shares common pathological features with the MS neocortex. Among others, we demonstrated similarities in demyelinating pattern, inflammatory activity, tissue atrophy, neuronal loss and de‐afferentation. This implies the presence of a common pathogenetic mechanism being responsible for both subpial and subependymal GM pathology. Furthermore, these findings support a role of changes in the archaeocortex as the pathological substrate of episodic memory impairment that frequently occurs in MS patients.
ACKNOWLEDGMENTS
Tissue samples were supplied by the UK Multiple Sclerosis Tissue Bank (http://www.ukmstissuebank.imperial.ac.uk), funded by the MS Society of Great Britain and Northern Ireland (registered charity 207495). The authors would like to thank Miss Nirali Patel of the UK MS Tissue bank for her excellent technical assistance and help in the collection of material used in this study, Ms Lynne Christian for expert immunohistochemical advice, Dr Federico Roncaroli for confirmation of diagnosis and Dr Stephen Gentleman for helpful discussions. We would also like to thank Dr Kirstin Goldring and the Parkinson's Disease Society Tissue Bank at Imperial College, funded by the Parkinson's Disease Society of the United Kingdom, registered charity 948776 for providing two control hippocampal blocks and the relevant clinical data. This work was supported by The Multiple Sclerosis Society of Great Britain and Northern Ireland (grant No. 747/02).
REFERENCES
- 1. Ahmed Z, Doward AI, Pryce G, Taylor DL, Pocock JM, Leonard JP et al (2002) A role for caspase‐1 and ‐3 in the pathology of experimental allergic encephalomyelitis: inflammation versus degeneration. Am J Pathol 161:1577–1586. [DOI] [PMC free article] [PubMed] [Google Scholar]
- 2. Alcazar A, Regidor I, Masjuan J, Salinas M, Alvarez‐Cermeno JC (1998) Induction of apoptosis by cerebrospinal fluid from patients with primary‐progressive multiple sclerosis in cultured neurons. Neurosci Lett 255:75–78. [DOI] [PubMed] [Google Scholar]
- 3. Amato MP, Bartolozzi ML, Zipoli V, Portaccio E, Mortilla M, Guidi L et al (2004) Neocortical volume decrease in relapsing–remitting MS patients with mild cognitive impairment. Neurology 63:89–93. [DOI] [PubMed] [Google Scholar]
- 4. Amato MP, Ponziani G, Siracusa G, Sorbi S (2001) Cognitive dysfunction in early‐onset multiple sclerosis: a reappraisal after 10 years. Arch Neurol 58:1602–1606. [DOI] [PubMed] [Google Scholar]
- 5. Arnold SE, Hyman BT, Flory J, Damasio AR, Van Hoesen GW (1991) The topographical and neuroanatomical distribution of neurofibrillary tangles and neuritic plaques in the cerebral cortex of patients with Alzheimer's disease. Cerebral Cortex 1:103–116. [DOI] [PubMed] [Google Scholar]
- 6. Bermel RA, Innus MD, Tjoa CW, Bakshi R (2003) Selective caudate atrophy in multiple sclerosis: a 3D MRI parecelation study. Neuroreport 14:335–339. [DOI] [PubMed] [Google Scholar]
- 7. Bjartmar C, Battistuta J, Terada N, Dupree E, Trapp BD (2002) N‐acetyl aspartate is an axon‐specific marker of mature white matter in vivo: a biochemical and immunohistochemical study on the rat optic nerve. Ann Neurol 51:51–58. [DOI] [PubMed] [Google Scholar]
- 8. Bö L, Vedeler CA, Nyland HI, Trapp BD, Mork SJ (2003) Subpial demyelination in the cerebral cortex of multiple sclerosis patients. J Neuropathol Exp Neurol 62:723–732. [DOI] [PubMed] [Google Scholar]
- 9. Bö L, Vedeler CA, Nyland H, Trapp BD, Mork SJ (2003) Intracortical multiple sclerosis lesions are not associated with increased lymphocyte infiltration. Mult Scler 9:323–331. [DOI] [PubMed] [Google Scholar]
- 10. Brink BP, Veerhuis R, Esther C, Breij ECW, Van Der Valk P, Dijkstra CD, Bö L (2005) The pathology of multiple sclerosis is location‐dependent: no significant complement activation is detected in purely cortical lesions. J Neuropathol Exp Neurol 64: 147–155. [DOI] [PubMed] [Google Scholar]
- 11. Brownell B, Hughes JT (1962) The distribution of plaques in the cerebrum in multiple sclerosis. J Neurol Neurosur Ps 25:315–321. [DOI] [PMC free article] [PubMed] [Google Scholar]
- 12. Chard DT, Griffin CM, Parker GJ, Kapoor R, Thompson AJ, Miller DH (2002) Brain atrophy in clinically early relapsing–remitting multiple sclerosis. Brain 125:327–337. [DOI] [PubMed] [Google Scholar]
- 13. Cid C, Alcazar A, Regidor I, Masjuan J, Salinas M, Alvarez‐Cermeno JC (2002) Neuronal apoptosis induced by cerebrospinal fluid from multiple sclerosis patients correlates with hypointense lesions on T1 magnetic resonance imaging. J Neurol Sci 193:103–109. [DOI] [PubMed] [Google Scholar]
- 14. Cifelli A, Arridge M, Jezzard P, Esiri MM, Palace J, Matthews PM (2002) Thalamic neurodegeneration in multiple sclerosis. Ann Neurol 52:650–653. [DOI] [PubMed] [Google Scholar]
- 15. Cipolotti L, Bird CM (2006) Amnesia and the hippocampus. Curr Opin Neurol 19:593–598. [DOI] [PubMed] [Google Scholar]
- 16. Coggeshall RE, LaForte R, Klein CM (1990) Calibration of methods for determining numbers of dorsal root ganglion cells. J Neurosci Meth 35:187–194. [DOI] [PubMed] [Google Scholar]
- 17. Dalton CM, Brex PA, Jenkins R, Fox NC, Miszkiel KA, Crum WR, O’Riordan JI, Plant GT, Thompson AJ, Miller DH (2002) Progressive ventricular enlargement in patients with clinically isolated syndromes is associated with early development of multiple sclerosis. J Neurol Neurosur Ps 73:141–147. [DOI] [PMC free article] [PubMed] [Google Scholar]
- 18. De la Monte SM (1989) Quantitation of cerebral atrophy in preclinical and end‐stage Alzheimer's disease. Ann Neurol 25:450–459. [DOI] [PubMed] [Google Scholar]
- 19. Diem R, Hobom M, Weissert R, Storch MK, Meyer R, Bähr M (2003) Methylprednisolone increases neuronal apoptosis during autoimmune CNS inflammation by inhibition of an endogenous neuroprotective pathway. J Neurosci 23:6993–7000. [DOI] [PMC free article] [PubMed] [Google Scholar]
- 20. Drake MA, Carra A, Allegri RF, Luetic G (2006) Differential patterns of memory performance in relapsing, remitting and secondary progressive multiple sclerosis. Neurol India 54:370–376. [DOI] [PubMed] [Google Scholar]
- 21. Egan DA, Flumerfelt BA, Gwyn DG (1977) Axon reaction in the red nucleus of the rat. Acta Neuropath (Berl) 37:13–19. [DOI] [PubMed] [Google Scholar]
- 22. Ferguson B, Matyszak MK, Esiri MM, Perry VH (1997) Axonal damage in acute multiple sclerosis lesions. Brain 120:393–399. [DOI] [PubMed] [Google Scholar]
- 23. Ge Y, Grossman RI, Udupa JK, Babb JS, Nyul LG, Kolson DL (2001) Brain atrophy in relapsing–remitting multiple sclerosis: fractional volumetric analysis of gray matter and white matter. Radiology 220:606–610. [DOI] [PubMed] [Google Scholar]
- 24. Gee CE, Banquet P, Raineteau O, Rietschin L, Kirbach SW, Gerber U (2006) NMDA receptors and the differential ischemic vulnerability of hippocampal neuron. Eur J Neurosci 23:2595–2603. [DOI] [PubMed] [Google Scholar]
- 25. Geurts JJ, Bö L, Roosendaal SD, Hazes T, Daniels R, Barkhof F et al (2007) Extensive hippocampal demyelination in multiple sclerosis. J Neuropath Exp Neur 66:819–827. [DOI] [PubMed] [Google Scholar]
- 26. Geurts JJ, Reuling IE, Vrenken H, Uitdehaag BM, Polman CH, Castelijns JA, Barkhof F, Pouwels PJ (2006) MR spectroscopic evidence for thalamic and hippocampal, but not cortical, damage in multiple sclerosis. Magnet Reson Med 55:478–483. [DOI] [PubMed] [Google Scholar]
- 27. Huesgen CT, Burger PC, Crain BJ, Johnson GA (1993) In vitro microscopy of the hippocampus in Alzheimer's disease. Neurology 43:145–152. [DOI] [PubMed] [Google Scholar]
- 28. Huitinga I, De Groot CJ, Van Der Valk P, Kamphorst W, Tilders FJH, Swaab DF (2001) Hypothalamic lesions in multiple sclerosis. J Neuropath Exp Neur 60:1208–1218. [DOI] [PubMed] [Google Scholar]
- 29. Insausti R, Amaral DG (2003) Hippocampal formation. In: The Human Nervous System, 2nd edn. Paxinos (ed) G, pp. 871–914. Academic Press, San Diego. [Google Scholar]
- 30. Itoyama Y, Sternberger NH, Webster HD, Quarles RH, Cohen SR, Richardson EP Jr (1980) Immunocytochemical observations on the distribution of myelin‐associated glycoprotein and myelin basic protein in multiple sclerosis lesions. Ann Neurol 7:167–177. [DOI] [PubMed] [Google Scholar]
- 31. Jack CR Jr, Petersen RC, Xu YC, O’Brien PC, Smith GE, Ivnik RJ et al (1999) Prediction of AD with MRI‐based hippocampal volume in mild cognitive impairment. Neurology 52:1397–1403. [DOI] [PMC free article] [PubMed] [Google Scholar]
- 32. Kenealy PM, Beaumont JG, Lintern TC, Murrell RC (2002) Autobiographical memory in advanced multiple sclerosis: assessment of episodic and personal semantic memory across three time spans. J Int Neuropsych Soc 8:855–860. [DOI] [PubMed] [Google Scholar]
- 33. Kidd D, Barkhof F, McConnell R, Algra PR, Allen IV, Revesz T (1999) Cortical lesions in multiple sclerosis. Brain 122:17–26. [DOI] [PubMed] [Google Scholar]
- 34. Kril JJ, Patel S, Harding AJ, Halliday GM (2002) Patients with vascular dementia due to microvascular pathology have significant hippocampal neuronal loss. J Neurol Neurosur Ps 72:747–751. [DOI] [PMC free article] [PubMed] [Google Scholar]
- 35. Kutzelnigg A, Lucchinetti CF, Stadelmann C, Brück W, Rauschka H, Bergmann M et al (2005) Cortical demyelination and diffuse white matter injury in multiple sclerosis. Brain 128:2705–2712. [DOI] [PubMed] [Google Scholar]
- 36. Lassmann H, Brück W, Lucchinetti CF (2007) The immunopathology of multiple sclerosis: an overview. Brain Pathol 17:210–218. [DOI] [PMC free article] [PubMed] [Google Scholar]
- 37. Lassmann H (2005) Pathology of neurons in multiple sclerosis. In: Multiple Sclerosis as a Neuronal Disease. Waxman S (ed), pp. 153–164. Elsevier, Amsterdam. [Google Scholar]
- 38. Law AJ, Harrison PJ (2003) The distribution and morphology of prefrontal cortex pyramidal neurons identified using anti‐neurofilament antibodies SMI32, N200 and FNP7. Normative data and a comparison in subjects with schizophrenia, bipolar disorder or major depression. J Psychiatr Res 37:487–499. [DOI] [PubMed] [Google Scholar]
- 39. Lazeron RHC, De Sonneville LMJ, Scheltens P, Polman CH, Barkhof F (2006) Cognitive slowing inn multiple sclerosis is strongly associated with brain volume reduction. Mult Scler 12:760–768. [DOI] [PubMed] [Google Scholar]
- 40. Leclerc N, Beesley PW, Brown I, Colonnier M, Gurd JW, Paladino T, Hawkes R (1989) Synaptophysin expression during synaptogenesis in the rat cerebellar cortex. J Comp Neurol 280:197–212. [DOI] [PubMed] [Google Scholar]
- 41. Losseff NA, Wang L, Lai HM, Yoo DS, Gawne‐Cain ML, McDonald WI et al (1996) progressive cerebral atrophy in multiple sclerosis. A new reproducible and sensitive MRI method with potential to monitor disease progression. Brain 119:701–708. [DOI] [PubMed] [Google Scholar]
- 42. Magliozzi R, Howell O, Vora A, Serafini B, Nicholas R, Puopolo M, et al (2007) Meningeal B‐cell follicles in secondary progressive multiple sclerosis associate with early onset of disease and severe cortical pathology. Brain 130:1089–1104. [DOI] [PubMed] [Google Scholar]
- 43. Masliah E, Terry RD, Alford M, DeTeresa R (1990) Quantitative immunohistochemistry of synaptophysin in human neocortex: an alternative method to estimate density of presynaptic terminals in paraffin sections. J Histochem Cytochem 38:837–844. [DOI] [PubMed] [Google Scholar]
- 44. Medana I, Martinic MA, Wekerle H, Neumann H (2001) Transection of major histocompatibility complex class I‐induced neurites by cytotoxic T lymphocytes. Am J Pathol 159:809–815. [DOI] [PMC free article] [PubMed] [Google Scholar]
- 45. Meyer R, Weissert R, Diem R, Storch MK, De Graaf KL, Kramer B, Bahr M (2001) Acute neuronal apoptosis in a rat model of multiple sclerosis. J Neurosci 21:6214–6220. [DOI] [PMC free article] [PubMed] [Google Scholar]
- 46. Morgen K, Sammer G, Courtney SM, Wolters T, Melchior H, Blecker CR et al (2006) Evidence for a direct association between cortical atrophy and cognitive impairment in relapsing–remitting MS. Neuroimage 30:891–898. [DOI] [PubMed] [Google Scholar]
- 47. Newman TA, Wooley ST, Hughes PM, Sibson NR, Anthony DC, Perry VH (2001) T‐cell and macrophage mediated axon damage in the absence of a CNS specific immune response: involvement of metalloproteinases. Brain 124:2203–2214. [DOI] [PubMed] [Google Scholar]
- 48. Niepel G, Tench CR, Morgan PS, Evangelou N, Auer DP, Constantinescu CS (2006) Deep gray matter and fatigue in MS: a T1 relaxation time study. J Neurol 253:896–902. [DOI] [PubMed] [Google Scholar]
- 49. Peterson JW, Bo L, Mork S, Chang A, Trapp BD (2001) Transected neurites, apoptotic neurons, and reduced inflammation in cortical multiple sclerosis lesions. Ann Neurol 50:389–400. [DOI] [PubMed] [Google Scholar]
- 50. Pover CM, Coggeshall RE (1991) Verification of the dissector method for counting neurons, with comments on the empirical method. Anat Rec 231:573–578. [DOI] [PubMed] [Google Scholar]
- 51. Rao SM, Leo GJ, Bernardin L, Unverzagt F (1991a) Cognitive dysfunction in multiple sclerosis. I. Frequency, patterns, and prediction. Neurology 41:685–691. [DOI] [PubMed] [Google Scholar]
- 52. Rao SM, Leo GJ, Ellington L, Nauertz T, Bernardin L, Unverzagt F (1991b) Cognitive dysfunction in multiple sclerosis. II. Impact on employment and social functioning. Neurology 41:692–696. [DOI] [PubMed] [Google Scholar]
- 53. Rovaris M, Filippi M, Minicucci L, Ianucci G, Santuccio G, Possa F, Comi G (2000) Cortical/subcortical disease burden and cognitive impairment in patients with multiple sclerosis. Am J Neuroradiol 21:402–408. [PMC free article] [PubMed] [Google Scholar]
- 54. Sanfilipo MP, Benedict RH, Sharma J, Weinstock‐Guttman B, Bakshi R (2005) The relationship between whole brain volume and disability in multiple sclerosis: a comparison of normalized gray vs. white matter with misclassification correction. Neuroimage 26:1068–1077. [DOI] [PubMed] [Google Scholar]
- 55. Sapolsky R (1985) A possible mechanism for glucocorticoid toxicity in the hippocampus: increased vulnerability of neurons to metabolic insults. J Neurosci 5:1228–1232. [DOI] [PMC free article] [PubMed] [Google Scholar]
- 56. Sapolsky R, Uno H, Rebert C, Finch E (1990) Hippocampal damage associated with prolonged glucocorticoid exposure in primates. J Neurosci 10:2897–2902. [DOI] [PMC free article] [PubMed] [Google Scholar]
- 57. Selkoe DJ (2002) Alzheimer's disease is a synaptic failure. Science 298:789–791. [DOI] [PubMed] [Google Scholar]
- 58. Serafini B, Rosicarelli B, Magliozzi R, Stigliano E, Aloisi F (2004) Detection of ectopic B‐cell follicles with germinal centres in the meninges of patients with secondary progressive multiple sclerosis. Brain Pathol 14:164–174. [DOI] [PMC free article] [PubMed] [Google Scholar]
- 59. Simic G, Kostovic I, Winblad B, Bogdanovic N (1997) Volume and number of neurons of the human hippocampal formation in normal aging and Alzheimer's disease. J Comp Neurol 379:4820–4894. [DOI] [PubMed] [Google Scholar]
- 60. Smith KJ, Kapoor R, Hall SM, Davies M (2001) Electrically active axons degenerate when exposed to nitric oxide. Ann Neurol 49:470–476. [PubMed] [Google Scholar]
- 61. Smith T, Groom A, Zhu B, Turski L (2000b) Autoimmune encephalomyelitis ameliorated by AMPA antagonists. Nat Med 6:62–66. [DOI] [PubMed] [Google Scholar]
- 62. Steiner G (1931) Regionale Verteilung der Entmarkungsherde in ihrer Bedeutung für die Pathogenese der multiplen Sclerose. Krankheitserreger und Gewebsbefund bei multipler Sclerose. Springer: Berlin. [Google Scholar]
- 63. Trapp BD, Peterson J, Ransohoff RM, Rudick R, Mork S, Bo L (1998) Axonal transection in the lesions of multiple sclerosis. New Engl J Med 338:278–285. [DOI] [PubMed] [Google Scholar]
- 64. Vercellino M, Merola A, Piacentino C, Votta B, Capello E, Mancardi GL et al (2007) Altered glutamate reuptake in relapsing‐remitting and secondary progressive multiple sclerosis cortex: correlation with microglia infiltration, demyelination, and neuronal and synaptic damage. J Neuropathol Exp Neur 66:732–739. [DOI] [PubMed] [Google Scholar]
- 65. Vercellino M, Plano F, Votta B, Mutani R, Giordana MT, Cavalla P (2005) Grey matter pathology in multiple sclerosis. J Neuropathol Exp Neur 64:1101–1107. [DOI] [PubMed] [Google Scholar]
- 66. Vora AJ, Hawk S, Garey L, Gentleman S, Lee C, Polito A et al (2000) The UK multiple sclerosis tissue bank‐ a resource for MS research. Mult Scler 6:S49. [Google Scholar]
- 67. Vrenken H, Geurts JJ, Knol DL, Van Dijk LN, Dattola V, Jasperse B, et al (2006) Whole brain T1 mapping in multiple sclerosis: global changes of normal appearing gray and white matter. Radiology 240:811–820. [DOI] [PubMed] [Google Scholar]
- 68. Watanabe Y, Gould E, McEwen BS (1992) Stress induces atrophy of apical dendrites of hippocampal CA3 pyramidal neurons. Brain Res 588:341–345. [DOI] [PubMed] [Google Scholar]
- 69. Wegner C, Esiri MM, Chance SA, Palace J, Matthews PM (2006) Neocortical neuronal, synaptic, and glial loss in multiple sclerosis. Neurology 67:960–967. [DOI] [PubMed] [Google Scholar]
- 70. West MJ (1993) Regionally specific loss of neurons in the aging human hippocampus. Neurobiol Aging 14:287–293. [DOI] [PubMed] [Google Scholar]
- 71. West MJ, Coleman PD, Flood DG, Troncoso JC (1994) Differences in the pattern of hippocampal neuronal loss in normal ageing and Alzheimer's disease. Lancet 344:769–772. [DOI] [PubMed] [Google Scholar]
- 72. West MJ, Gundersen HJ (1990) Unbiased stereological estimation of the number of neurons in the human hippocampus. J Comp Neurol 296:1–22. [DOI] [PubMed] [Google Scholar]
- 73. Zhu B, Luo L, Wayne Moore GR, Paty DW, Cynader MS (2003) Dendritic and synaptic pathology in experimental autoimmune encephalomyelitis. Am J Pathol 162:1639–1645. [DOI] [PMC free article] [PubMed] [Google Scholar]
- 74. Zola‐Morgan S, Squire LR (1993) Neuroanatomy of memory. Annu Rev Neurosci 16:547–563. [DOI] [PubMed] [Google Scholar]
- 75. Zola‐Morgan S, Squire LR, Amaral DG (1986) Human amnesia and the medial temporal region: enduring memory impairment following a bilateral lesion limited to field CA1 of the hippocampus. J Neurosci 6:2950–2967. [DOI] [PMC free article] [PubMed] [Google Scholar]