

Abstract
Metastasis is the primary cause of cancer mortality, and cancer frequently metastasizes to the liver. It is not clear whether liver immune tolerance mechanisms contribute to cancer outcomes. We report that liver metastases diminish immunotherapy efficacy systemically in patients and preclinical models. Patients with liver metastases derive limited benefit from immunotherapy independent of other established biomarkers of response. In multiple mouse models, we show that liver metastases siphon activated CD8+ T cells from systemic circulation. Within the liver, activated antigen-specific Fas+CD8+ T cells undergo apoptosis following their interaction with FasL+CD11b+F4/80+ monocyte-derived macrophages. Consequently, liver metastases create a systemic immune desert in preclinical models. Similarly, patients with liver metastases have reduced peripheral T cell numbers and diminished tumoral T cell diversity and function. In preclinical models, liver-directed radiotherapy eliminates immunosuppressive hepatic macrophages, increases hepatic T cell survival and reduces hepatic siphoning of T cells. Thus, liver metastases co-opt host peripheral tolerance mechanisms to cause acquired immunotherapy resistance through CD8+ T cell deletion, and the combination of liver-directed radiotherapy and immunotherapy could promote systemic antitumor immunity.
It is poorly understood whether metastatic progression to specific organs contributes to cancer mortality by compromising systemic antitumoral immunity and limiting immunotherapy efficacy1. The liver is a frequent site of cancer metastases2 and promotes immune tolerance in the context of autoimmune diseases, viral infections and organ transplantation3. Mechanisms underlying hepatic immune tolerance include ineffective immune synapses resulting in T cell anergy4, regulatory T cell induction5 or effector T cell elimination6. However, the importance of these liver immune tolerance mechanisms in the context of cancer is poorly defined.
Immunotherapy harnesses tumor-infiltrating effector CD8+ T cells to induce durable treatment responses in a wide variety of cancers7,8. Prior studies have defined mechanisms of response9–11 and resistance12 that contribute to local T cell function and dysfunction within tumors13,14. Unfortunately, etiologies of the frequent systemic absence of CD8+ T cells from human tumors, also referred to as an ‘immune desert’ state15, remain poorly defined. Further, it is unknown whether hepatic immune tolerance mechanisms drive therapeutic resistance to immunotherapy.
Herein, we explored the role of liver metastasis in systemic immunity and immunotherapy efficacy. We found that the presence of liver metastasis is associated with poor response to immunotherapy in patients with cancer. In mice, liver metastases recruit immunosuppressive macrophages that promote antigen-specific T cell apoptosis within the liver. This results in a systemic loss of T cells and diminished immunotherapy efficacy. Radiotherapy may enhance immunotherapy efficacy in patients16–18 and preclinical models19–21. It remains unexamined which metastatic sites should be targeted with radiotherapy to maximize these immune-stimulatory effects in combination with immunotherapy. We demonstrate that liver-directed radiotherapy reshapes the liver immune microenvironment, stops hepatic siphoning of T cells and restores immunotherapy efficacy in models of liver metastases.
Results
Liver metastasis correlates with diminished immunotherapy efficacy in patients with cancer.
It is unclear whether the location of metastases influence immunotherapy efficacy. To investigate this, we examined two cohorts of patients with metastatic melanoma who were treated with immunotherapy (Cohort 1, Supplementary Table 1) and targeted therapy (Cohort 2, Supplementary Table 2). The three most common organs to which melanoma had spread were the lung, liver and brain. We observed that the presence of baseline liver metastases was associated with diminished response to immunotherapy (Fig. 1a), but not to targeted therapy (Extended Data Fig. 1a). Further, we noted that liver metastases correlated with diminished overall survival (OS) (Fig. 1b) and progression-free survival (PFS) (Extended Data Fig. 1b) in patients with melanoma who received immunotherapy, but not in those who received targeted therapy (Extended Data Fig. 1c,d). To corroborate these results, we next examined two cohorts of patients with non-small-cell lung cancer (NSCLC) who were treated with immunotherapy (279 patients, Cohort 3, Supplementary Table 3) or cytotoxic chemotherapy (149 patients, Cohort 4, Supplementary Table 4). The three most common organs to which NSCLC had spread were the lung, liver and adrenal gland. Again, the presence of liver metastases was associated with inferior response to immunotherapy (Fig. 1c), but not to chemotherapy (Extended Data Fig. 1e). This translated into inferior OS in patients with NSCLC with baseline liver metastases following the receipt of immunotherapy (Fig. 1d), but not following the receipt of chemotherapy (Extended Data Fig. 1f). Together, these data suggest that liver metastasis may influence immunotherapy efficacy.
Fig. 1 |. Liver metastasis correlates with diminished immunotherapy efficacy in patients with cancer.
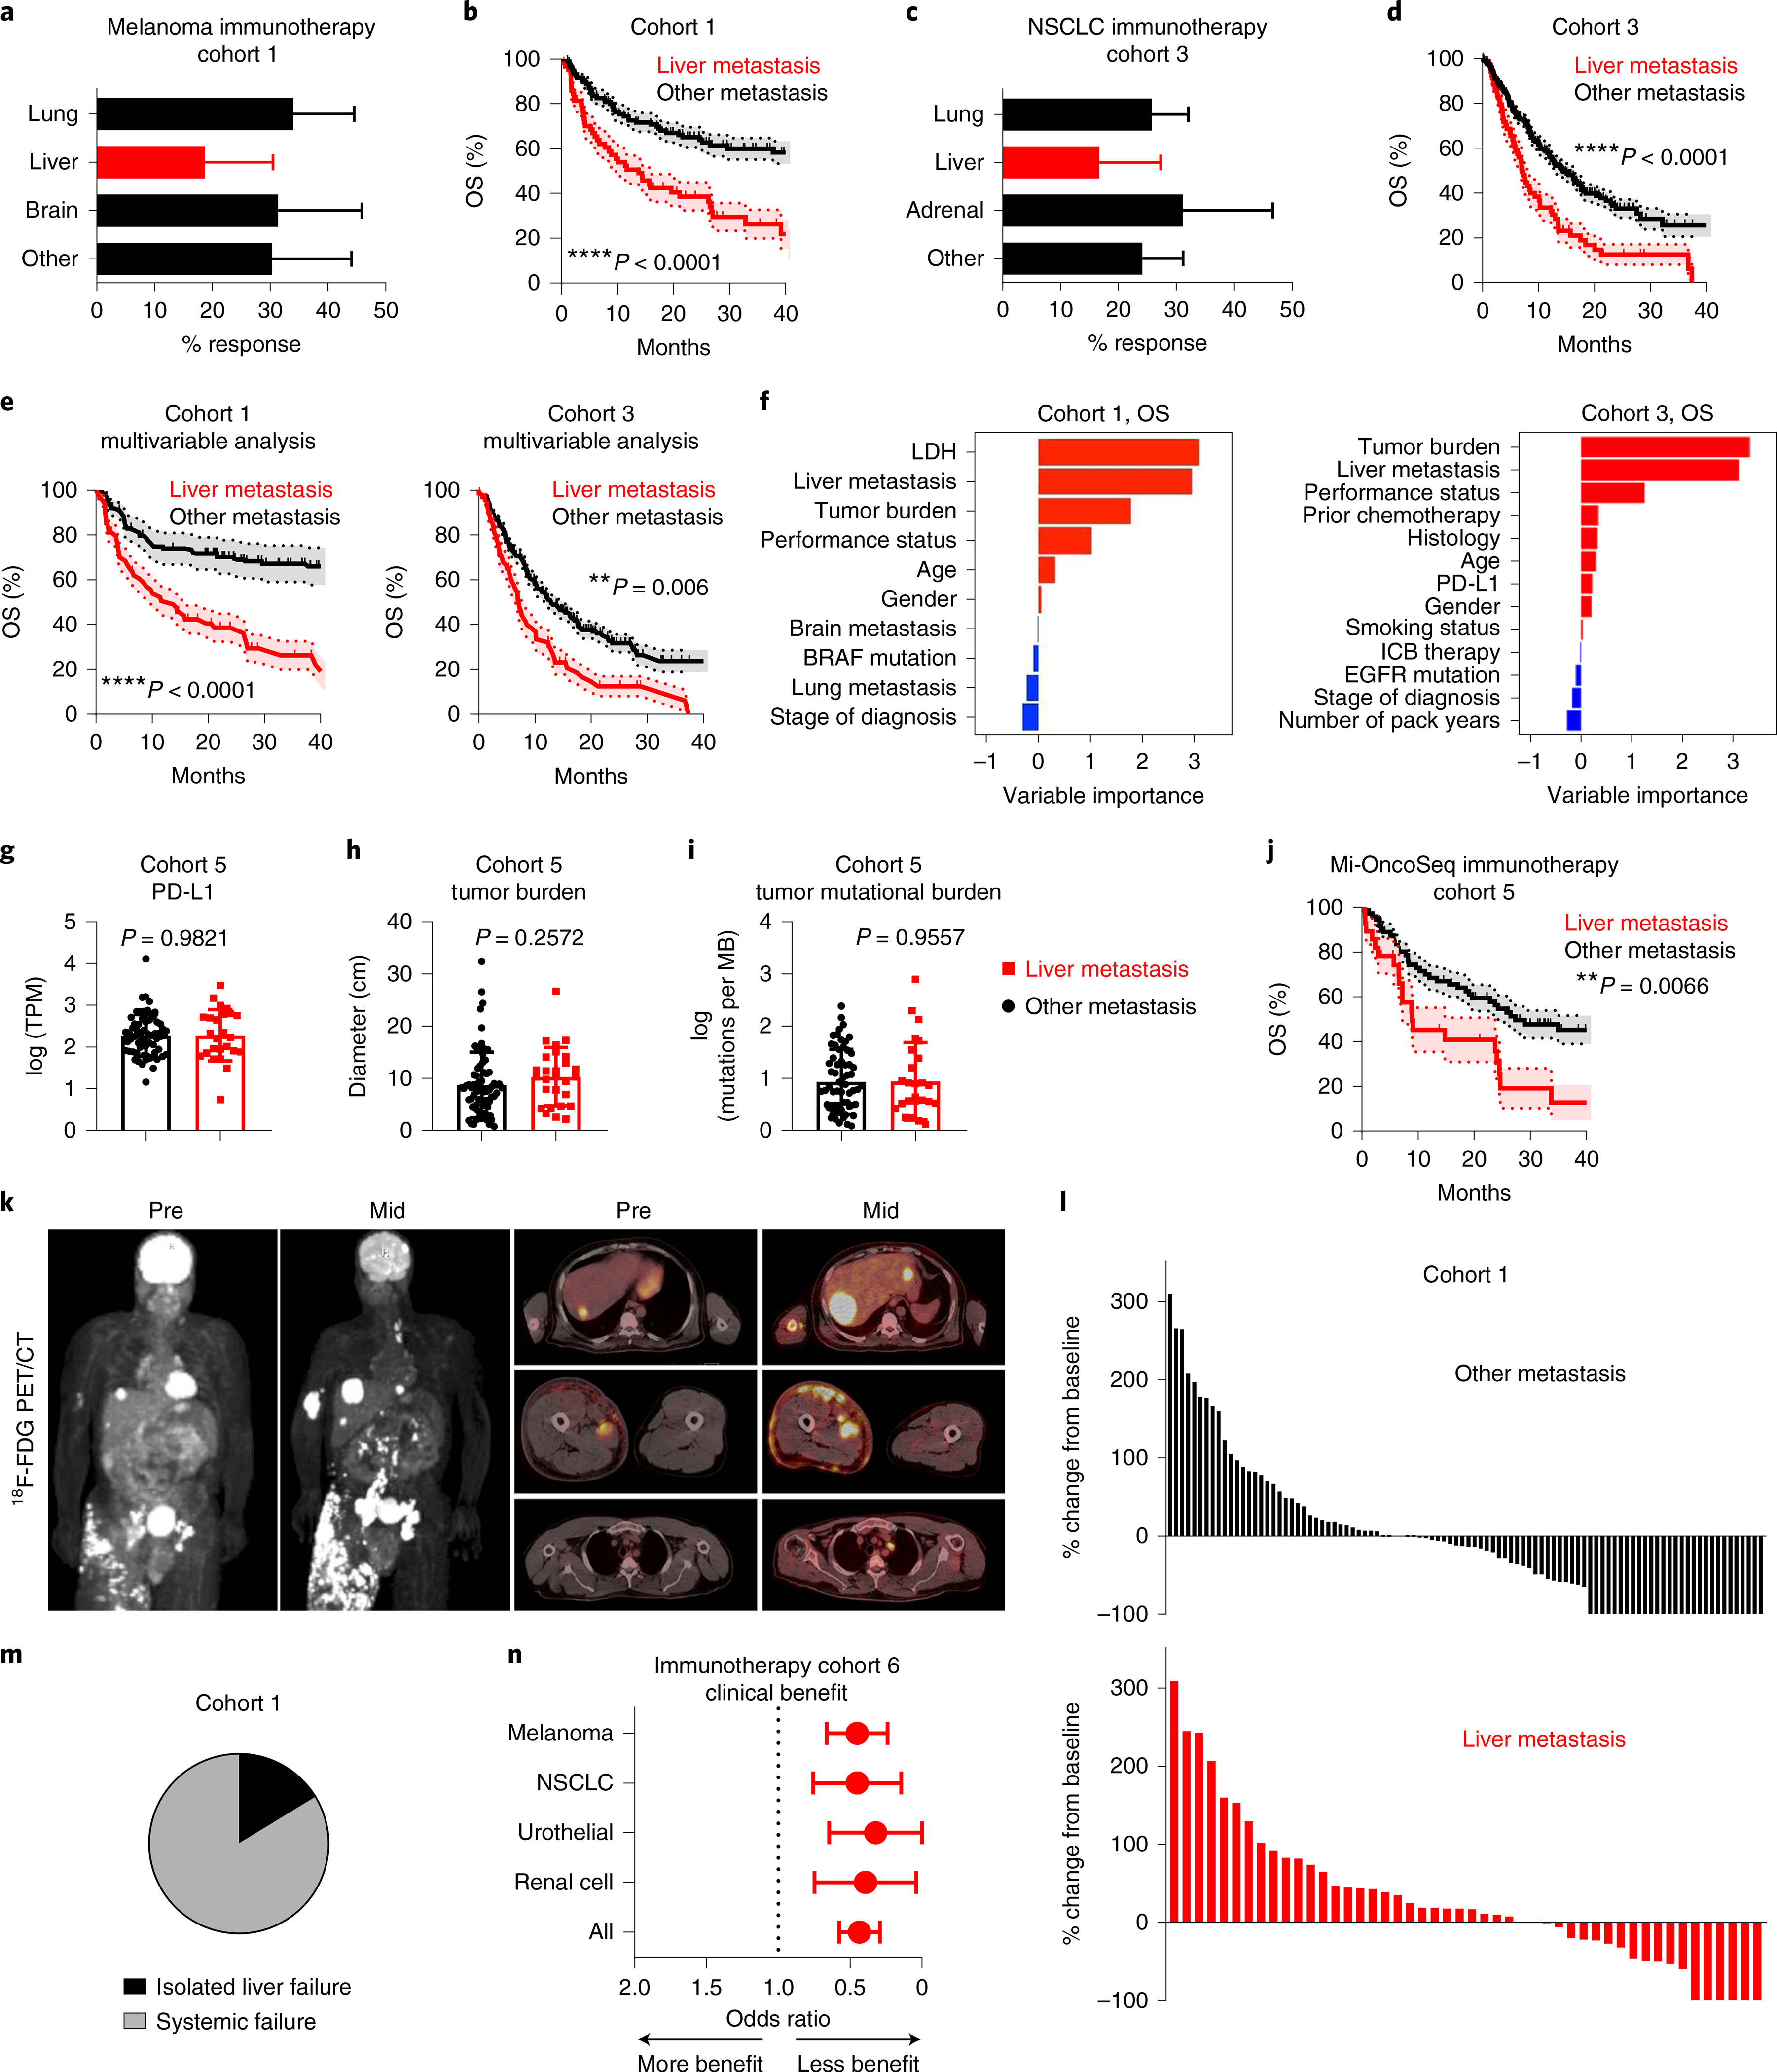
a, Best objective response rates in patients with metastatic melanoma who received immunotherapy, stratified by baseline disease distribution (Cohort 1). Chi-squared for liver metastasis 19.66, P < 0.0001. Data are shown as mean ± s.d.; liver n = 64, brain n = 50, lung n = 94. b, OS (Cohort 1), stratified by liver metastasis. Log-rank test, hazard ratio (HR) = 3.717. The shaded area represents the s.e.; liver n = 64, other n = 118. c, Best objective response rates in patients with metastatic nSCLC who received immunotherapy (Cohort 3), stratified by baseline disease distribution. Chi-squared for liver metastasis 3.29, P = 0.045. Data are shown as mean ± s.d.; liver n = 74, adrenal n = 48, lung n = 214. d, OS (Cohort 3), stratified by presence of liver metastasis. Log-rank test, HR = 2.03. The shaded area represents the s.e.; liver n = 74, other n = 205. e, Inverse-probability-weighted multivariable analysis of OS in patients with melanoma (Cohort 1) and with nSCLC (Cohort 3) who received immunotherapy, stratified by liver metastasis. Log-rank test, HR = 1.75 and 1.61, respectively. Data are shown as mean ± s.d.; melanoma liver n = 63, melanoma other n = 107, nSCLC liver n = 71, nSCLC other n = 186. f, Variable importance quantification from random forest modeling of OS in immunotherapy-treated patients with metastatic melanoma (Cohort 1) and with nSCLC (Cohort 3), immune-checkpoint blockade (ICB). g–i, PD-L1 expression in patients with (n = 25) and without (n = 62) liver metastases, transcripts per million (TPM) (g), tumor burden of patients with (n = 27) and without (n = 70) liver metastases (h), and tumor mutational burden of patients with (n = 26) and without (n = 62) liver metastases (i). Unpaired two-tailed Student’s t-test. Data are shown as mean ± s.d. j, OS, stratified by liver metastases. Log-rank test, HR = 2.444. The shaded area represents the s.e.; liver n = 28, other n = 72. k, Pre- and midtreatment (3 months after therapy initiation) 18F positron emission tomography–computed tomography (PET/CT) scan of a patient with metastatic melanoma with liver metastases who received concurrent ipilimumab and nivolumab. l, Waterfall plot showing change of tumoral burden (Cohort 1) from initiation to best objective response in melanoma patients with liver (n = 48) or other (n = 98) metastases. Unpaired two-tailed Student’s t-test, P = 0.0372. Data are shown as percentage change. m, Frequency of isolated failure in liver versus systemic failure in patients with melanoma (Cohort 1) who have failed immunotherapy, n = 43. n, Odds ratio of best objective clinical benefit rate in patients with the indicated histologies who received immunotherapy, stratified by liver metastasis. Chi-square, melanoma: P = 0.0005, nSCLC: P = 0.0005, urothelial P = 0.0065, renal cell P = 0.013, all P < 0.0001. Data are shown as mean ± s.d.; melanoma n = 378, nSCLC n = 177, renal cell carcinoma n = 84, urothelial n = 79.
To understand whether liver involvement correlated with inferior OS in all subsets of patients, we performed additional analysis in patients with melanoma and with NSCLC who received immunotherapy (Cohorts 1 and 3, respectively). We observed liver metastases correlated with diminished OS in patients with melanoma regardless of tumor burden, number of sites of metastatic involvement, age, gender, prior lines of therapy and lactate dehydrogenase (LDH) levels (Extended Data Fig. 1g–i). We confirmed that patients with melanoma with only liver involvement derived less benefit from immunotherapy than did those with only lung involvement (Extended Data Fig. 1j). In patients with NSCLC, liver metastases correlated with diminished OS regardless of age, gender and type of therapy (Extended Data Fig. 1k). We confirmed that liver metastases negatively correlated with OS in patients with NSCLC with wild-type epidermal growth factor receptor (EGFR) status, in patients with limited tumor burden and in patients receiving first-line therapy (Extended Data Fig. 1l–n). Further, patients with and without liver metastases had equivalent programmed death-ligand 1 (PD-L1) expression (Extended Data Fig. 1o). Multivariable modeling of patients with melanoma (Cohort 1) and with NSCLC (Cohort 3) confirmed that the presence of liver metastasis correlated with inferior PFS and OS in metastatic melanoma and NSCLC when adjusting for clinicopathologic features (Fig. 1e, Extended Data Fig. 1p and Methods). Random forest-based machine-learning modeling of PFS and OS in patients with melanoma and with NSCLC who were receiving immunotherapy identified that the presence of liver metastasis is as an important feature that correlates with inferior PFS and OS in addition to the other clinicopathologic variables that correlate with treatment efficacy including, tumor burden22, PD-L1 (ref. 23), LDH24 and performance status (Fig. 1f and Extended Data Fig. 1q). Tumor mutational burden is an important determinant of immunotherapy efficacy23. We identified a cohort of patients who underwent comprehensive sequencing and received immunotherapy (Cohort 5, Supplementary Table 5). In this cohort, patients with liver metastases had comparable PD-L1 expression, tumor burden, and tumor mutational burden (Fig. 1g–i), but inferior OS comparing to patients without liver metastases (Fig. 1j, Extended Data Fig. 1r and Methods). These data validate that liver metastases negatively correlate with immunotherapy efficacy independently of other established biomarkers of response.
To examine whether patients with liver metastases derive less clinical benefit from immunotherapy because of immune privilege locally within the liver, we characterized the sites and patterns of progression in patients with melanoma with liver metastases who were receiving immunotherapy. Qualitative and quantitative evaluation of the systemic tumor burden of patients with melanoma who were treated with immunotherapy revealed that patients with liver metastases more frequently had increases in their systemic tumor burden than did patients without liver metastases (Fig. 1k,l). Among the patients with liver metastases who failed immunotherapy, we observed an 84% rate of systemic failure with progressive tumor growth throughout the body in other organs (Fig. 1m and Extended Data Fig. 1s). Additionally, we observed that patients with NSCLC with liver metastases had progressive tumor growth in the lung, adrenal glands, bone and lymph nodes in addition to the liver (Extended Data Fig. 1t). These data collectively suggest that liver metastasis may potentially alter systemic antitumor immunity.
To broaden the scope of these findings, we examined a cohort of 718 patients with metastatic melanoma, NSCLC, urothelial and renal cell carcinoma who received immune-checkpoint blockade at a single institution (Cohort 6, Supplementary Table 6). Again, patients with liver metastases had significantly less clinical benefit from immunotherapy, regardless of disease histology (Fig. 1n). We next examined whether there was a correlation between immunotherapy effectiveness and the metastatic tropism to the liver2,23. After adjusting for tumor mutational burden and PD-L1 expression, there remained a strong inverse correlation of liver metastatic tropism, but not lung metastatic tropism, with immunotherapy efficacy (Extended Data Fig. 1u and Supplementary Table 7). These data further associate liver metastasis with diminished immunotherapy efficacy in a wide variety of human cancers.
Liver metastasis diminishes immunotherapy efficacy in mice.
To further explore how liver metastases affect immunotherapy in cancer patients, we established a preclinical model of liver metastasis (Extended Data Fig. 2a and Methods). As expected, mice bearing subcutaneous syngeneic MC38 colorectal cancer tumors efficiently responded to anti-PD-L1 therapy9,25. However, subcutaneous and hepatic tumors uniformly failed to respond to this therapy in mice bearing liver metastases (Fig. 2a–f, Supplementary Fig. 1a and Methods). To confirm this, we established an additional liver tumor model via intrahepatic inoculation (Extended Data Fig. 2b). Again, we observed a complete abrogation of therapeutic response to anti-PD-L1 in mice bearing liver tumors (Extended Data Fig. 2c and Supplementary Fig. 1b). Additionally, we controlled for tumor burden by inoculating mice with additional subcutaneous tumors and observed immunotherapy efficacy in the mice with multiple subcutaneous tumors, but not in mice with liver metastases (Fig. 2g,h, Extended Data Fig. 2d, Supplementary Fig. 1c and Methods). In contrast to mice with liver metastases (Fig. 2i), mice with lung metastases still responded to immunotherapy (Fig. 2j and Methods).
Fig. 2 |. Liver metastasis diminishes immunotherapy efficacy in mice.
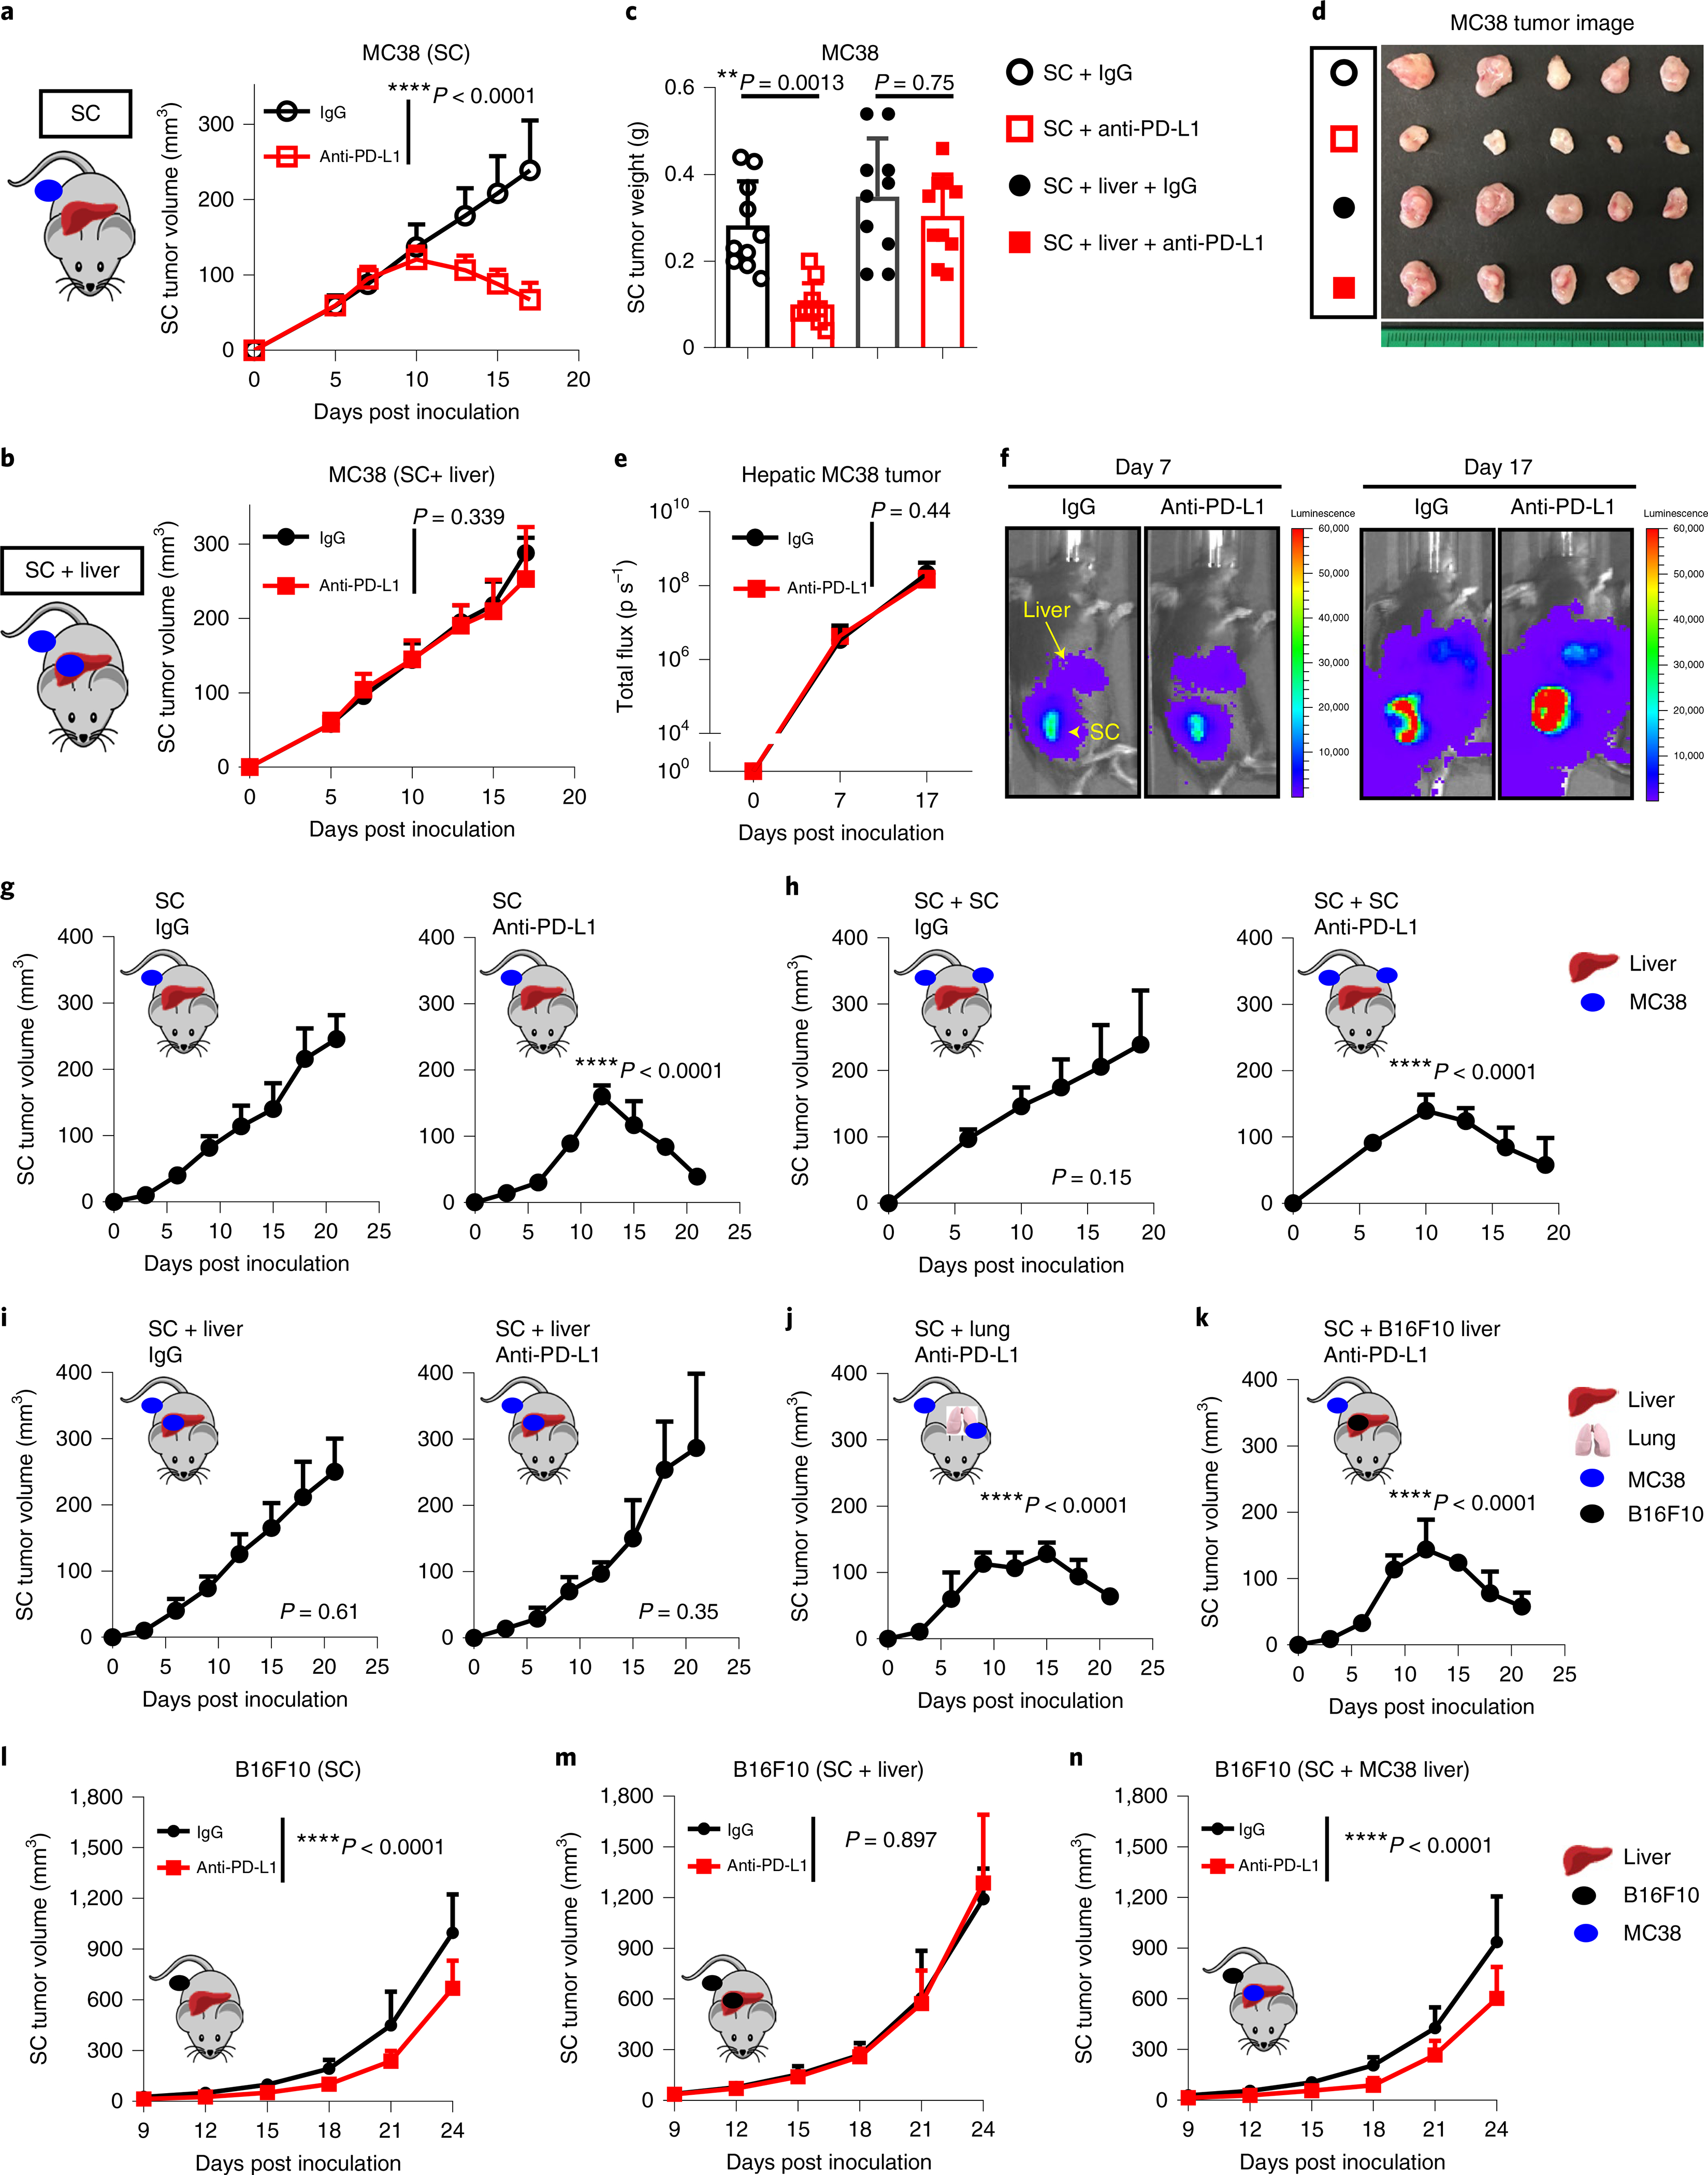
a–d, MC38 subcutaneous tumor growth (a,b) in mice with only subcutaneous (SC) tumors and mice with subcutaneous and liver metastasis (SC + liver) treated with anti-PD-L1. Two-way analysis of variance (AnOVA) was used for statistical analysis. Data are shown as mean ± s.d.; n = 8 per group and 10 per group, respectively. Tumor weights (c) and representative images (d) in mice treated as described above. One-way AnOVA with Tukey’s correction was used for statistical analysis. Data are shown as mean ± s.d.; n = 10 per group, pooled data from 2 independent experiments. e,f, MC38 liver tumor quantification (e) and bioluminescent images (f) in mice bearing liver and subcutaneous tumors treated with isotype (n = 9) and anti-PD-L1 (n = 7). Two-way AnOVA was used for statistical analysis. Data are shown as mean ± s.d. g–k, MC38 subcutaneous tumor growth in mice with a single subcutaneous tumor (SC, g), with bilateral subcutaneous tumors (SC + SC, h), with subcutaneous tumor and liver tumor (SC + liver, i), with subcutaneous tumor and lung tumor (SC + lung, j) or with subcutaneous MC38 tumor and liver B16F10 tumor (SC + B16F10 liver, k) with the indicated treatments. Two-way AnOVA was used for statistical analysis; P values are shown in comparison with the SC IgG group. Data are shown as mean ± s.d.; n = 5 per group. l–n, B16F10 subcutaneous tumor growth in mice with subcutaneous tumors treated with anti-PD-L1 (n = 10) or isotype (n = 6) (l), with subcutaneous and B16F10 liver tumors treated with anti-PD-L1 (n = 7) or isotype (n = 6) (m) or with subcutaneous B16F10 tumor and MC38 liver tumor (SC + MC38 liver) (n) treated with anti-PD-L1 (n = 8) or isotype (n = 6). Two-way AnOVA was used for statistical analysis. Data are shown as mean ± s.d. Data are representative or inclusive of at least two independent experiments (a–n).
We next established mice with subcutaneous MC38 tumors and hepatic B16F10 melanoma tumors or vice-versa (Methods). We found that subcutaneous tumors remained responsive to immunotherapy in mice with a different tumor type in the liver, but were unresponsive in mice with an identical tumor histology in the liver (Fig. 2k–n and Supplementary Fig. 1d). Finally, we inoculated fewer cells subcutaneously and observed that the presence of a liver metastasis correlated with increased tumor volume and weight of subcutaneous tumors (Extended Data Fig. 2e,f, Supplementary Fig. 1e, and Methods). These data reinforce that liver metastasis may abolish systemic immunotherapy efficacy in a tumor- specific manner.
Liver metastasis induces systemic loss of antigen-specific T cells.
We next sought to determine the mechanism by which liver metastasis influences immunotherapy. Consistent with our previous work9, anti-PD-L1 therapy increased tumor CD8+ T cell infiltration in mice bearing only subcutaneous MC38 tumors. Conversely, we found limited T cell infiltration in the subcutaneous MC38 tumors of mice bearing both subcutaneous and liver tumors (Fig. 3a,b and Extended Data Fig. 3a). These data suggest that liver metastasis may regulate CD8+ T cell responses to modulate immunotherapy efficacy.
Fig. 3 |. Liver metastasis induces systemic loss of antigen-specific T cells.
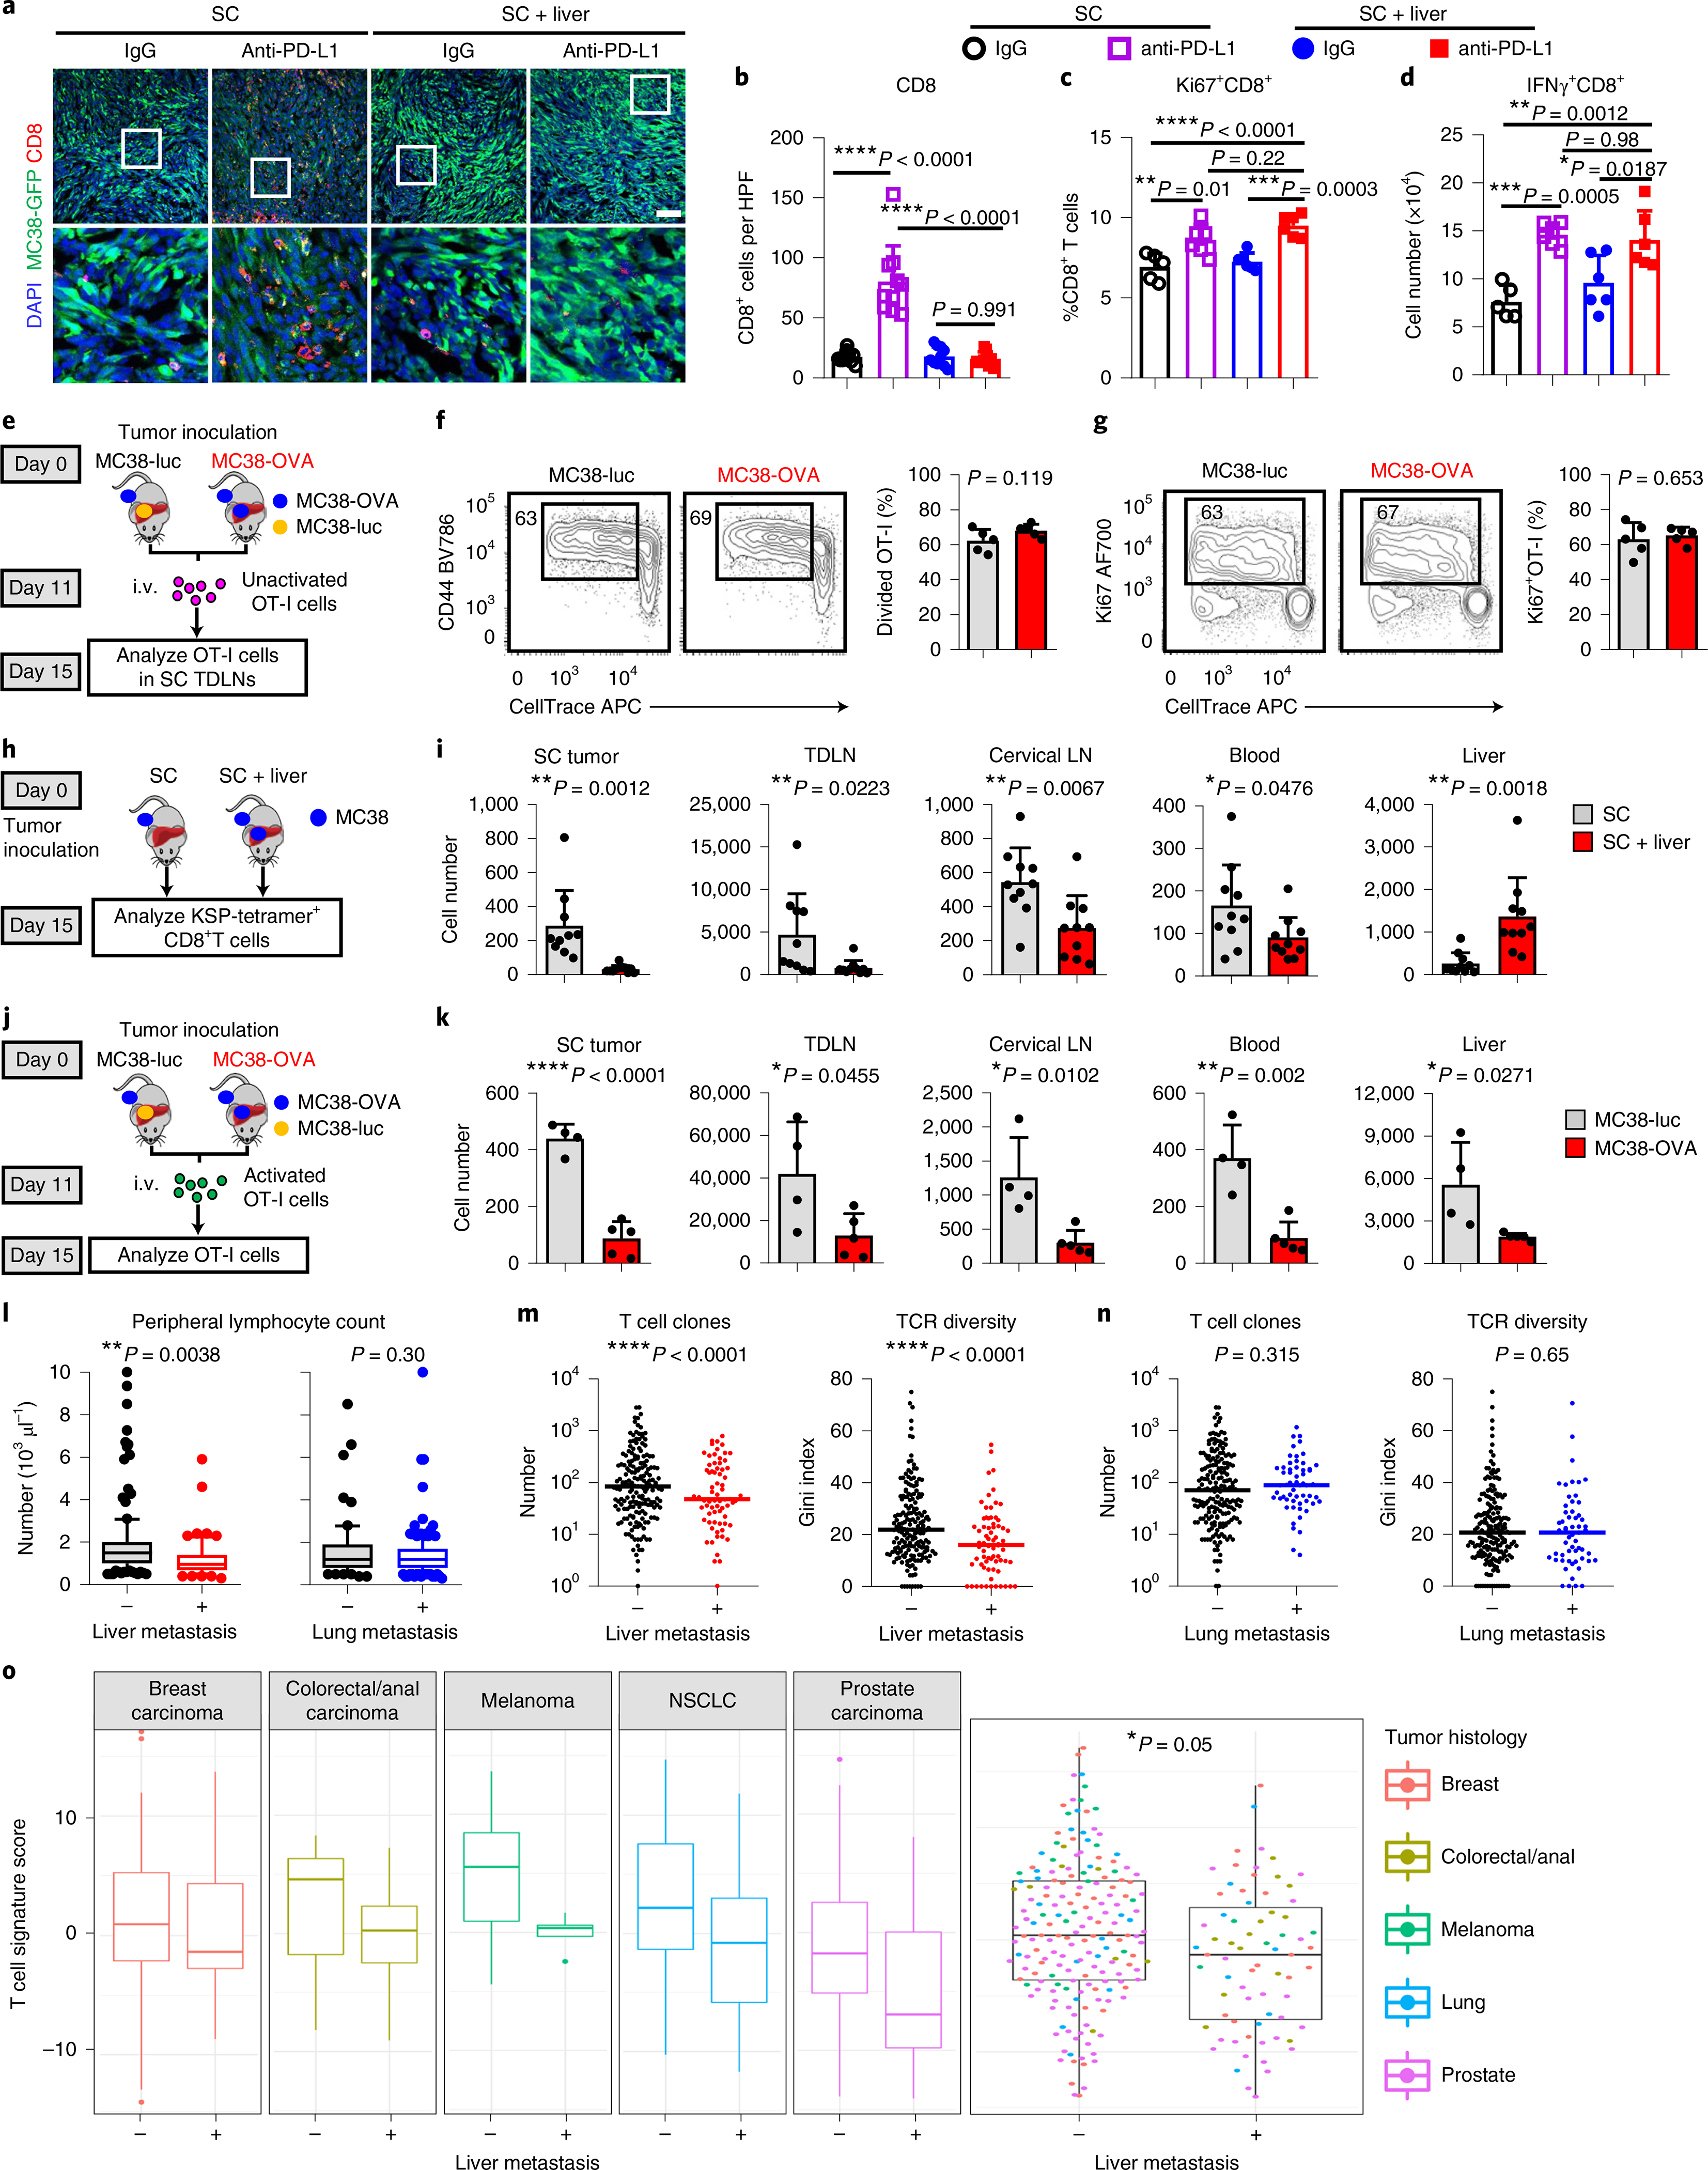
a,b, Immunofluorescent staining of CD8+ cells (a) and quantification (b) in MC38 subcutaneous tumors from mice with subcutaneous tumors only or with subcutaneous and liver tumors. Analysis was done at 10 d after therapy initiation. One-way AnOVA with Tukey’s correction was used for statistical analysis. Data are shown as mean ± s.d.; n = 10 fields from n = 3 mice per group. Scale bar, 50 μm. c,d, Flow analysis of Ki67+CD8+ and IFn-γ+CD8+ T cells from subcutaneous tumor dLns in mice with and without liver metastasis treated with anti-PD-L1 therapy. Mice were analyzed 1 week after therapy initiation. One-way AnOVA with Tukey’s correction was used for statistical analysis. Data are shown as mean ± s.d.; isotype SC n = 5, all other groups n = 6. e–g, Unactivated OT-I cell adoptive transfer (e), activation (f), and proliferation (g) in subcutaneous tumor dLns of mice bearing MC38-OVA subcutaneous tumors with MC38 liver metastasis of the indicated genotype. Unpaired two-tailed Student’s t-test was used for statistical analysis. Data are shown as mean ± s.d.; n = 5 per group. i.v., intravenous injection. h,i, Flow analysis of CD8+KSP-tetramer+ T cells in indicated compartments (h, schematic; i, absolute number). Unpaired two-tailed Student’s t-test was used for statistical analysis. Data are shown as mean ± s.d.; n = 10 per group. j,k, OT-I cells were activated in vitro for 7 d, labeled with CFSE and then intravenously transferred into different groups of mice (j). Absolute number of CFSE+CD8+ OT-I T cells in indicated compartments by flow cytometry (k). Unpaired two-tailed Student’s t-test was used for statistical analysis. Data are shown as mean ± s.d.; MC38-luc n = 4, MC38-OVA n = 5. l, Absolute lymphocyte counts of patients with nSCLC receiving immunotherapy (Cohort 3) with (n = 62) or without (n = 187) liver metastases (left) or with (n = 187) or without (n = 62) lung metastases (right). Unpaired two-tailed Student’s t-test was used for statistical analysis. The box shows the mean and interquartile range (IQR), whiskers represent 10–90% and outliers represent the minimum to maximum value. m, The number of intratumoral T cell clones and intratumoral T cell receptor (TCR) diversity in patients (Cohort 7) with (n = 70) and without (n = 179) liver metastases. Unpaired two-tailed Student’s t-test was used for statistical analysis. The median value is indicated. n, The number of intratumoral T cell clones and intratumoral T cell receptor diversity in patients (Cohort 7) with (n = 57) and without (n = 191) lung metastases. Unpaired two-tailed Student’s t-test was used for statistical analysis. The median value is indicated. o, Composite and disease-specific T cell signature score in metastatic patients of the indicated cancer type stratified by the presence of liver metastasis (Cohort 7). A linear mixed-effect model was used for statistical analysis. The box shows the mean and IQR, whiskers represent 10–90% and outliers represent the minimum to maximum value. Breast n = 65, colorectal n = 21, melanoma n = 26, nSCLC n = 34, prostate n = 106. Data are representative or inclusive of at least two independent experiments (a–k).
T cell priming in the tumor draining lymph nodes (dLN) represents the first step in the development of antitumoral immunity26. We observed that PD-L1 blockade resulted in comparable levels of CD8+ T cell activation in subcutaneous tumor dLNs regardless of the presence of liver metastases (Fig. 3c,d and Methods). Further, liver metastases did not alter the activation (Fig. 3e,f) or proliferation (Fig. 3g) of adoptively transferred OT-I cells in subcutaneous tumor dLNs. These data suggest that liver metastases do not alter naive T cell priming and activation.
We next questioned whether tumor liver metastasis might impact the systemic compartmentalization of T cells. We examined the systemic distribution of MC38 neoantigen KSPWFTTL (KSP)-tetramer+CD8+ T cells in mice bearing subcutaneous and liver tumors (Fig. 3h, Extended Data Fig. 3b and Methods). Interestingly, liver metastases diminished the number of KSP-tetramer+CD8+ T cells not only in the subcutaneous tumor, but also in the subcutaneous tumor dLN, uninvolved cervical lymph nodes and peripheral blood (Fig. 3i). In contrast, the number of KSP-tetramer+CD8+ T cells was relatively higher in the livers of mice with liver metastases (Fig. 3i).
To orthogonally confirm this unexpected finding, we adoptively transferred unactivated OT-I cells into mice bearing subcutaneous MC38-OVA tumors and either MC38-luc or MC38-OVA tumors in the liver (Extended Data Fig. 3c). We again observed a sharp decrease in OT-I cell frequency in the subcutaneous tumor, subcutaneous tumor dLN, and non-involved lymph nodes (Extended Data Fig. 3d). Again, tumor-specific T cells (OT-I) accumulated in the OVA-expressing liver tumors (Extended Data Fig. 3d).
Following adoptive transfer of ex vivo activated OT-I cells (Fig. 3j and Methods), we observed hepatic and tumor dLN accumulation of T cells at early time points (Extended Data Fig. 3e,f) and systemic loss of T cells at all sites at late time points in mice with OVA-expressing liver metastases (Fig. 3k and Extended Data Fig. 3g,h). In contrast to mice with liver metastases, the expression of OVA in lung metastases did not alter T cell number in the liver, lung, spleen, blood, tumor dLNs and non-tumor dLNs (Extended Data Fig. 3i,j and Methods). Collectively, these data suggest that antigen expression in liver metastatic tumors may alter the systemic distribution of antigen-specific T cells.
Integrins, including lymphocyte function-associated antigen-1 (LFA-1) and CD44, regulate activated T cell tissue migration, and the liver highly expresses the receptors for these integrins, ICAM-1 and hyaluronic acid, respectively27. We hypothesized that the altered expression of leukocyte-specific integrins on activated T cells may underlie the systemic changes in T cell distribution occurring in mice with liver metastases. Both in vitro activated OT-I cells and adoptively transferred naive OT-I cells in subcutaneous tumor dLN in vivo upregulated LFA-1 and CD44 (Extended Data Fig. 3k,l). Endogenous KSP-tetramer+CD8+ T cells within the liver had substantially higher expression of these integrins than did the total hepatic CD8+ T cell pool (Extended Data Fig. 3m). Finally, disruption of these interactions by hyaluronidase treatment or anti-ICAM-1 treatment in tumor-bearing mice reduced tumor-specific T cell accumulation in the liver (Extended Data Fig. 3n), suggesting that LFA-1 and CD44 may contribute to the accumulation of activated tumor-specific T cells in liver tumors.
To confirm the translational relevance of these findings to patients with metastatic cancer patients, we examined the peripheral blood in patients with NSCLC (Cohort 3), as diminished absolute lymphocyte count (ALC) predicts limited response to immunotherapy28. We observed that patients with liver metastases, but not lung metastases, had reduced ALC, but no change in other cell types (Fig. 3l and Extended Data Fig. 3o,p). We also examined a cohort of patients with metastatic cancer who have undergone comprehensive sequencing29 (Cohort 7, Supplementary Table 8). We observed that patients with breast cancer, colorectal cancer, prostate cancer, melanoma or NSCLC with liver metastases, but not lung metastases, had diminished intratumoral T cell clones and diminished T cell diversity (Fig. 3m,n). Using a previously validated gene-expression signature30, we found that patients with liver metastases had diminished CD8+ T cell effector function as compared with that of patients without liver metastasis (Fig. 3o). These results suggest that liver metastasis, but not lung metastasis, modulates immune function in preclinical animal models and in patients with cancer by promoting systemic loss of antigen-specific T cells.
Hepatic myeloid cells induce activated T cell apoptosis via the Fas–FasL pathway.
We next explored the fate of T cells within the liver. T cell dysfunction markers were increased in hepatic T cells in mice bearing liver tumors as compared with mice bearing only subcutaneous tumors (Extended Data Fig. 4a). Further, there was a significant increase in the frequency of CD8+ T cells undergoing apoptosis in mice bearing tumors in the liver (Fig. 4a). To extend this finding, we adoptively transferred activated OT-I cells into mice with MC38-luc or MC38-OVA liver tumors. We observed an increased frequency of apoptotic OT-I cells selectively in the context of liver metastases expressing OVA (Fig. 4b). Quantification of adoptively transferred OT-I cells or endogenous KSP-tetramer+CD8+ T cells with cleaved caspase-3 in the liver (Extended Data Fig. 4b,c and Methods) again demonstrated that liver metastases resulted in an increase in the frequency of intrahepatic antigen-specific T cell apoptosis (Extended Data Fig. 4b,c). We observed that T cell apoptosis occurred more in liver tumors than in subcutaneous tumors and other organs (Extended Data Fig. 4d), suggesting that liver metastasis may uniquely siphon activated antigen-specific T cells and subsequently cause T cell deletion.
Fig. 4 |. Hepatic myeloid cells induce activated T cell apoptosis via the Fas–FasL pathway.
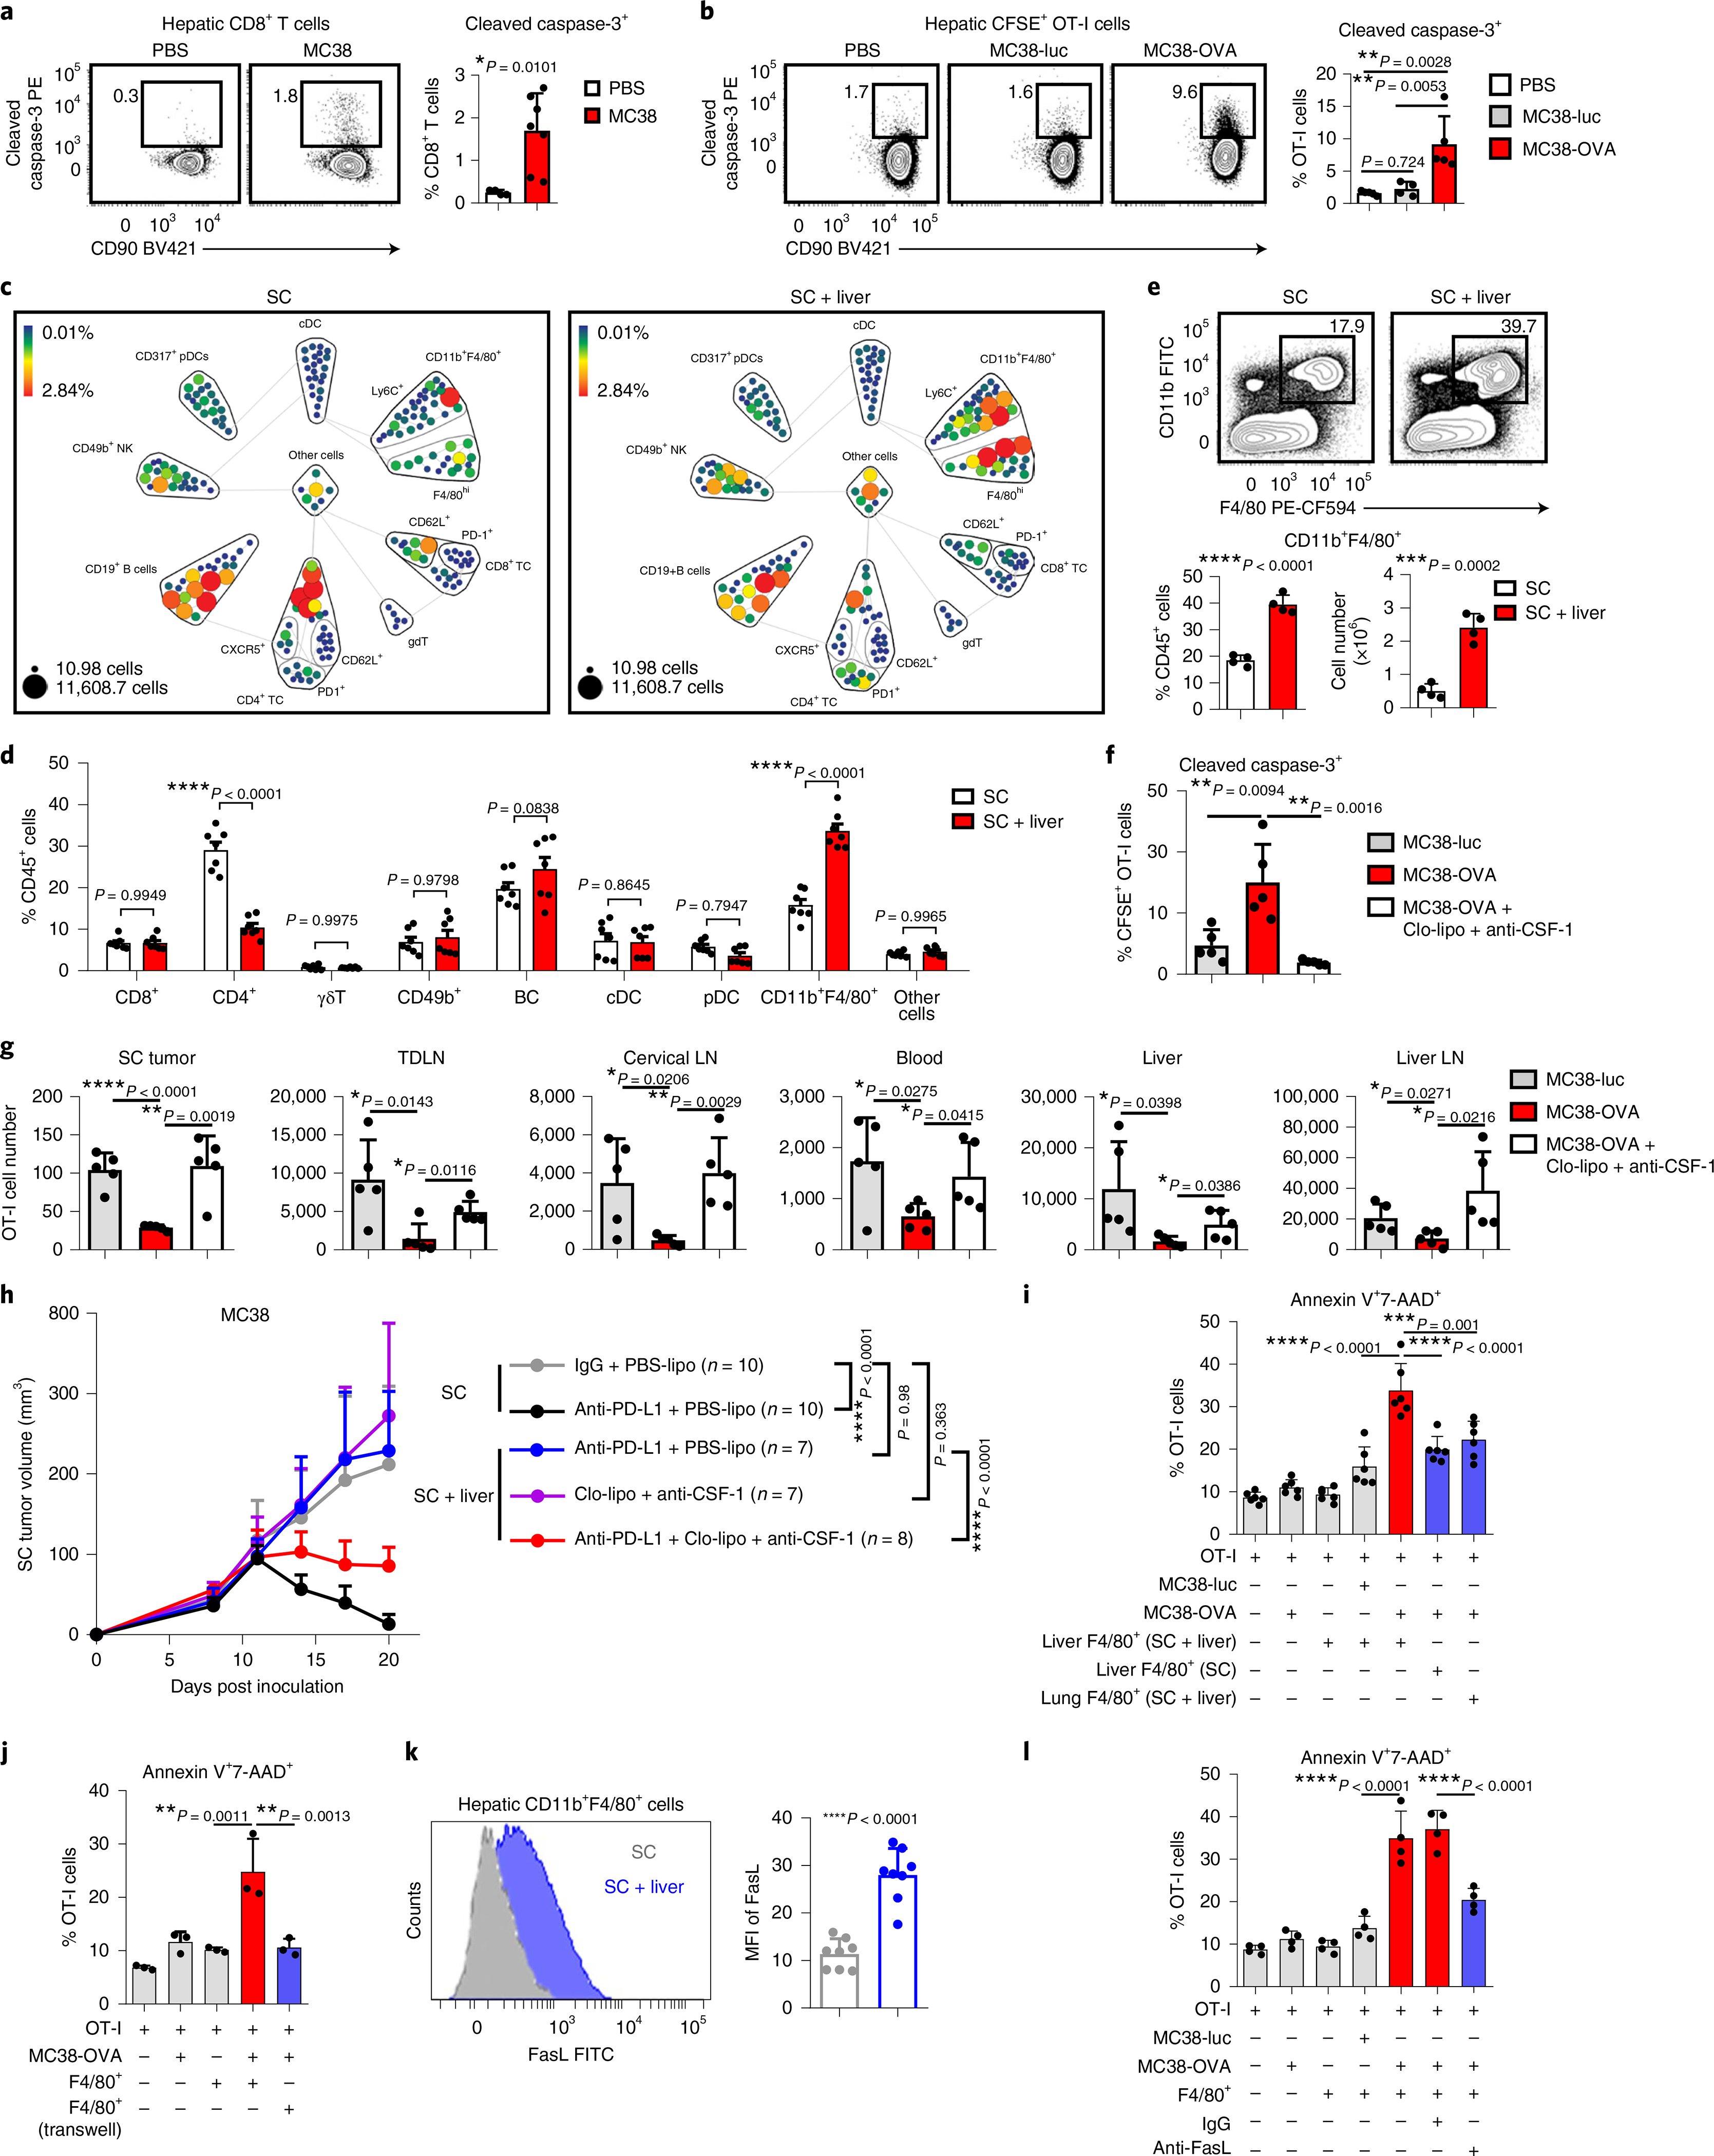
a, Flow cytometry analysis of hepatic cleaved caspase-3+CD8+ T cells in subcutaneous MC38 tumor-bearing mice with indicated liver tumor. Analysis was done 2 weeks after tumor inoculation. Unpaired two-tailed Student’s t-test was used for statistical analysis. Data are shown as mean ± s.d.; PBS n = 4, MC38 n = 7. b, Flow cytometry analysis of cleaved caspase-3+OT-I cells in mice bearing subcutaneous MC38-OVA tumor only (PBS, n = 5) and MC38-luc (n = 4) and MC38-OVA (n = 5) liver tumors. OT-I cells were activated in vitro, transferred at day 11 and analyzed at day 14. One-way AnOVA with Tukey’s correction was used for statistical analysis. Data are shown as mean ± s.d. c,d, CyTOF SPADE analysis (c) and frequency (d) of hepatic immune cells from mice bearing only subcutaneous MC38 tumors and of mice bearing both subcutaneous and liver MC38 tumors. Size indicates absolute number; color indicates frequency of CD45+ cells. Analysis was done at day 10 after tumor inoculation. cDC, conventional dendritic cells; γδT, gamma delta T cells; nK, natural killer cells; TC, T cells. Data in d represent pooled data from two independent experiments. Two-way AnOVA with Bonferroni’s correction was used for statistical analysis. Data are shown as mean ± s.d. e, Flow cytometry analysis of hepatic CD11b+F4/80+ cells. Analysis was done 2 weeks following inoculation. Unpaired two-tailed Student’s t-test was used for statistical analysis. Data are shown as mean ± s.d.; n = 4 per group. f,g, Flow cytometry quantification of hepatic cleaved caspase-3+ OT-I cells (f), and absolute number of OT-I cells in indicated compartments (g) in indicated mice treated with clodronate liposomes (Clo-lipo) and anti-CSF-1 (as shown in Extended Data Fig. 5g). Unpaired two-tailed Student’s t-test was used for statistical analysis. Data are shown as mean ± s.d.; n = 5 per group. h, MC38 subcutaneous tumor growth in mice bearing indicated tumors treated with anti-PD-L1; clodronate liposome and anti-CSF-1; or the combination. Controls include PBS liposomes (PBS-lipo). Two-way AnOVA with Tukey’s correction t-test was used for statistical analysis. Data are shown as mean ± s.d.; n values are as indicated. i,j, Frequency of annexin V+7-AAD+OT-I T cells following coculture with the indicated cell types (n = 6 biologically independent samples) (i) and in indicated configuration (transwell, n = 3 biologically independent samples) (j) for 48 h. j, F4/80+ cells from liver-tumor-bearing mice. One-way AnOVA with Tukey’s correction was used for statistical analysis. Data are shown as mean ± s.d. k, Flow cytometry analysis of FasL expression on hepatic CD11b+F4/80+ cells in subcutaneous tumor-bearing mice with and without liver tumors. Unpaired two-tailed Student’s t-test was used for statistical analysis. Data are shown as mean ± s.d.; n = 8 per group. l, Frequency of annexin V+7-AAD+OT-I T cells following coculture with the indicated cell types and blockade of FasL. F4/80+ cells from liver-tumor-bearing mice. One-way AnOVA with Tukey’s correction was used for statistical analysis. Data are shown as mean ± s.d.; n = 4 biologically independent samples. Data are representative of at least two independent experiments (a–l).
To define the mechanisms through which liver metastasis induces T-cell apoptosis, we used mass cytometry (CyTOF) to characterize the liver immune microenvironment in mice with or without liver tumors at early time points prior to T cell loss (Fig. 4c,d and Extended Data Fig. 4e). We observed that mice with liver metastasis showed increased frequency of CD11b+F4/80+ myeloid cells as well as diminished CD4+ T cells, but similar frequencies of other cell types (Fig. 4c,d). We tested a potential role for CD4+ T cells in immunotherapy efficacy in mice bearing both subcutaneous and liver tumors, and found that neither CD4+ T cell depletion nor hepatic CD4+ T cell supplementation rescued immunotherapy efficacy in mice bearing liver tumors (Extended Data Fig. 4f,g and Supplementary Fig. 2a,b). These data prompted us to focus on hepatic myeloid cells.
We hypothesized that the increased hepatic CD11b+F4/80+ myeloid population (Fig. 4e and Extended Data Fig. 5a) may contribute to immunotherapy resistance in mice bearing liver metastases31,32. We observed, consistent with a critical role of CSF-1R in myeloid cells33, high levels of CSF-1R expression in the CD11b+F4/80+ myeloid cells (Extended Data Fig. 4e). Selective depletion of hepatic myeloid cells with low-dose clodronate liposomes and anti-CSF-1 monoclonal antibody (Extended Data Fig. 5b–f, Supplementary Fig. 3 and Methods), but neither single agent alone, was sufficient to reduce the number of hepatic myeloid cells in mice with liver metastases and diminished intrahepatic antigen-specific T cell apoptosis (Extended Data Fig. 5g and Fig. 4f). This largely restored the number of tumor-specific OT-I cells throughout the mice with liver metastases (Fig. 4g) and systemically restored anti-PD-L1 therapeutic efficacy (Fig. 4h and Supplementary Fig. 4). Further, CD8+ T cell depletion blocked the effect of clodronate and anti-CSF-1 on immunotherapy efficacy in liver-tumor-bearing mice (Extended Data Fig. 5h and Supplementary Fig. 5). These data suggest that hepatic myeloid cells may contribute to immunotherapy resistance in mice bearing both subcutaneous and liver tumors.
To determine whether hepatic myeloid cells directly affected activated T cell apoptosis, we isolated F4/80+ cells from liver tumors and cocultured them with MC38-OVA and activated OT-I cells. Tumor-educated F4/80+ cells induced OT-I cell apoptosis (Fig. 4i) in the presence of OVA-expressing tumor cells. In contrast, F4/80+ myeloid cells from tumor-free livers and lungs induced limited CD8+ T cell apoptosis (Fig. 4i). Coculture of activated OT-I cells and tumor-educated F4/80+ myeloid cells in the presence of OVA peptide was sufficient to induce OT-I cell apoptosis (Extended Data Fig. 5i and Methods). These data suggest that tumor-educated hepatic myeloid cells cause activated T cell apoptosis.
Myeloid cells may regulate T cell apoptosis in a cell-contact-dependent fashion34. We observed increased T cell apoptosis only in conditions in which T cells and F4/80+ cells were directly in contact (Fig. 4j and Extended Data Fig. 5j). Hepatic CD11b+F4/80+ myeloid cells expressed high levels of FasL in mice bearing liver tumors (Fig. 4k), whereas tumor-specific T cells, either exogenously transferred OT-I cells or endogenous KSP-tetramer+CD8+ T cells, expressed high levels of Fas (Extended Data Fig. 5k). Binding of FasL to Fas results in activation of extrinsic apoptosis pathways culminating in cleaved caspase-3 of Fas-expressing cells35. We observed that FasL blockade, but nots tumor necrosis factor alpha (TNF-α) blockade, significantly reduced OT-I cell apoptosis induced by hepatic myeloid cells (Fig. 4l and Methods). These data suggest that tumor-educated CD11b+F4/80+ myeloid cells utilize FasL to cause deletion of activated T cells within the liver.
Our previous data suggested that liver metastasis induce T cell apoptosis in an antigen-dependent manner. Indeed, we observed hepatic CD11b+F4/80+ cells expressed H-2Kb/OVA MHC-I complex in mice bearing a MC38-OVA tumor (Extended Data Fig. 5m). Although both lung and liver macrophages increased FasL expression upon tumor inoculation (Extended Data Fig. 5n) and expressed similar levels of MHC-I (H-2Kb) (Extended Data Fig. 5o), liver macrophages expressed significantly higher levels of FasL than did lung macrophages. Collectively, these data suggest that hepatic tumor-educated CD11b+F4/80+ myeloid cells cross-present antigen and utilize Fas–FasL signaling to delete tumor-specific T cells within the liver.
Liver metastasis alters the liver immune microenvironment.
To further characterize the liver tumor immune microenvironment, we performed single-cell RNA-sequencing of hepatic mononuclear cells isolated from mice with and without liver tumors (Extended Data Fig. 6a,b and Methods). We observed that mice with liver metastases had an increased proportion of cells within macrophage clusters as well as a diminished proportion of cells within T cell clusters (Fig. 5a,b and Extended Data Fig. 6c). Activated T cells in mice with liver tumors were more enriched for apoptosis gene signatures than were activated T cells in mice without liver tumors (Extended Data Fig. 6d), in accordance with our earlier findings.
Fig. 5 |. Liver metastasis alters the liver immune microenvironment.

a,b, UMAP plot (a) and frequency (b) of hepatic hematopoietic (Ptprc-expressing) cell clusters in mice with subcutaneous tumors and subcutaneous and liver tumors. Analysis was done at day 14 after tumor inoculation. Chi-square statistic: 17.47 (Macrophages), 16.85 (T cells). c, UMAP plot of indicated macrophage markers in merged sample. d, UMAP plot of Ccr2 and composite plot of Timd4, Vsig4 and Clec4f within the macrophage clusters identified in c on a merged sample. e, UMAP plot and frequency of residential (Timd4+Vs ig4+Clec4f+) and monocyte (mono)-derived (Ccr2+) macrophages in mice with subcutaneous tumors or with subcutaneous and liver tumors. Chi-square statistic: 15.67 (monocyte-derived); n.s., not significant, P = 0.55; ***P = 0.0001; SC residential n = 543, SC monocyte-derived n = 1,599, SC + liver residential n = 936, SC + liver monocyte-derived n = 5,099. f, Flow cytometry plot showing that the majority of hepatic macrophages (CD11b+F4/80+ cells, blue) in mice with subcutaneous and liver tumors express CCR2, whereas limited hepatic macrophages express TIM-4. g, M2-like and M1-like gene signature score in monocyte-derived macrophages; unpaired two-tailed Student’s t-test was used for statistical analysis, and the minimum to maximum are shown. SC n = 1,599, SC + liver n = 5,099. h, Reclustered UMAP plot of monocyte-derived macrophage clusters on merged sample. i, Monocle2 pseudotime plot of monocyte-derived macrophages showing different macrophage states and branch points.
We confirmed that the Itgam (the gene encoding CD11b)- and Adgre1 (the gene encoding F4/80)-expressing immune clusters also expressed the classical macrophage markers, including Lyz2, Cd68 and Lgal3 (Fig. 5c and Extended Data Fig. 6e). Consistent with prior work36,37, we identified two types of hepatic macrophages: Timd4+Vsig4+Clec4f+ residental macrophages and Ccr2+ monocyte-derived macrophages (Fig. 5d) in both normal and tumor-bearing livers (Extended Data Fig. 6f,g). The proportion of monocyte-derived macrophages, but not tissue-resident macrophages, was significantly increased in mice with liver metastases (Fig. 5e), and we confirmed this using flow cytometry (Fig. 5f and Methods). Moreover, the presence of liver tumors increased the immunosuppressive M2-like gene signature score and decreased the inflammatory M1-like gene signature score more in monocyte-derived macrophages than in tissue-resident macrophages (Fig. 5g and Extended Data Fig. 6h). Functionally, monocyte-derived macrophages showed higher enrichment for cross-presentation gene signatures than did tissue-resident macrophages (Extended Data Fig. 6i). Deeper characterization of monocyte-derived macrophages (Fig. 5h and Methods) identified 12 unique subsets by UMAP clustering (Extended Data Fig. 6j) and 8 distinct cell states with 4 branchpoints by pseudotime analysis (Fig. 5i and Extended Data Fig. 6k,l). These data suggest that liver metastases recruit and polarize monocyte-derived macrophages to alter the liver immune microenvironment.
Radiotherapy reshapes the liver immune microenvironment.
Radiotherapy can clinically control hepatic tumors and preclinically has been shown to stimulate antitumor immunity19–21,38. We hypothesized that liver-directed radiation could modulate the liver tumor microenvironment and promote T cell immunity. We established mice with subcutaneous MC38 tumors and liver tumors, and treated them with liver-directed radiotherapy, anti-PD-L1 or the combination (Extended Data Fig. 7a). Radiotherapy increased hepatic T cell infiltration, diminished liver myeloid cell number and diminished the ratio of CD11b+F4/80+ myeloid cells to CD8+ T cells (Extended Data Fig. 7b–d, Fig. 6a–c and Extended Data Fig. 8a). Moreover, combination therapy enhanced Ki67+, interferon-γ (IFN-γ)+ and granzyme B+ CD8 T cells in the liver (Extended Data Fig. 8b). These data demonstrate that liver-directed radiotherapy can simultaneously blunt immunosuppressive myeloid elements and stimulate T cell immunity in the liver.
Fig. 6 |. Radiotherapy reshapes the liver immune microenvironment and abolishes immunotherapy resistance induced by liver metastasis.
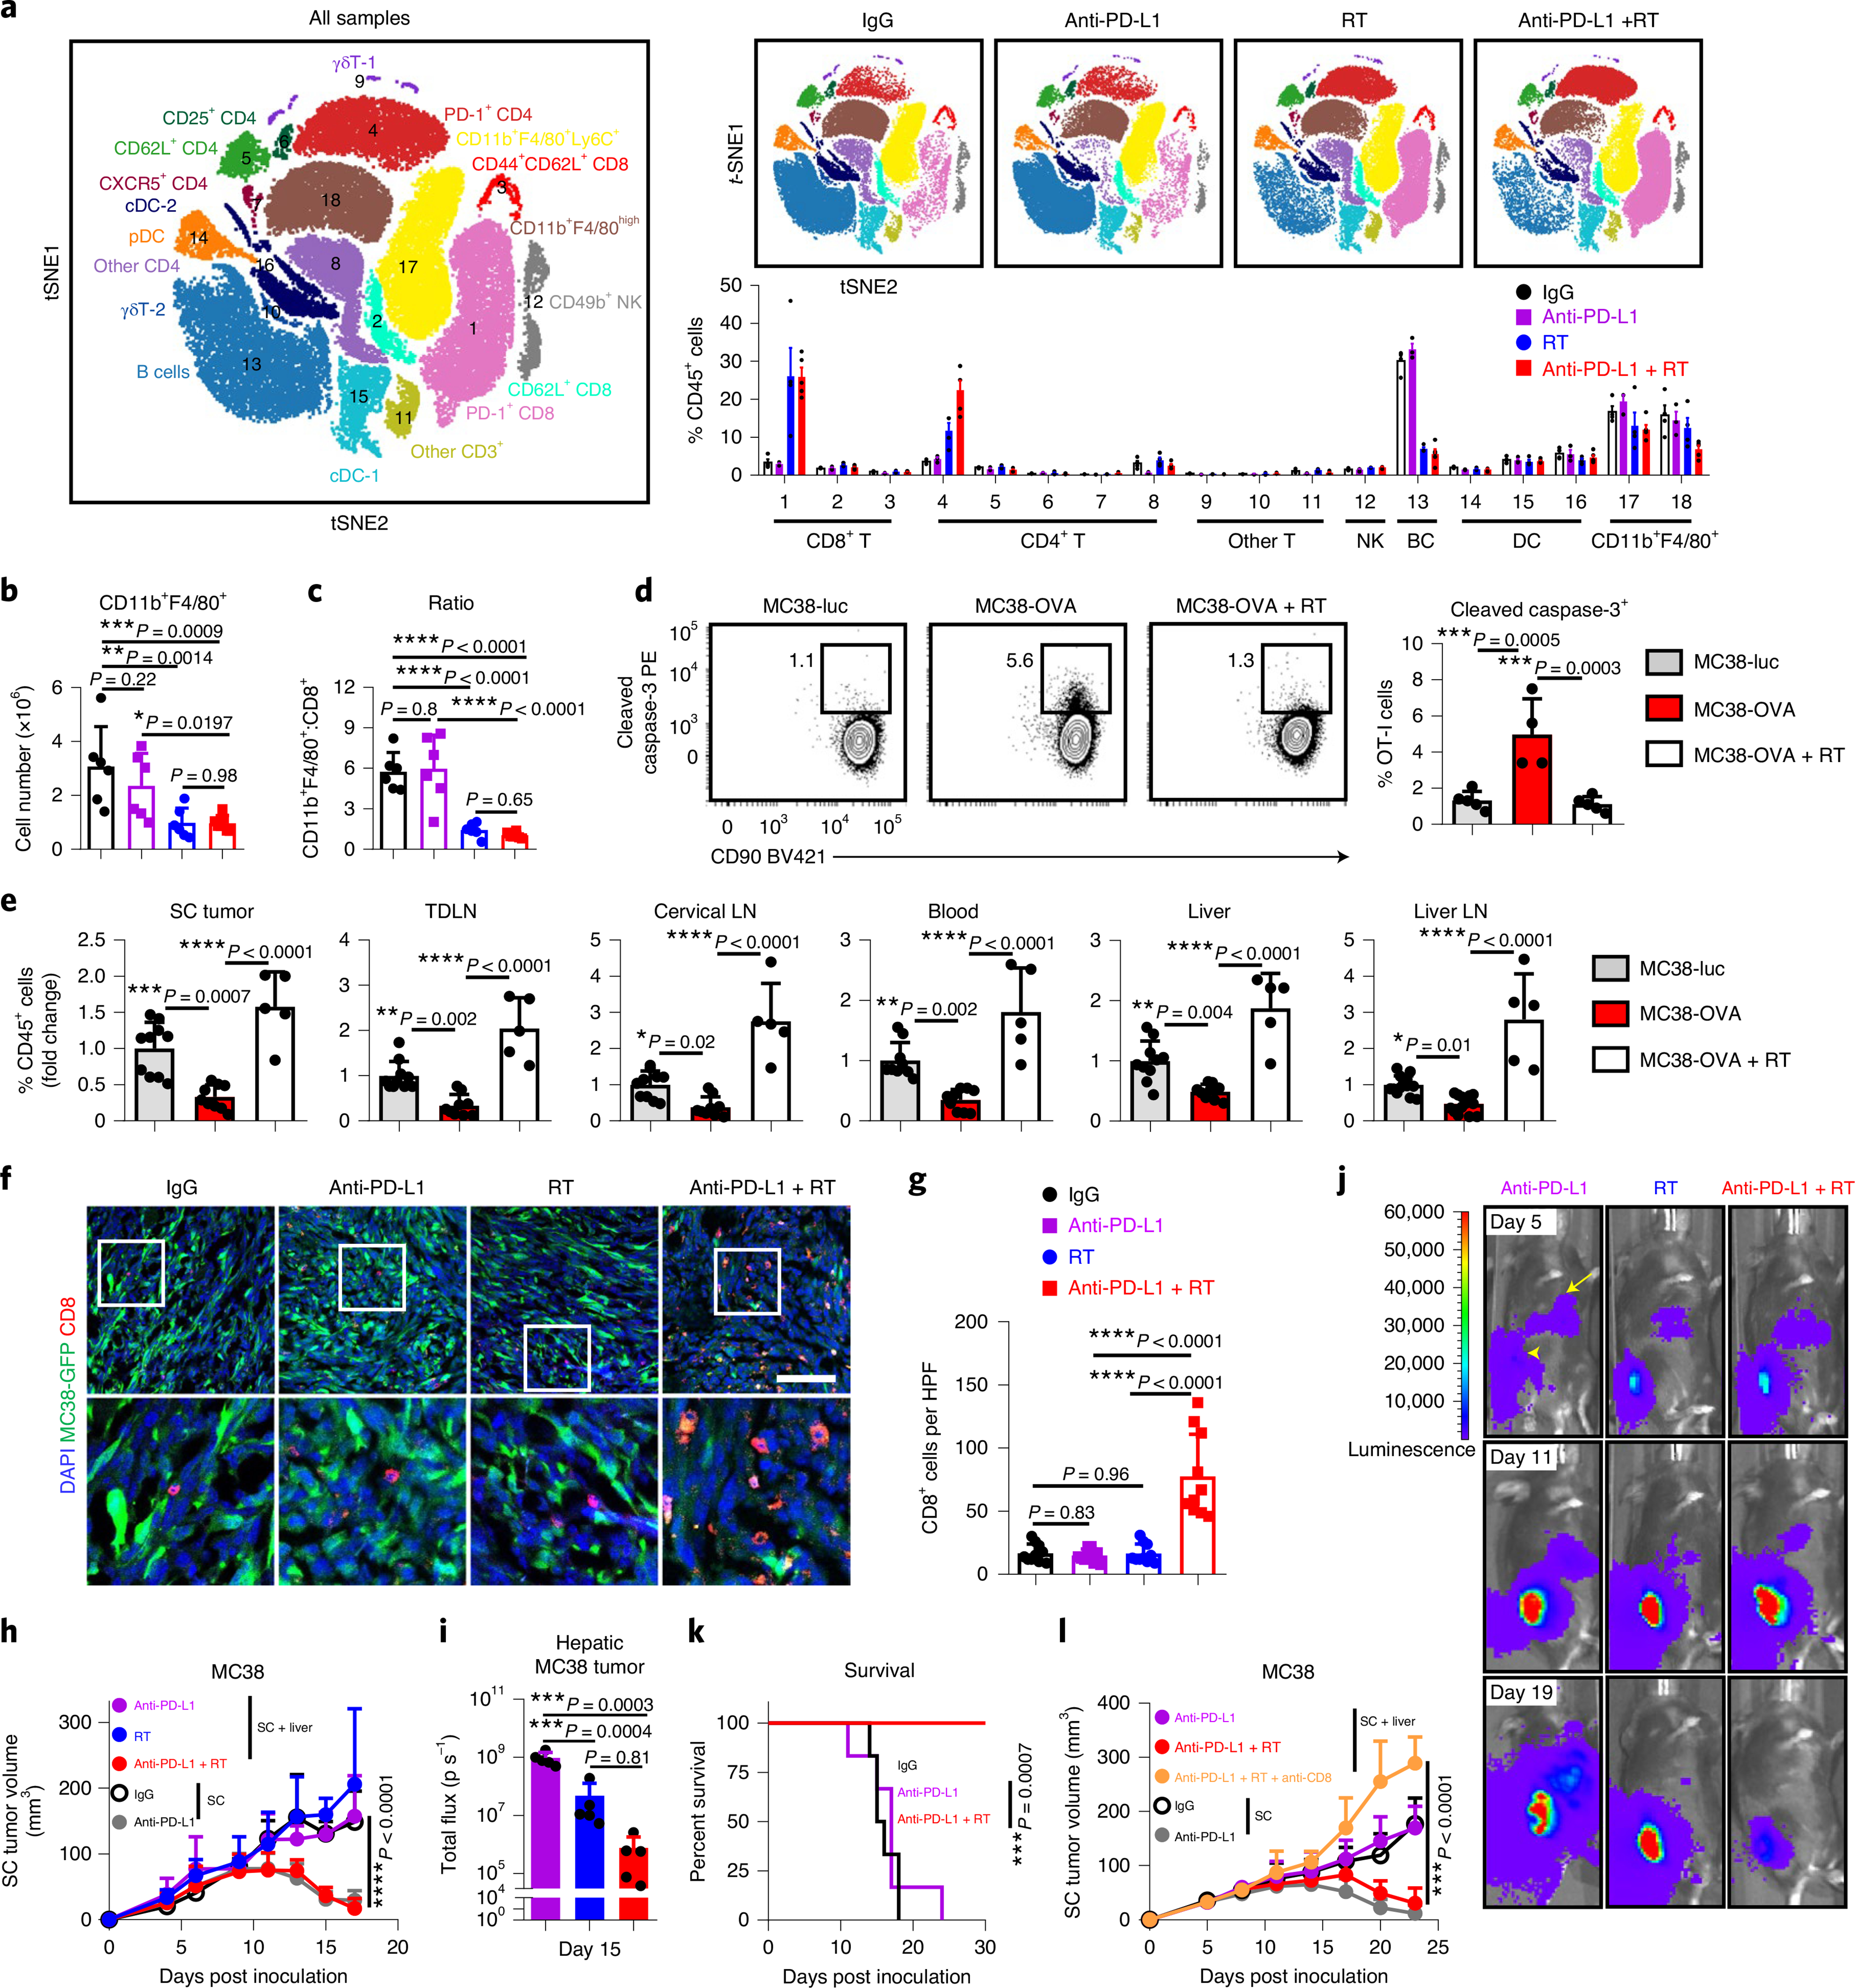
a, viSnE analysis of CyTOF immunophenotyping of livers from mice with both subcutaneous and liver tumors, treated with IgG (n = 4), anti-PD-L1 (n = 3), liver-directed radiotherapy (RT, n = 4) or combination therapy (n = 5). Analysis was done 5 d after RT. All samples combined (left), combined samples from each group (top right) and frequencies in different groups (bottom right) are shown as mean ± s.e. b,c, Flow cytometry quantification of hepatic CD11b+F4/80+ macrophage number (b) and ratio to CD8+ T cells (c) in mice treated as in a. Analysis was done 5 d after RT. One-way AnOVA was used for statistical analysis. Data are shown as mean ± s.d.; n = 6 per group. d,e, Flow cytometry analysis of hepatic cleaved caspase-3+ OT-I cells (d) and OT-I cell number in indicated compartments (e) from mice with indicated liver tumors and treatments (Extended Data Figure 8i). Analysis was done 4 d after OT-I adoptive transfer. d, One-way AnOVA, mean ± s.d., d, MC38-luc n = 5; MC38-OVA n = 4; MC38-OVA + RT n = 5. In e, data were pooled from two independent experiments. MC38-luc n = 10, MC38-OVA n = 9, MC38-OVA + RT n = 5. f,g, Immunofluorescent staining of CD8+ cells (f) and quantification (g) in MC38 subcutaneous tumors from mice with subcutaneous tumor and liver metastasis treated with IgG, anti-PD-L1 and/or radiotherapy. Analysis was done 10 d after radiotherapy. One-way AnOVA was used for statistical analysis. Data are shown as mean ± s.d. Scale bar, 50 μm. n = 10 fields from 3 mice per group. h, MC38 subcutaneous tumor growth in mice with subcutaneous and liver tumors treated with anti-PD-L1, liver-directed radiotherapy or the combination. Two-way AnOVA with Tukey’s correction was used for statistical analysis. Data are shown as mean ± s.d.; n = 5 per group. i,j, MC38 liver metastasis bioluminescent quantification (i, n = 5 per group) and representative images (j) of mice treated with anti-PD-L1, liver-directed radiotherapy or the combination. One-way AnOVA was used for statistical analysis. Data are shown as mean ± s.d. k, Survival of mice bearing MC38 subcutaneous tumors and liver metastases following treatment with anti-PD-L1 and radiotherapy. Log-rank test was used for statistical analysis. Survival is shown; n = 6 per group. l, MC38 subcutaneous tumor growth in mice bearing subcutaneous and liver tumors following treatment with the indicated combinations of liver-directed radiotherapy, anti-PD-L1 and anti-CD8. Two-way AnOVA with Tukey’s correction was used for statistical analysis. Data are shown as mean ± s.d.; SC + liver anti-PD-L1 + RT n = 8, other groups n = 7. Data are representative of at least two independent experiments (b–l).
We next performed unbiased quantification of innate and adaptive chemokines within the liver following liver-directed radiotherapy. Radiotherapy resulted in diminished CCL2, CCL11 and CXCL2 (Extended Data Fig. 8c), which may promote myeloid-cell liver trafficking, and increased CCL5 and CXCL10 (Extended Data Fig. 8c), which may support effector T cell migration into the liver39. Radiotherapy may therefore decrease intrahepatic myeloid cells by altering the hepatic cytokine milieu. Furthermore, radiotherapy caused an increase in CCL5 and CXCL10 production as well as MHC-I (H-2Kb) and PD-L1 expression by tumor cells in vitro (Extended Data Fig. 8d–f).
We next evaluated whether T cell survival in the liver tumor microenvironment is ameliorated by liver-directed radiotherapy. We observed reduced hepatic CD8+ T cell apoptosis after radiotherapy (Extended Data Fig. 8g). Liver radiotherapy reduced intrahepatic antigen-specific T cell apoptosis (Extended Data Fig. 8h and Fig. 6d) and restored systemic OT-I cell number (Fig. 6e). These data reinforce the notion that radiotherapy may increase hepatic T cell recruitment and survival.
Radiotherapy abolishes immunotherapy resistance induced by liver metastasis.
To assess whether liver radiotherapy globally alters antitumour immunity, we treated mice bearing subcutaneous MC38 tumor and liver tumor with radiotherapy, anti-PD-L1 or the combination. Radiotherapy significantly enhanced proliferation and IFN-γ production in subcutaneous tumor dLN CD8+ and CD4+ T cells. This was further augmented in mice that received combination treatment (Extended Data Fig. 9a,b). In line with previous data (Fig. 3), anti-PD-L1 did not increase the T cell number in subcutaneous tumors of mice with liver metastasis (Fig. 6f,g). Liver-directed radiotherapy did not modulate T cell number in the subcutaneous tumor on its own, but combination therapy significantly increased T cell infiltration into the subcutaneous tumor (Fig. 6f,g). Consistent with this, mice that received combination therapy, but not monotherapy, had regression of both liver and subcutaneous tumors and had significantly prolonged survival (Fig. 6h–k and Supplementary Fig. 6a). Depletion of CD8+ T cells in mice that received the combination therapy completely abrogated the antitumor effect (Fig. 6l, Extended Data Fig. 9c and Supplementary Fig. 6b). Liver-directed radiotherapy in mice bearing only subcutaneous tumors did not modulate responsiveness to anti-PD-L1 therapy (Extended Data Fig. 9d and Supplementary Fig. 7a). These data suggest that liver-directed radiotherapy restores systemic efficacy of immune-checkpoint blockade in a CD8+ T cell dependent manner.
We extended our finding to a pancreatic adenocarcinoma model. Similar to the MC38 colon cancer and B16F10 melanoma models, mice bearing subcutaneous pancreatic KPC2 tumors effectively responded to anti-PD-L1 treatment (Extended Data Fig. 9e, Supplementary Fig. 7b and Methods), while mice bearing both subcutaneous and liver metastases failed to respond (Extended Data Fig. 9f and Supplementary Fig. 7c). Again, liver radiotherapy restored subcutaneous tumor responsiveness to anti-PD-L1 (Extended Data Fig. 9f) and diminished the hepatic tumor burden (Extended Data Fig. 9g). These data demonstrate that liver metastasis compromises immunotherapy efficacy, and hepatic radiotherapy may offer an approach to abolish this resistance.
Discussion
In this work, we report that liver metastases induce systemic tumor-specific CD8+ T cell loss and abrogate immunotherapy efficacy in preclinical models, which mirrors the systemic T cell loss and diminished immunotherapy efficacy observed in patients with liver metastases. We highlight hepatic peripheral tolerance mechanisms as a previously unappreciated mechanism of immunotherapy resistance and extend correlative clinical observations suggesting that liver metastasis constrains immunotherapy28,40. A variety of hepatic cell types have been implicated in the modulation of T cell fate and survival within the liver, including Kupffer cells41,42, liver sinusoidal endothelial cells43, hepatocytes44, plasmacytoid dendritic cells45, NKT cells46 and stellate cells47. Our unbiased single-cell sequencing identifies hepatic monocyte-derived CD11b+F4/80+ macrophages as critical mediators that induce antigen-specific CD8+ T cell apoptosis via the Fas–FasL pathway in the liver metastatic microenvironment. Collectively, our data suggest that liver metastases siphon and eliminate antigen-specific CD8+ T cells, leading to systemic immunosuppression (Extended Data Fig. 10) and provide insight into the etiology of immune deserts in human cancer. Our work confirms and extends a recent study that suggested that liver metastases induce systemic immunosuppression in preclinical models48. A recent report suggests that liver metastases may be a prognostic biomarker49. Our work suggests that the presence of liver metastases could be a potential negative baseline determinant of immunotherapy response. Future studies on the contribution of hepatic tolerance in influencing other systemic therapies are needed.
The combination of radiotherapy and immunotherapy may improve immunotherapy efficacy in patients through multiple mechanisms19,20,50,51. We demonstrate a potential novel mechanism wherein radiotherapy can reshape the liver tumor microenvironment to prevent antigen-specific T cell loss. Other clinically utilized approaches for the management of liver metastases include surgical resection, transarterial chemoembolization and radiofrequency ablation, but it is unclear whether these invasive therapies also attenuate hepatic immune tolerance. Alternatively, immunomodulatory systemic therapies, such as macrophage depletion with anti-CSF-1R, have potential but have yet to demonstrate clinical efficacy52. Prospective trials are urgently needed to define the optimal combinatorial treatment strategy which can overcome hepatic tolerance and improve systemic immunotherapy efficacy.
There are limitations to this study. While we adjusted for potential confounders and examined more than 1,400 patients spanning a variety of cancer types, the clinical analyses were retrospective and from a single institution. Additionally, the available preclinical models of liver metastases that we used may not fully represent human pathophysiology. Nonetheless, this work suggests that liver metastases may be an important determinant of immunotherapy efficacy and supports clinical studies of treatments that target hepatic T cell siphoning.
Online content
Any methods, additional references, Nature Research reporting summaries, source data, extended data, supplementary information, acknowledgements, peer review information; details of author contributions and competing interests; and statements of data and code availability are available at https://doi.org/10.1038/s41591-020-1131-x.
Methods
Human studies.
Patients were recruited through the University of Michigan Rogel Cancer Center in Ann Arbor. All clinical records in this study were obtained with the approval of Institutional Review Boards and the need for patient consent was waived following Institutional Review Board protocol review (HUM00146400, HUM00139259, HUM00163915, HUM00161860, HUM00046018). Cohort 1 represents consecutively treated patients with metastatic melanoma who received immunotherapy at the University of Michigan from 2013 to 2016. Cohort 2 represents consecutively treated patients with metastatic melanoma who received targeted therapy at the University of Michigan from 2013 to 2017. Cohort 3 represents consecutively treated patients with metastatic NSCLC at the University of Michigan treated with immune-checkpoint blockade from 2015 to 2018. Cohort 4 represents consecutively treated patients with metastatic NSCLC at the University of Michigan treated with chemotherapy from 2012 to 2015. Cohort 5 represents patients at the University of Michigan who have undergone comprehensive sequencing as previously described29 and who have also been treated with immunotherapy. Cohort 6 represents an institutional experience in patients across all disease histologies treated at the University of Michigan with immunotherapy. This cohort encompasses cohorts 1, 3 and 5 as well as consecutively treated patients with metastatic urothelial or renal cell cancer who received immunotherapy at the University of Michigan from 2013 to 2018. Cohort 7 represents a sequenced institutional cohort patients with of metastatic cancer, as previously described29. A trained radiologist conducted evaluation of clinical imaging to define the presence of liver metastasis. A second radiologist conducted blinded evaluation of clinical imaging to define objective response rates (the percentage of patients who achieved a complete or partial response) and clinical benefit (the percentage of patients who achieved a partial response, complete response or stable disease) using RECIST1.1 criteria. PFS and OS were calculated from time of therapy initiation. Patterns of failure were defined in those patients with available cross-sectional imaging. Patient data were extracted from a custom system, the Michigan Radiation Oncology Analytics Resource (M-ROAR). The system aggregates, integrates and harmonizes data for all patients from multiple electronic health record systems, including EPIC, ARIA, Eclipse and other institutional databases53. Tumor burden was determined by a trained radiologist and confirmed by a trained radiation oncologist and calculated as the sum of largest cross-sectional diameters of all visualized tumors in baseline imaging prior to immunotherapy. Additional information can be found in the Reporting Summary.
Mice.
Eight- to ten-week-old female C57BL/6 (stock. no. 000664), FVB/NJ (stock no. 001800), and OT-I (C57BL/6-Tg(TcraTcrb)1100Mjb/J (stock no. 003831)) mice were ordered from Jackson Laboratory. CD45.1+CD45.2+ OT-I mice were bred internally by crossing CD45.2+ OT-I mice and CD45.1+ C57BL/6 mice. All mice were maintained under SPF housing with a maximum of five mice per cage. Animal studies were conducted under the approval of the Institutional Animal Care & Use Committee (IACUC) at the University of Michigan (PRO00008278).
Cell lines.
MC38, B16F10, and KPC2 tumor cells were acquired as previously described54. Luciferase-expressing MC38 cells (MC38-luc) were established by transfection with lenti-GF1-CMV-VSVG virus expressing GFP and luciferase. Ovalbumin-expressing MC38 cells (MC38-OVA) were established by transfection with pCI-neo-mOVA plasmid and selected with G418. Neither luciferase expression nor ovalbumin expression affect tumor growth and therapeutic responses. All cell lines were regularly tested for mycoplasma contamination every 2 weeks. Cells were thawed at early passage and cultured for up to 32 weeks in total.
Tumor models.
For subcutaneous flank tumor models involving anti-PD-L1, MC38 cells (3 × 10⁶), B16F10 cells (2 × 10⁵), and KPC2 (1 × 10⁶) were subcutaneously inoculated unless otherwise specified. For experimental liver metastases models, MC38 cells (5 × 10⁵), B16F10 cells (5 × 10⁴), and KPC2 (2 × 10⁵) were intrasplenically or intrahepatically injected as described. In mice in which intrasplenic injection was used, an immediate splenectomy was performed following tumoral injection in experimental groups and PBS injection in control groups. In experiments in which intrahepatic injection was used, control mice underwent intrahepatic injection of PBS. Subcutaneous tumors and liver tumors were established at the same time. For lung tumor models, MC38 cells (3 × 10⁵) were injected intravenously. For subcutaneous tumor models examining spontaneous immunity, MC38 cells (106) was used. Mice were randomized to experimental groups when subcutaneous tumors reached 50 mm3. Tumor volume was calculated as (length × width × height) / 2. In some experiments, in vivo bioluminescence imaging was performed for liver tumor burden quantification using MC38-luc (IVIS Spectrum, Perkin Elmer). In some experiments, inguinal tumor draining lymph nodes were analyzed.
Animal treatment protocol.
For immune-checkpoint blockade therapy, 100 micrograms (μg)/dose of anti-PD-L1 or isotype IgG was given on days 7, 10,13, 16, and 19, unless otherwise specified. For hyaluronidase treatment, mice were given 400 U hyaluronidase Type IV-S by intraperitoneal injection daily. For anti-ICAM-1 treatment, mice were given 300 μg anti-ICAM-1 by intraperitoneal injection daily. For depleting myeloid cells in the liver, three doses of clodronate liposomes (days 6, 9 and 12; 100 μl per dose) and 3 doses of anti-CSF-1 (days 5, 8, 11; 1, 0.5, 0.5 mg, respectively) were given by intraperitoneal injection. PBS liposomes and isotype controls for anti-CSF-1 were accordingly administered to control mice in different experiments. For CD4+ and CD8+ T cell depletion, 3 doses of anti-CD4 or anti-CD8 monoclonal antibodies (day 6, 9 and 12; 200 μg per dose) were given by intraperitoneal injection. Isotype controls were used to control for non-specific effects. For radiotherapy, a single fraction of 8 Gy was provided on day 6, 1 day prior to anti-PD-L1 therapy initiation. Treatment of hyaluronidase (HA-se) started day 9. Treatment of ICAM-1 blocking antibody started day 10.
Reagents.
OVA peptide (257–264, SIINFEKL, S7951) was purchased from Sigma. IgG (BE0087, BE0090), anti-mouse PD-L1 (BE0101), anti-ICAM-1 (BE0020–1), anti-CD4 (BE0003–1), anti-CSF-1 (BE0213), anti-mouse CD8 (BE0117) and anti-FasL (BE0319) were purchased from BioXcell. Hyaluronidase was purchased from Sigma (H3884). Clodronate and PBS liposomes were purchased from LIPOSOMA. H-2Kb-restricted MuLV p15E KSPWFTTL tetramer, which is expressed on MC38 (ref. 55) (TS-M507–1), was purchased from MBL Biosciences. Luciferin (E1601) was purchased from Promega.
Radiotherapy.
Radiotherapy was delivered using a Philips radiotherapy 250 model orthovoltage unit (Kimtron Medical) at a dose rate of approximately 2 Gy per minute, as previously described50. Experiments were performed in the Experimental Irradiation Shared Resource at the University of Michigan. Focal liver irradiation was provided to liver metastasis via lead shielding and positioning was confirmed using fiducial markers. For whole-liver radiation, external anatomic landmarks for the borders of the liver were checked against a light field, and four half-value layers of lead shielding were applied as required. Dosimetry was confirmed using optically stimulated luminescent dosimeters intermittently.
Adoptive transfer and ex vivo analyses.
For naive OT-I cell adoptive transfer experiments, single-cell suspensions of splenocytes and lymph-node cells were obtained from OT-I mice. CD8+ T cells were isolated via magnetically labeled antibodies (Stem Cell Technologies, 19853) and two million cells were intravenously injected into mice. For activated OT-I cell adoptive transfer experiments, single-cell suspensions of splenocytes and lymph-node cells were obtained from OT-I mice. Cells were activated with 0.5 μg ml−1 OVA peptide (Sigma, S7951) in RPMI1640 medium containing 10% fetal calf serum, in the presence of 55 μM β-mercaptoethanol (β-ME) (Sigma, M3701) and 5 ng ml−1 murine interleukin-2 (IL-2) (R&D Biosystems) for 2 d. CD8+ T cells were then isolated via magnetically labeled antibodies. Cells were continued to be cultured in the presence of 55 μM β-ME and 5 ng ml−1 IL-2 for 5 additional d. Culture medium was refreshed every 2 d. For adoptive transfer of CD4+ cells, livers from mice bearing subcutaneous MC38 tumors were isolated and mechanically disrupted, and a single-cell suspension was prepared. Cells were then purified by magnetic-activated cell sorting PE-anti-CD4 and anti-PE MicroBeads (Miltenyi, 130–048-801). On day 6 following tumor inoculation, 5 × 10⁵ CD4+ cells were injected intravenously into mice bearing subcutaneous and liver tumors. Mice were treated with anti-PD-L1 the day after CD4+ cell adoptive transfer. OT-1 cells were identified at analysis by CFSE, Celltrace-APC (short-term experiments), or OVA-tetramer positive or CD45.1 expressing CD8 cells (long-term experiments).
For in vitro coculture experiments, F4/80+ cells were isolated from liver by magnetic-activated cell sorting using PE-anti-F4/80 and anti-PE MicroBeads (Miltenyi, 130–048-801). Activated OT-I cells were generated as previously described and stained with CFSE (Invitrogen, C34570) before coculture. OT-I cells (5 × 10⁴) were cocultured with F4/80+ cells (2 × 10⁵) either in a 48-well plate in the presence of 105 MC38-OVA or MC38-luc cells, 55 μM β-ME and 5 ng ml−1 IL-2, or in a 96-well plate in the presence of 0.5 μg ml−1 OVA peptide. In some experiments, cells were cultured in transwell dishes. Apoptosis of OT-I cells was analyzed 48 h after coculture using annexin V and 7-AAD staining. For transwell experiments, a 6.5-mm insert in 24-well plate with a pore size of 0.4 μm was used (Sigma, CLS3397). For FasL and TNF-α blockade experiments, 20 μg ml−1 anti-FasL (BioXcell, clone no. MFL3), anti-TNF-α (Thermo Fisher, 14–7423-81) and Armenian Hamster IgG (BioXcell, BE0091) were used.
Immunofluorescence.
MC38 subcutaneous tumors with indicated treatments were collected and snap frozen in optimal cutting temperature compound. Cryosections at 8 μm were made and used for immunofluorescent staining. Sections were blocked with 1% BSA (37 °C, 1 h), stained with anti-CD8 (BD, Pharmingen, 550797) overnight at 4 °C, washed and then stained with secondary antibody (37 °C, 20 min), counterstained with DAPI and then analyzed with confocal microscope (Nikon, A1). Images were analyzed using ImageJ.
Cytokine quantification.
Protein levels of CCL2, CCL3, CCL4, CCL5, CCL11, CXCL1, CXCL2, CXCL9 and CXCL10 in liver tissues with different treatments were determined by Luminex (Millipore). Liver tissues were weighed and homogenized. Supernatants were collected after centrifuge at 10,000g for 5 min and the concentrations of different chemokines was determined by Luminex. Total amount of chemokines was determined by correcting for supernatant volume and then accounting for differences in tissue weight. Results were normalized to control conditions. The protein levels of CCL5 and CXCL10 in the supernatants of the in-vitro-treated MC38 cells were detected by ELISA (R&D Systems).
Flow cytometry.
Mononuclear cells were isolated from the subcutaneous tumor, liver, lung, lymph nodes and blood, and were stained with fluorescently conjugated antibodies as previously described6,56,57. Quantification of cell number was performed using CountBright Absolute Counting Beads (Thermo Fisher). For cytokine staining, lymphocytes were incubated in culture medium containing PMA (5 ng ml−1), ionomycin (500 ng ml−1), Brefeldin A (1:1,000) and Monensin (1:1,000) at 37 °C for 4 h. Extracellular staining using the antibodies listed below was performed for 20 min, then the cells were washed and resuspended in 1 ml of freshly prepared Fix/Perm solution (BD Biosciences) at 4 °C overnight. After being washed with Perm/Wash buffer (BD Biosciences), the cells were stained with intracellular antibodies listed below. Data collection and analysis was performed on a LSRII equipped with four lasers or a Fortessa equipped with four lasers (BD Bioscience) using BD FACS Diva software. The following antibodies were used: CD45 (Clone 30-F11, BD Biosciences), CD3 (Clone 145–2C11, Thermo Fisher Scientific), CD8 (Clone 53–6.7, BD Biosciences), CD90 (Clone 53–2.1, BD Biosciences), CD4 (Clone RM4–5, Thermo Fisher Scientific), PD-1 (Clone J43, Thermo Fisher Scientific), Ki67 (Clone B56, BD Biosciences), IFN-γ (Clone XMG1.2, BD Biosciences), CD44 (Clone IM7, BD Biosciences), CD45.1 (Clone A20, BD Biosciences), CD45.2 (Clone 104, BD Biosciences), LFA-1 (Clone H155–78, Biolegend), cleaved caspase-3 (Clone C92–605, BD Biosciences), CD11b (Clone M1/70, BD Biosciences), F4/80 (Clone T45–2342, BD Biosciences), FasL (Clone MFL3, Thermo Fisher Scientific), TIM-3 (Clone 5D12, BD Biosciences), TIGIT (Clone 1G9, BD Biosciences), LAG-3 (Clone C9B7W, BD Biosciences), CD11c (Clone HL3, BD Biosciences), I-A/I-E (Clone M5/114.15.2, Thermo Fisher Scientific), H-2Kb-bound SIINFEKL (Clone 25-D1.16, Thermo Fisher Scientific), CCR2 (Clone 475301, R&D Systems), TIM-4 (Clone RMT4–54, Thermo Fisher Scientific), granzyme B (Clone GB11, BD Biosciences), CD69 (Clone H1.2F3, Thermo Fisher Scientific), CD49a (Clone T45–2342, BD Biosciences), H-2Kb (Clone AF6–88.5, BD Biosciences), PD-L1 (Clone MIH5, BD Biosciences), H-2Kb p15E Tetramer (KSPWFTTL, MBL), Annexin V (Thermo Fisher Scientific) and 7-AAD (BD Biosciences). All antibodies were used at a 1:100 dilution. Representative flow cytometry gating is shown by Extended Data Figs. 3b and 5a, as well as Supplementary Fig. 8. OT-I cells were gated on CD45+CD3+CD90+ as well as APC-cell tracer+ cells or on CD45.1+CD45.2+ cells in select experiments. Endogenous tumor-specific T cells were gated on CD45+CD90+CD8+KSP-tetramer+ cells.
Mass cytometry.
CyTOF antibody generation and data acquisition were performed as previously defined58. Briefly, antibodies were conjugated to lanthanide metals (Fluidigm) using the Maxpar Antibody Labeling Kit (Fluidigm) per the manufacturer’s instructions. Lanthanide preloaded 2.5 mM Maxpar polymer was conjugated to partially-reduced antibody (TCEP, 37 °C, 30 min) overnight at room temperature. Unbound metal was removed through washing, and the final concentration of metal-tagged antibody was determined by measuring the absorbance at 280 nm against the wash buffer. The following antibodies were used for metal conjugation and staining: CD45 (Clone 30-F11, Fluidigm), CD4 (Clone RM4–5, Biolegend), CD44 (Clone IM7, Biolegend), CD11b (Clone M1/70, Fluidigm), CD19 (Clone 6D5, Life Technologies), CD86 (Clone GL-1, Biolegend), CD80 (Clone 16–10A1, Biolegend), CD8α (Clone 53–6.7, Biolegend), PDCA-1 (Clone 129C1, Biolegend), CD49b (Clone DX5, Biolegend), Ly-6C (Clone HK1.4, Novus), CD11c (Clone N418, Biolegend), I-A/I-E (Clone M5/114.15.2, Biolegend), CD25 (Clone 3C7, Biolegend), Ly-6G (Clone 1A8,Biolegend), TCRγ/δ (Clone GL3, Biolegend), CD115 (Clone AFS98, Biolegend), CXCR5 (Clone 614641, Novus Biologicals), CD62L (Clone MEL-14, Biolegend), PD-1 (Clone RMP1–30, Biolegend), F4/80 (Clone BM8, Biolegend), CD3 (Clone 145–2C11, Biolegend) and B220 (Clone RA3–6B2, Biolegend).
Antibody staining was conducted in heavy-metal-free PBS with 0.1% BSA, 2 mM EDTA and 0.05% sodium azide. TruStain FcX (anti-mouse CD16/32, Biolegend) was used to block the Fc receptors. Surface staining was performed at room temperature for 60 min. Subsequently, cells were fixed (1.6% paraformaldehyde, 20 min, room temperature). A viability stain with 62.5 nM Cell-ID Intercalator Iridium-191/193 (diluted in 1.6% paraformaldehyde in PBS from 500 μM stock) at room temperature for 40 min was performed prior to data acquisition.
Data acquisition was performed on the CyTOF Helios system (Fluidigm) according to the manufacturer’s instructions. A signal-correction algorithm based on the calibration bead signal was used to correct for any temporal variation in detector sensitivity. CyTOF data analysis was performed as previously described58. Total events were gated to remove non-cellular events (negative for DNA intercalator), dead cells (uptake of cisplatin) and doublets (event length greater than 25). Spanning-tree progression analysis of density-normalized events (SPADE) clustering and viSNE analysis for CyTOF data were performed using the Cytobank platform. SPADE nodes were manually bubbled on the basis of defined phenotypic markers of major cellular populations, as previously published. viSNE analysis was performed on all samples combined. Different immune populations were defined by the expression of specific markers (summarized in Extended Data Fig. 6c,d).
Single-cell sequencing.
Single-cell sequencing was performed on hepatic mononuclear cells isolated by density centrifugation. In brief, normal livers and livers bearing MC38 tumors were resected, minced, and passed through a 100-mM cell strainer (BD Biosciences). Hepatocytes were depleted through a series of 100g centrifugation steps. The supernatant was layered onto 15-ml Ficoll-Paque medium and centrifuged at 1,000g for 20 min and stopped without a brake applied. The buffy layer was isolated, washed and filtered. Three biological replicates were pooled. Single-cell library preparation was carried out as per the 10x Genomics Chromium Single Cell 5′ Library and Gel Bead Kit v2 no. 1000014 (10x Genomics). Cell suspensions were loaded onto a Chromium Single-Cell Chip along with the reverse transcription (RT) master mix and single cell 5′ gel beads, aiming for 10,000 cells per channel. Reverse transcription was performed using a C1000 Touch Thermal Cycler (Bio-Rad Laboratories). Thirteen cycles were used for complementary DNA amplification, and purification was conducted using SPRI select beads (Beckman Coulter), as per the manufacturer’s recommended parameters. Following the cDNA-amplification reaction, quality control and quantification was performed on the Agilent 2100 Bioanalyzer using the DNA high-sensitivity chip. For input into the gene-expression library construction, 50 ng cDNA and 14 cycles were used. Libraries were sequenced on an Illumina HiSeq 2500.
Single-cell sequencing analysis.
Basecalls from the sequencer were first converted into the FASTQ format with the bcl2fastq software provided by Illumina. Clean FASTQ files (adapters were trimmed) were aligned to the mouse genome (GRCm38.p6) using the Cell Ranger software pipeline (version 2.2) provided by 10x Genomics using the STAR aligner with the manufacturer’s recommended settings. UMI counts and gene information, as well as barcode matrix output from the Cell Ranger mentioned above, were used for downstream analysis with pipeline of Seurat (version 2.3.4) R (version 3.6.0) package. For data quality control, cells with fewer than 200 genes detected, cells with greater than 30% mitochondrial RNA content and cells not expressing Ptprc (CD45) were excluded from analysis. After this step, 28,692 out of 34,080 cells passed the filters and were included in downstream analyses. Counts on the filtered matrix of each gene were then normalized with the total library size with the Seurat ‘NormalizeData’ function. To focus on more biologically meaningful variation, we use a subset of highly variable genes (2,000) identified by the function of ‘FindVariableGenes’ from Seurat to perform unsupervised clustering. In order to compare between two samples, ‘FindIntegrationAnchors’ and ‘IntegrateData’ functions were used to integrate samples from mice with and without liver tumors. Then, each integrated feature was centered to mean of zero and was scaled by the s.d. with the function ‘ScaleData’ in Seurat. Linear dimensionality reduction (PCA) was performed using the function ‘RunPCA’. To partition the cellular distance matrix into clusters, the graph-based ‘FindClusters’ function was used with the resolution set to 0.5. Next, UMAP plots were used to visualize the clusters of cells localized in the graph-based clusters by using ‘RunUMAP’ function with the same principal components described as above. Cluster markers were identified by finding differentially expressed genes between cells in a single cluster versus all cells in all other clusters using ‘FindAllMarkers’ function (Seurat). Clusters were further annotated by directly examined the expression levels of the markers identified above for each cell types with ‘Enrichr’ software59. The M1-like, M2-like and cross-presentation gene signature enrichment analysis were obtained from literature60. The enrichment scores were calculated by averaging the expression level of each signature gene using the ‘Apply’ function (R). To construct cell trajectories for monocyte-derived macrophages, the scaled expression was reclustered as mentioned above. This data served as the input of pseudotime analysis which was performed using the Monocle R package (v2.8.0) with the reverse graph embedding machine-learning algorithm61. Data were then normalized with the total library size with the ‘estimateSizeFactors’ function (Monocle). Then, the negative binomial overdispersion was estimated for each gene using the ‘estimateDispersions’ function. To identify genes that changed steadily along the identified trajectory, a likelihood ratio test for a negative binomial model was performed using the ‘differentialGeneTest’ function. Genes that were identified to be significant on the basis of a P threshold of 0.01 after multiple-hypothesis correction were kept for further prediction. Next, these significantly differentially expressed genes, which had a mean expression value greater than 0.1 and variance greater than an empirical dispersion, were used to perform dimension reduction using the DDRTree method (Monocle). Cells were then represented onto a pseudotime trajectory using the ‘orderCells’ function. Finally, the trajectory was plotted with the ordered cells using the function of ‘plot_cell_trajectory’ on Monocle. Colors of the trajectory were defined based on the state and pseudotime as well as the cluster information output from the Seurat described above. Following rigorous quality control and filtering, we identified a total of 22,993 cells representing all major leukocyte cell types. Uniform manifold approximation and projection (UMAP) analysis identified 29 distinct hepatic immune-cell clusters that expressed Ptprc, the gene encoding CD45. To confirm the identity of cells within each cluster, we examined the expression levels of canonical markers for T cells (Cd3, Cd8, Cd4), B cells (Cd19, Cd79a), conventional natural killer cells (cNK, Ncr1, Klrb1), liver-resident NK cells (lrNK, Itga1, Ncr1), macrophages (Cd68, Lyz2), neutrophils (S100a9, Ly6g), basophils (Cdh1, Mcpt8), plasmacytoid dendritic cells (Siglech, Bst2) and conventional dendritic cells (Itgax, Zbtb46)62,63.
Human PD-L1, tumor mutational burden and T cell analyses.
Patients underwent whole-exome sequencing at the University of Michigan, as we have previously described29. T cell receptor sequencing and diversity calculation was performed as we previously described using the immunoSEQ platform (Adaptive Biotechnologies)29. Tumor mutational burden was estimated as: (total mutations / total covered bases) × 106, as previously described29. A previously validated gene signature for the CD8+ T cells function was utilized30. Annotation of liver metastasis was performed on the basis of cross-sectional imaging acquired immediately prior to biopsies taken for sequencing. Signature scores were computed by inverse-normal transformation of gene expression levels across the cohort followed by summation of inverse-normal values for each sample, as previously described. PD-L1 expression was quantified on the basis of expression profiling (Cohort 5) or on the basis of immunohistochemistry using 22C3 (Dako) or SP142 (Ventana) PD-L1 antibody staining performed in a CLIA ‘88 (Clinical Laboratory Improvement Amendments) certified laboratory.
Statistical analysis.
For preclinical in vitro and in vivo studies, analysis of variance, t and Chi-squared tests were used as indicated to compare independent groups. Survival functions were estimated by the Kaplan–Meier methods and were compared using the log-rank test. Correlation of immunotherapy response rate and metastatic tropism was calculated using a mixed effect meta-regression model while adjusting for tumor mutational burden and PD-L1. Inverse-probability weighted (IPW) estimator and random forest analysis were used for multivariable survival modeling. The weights were estimated using the covariate balancing propensity score method64 taking into account age, gender, ECOG performance status, number of lines of prior therapy, elevations in LDH (Cohort 1 only), BRAF mutational status (Cohort 1 only), EGFR mutational status (Cohort 3 only), PD-L1 staining (Cohort 3 only) and tumor burden. For IPW modeling of Cohort 5, PD-L1 expression, tumor burden, tumor mutational burden, tumor histology and ECOG performance status were included. Random forest covariates for NSCLC (Cohort 3) included age, gender, prior therapy, tumor burden, ECOG performance status, smoking, EGFR mutational status and PD-L1 staining intensity. Covariates for melanoma (Cohort 1) included age, prior therapy, tumor burden, gender, BRAF mutational status, LDH elevations, ECOG performance status, melanoma subtype and the presence of brain metastases. Covariates for Cohort 5 included tumor histology, PD-L1 expression, tumor burden, tumor mutational burden and ECOG performance status. The OS and PFS were estimated using inverse-probability-weighted Kaplan–Meier method, and the weighted log-rank test was used to compare the patients with liver metastases versus those with other metastases. Multiple imputation was used to impute missing covariate values, and the results from imputed datasets were combined using Rubin’s rule. Random effect meta-regression models were used to estimate the impact of metastatic tropism on PD-1 response rate, while adjusting for known confounders. All analyses were done using SPSS, SAS, R or GraphPad Prism. One-way ANOVA and two-way ANOVA were used as indicated to compare continuous outcomes across multiple experimental groups. For all tests, P < 0.05 was considered significant. Sample size was not predetermined. Unless noted, samples were independent biological replicates.
Reporting Summary.
Further information on research design is available in the Nature Research Reporting Summary linked to this article.
Data availability
Raw data for single-cell sequencing are deposited at the NCBI Gene Expression Omnibus (GSE157600). Further information and requests for resources and reagents should be directed to the corresponding authors. All requests for raw and analyzed data and materials will be promptly reviewed by the corresponding authors to verify if the request is subject to any intellectual property or confidentiality obligations. Any data and materials that can be shared will be released via a Material Transfer Agreement. Patient-related data not included in the paper may be subject to patient confidentiality. Source data have been provided with this paper for Figs. 1–6 as well as Extended Figs. 1–9.
Extended Data
Extended Data Fig. 1 |. Liver metastasis correlates with diminished immunotherapy efficacy in cancer patients.
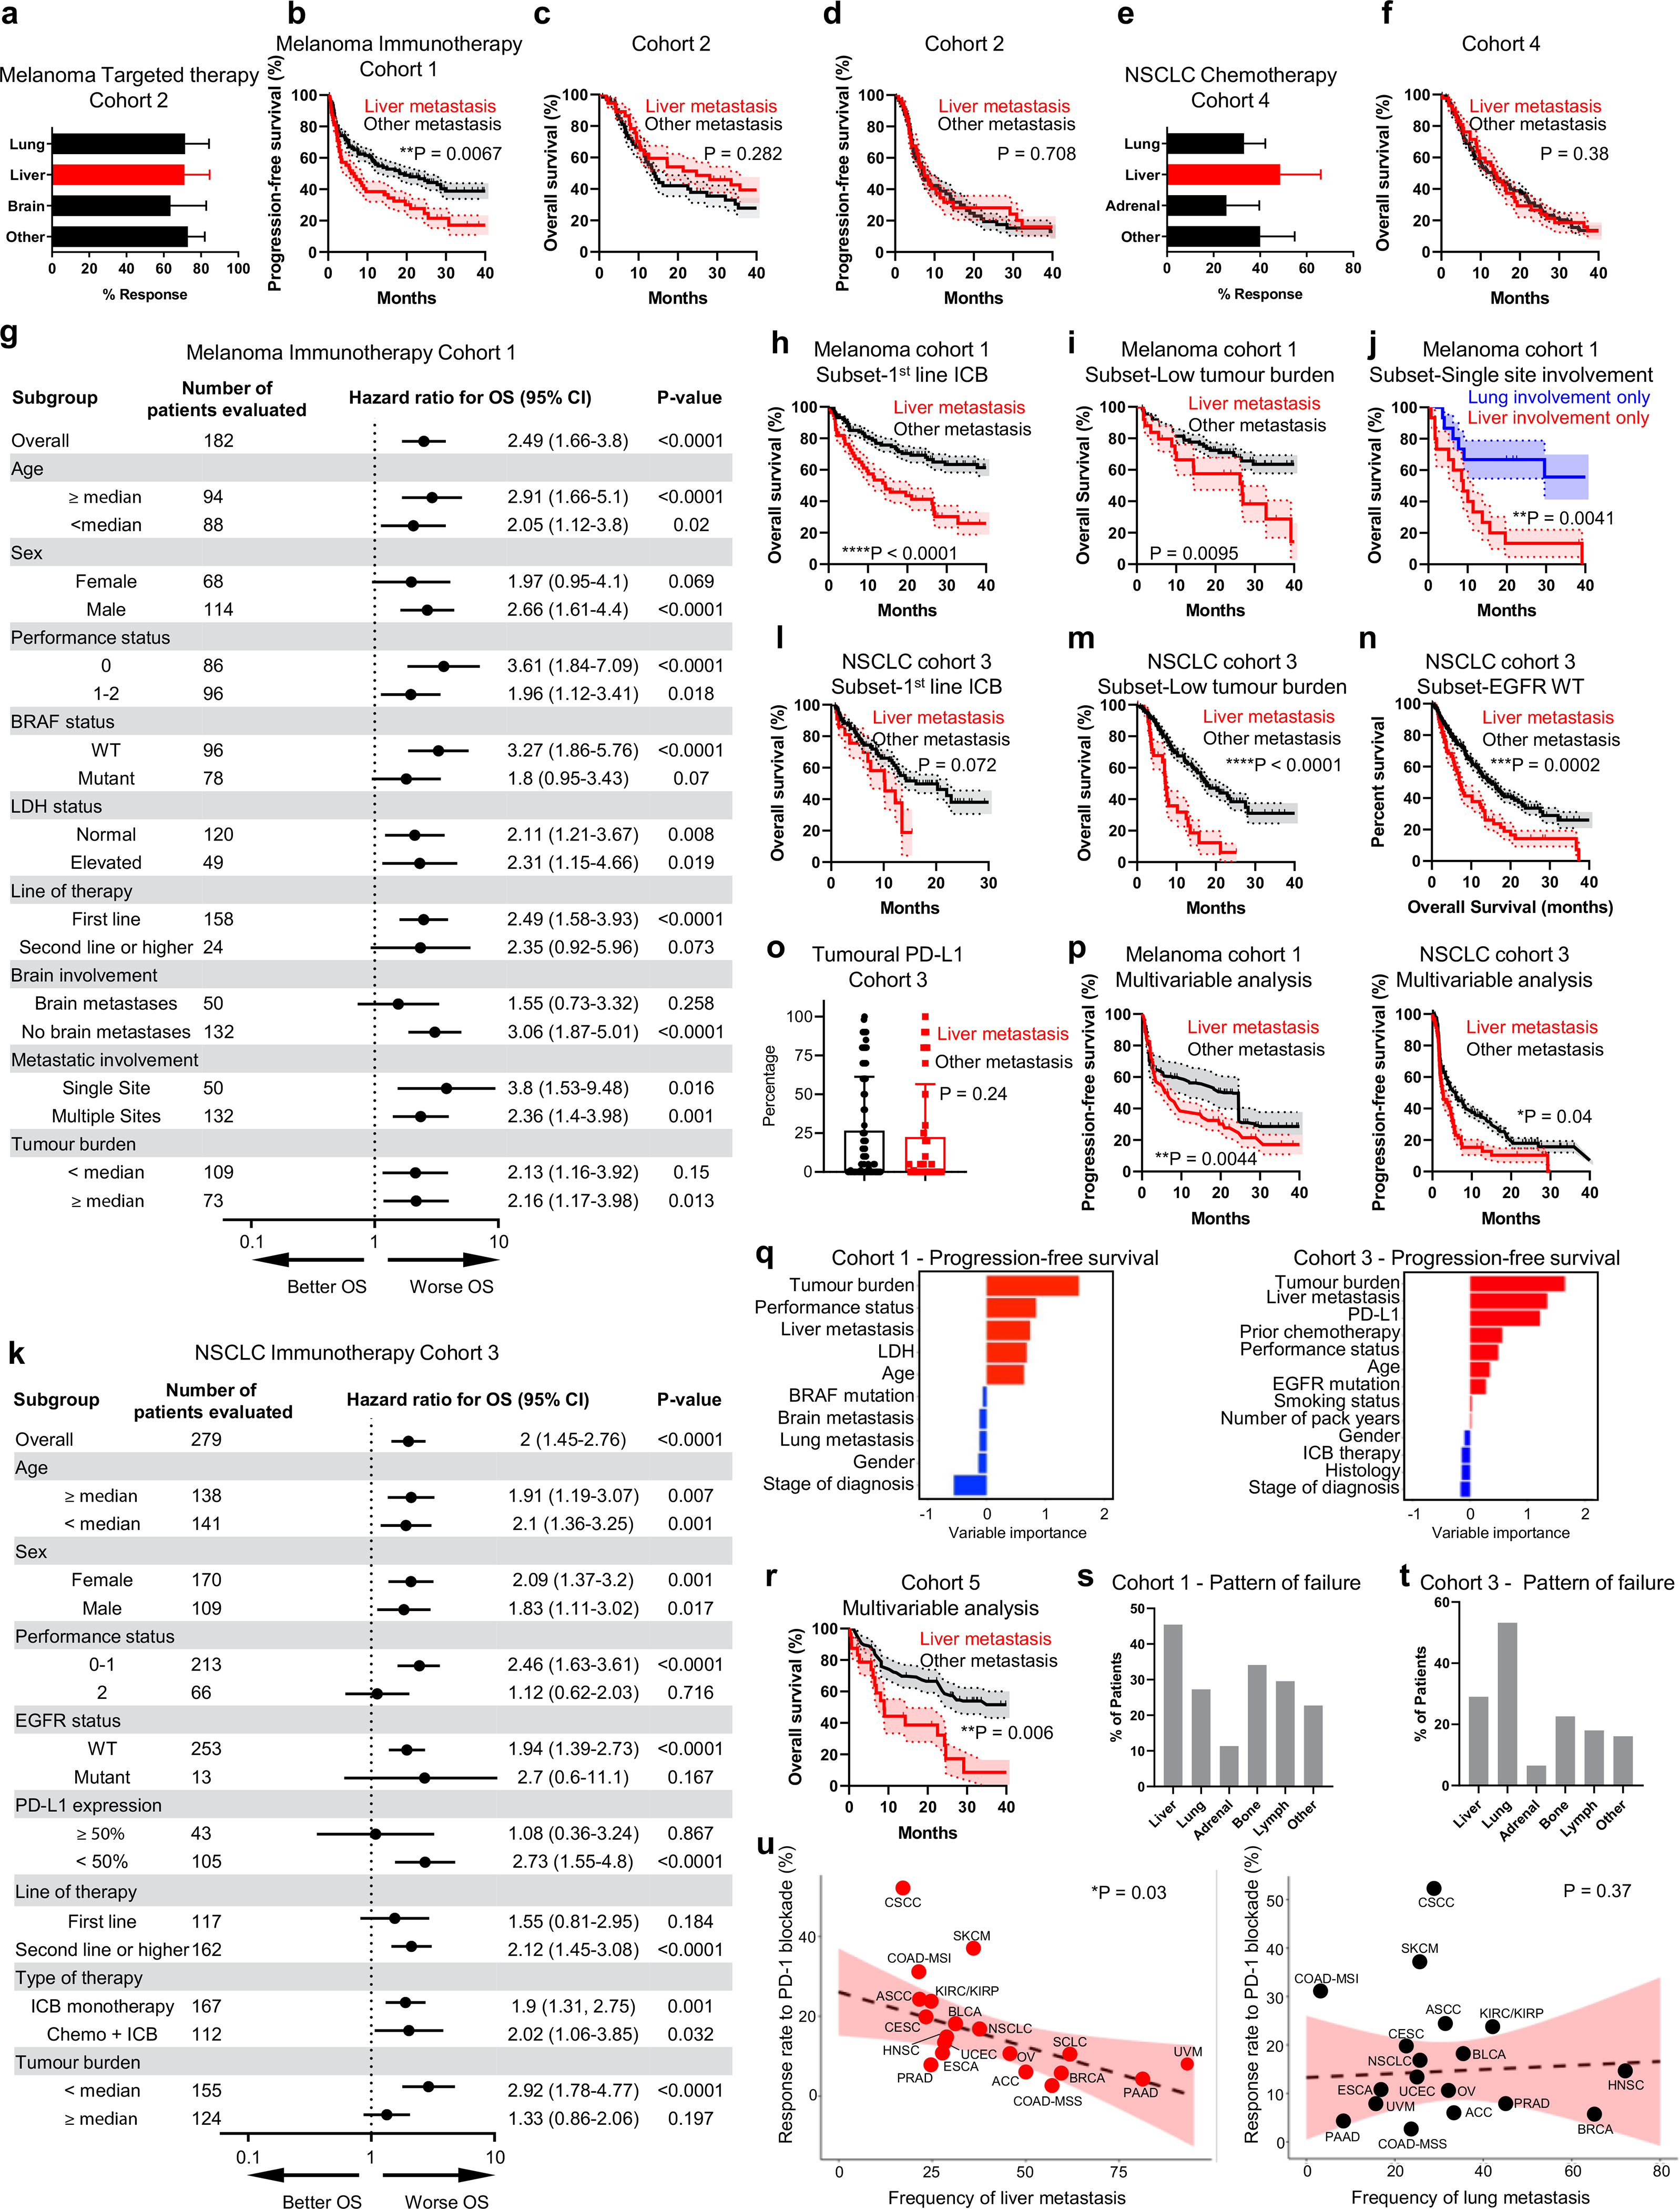
a Best objective response rates in metastatic melanoma patients treated with targeted therapy stratified by baseline disease distribution. Chi-squared for liver metastasis P = 0.63, mean ± SD, liver n = 37, brain n = 23, lung n = 46. b PFS in melanoma patients treated with immunotherapy stratified by liver metastasis. Log-rank test, HR = 2.76, survival±SE, liver n = 64, other n = 118. c OS in melanoma patients treated with targeted therapy stratified by liver metastasis. Log-rank test, HR = 0.557, liver n = 37, other n = 60. d PFS in melanoma patients treated with targeted therapy stratified by liver metastasis; log-rank test, HR = 1.0670, survival±SE, liver n = 37, other n = 60. e Best objective response rates in metastatic nSCLC patients who received chemotherapy stratified by baseline disease distribution. Chi-squared, P = 0.83, mean ± SD, liver n = 43, adrenal n = 39, lung n = 140. f OS in nSCLC patients treated with chemotherapy stratified by liver metastasis; log-rank test, HR = 0.960, survival±SE, liver n = 43, other n = 106. g Forest plot for OS in indicated immunotherapy-treated melanoma patient subset (Cohort 1). Log-rank test, HR, n, and P-value indicated, mean ± SD. h OS in melanoma patients with (n = 55) and without (n = 95) liver metastases treated with immunotherapy in the first-line setting. Log-rank test, HR = 3.564, survival±SE. i OS in melanoma patients with less than the median tumour burden treated with immunotherapy stratified by presence (n = 36) or absence (n = 92) of liver metastasis. Log-rank test, HR = 2.644, survival±SE. j OS in melanoma patients with only liver metastases (n = 15) versus only lung metastases (n = 15). Log-rank test, HR = 3.616; survival±SE. k Forest plot for OS in indicated immunotherapy-treated nSCLC patient subset (Cohort 3). Log-rank test, HR, n, and P-value indicated, mean ± SD. l OS in nSCLC patients treated with immunotherapy in the first line setting stratified by presence (n = 22) or absence (n = 95) of liver metastasis. Log-rank test, HR = 1.577, survival±SE. m OS in nSCLC patients with less than the median tumour burden treated with immunotherapy stratified by presence (n = 25) or absence (n = 115) of liver metastasis. Log-rank test, HR = 2.440; survival±SE. n OS in nSCLC patients wild type EGFR stratified by presence (n = 64) or absence (n = 188) of liver metastasis. Log-rank test, HR = 1.895, survival±SE. o Tumoural PD-L1 staining score in metastatic nSCLC patients (Cohort 3) with (n = 34) and without (n = 114) liver metastases. Unpaired two-tailed Student’s t-test, mean ± SD. p Inverse probability weighted multivariable analysis of PFS in melanoma and nSCLC patients receiving immunotherapy stratified by liver metastasis; Log-rank test, HR = 1.13 and 2.06, respectively, mean ± SD, melanoma liver n = 61, melanoma other n = 102, nSCLC liver n = 63, nSCLC other n = 172. q Variable importance quantification from random forest multivariable modeling of PFS in metastatic melanoma and nSCLC patients receiving immunotherapy (Cohorts 1,3). r Inverse probability weighted multivariable analysis of OS in Cohort 5 stratified by presence of liver metastases. Log-rank test, HR = 2.15, mean ± SD, liver n = 25, other n = 57. s Frequency of relapse in indicated location in melanoma patients with liver metastases receiving immunotherapy. Count displayed. t Frequency of relapse in indicated location in nSCLC patients with liver metastases receiving immunotherapy. Count displayed. u Random effect meta-regression modeling of correlation between anti-PD-1 overall response rates in different histologies versus metastatic tropism to liver or lung. β = 4.6% per 20 liver metastasis increase; β = −0.24% per 20 lung metastasis increase. Mixed effect model, median predicted ORR and 95% confidence intervals, n per Supplementary Table 7.
Extended Data Fig. 2 |. Liver metastasis diminishes immunotherapy efficacy in mice.
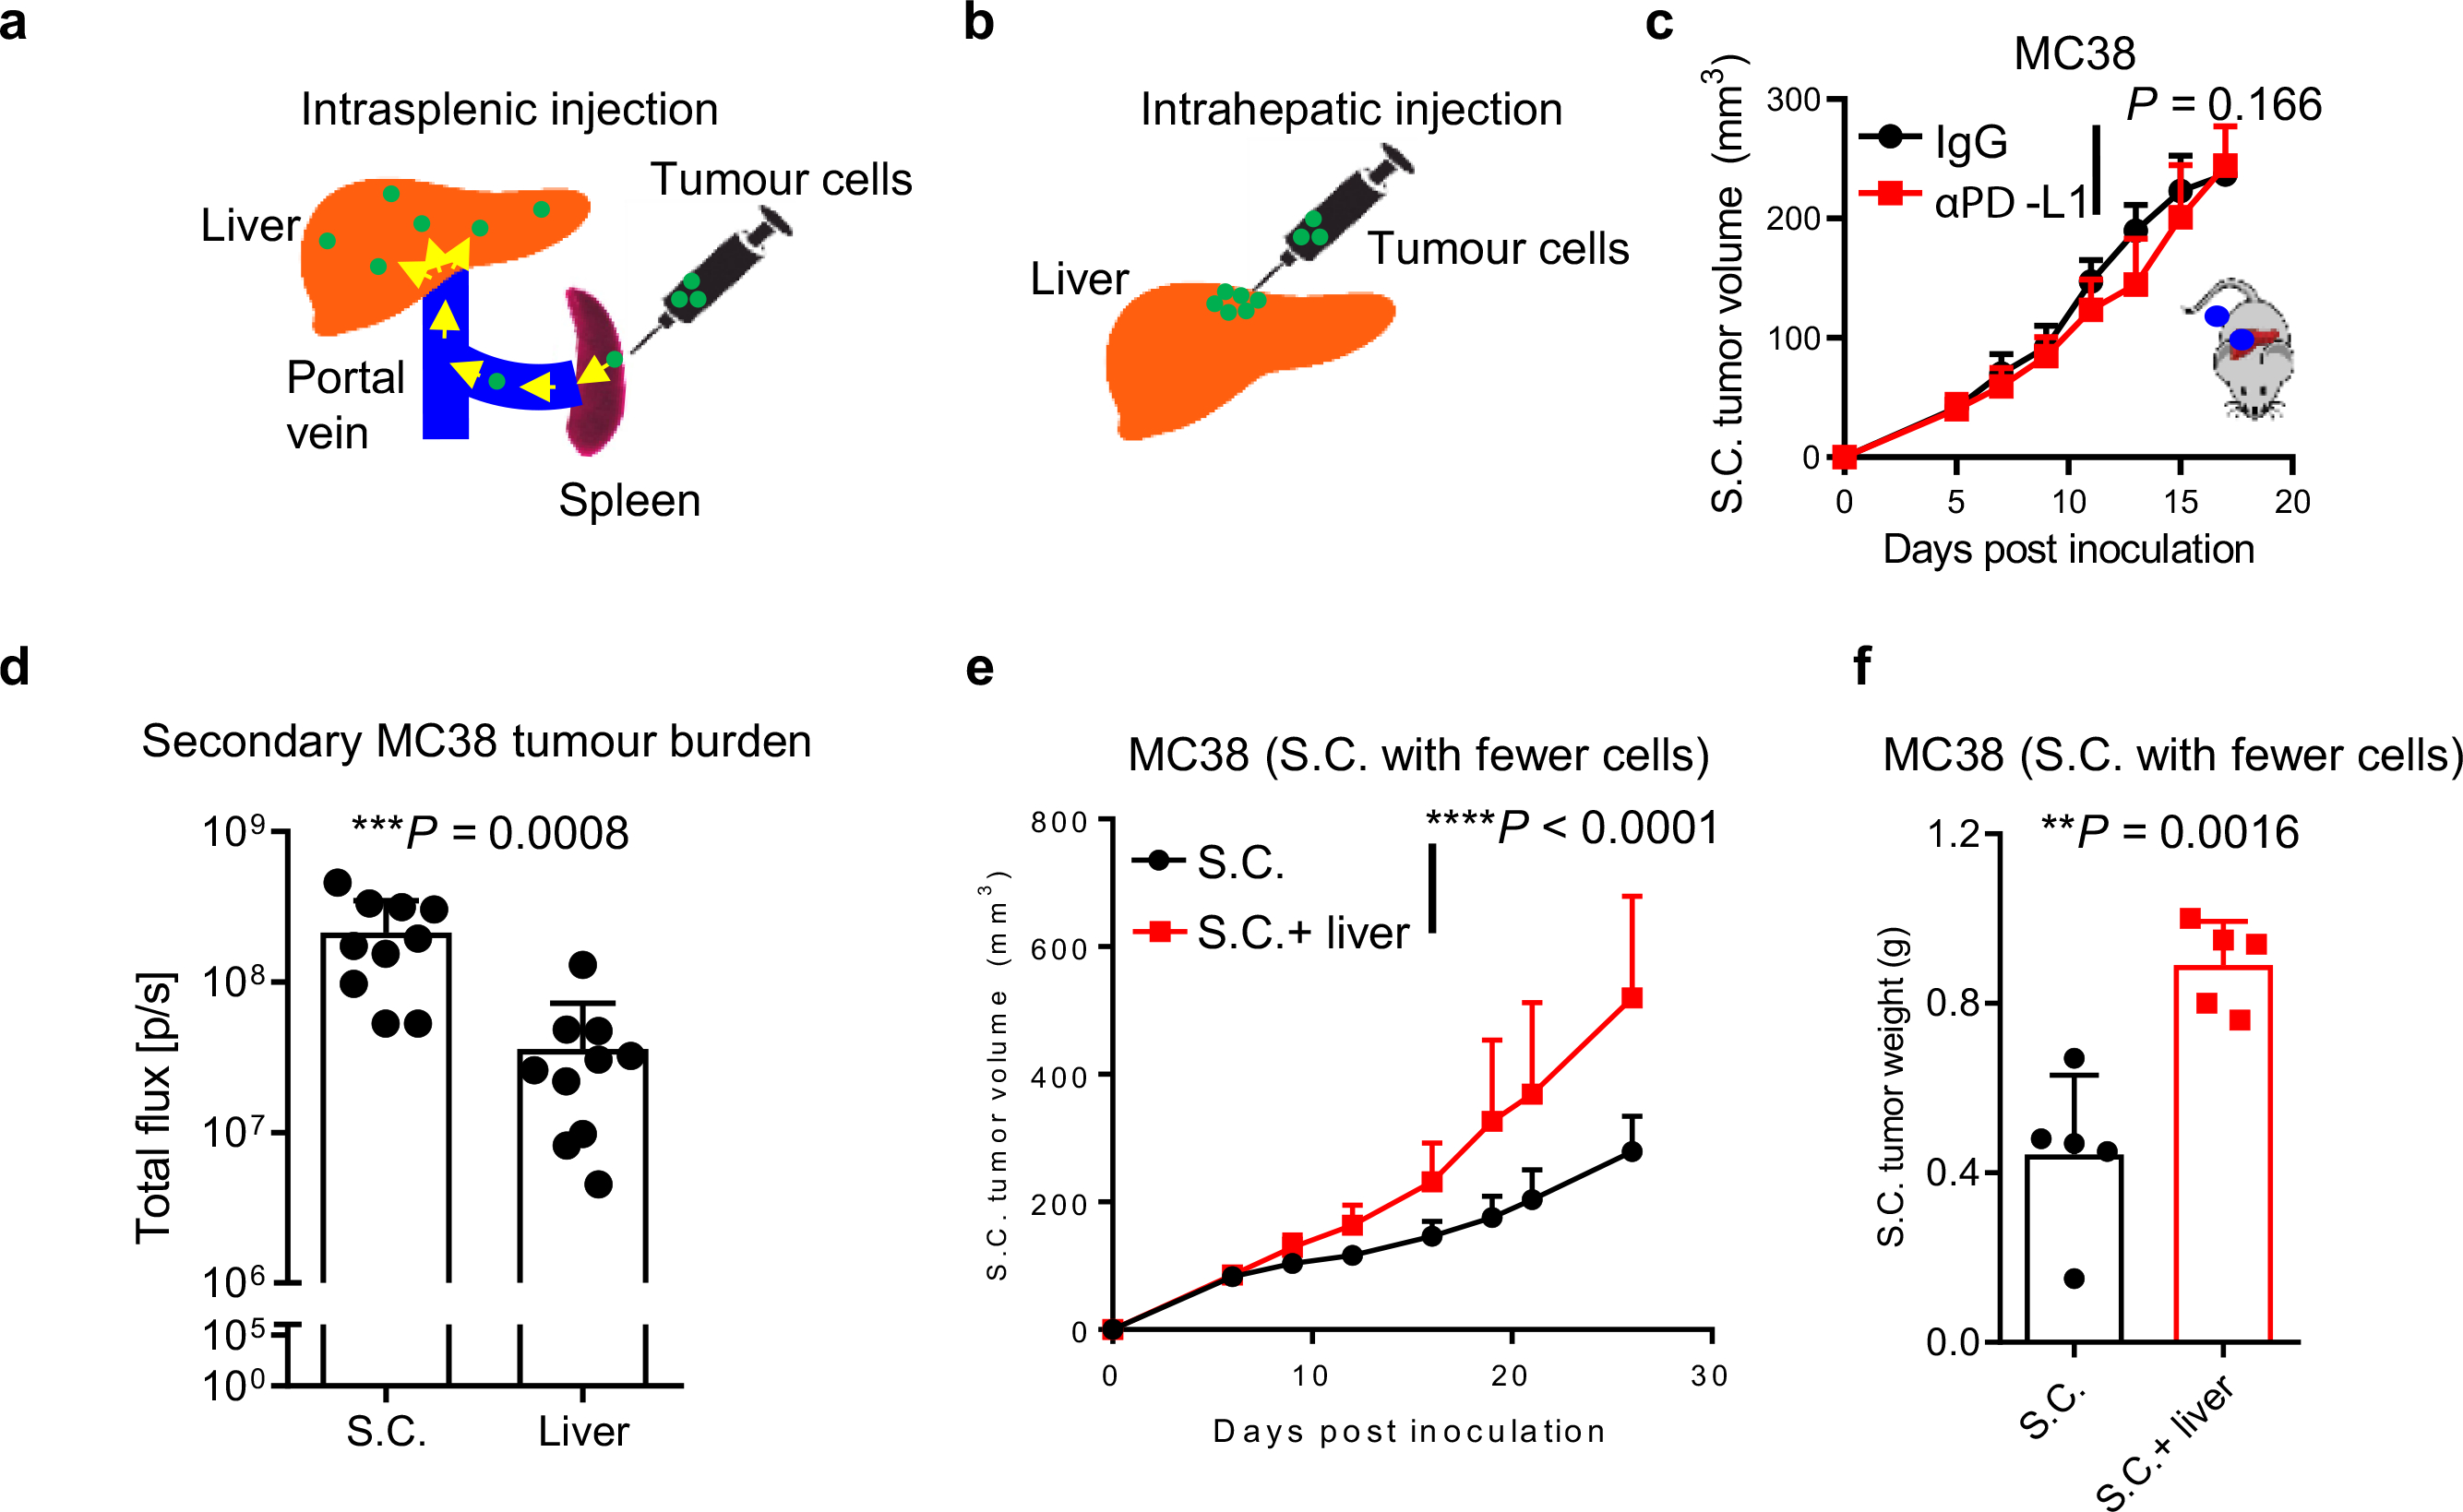
a Schematic for establishing experimental liver metastasis by intrasplenic inoculation. b Schematic for establishing experimental liver tumours by intrahepatic inoculation. c Subcutaneous tumour growth in mice bearing liver tumours established by intrahepatic inoculation, with and without anti-PD-L1 therapy. Two-way AnOVA, mean ± SD, n = 6 per group. d Bioluminescent quantification of secondary tumour burden of a liver tumour from mouse bearing a subcutaneous tumour and liver tumour (as in Fig. 2i) versus the contralateral subcutaneous tumour in mice bearing two subcutaneous tumours (as in Fig. 2h) by bioluminescence. Quantification on day 7 prior to initiation of anti-PD-L1. Unpaired two-tailed Student’s t-test, mean ± SD, n = 10 per group. e, f Subcutaneous MC38 tumour volume (e) and weight (f) in mice with and without liver tumours in which a limited number (1×10⁶) of tumour cells were inoculated subcutaneously. Weight analysed 4 weeks after tumour inoculation. (e) two-way AnOVA; (f) unpaired two-tailed Student’s t-test, mean ± SD, n = 5 per group. Data are representative of at least two independent experiments (c-f).
Extended Data Fig. 3 |. Liver metastasis induces systemic loss of antigen-specific T cells.
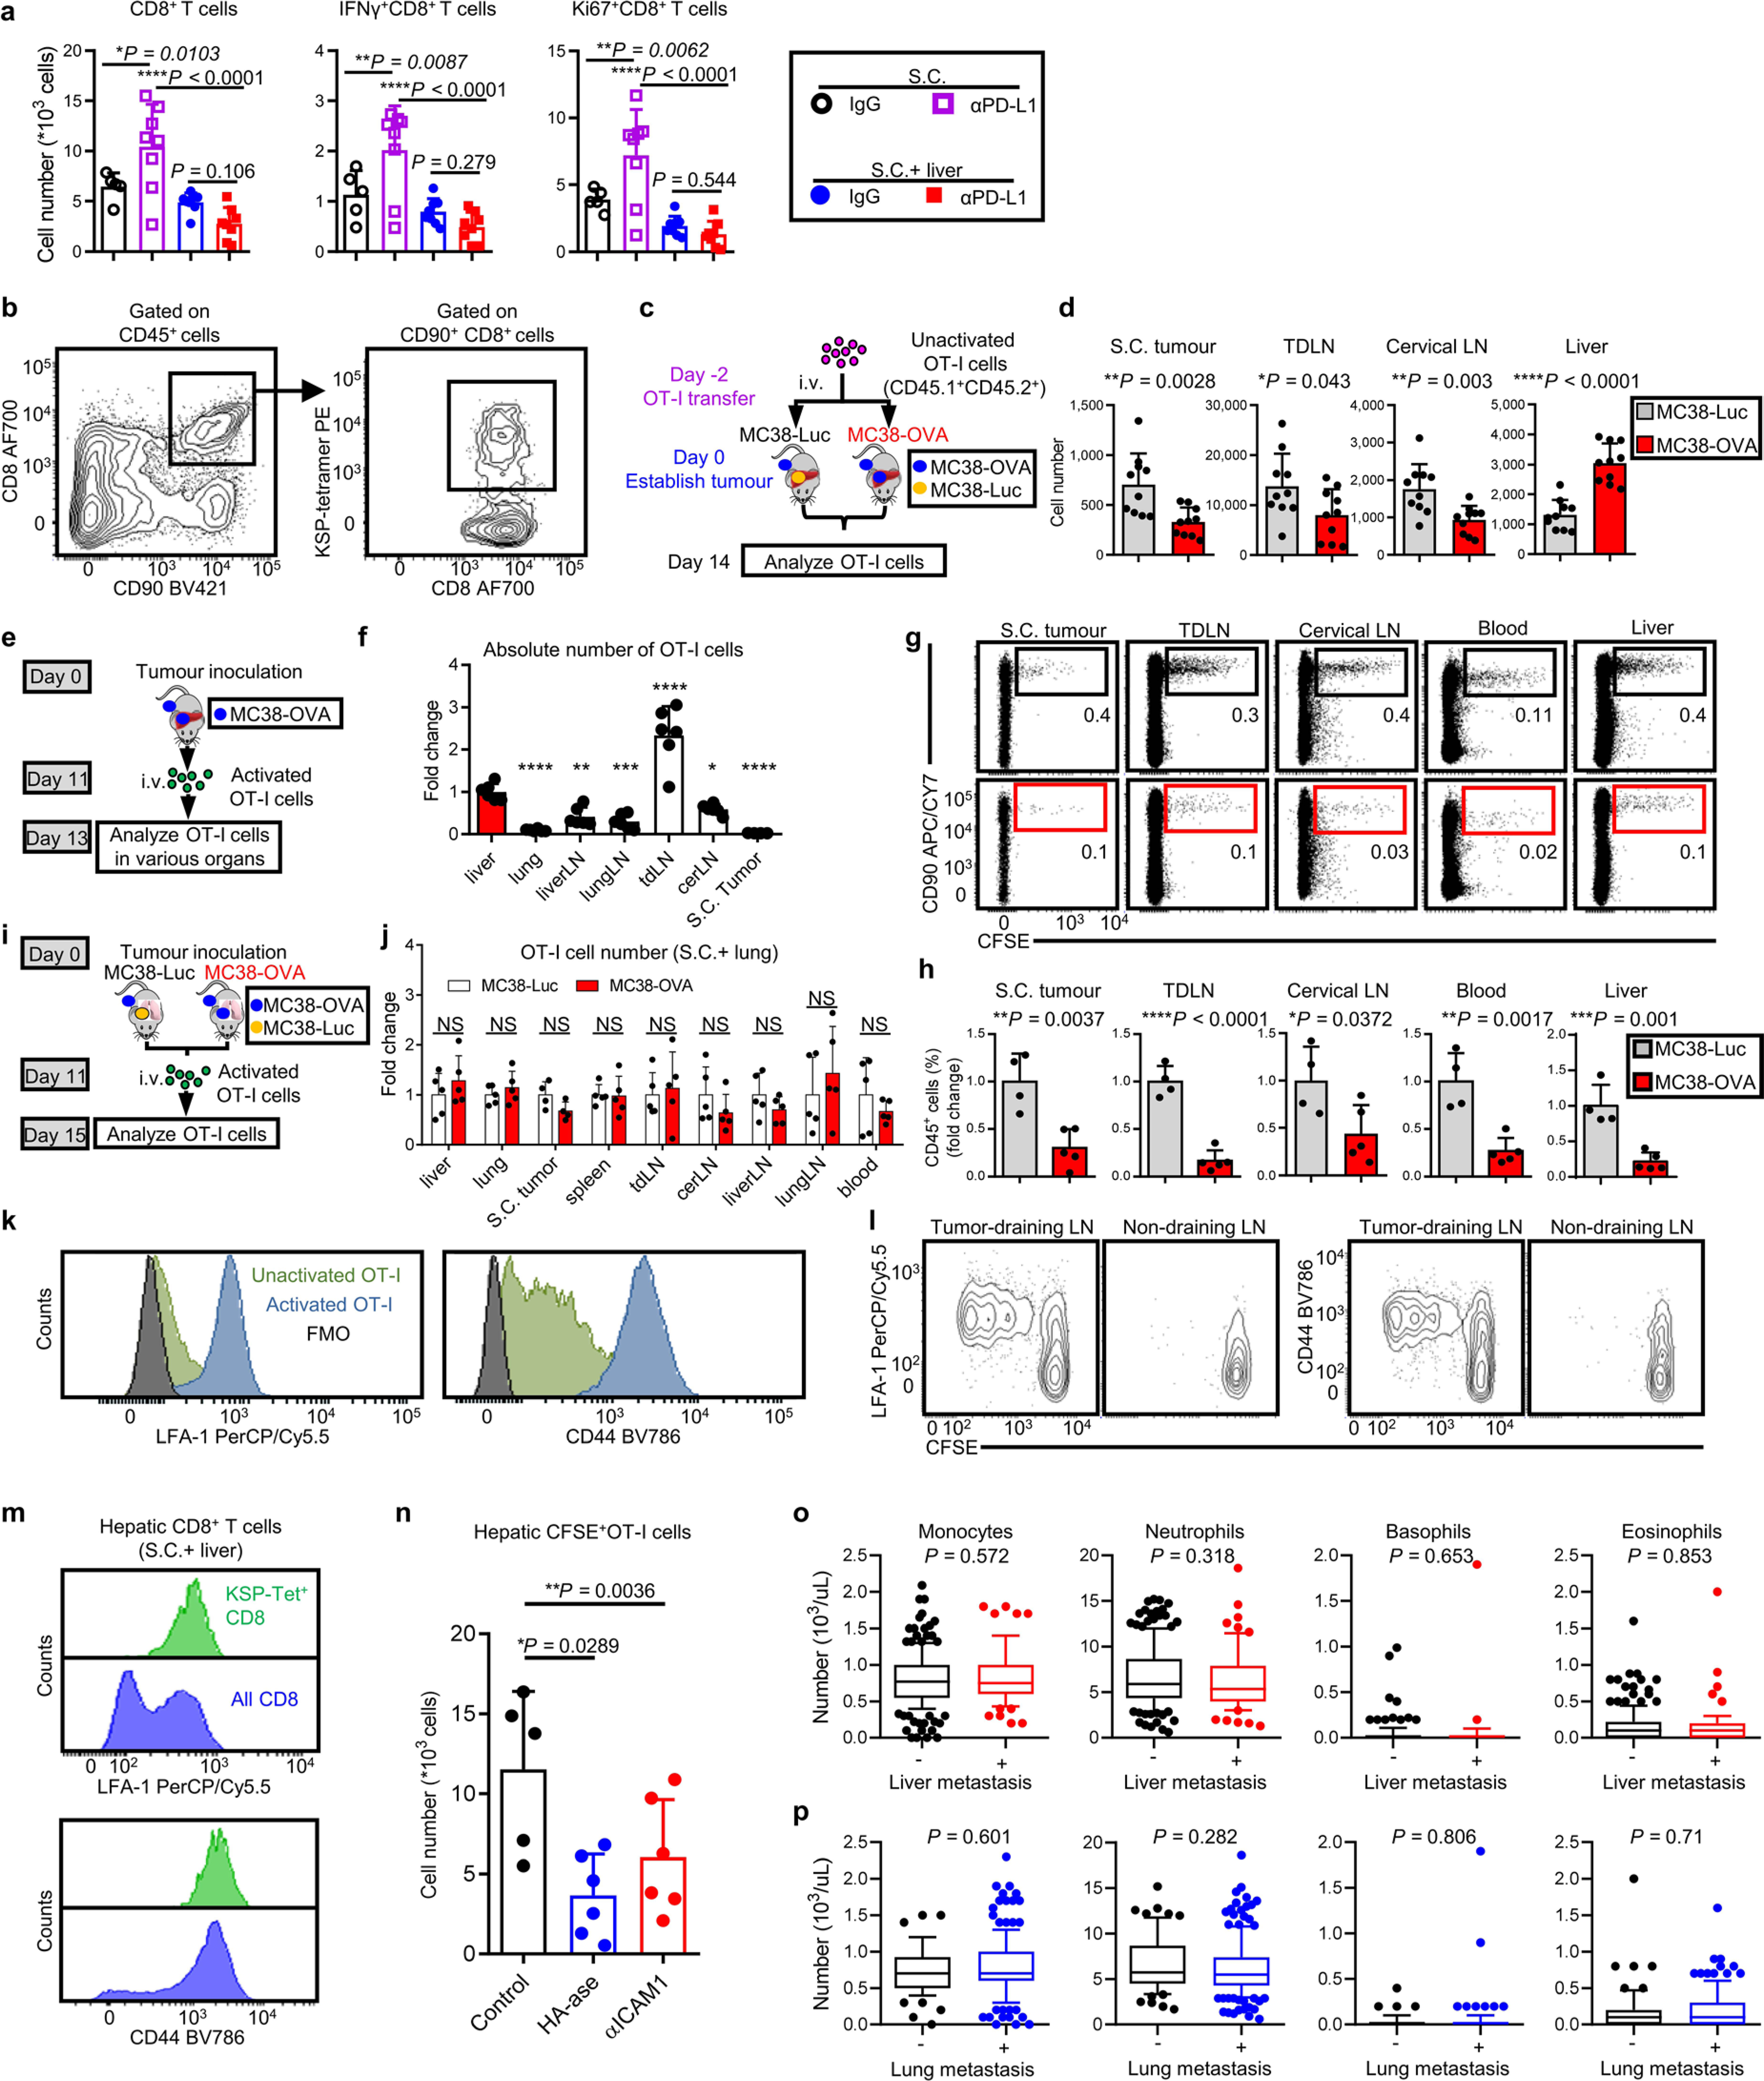
a Subcutaneous tumour CD8+ T cell, IFnγ+CD8+ T cell and Ki67+CD8+ T cell number per gram tumour. Analysed 7 days post anti-PD-L1 treatment initiated. One-way AnOVA with Tukey’s correction, mean ± SD, IgG n = 5, others n = 8. b Representative plot for H-2Kb MuLV p15E tetramer (KSP-tetramer) staining of MC38 tumour-specific CD8+ T cells in S.C. tumour samples. c, d Schematic for unactivated OT-I cell adoptive cell transfer (c) and absolute number of CD45.1+CD8+ OT-I T cells in indicated compartments of mice bearing MC38-Luc or MC38-OVA liver tumour (d). Analysed 14 days after tumour inoculation. Unpaired two-tailed Student’s t-test, mean ± SD, n = 10 per group. e, f Schematic (e) and quantification (f) of activated OT-I-cell distribution 2 days after adoptive cell transfer into mice bearing both subcutaneous and liver MC38-OVA tumour. Displayed as relative cell number to hepatic OT-I cell number. One-way AnOVA, *P = 0.0247, **P = 0.002, ***P = 0.0003, ****P < 0.0001, mean ± SD, n = 6 per group. g, h Representative flow plots (g) and quantification (h) of activated OT-I-cell distribution 4 days after adoptive cell transfer into MC38-OVA tumour bearing mice with MC38-Luc (n = 4) or MC38-OVA (n = 5) liver tumour (as shown in Fig. 3j); unpaired two-tailed Student’s t-test, mean ± SD. i, j Schema (i) and quantification (j) of activated OT-I-cell distribution 4 days after adoptive cell transfer into subcutaneous MC38-OVA tumour bearing mice with MC38-Luc lung tumour or MC38-OVA lung tumour. Displayed as relative cell number (normalized to MC38-Luc group). Unpaired two-tailed Student’s t-test, nS, not significant (P-value: liver, 0.37; lung, 0.42; S.C. tumour, 0.09; spleen, 0.91; tdLn, 0.74; cerLn, 0.26; liverLn, 0.22; lungLn, 0.45; blood, 0.36), mean ± SD, n = 5 per group. k Flow cytometry histogram depicting expression of LFA-1 (left) and CD44 (right) on in vitro activated OT-I cells. l Flow cytometry plots depicting expression of LFA-1 (left) and CD44 (right) expression on in vivo activated OT-I cells isolated from subcutaneous MC38-OVA tumour-draining Lns or non-draining Lns. Analysed 3 days after adoptive transfer. m Flow cytometry histogram depicting expression of LFA-1 (upper) and CD44 (bottom) on tumour specific KSP-tetramer+CD8+a cells (green) in the liver. n CFSE+CD8+OT-I cell number per gram liver tissue. OT-I cells were adoptively transferred 1–2 days after anti-ICAM-1 or HA-se. Analyzed 24 hours after transfer. One-way AnOVA, mean ± SD, control n = 5, HA-se n = 6, anti-ICAM-1 n = 6. o Pre-treatment immune cell subset blood counts of nSCLC patients receiving immunotherapy (Cohort 3) with (n = 62) or without (n = 189) liver metastases. Unpaired two-tailed Student’s t-test, box and whiskers, box represents mean and IQR, whisker represents 10–90%, outliers represent min to max. p Pre-treatment blood immune cell subset counts of nSCLC patients receiving immunotherapy (Cohort 3) with (n = 187) or without (n = 62) lung metastases. Unpaired two-tailed Student’s t-test, box and whiskers, box represents mean and IQR, whisker represents 10–90%, outliers represent min to max. Data are representative of at least two independent experiments (a-n).
Extended Data Fig. 4 |. T cell phenotype and apoptosis in liver metastasis.
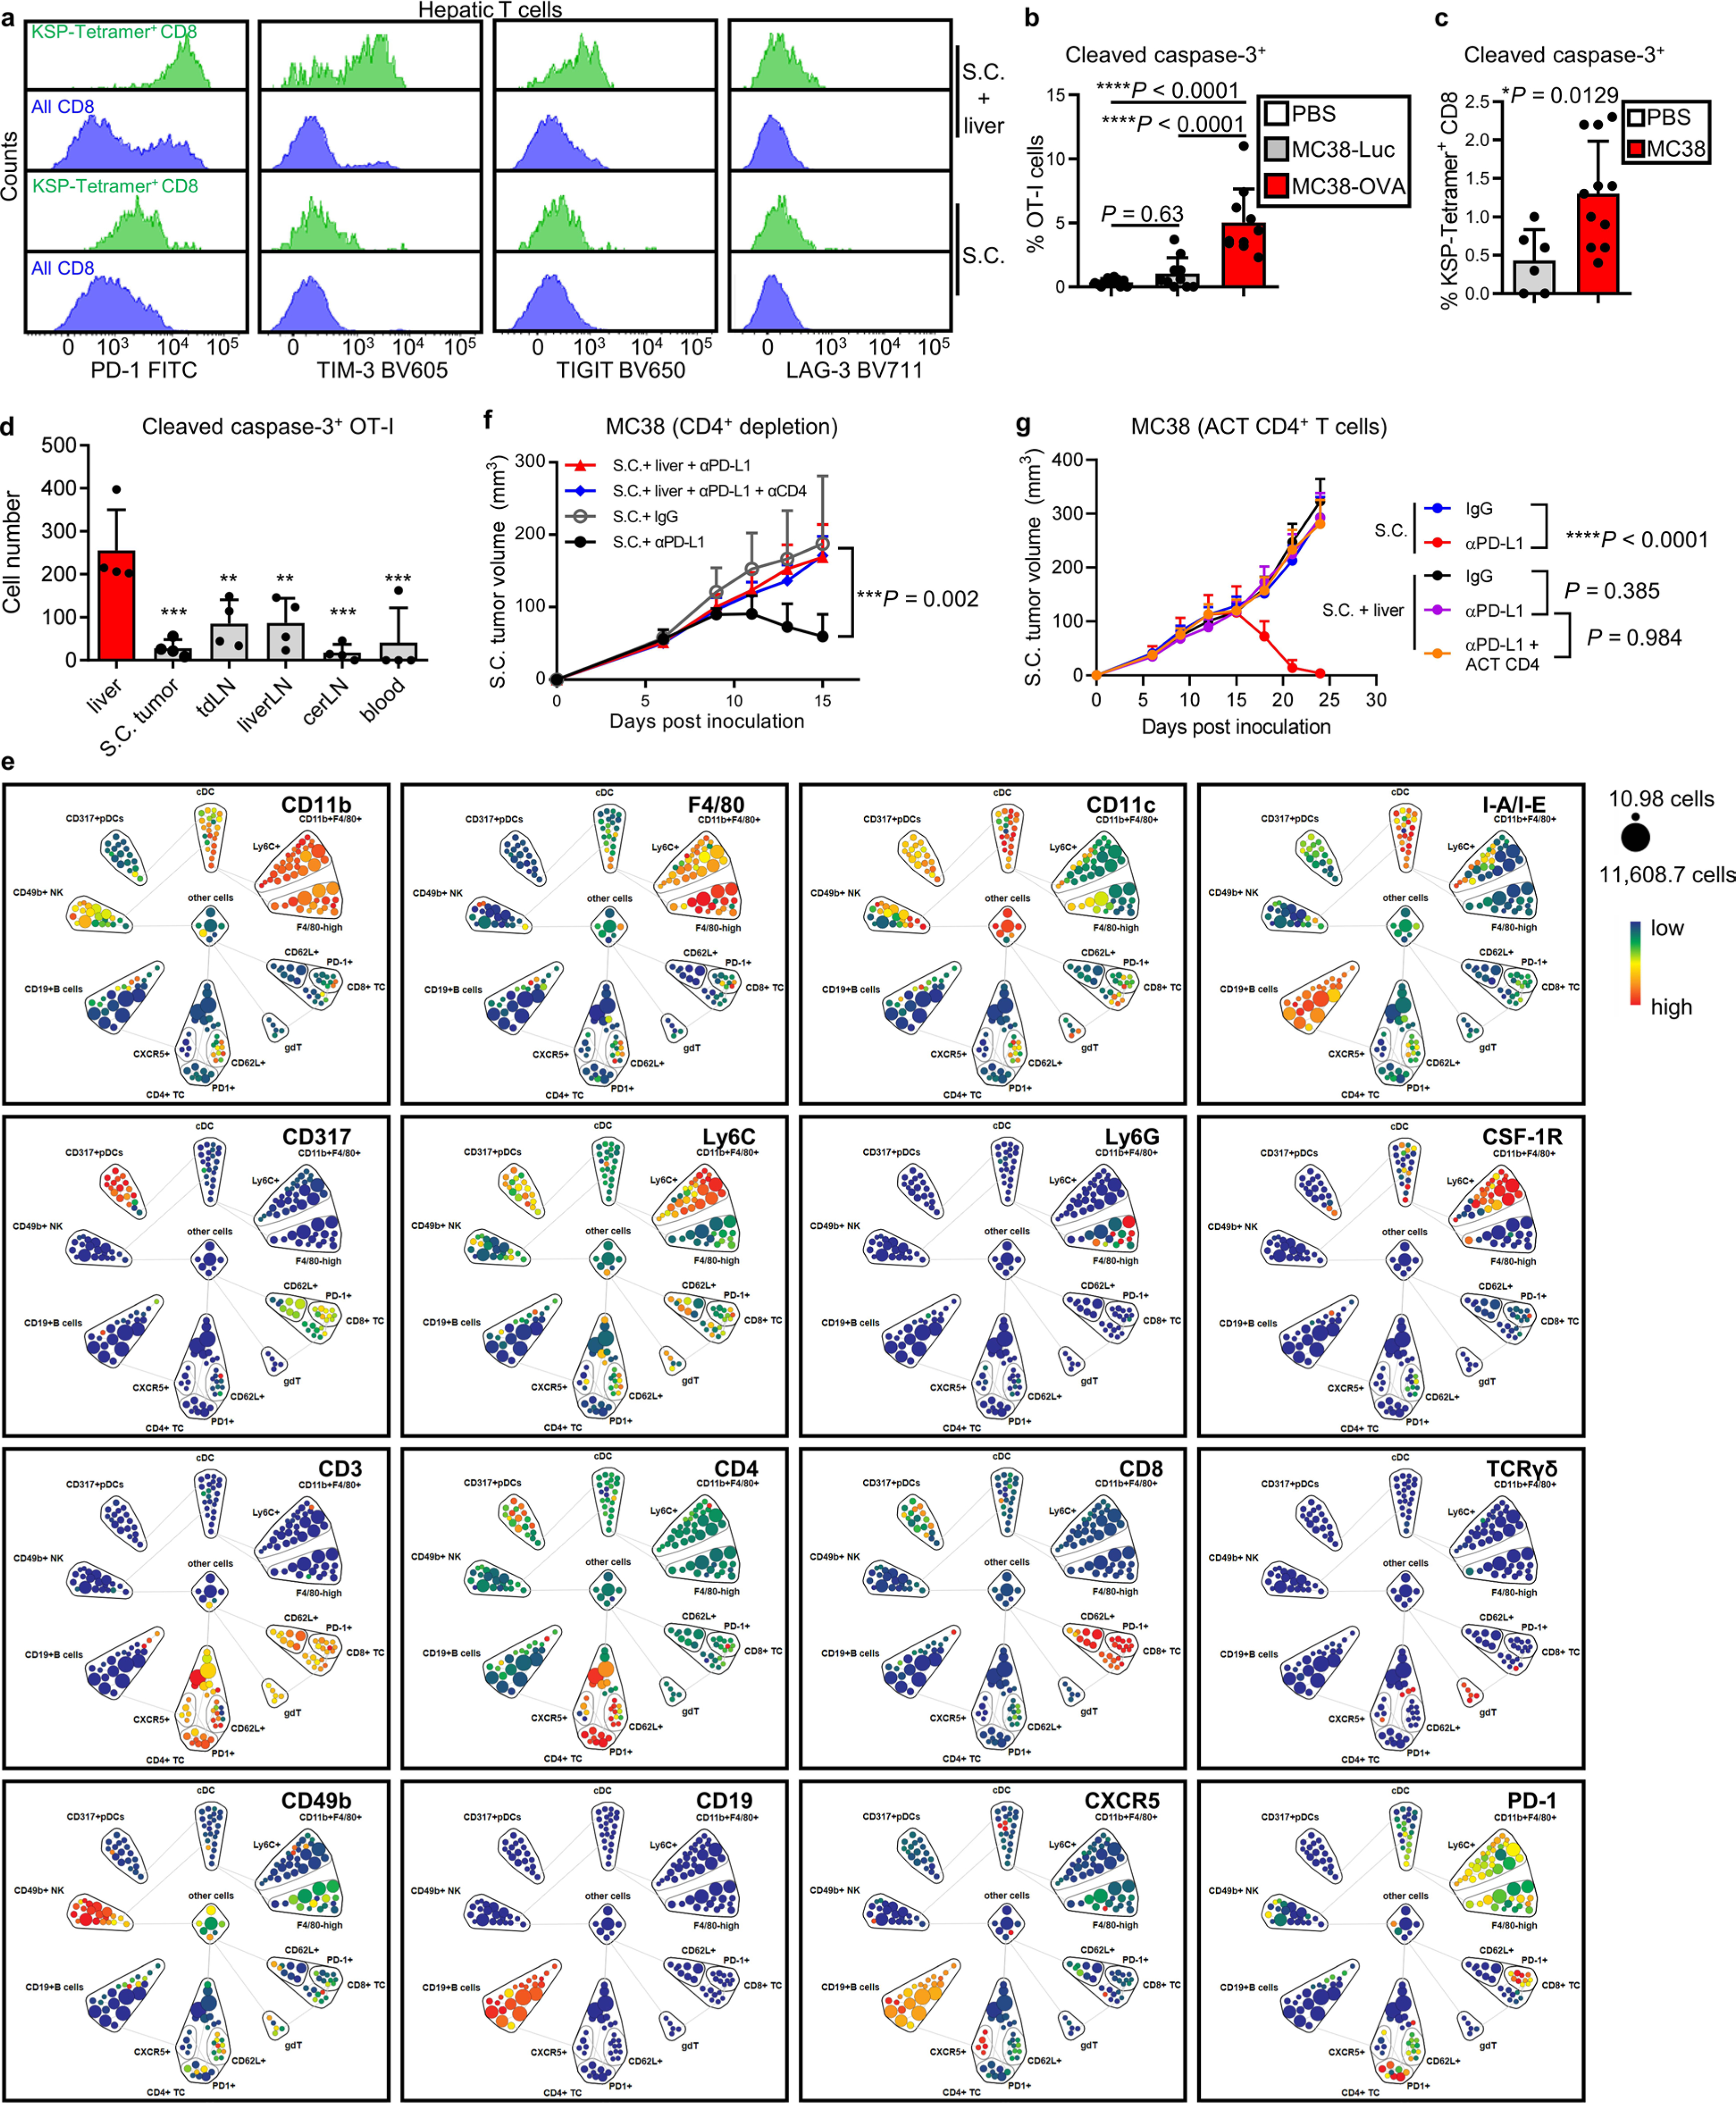
a Flow cytometry histograms showing phenotype of intrahepatic CD45+CD8+KSP-tetramer+ T cell (green) and total CD8 T-cell pool (blue) in mice with subcutaneous MC38 tumours (S.C., bottom) and subcutaneous and liver MC38 tumours (S.C. + liver, top). b Flow cytometry quantification of cleaved caspase-3 of OT-I cells in mice that bearing subcutaneous MC38-OVA tumour and sham (PBS, n = 11), MC38-Luc (n = 10) or MC38-OVA (n = 10) liver tumour. Unactivated CD45.1+CD45.2+OT-I cells were adoptive transferred and analysed 12 days after adoptive transfer. Data from two independent experiments were pooled. One-way AnOVA with Tukey’s correction, mean ± SD. c Frequency of KSP-tetramer+CD8+ cells expressing cleaved caspase-3 in liver of subcutaneous MC38 tumour-bearing mice with (n = 11) and without (n = 6) liver tumours. Unpaired two-tailed Student’s t-test, mean ± SD, data from two independent experiments were pooled. d Cell number of cleaved caspase-3 expressing OT-I cells from indicated location. OT-I cells were activated in vitro and labeled with CFSE, then intravenously transferred. Cells were analysed 4 days after transfer. One-way AnOVA with Dunnett’s multiple comparisons test, P-value: S.C. tumour 0.003, tdLn 0.0045, liverLn 0.0048, cerLn 0.0002, blood 0.0005, mean ± SD, n = 4 per group. e viSnE analysis of indicated marker as detected by CyTOF. Displayed on aggregated samples. Related to Fig. 4c. f Subcutaneous MC38 tumour growth in mice with subcutaneous and liver tumours, treated with anti-PD-L1, anti-CD4, or the combination. Two-way AnOVA with Tukey’s correction, mean ± SD, S.C. +IgG n = 5, S.C. + anti-PD-L1 n = 5, S.C. +liver n = 8, S.C. + anti-PD-L1+ anti-CD4 n = 9. g MC38 subcutaneous tumour growth in mice with subcutaneous and liver tumours, treated with anti-PD-L1, or in combination with hepatic CD4+ adoptive cell transfer (ACT). Two-way AnOVA with Tukey’s correction, mean ± SD, S.C. + IgG n = 9, S.C. + anti-PD-L1 n = 10, S.C. + liver+IgG n = 10, S.C. + liver+anti-PD-L1 n = 8, S.C + liver+CD4 ACT n = 8. Data are representative of at least two independent experiments (a-d).
Extended Data Fig. 5 |. Hepatic myeloid cells induce activated T-cell apoptosis via the Fas/FasL pathway.
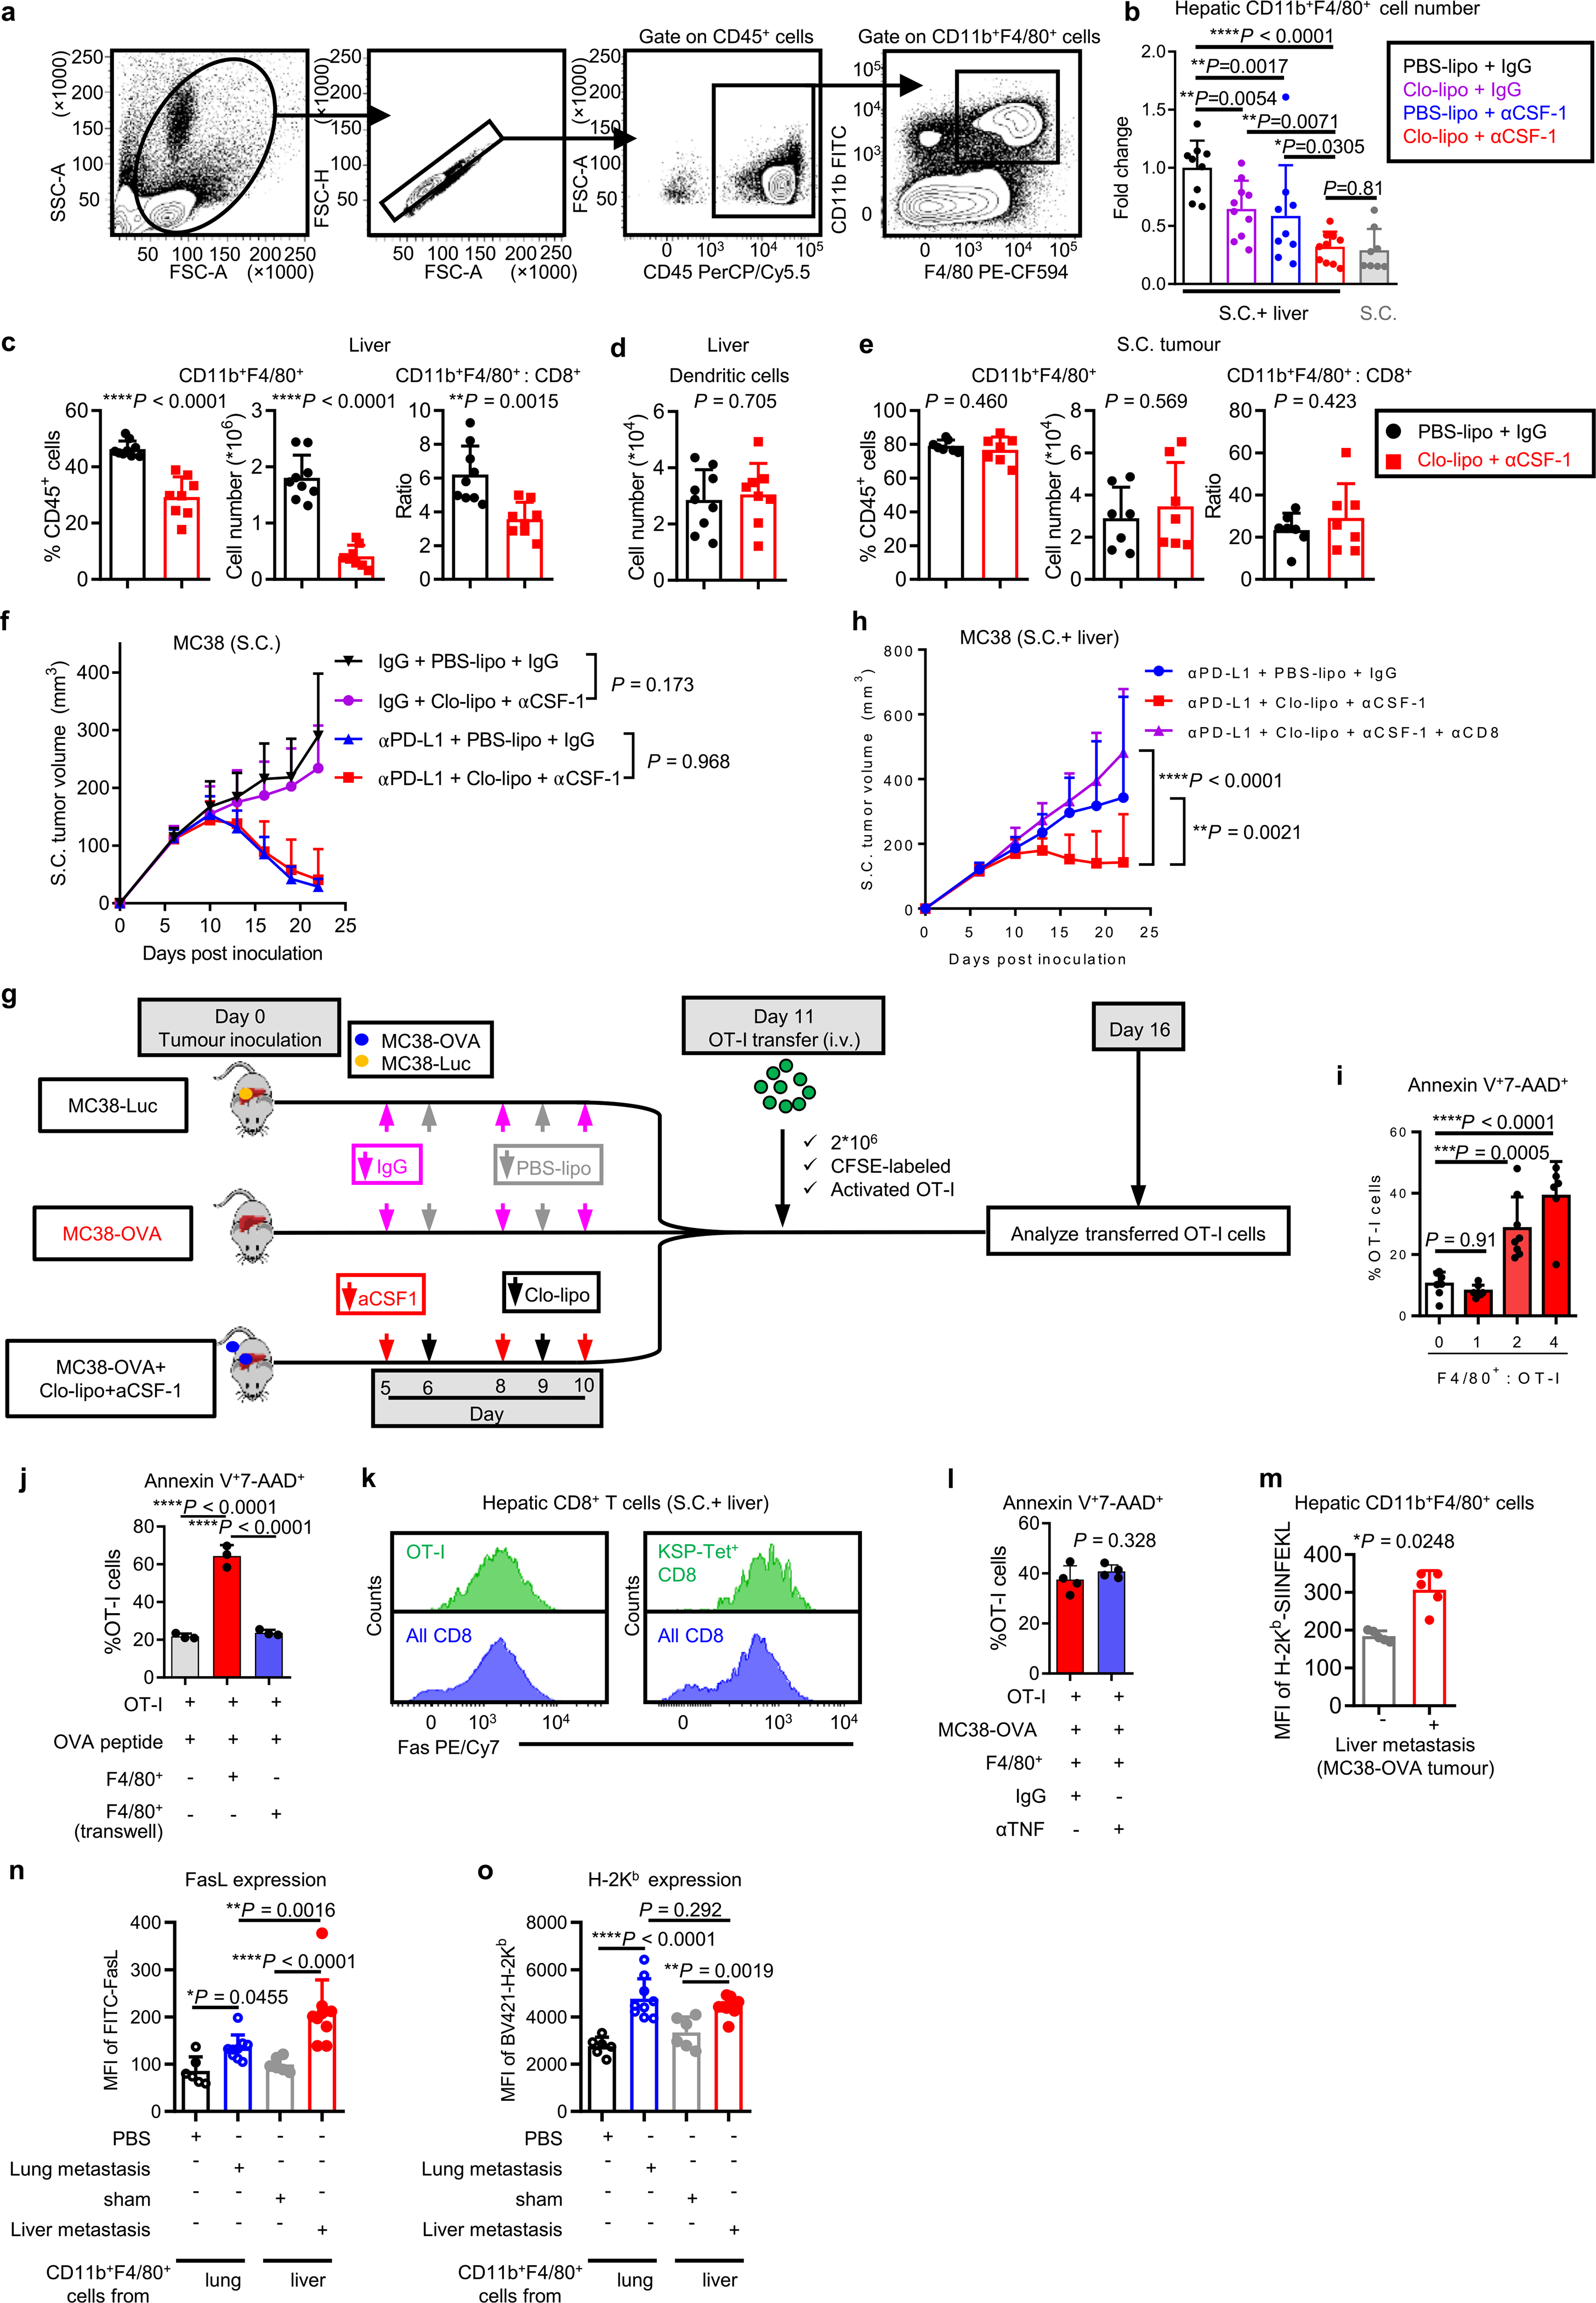
a Gating strategy for hepatic CD11b+F4/80+ cells. b Relative cell number of intrahepatic CD11b+F4/80+ following indicated treatment. Samples were analysed after two doses of anti-CSF-1 and clodronate liposome treatment. Data were normalized to control mice receiving PBS liposomes and IgG. One-way AnOVA, mean ± SD, PBS-lipo+IgG n = 9, Clo-lipo+IgG n = 10, PBS-lipo+anti-CSF-1 n = 9, Clo-lipo+anti-CSF-1 n = 11, S.C. n = 8. c Frequency of CD11b+F4/80+ cells (left), absolute number of CD11b+F4/80+ cells (middle) and ratio of CD11b+F4/80+cells to CD8+ T cells (right) in the liver from mice bearing both MC38 subcutaneous tumour and liver tumour. Samples were collected after two doses of anti-CSF-1 and clodronate liposome treatment. Unpaired two-tailed Student’s t-test, mean ± SD, PBS-lipo+IgG n = 9, Clo-lipo+anti-CSF-1 n = 8. d Absolute number of intrahepatic dendritic cells following two doses of anti-CSF-1 and clodronate liposome treatment. Dendritic cells were gated as CD45+F4/80+CD11c+MHCII+ cells. Unpaired two-tailed Student’s t-test, mean ± SD, PBS-lipo+IgG n = 9, Clo-lipo+anti-CSF-1 n = 8. e Frequency of CD11b+F4/80+ cells (left), absolute number of CD11b+F4/80+ cells (middle) and ratio of CD11b+F4/80+ cells to CD8+ T cells (right) in the subcutaneous tumour from mice bearing both MC38 subcutaneous tumour and liver tumour. Samples were collected after two doses of anti-CSF-1 and clodronate liposome treatment. Unpaired two-tailed Student’s t-test, mean ± SD, n = 7 per group. f MC38 subcutaneous tumour growth in mice with only S.C. tumours treated with anti-PD-L1, clodronate liposome and anti-CSF-1, or the combination. Two-way AnOVA with Tukey’s correction, mean ± SD, n = 8 per group. g Schematic for clodronate liposome, anti-CSF-1, and OT-I adoptive transfer. h MC38 subcutaneous tumour growth in mice with S.C. and liver tumours treated with anti-PD-L1, clodronate liposome, anti-CSF-1, anti-CD8, or the combination. Two-way AnOVA with Tukey’s correction, mean ± SD, n = 6 per group. i Frequency of annexin V+7-AAD+ OT-I cells co-cultured in the presence of OVA peptide with hepatic F4/80+ cells isolated from liver tumour bearing mice at indicated ratios for 48 hours; Activated OT-I cells were labeled with CFSE before co-culture. One-way AnOVA with Dunnett’s multiple comparisons test, mean ± SD, n = 7 biologically independent samples. j Frequency of annexin V+7-AAD+ OT-I cells (CFSE labeled) after co-cultured in the presence of OVA peptide with hepatic F4/80+ cells in indicated conditions for 48 hours. One-way AnOVA with Tukey’s correction, mean ± SD, n = 3 biologically independent samples. k Flow cytometry histogram of Fas expression on hepatic OT-I (left) and KSP-tetramer+CD8+ T cells (right). Unactivated OT-I cells were transferred into mice bearing MC38-OVA subcutaneous tumour and liver tumour. Phenotype of transferred OT-I cells and endogenous KSP-tetramer+CD8+ T cells were analysed 12 days after adoptive transfer. l Frequency of annexin V+7-AAD+ OT-I cells co-cultured with MC38-OVA tumour cells and hepatic F4/80+ cells isolated from liver tumour bearing mice with and without TnFα blockade. Activated OT-I cells were labeled with CFSE before co-culture. Unpaired two-tailed Student’s t-test, mean ± SD, n = 4 biologically independent samples. m Quantification of H-2Kb-OVA mean fluorescent intensity (MFI) on hepatic CD11b+F4/80+ cells recovered from mice bearing subcutaneous MC38-OVA tumour with or without liver MC38-OVA tumour. Unpaired two-tailed Student’s t-test, mean ± SD, n = 5 per group. n, o Quantification of FasL (n) and H-2Kb (o) MFI on lung CD11b+F4/80+ cells recovered from mice bearing subcutaneous MC38 tumour with (n = 9) or without (n = 6) lung MC38 tumour, in comparison with hepatic CD11b+F4/80+ cells recovered from mice bearing subcutaneous MC38 tumour with (n = 9) or without (n = 6) liver MC38 tumour. Tissues were collected 10 days after tumour inoculation. One-way AnOVA, mean ± SD. Data are representative of at least two independent experiments (b-o).
Extended Data Fig. 6 |. Liver metastasis alters the liver immune microenvironment.
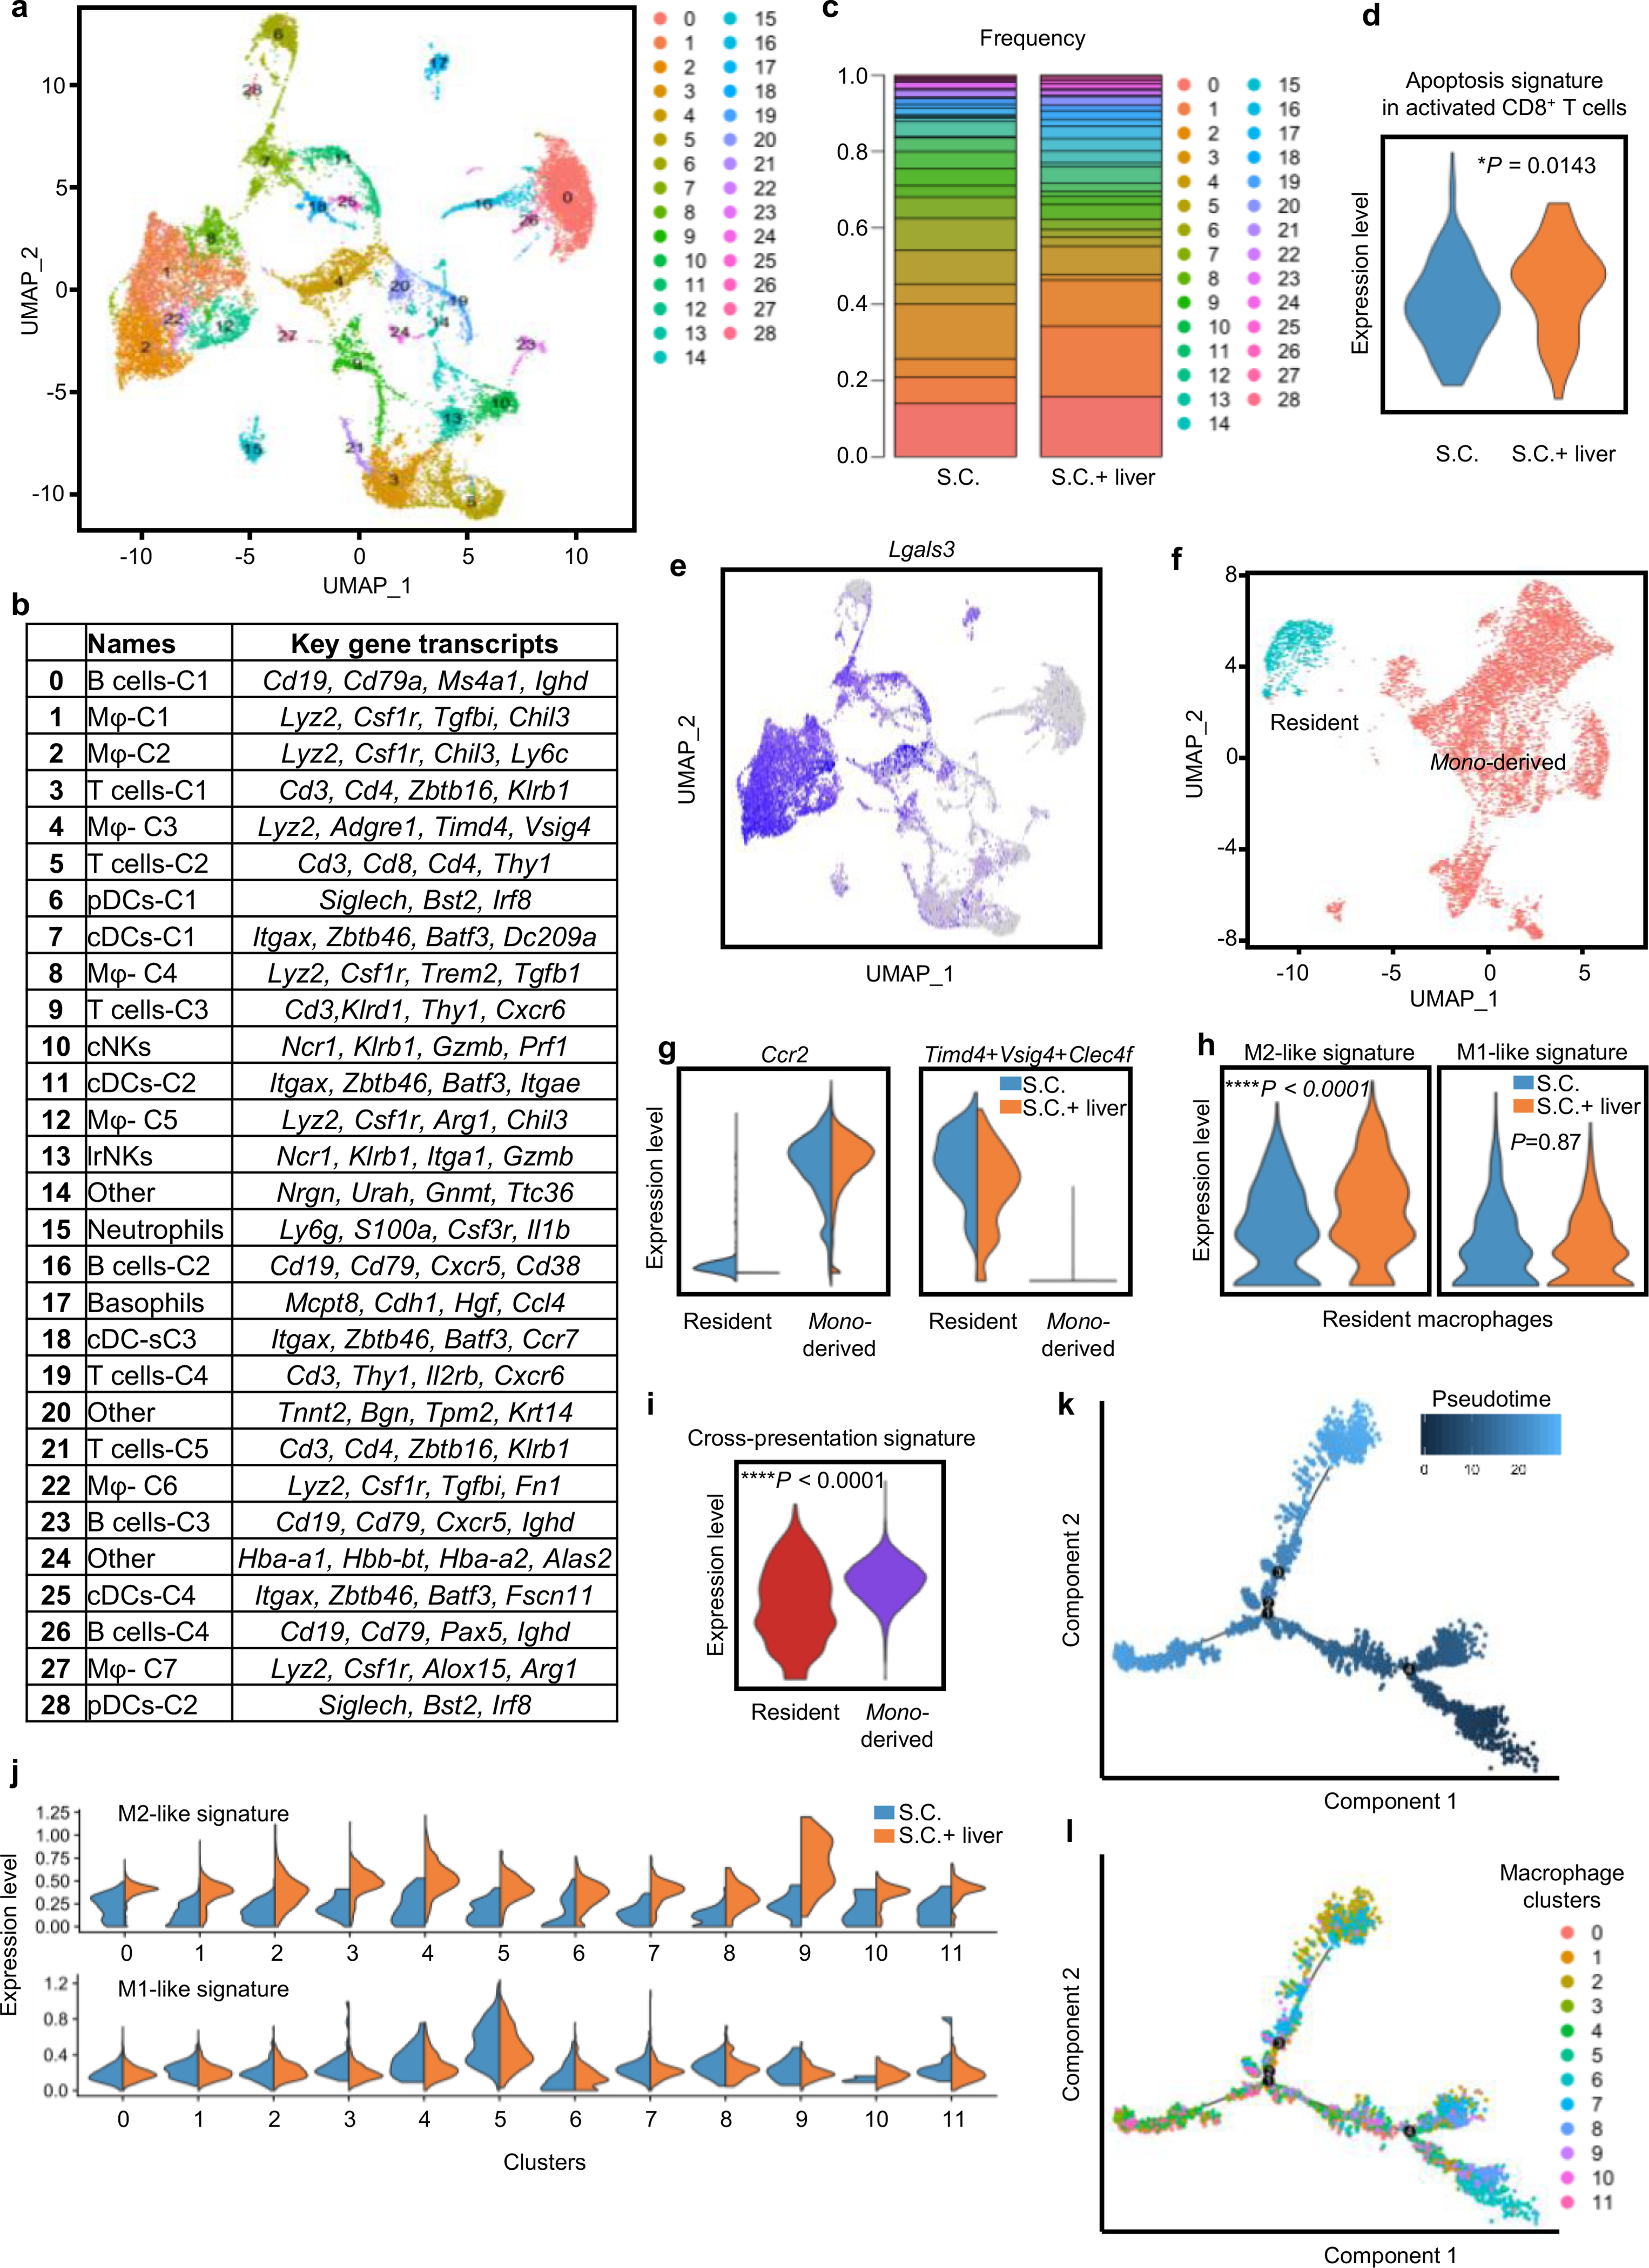
a UMAP plot of all hepatic immune cell clusters on all samples merged. b Table identifying immune cell clusters and listing key genes. c Frequency of all immune cell clusters in mice with a subcutaneous tumour (S.C.) and mice with subcutaneous and liver tumours (S.C. + liver). d Apoptosis gene set enrichment analysis of in activated T-cell clusters in mice with a subcutaneous tumour and mice with subcutaneous and liver tumours. Activated T cells were identified by expression of Cd44. Unpaired two-tailed Student’s t-test, min to max, S.C. n = 157 cells, S.C. + liver n = 38 cells. e UMAP plot of Lgal3 on all samples merged. f UMAP plot of residential and migratory macrophages on all samples merged. g Violin plot of residential and migratory macrophage gene signatures in mice with a subcutaneous tumour and mice with subcutaneous and liver tumours. Unpaired two-tailed Student’s t-test, min to max. h Violin plot of residential macrophage M2-like and M1-like gene set enrichment in mice with a subcutaneous tumour and mice with subcutaneous and liver tumours. Unpaired two-tailed Student’s t-test, nS, not significant, min to max. S.C. n = 543 cells, S.C. + liver n = 936 cells. i Violin plot of cross-presentation gene set enrichment in resident (n = 1479 cells) and mono-derived (n = 6698 cells) macrophages. Unpaired two-tailed Student’s t-test, min to max. j Violin plot of M2-like and M1-like signatures within monocyte-derived macrophage cell subsets in mice with a subcutaneous tumour and mice with subcutaneous and liver tumours. Unpaired two-tailed Student’s t-test, min to max. k Pseudotime analysis overlying time with monocyte-derived macrophage cell states. l Pseudotime analysis overlaying monocyte-derived macrophage clusters and states.
Extended Data Fig. 7 |. Extended CyTOF data analysis of liver immune cells after radiotherapy and immunotherapy.
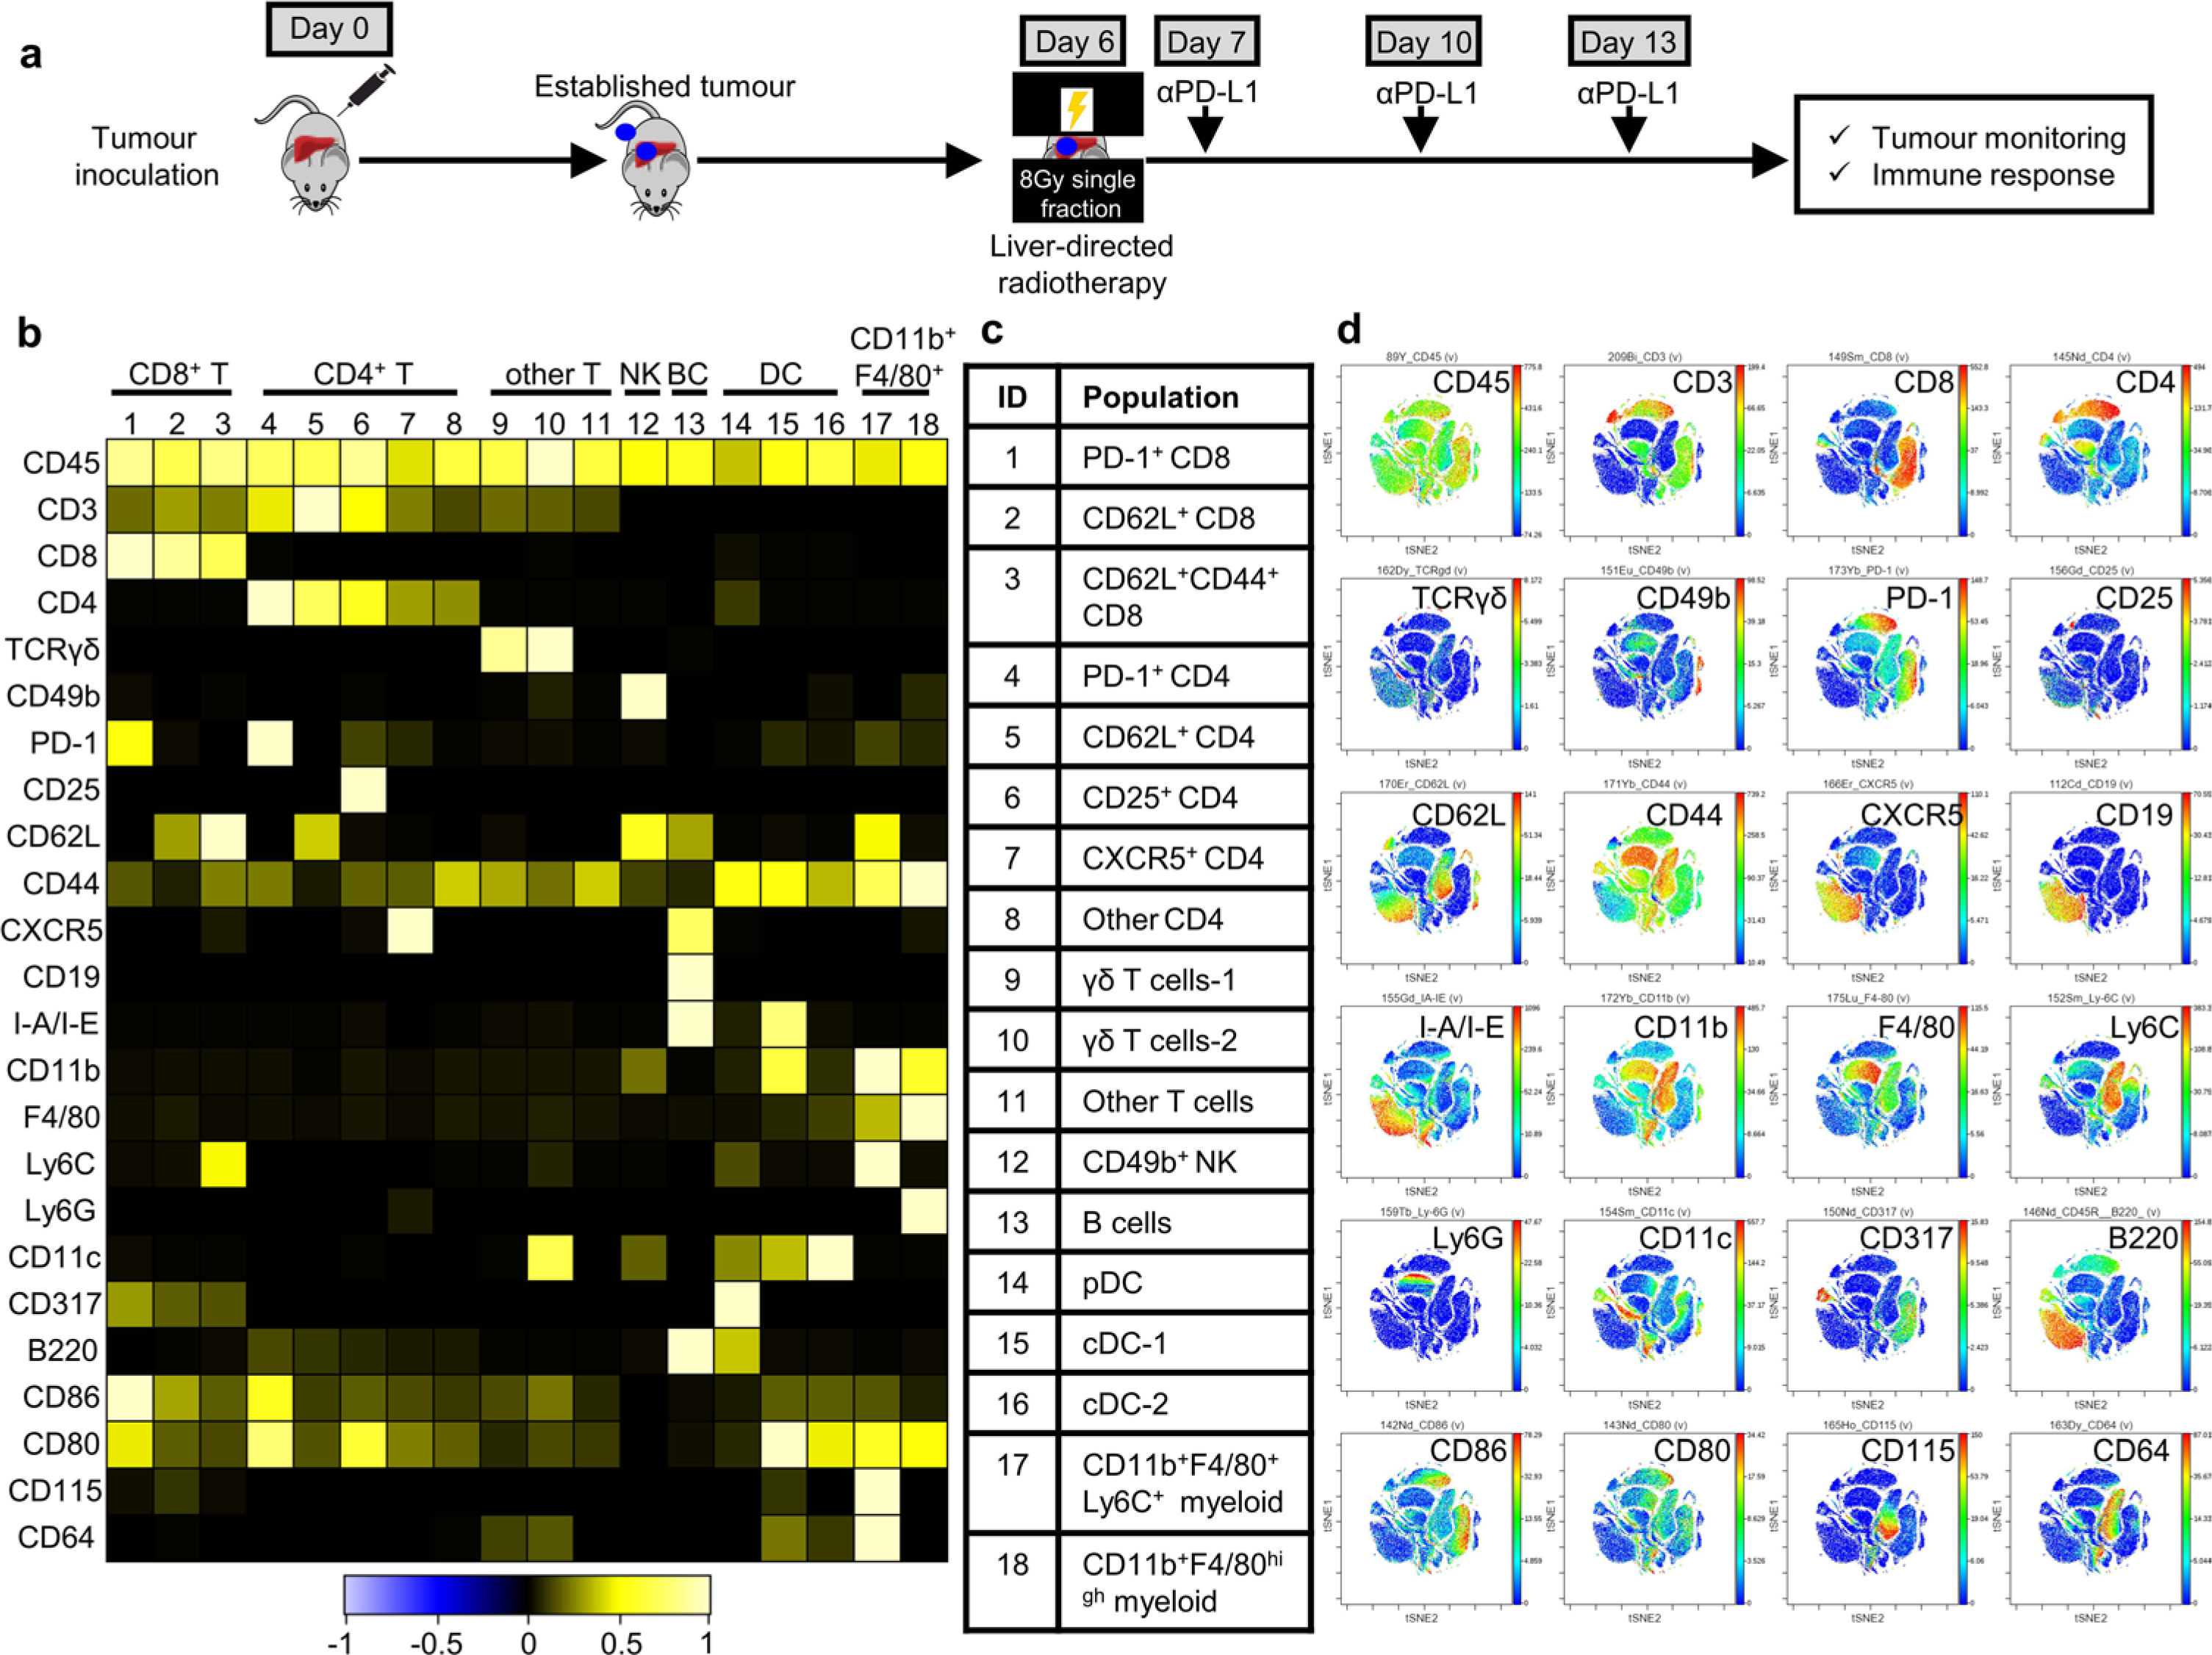
a Schematic describing combination treatment with liver directed radiotherapy followed by anti-PD-L1. b-d Immune clusters identified by mass cytometry in Fig. 6a. b, Heatmap showing frequency of antibody labeling (rows) in the 18 immune populations (columns) derived from a combined analysis of all samples. c, Immune cell subset identified by mass cytometry. d, viSnE representation of key marker expression across subpopulations, displayed on aggregated samples.
Extended Data Fig. 8 |. Radiotherapy reshapes the liver immune microenvironment.
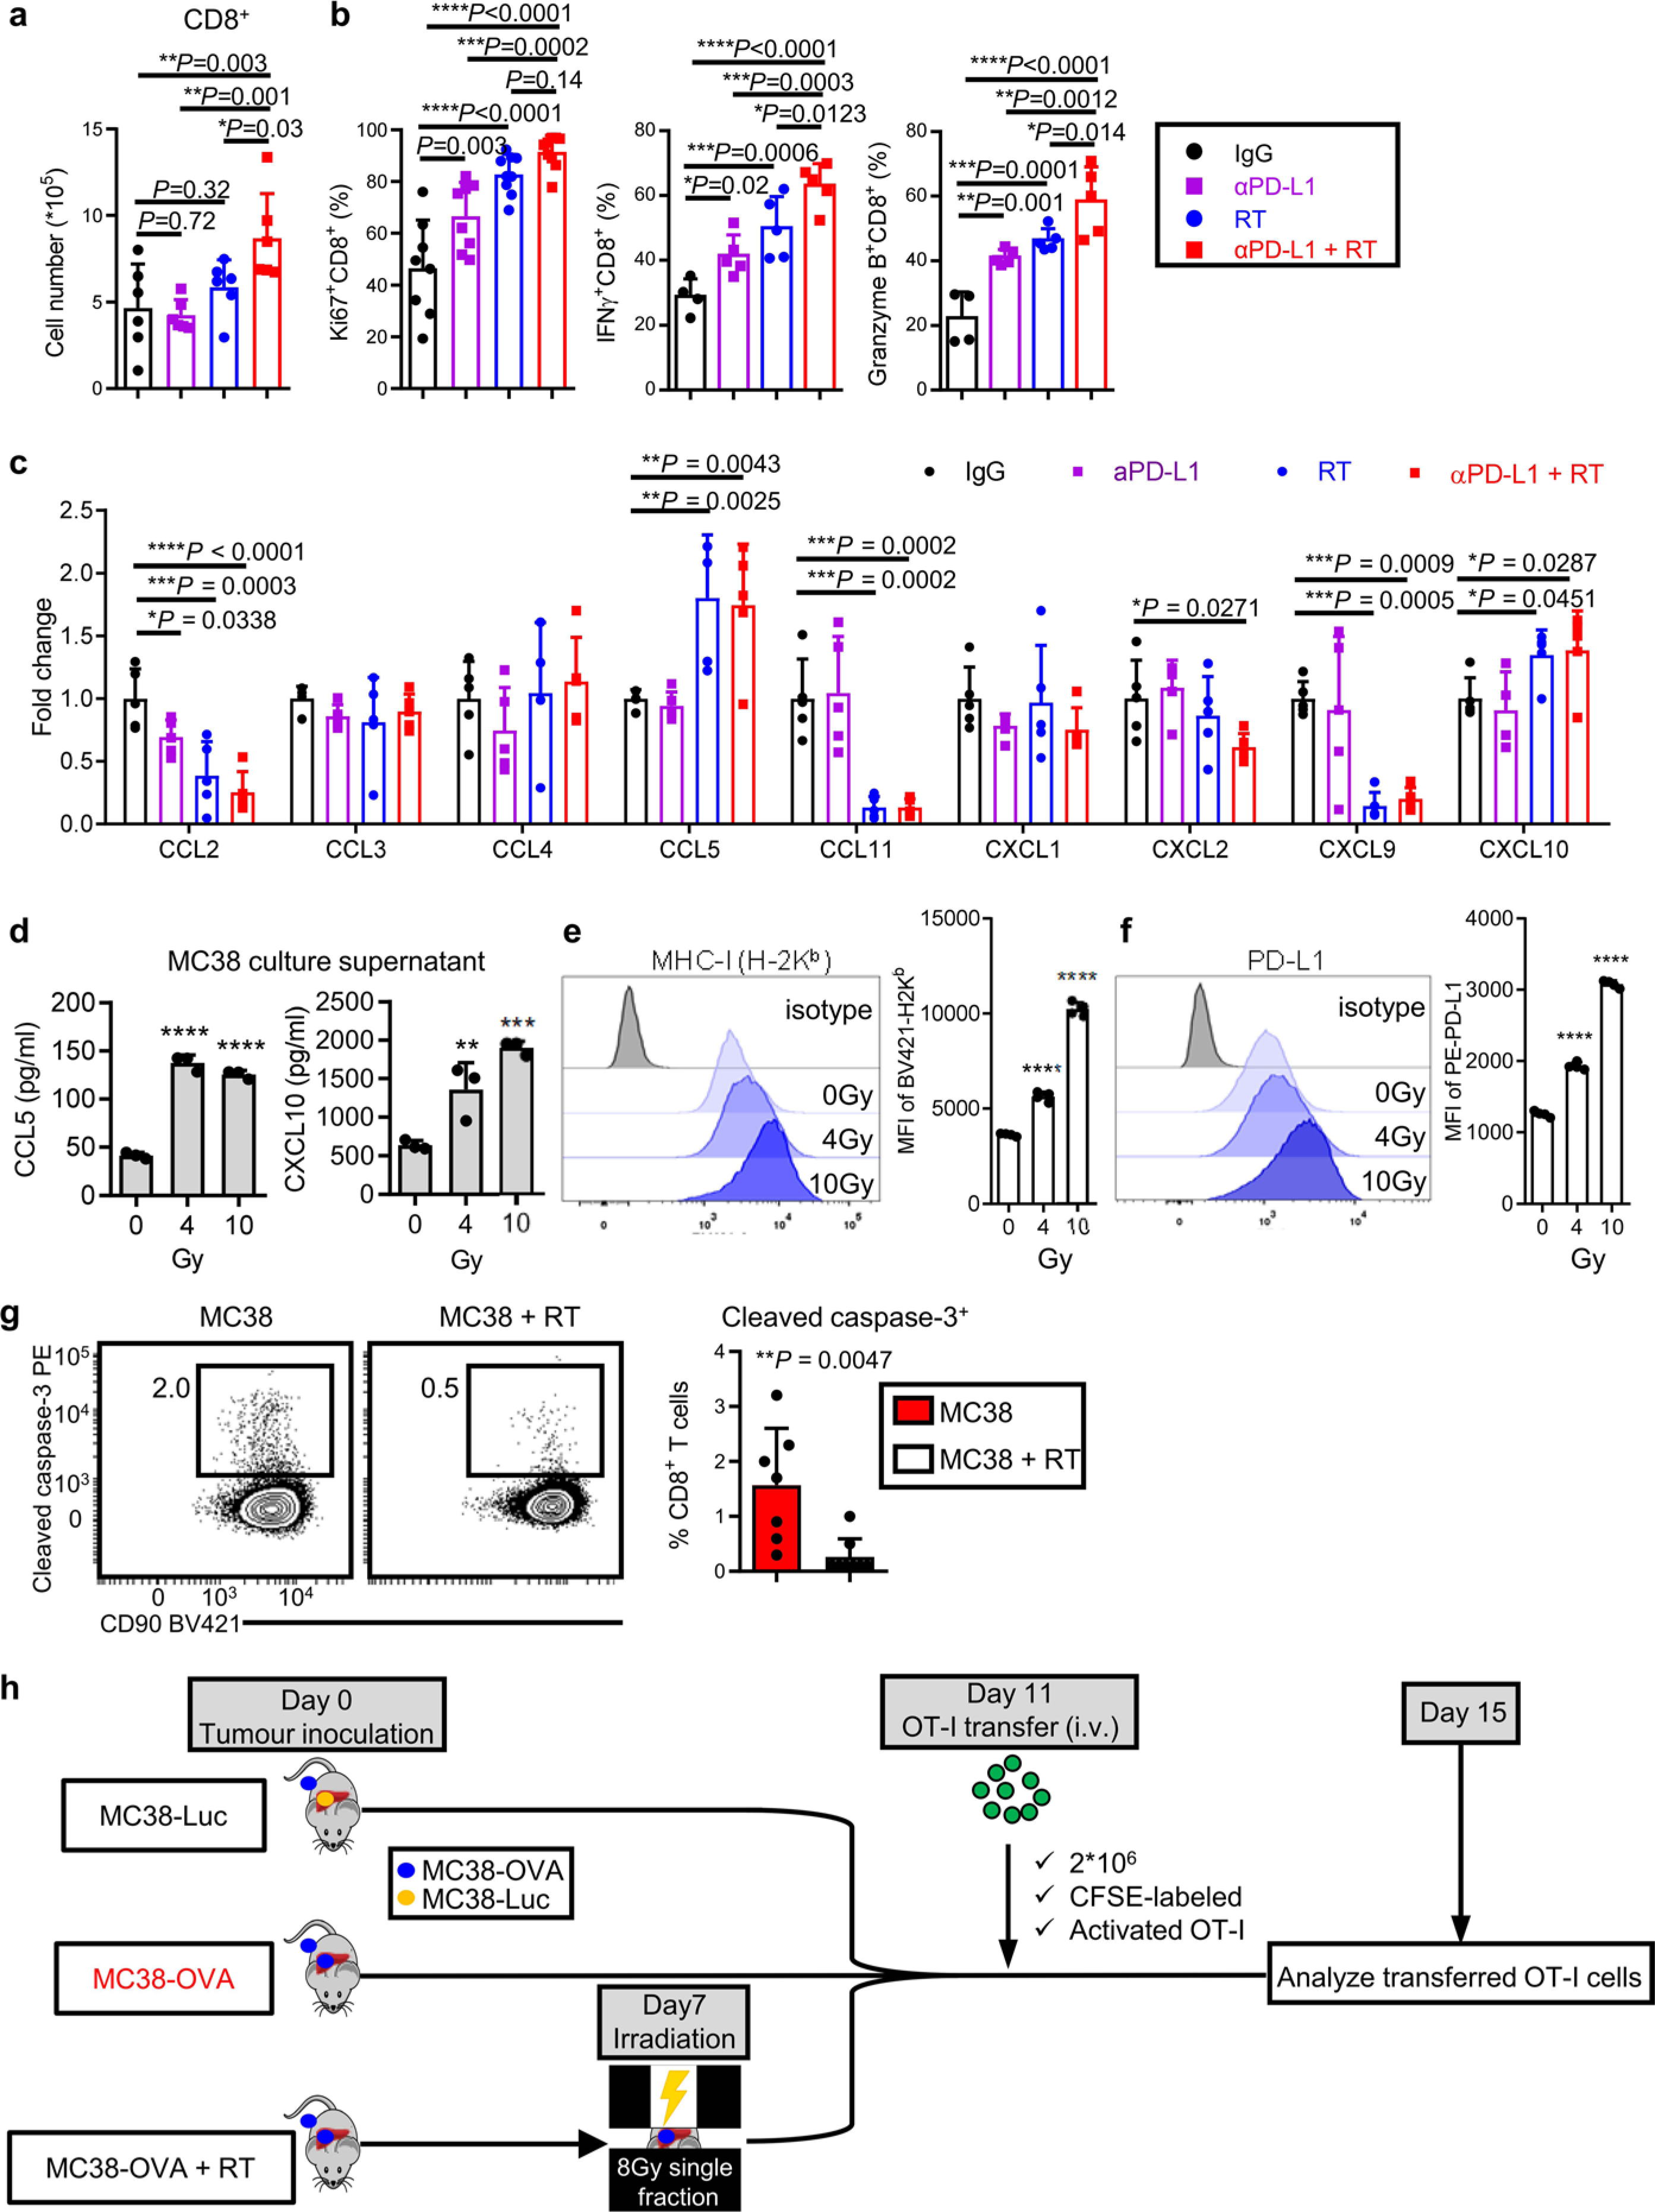
a, b Flow cytometry quantification of CD8+ T-cell number (a), Ki67+, IFnγ+ and granzyme B+ CD8+ T cells (b) in the livers from mice bearing both subcutaneous tumour and liver tumour with indicated treatments. Analysed 5 days after RT. One-way AnOVA, mean ± SD, n = 6 per group. c Hepatic tissue chemokine levels in subcutaneous and liver tumour bearing mice treated in indicated fashion. Analysed 5 days after RT by Luminex; One-way AnOVA, mean ± SD, n = 5 per group. d-f ELISA analysis of culture supernatant (d, n = 3 biologically independent samples) and phenotypic analysis (e, f, n = 4 biologically independent samples) of MC38 cells 48 hours after irradiation. One-way AnOVA, **P = 0.006, ***P = 0.0003, ****P < 0.0001, mean ± SD. g Flow cytometry plot and quantification of cleaved caspase-3 in total hepatic CD8+ T cells from mice bearing both subcutaneous tumour and liver tumour, with (n = 8) or without (n = 7) liver-directed radiotherapy (RT). Unpaired two-tailed Student’s t-test, mean ± SD. h Schematic describing liver-directed radiotherapy and adoptive cell transfer. Data are representative of at least two independent experiments (a-g).
Extended Data Fig. 9 |. Radiotherapy abolishes immunotherapy resistance induced by liver metastasis.
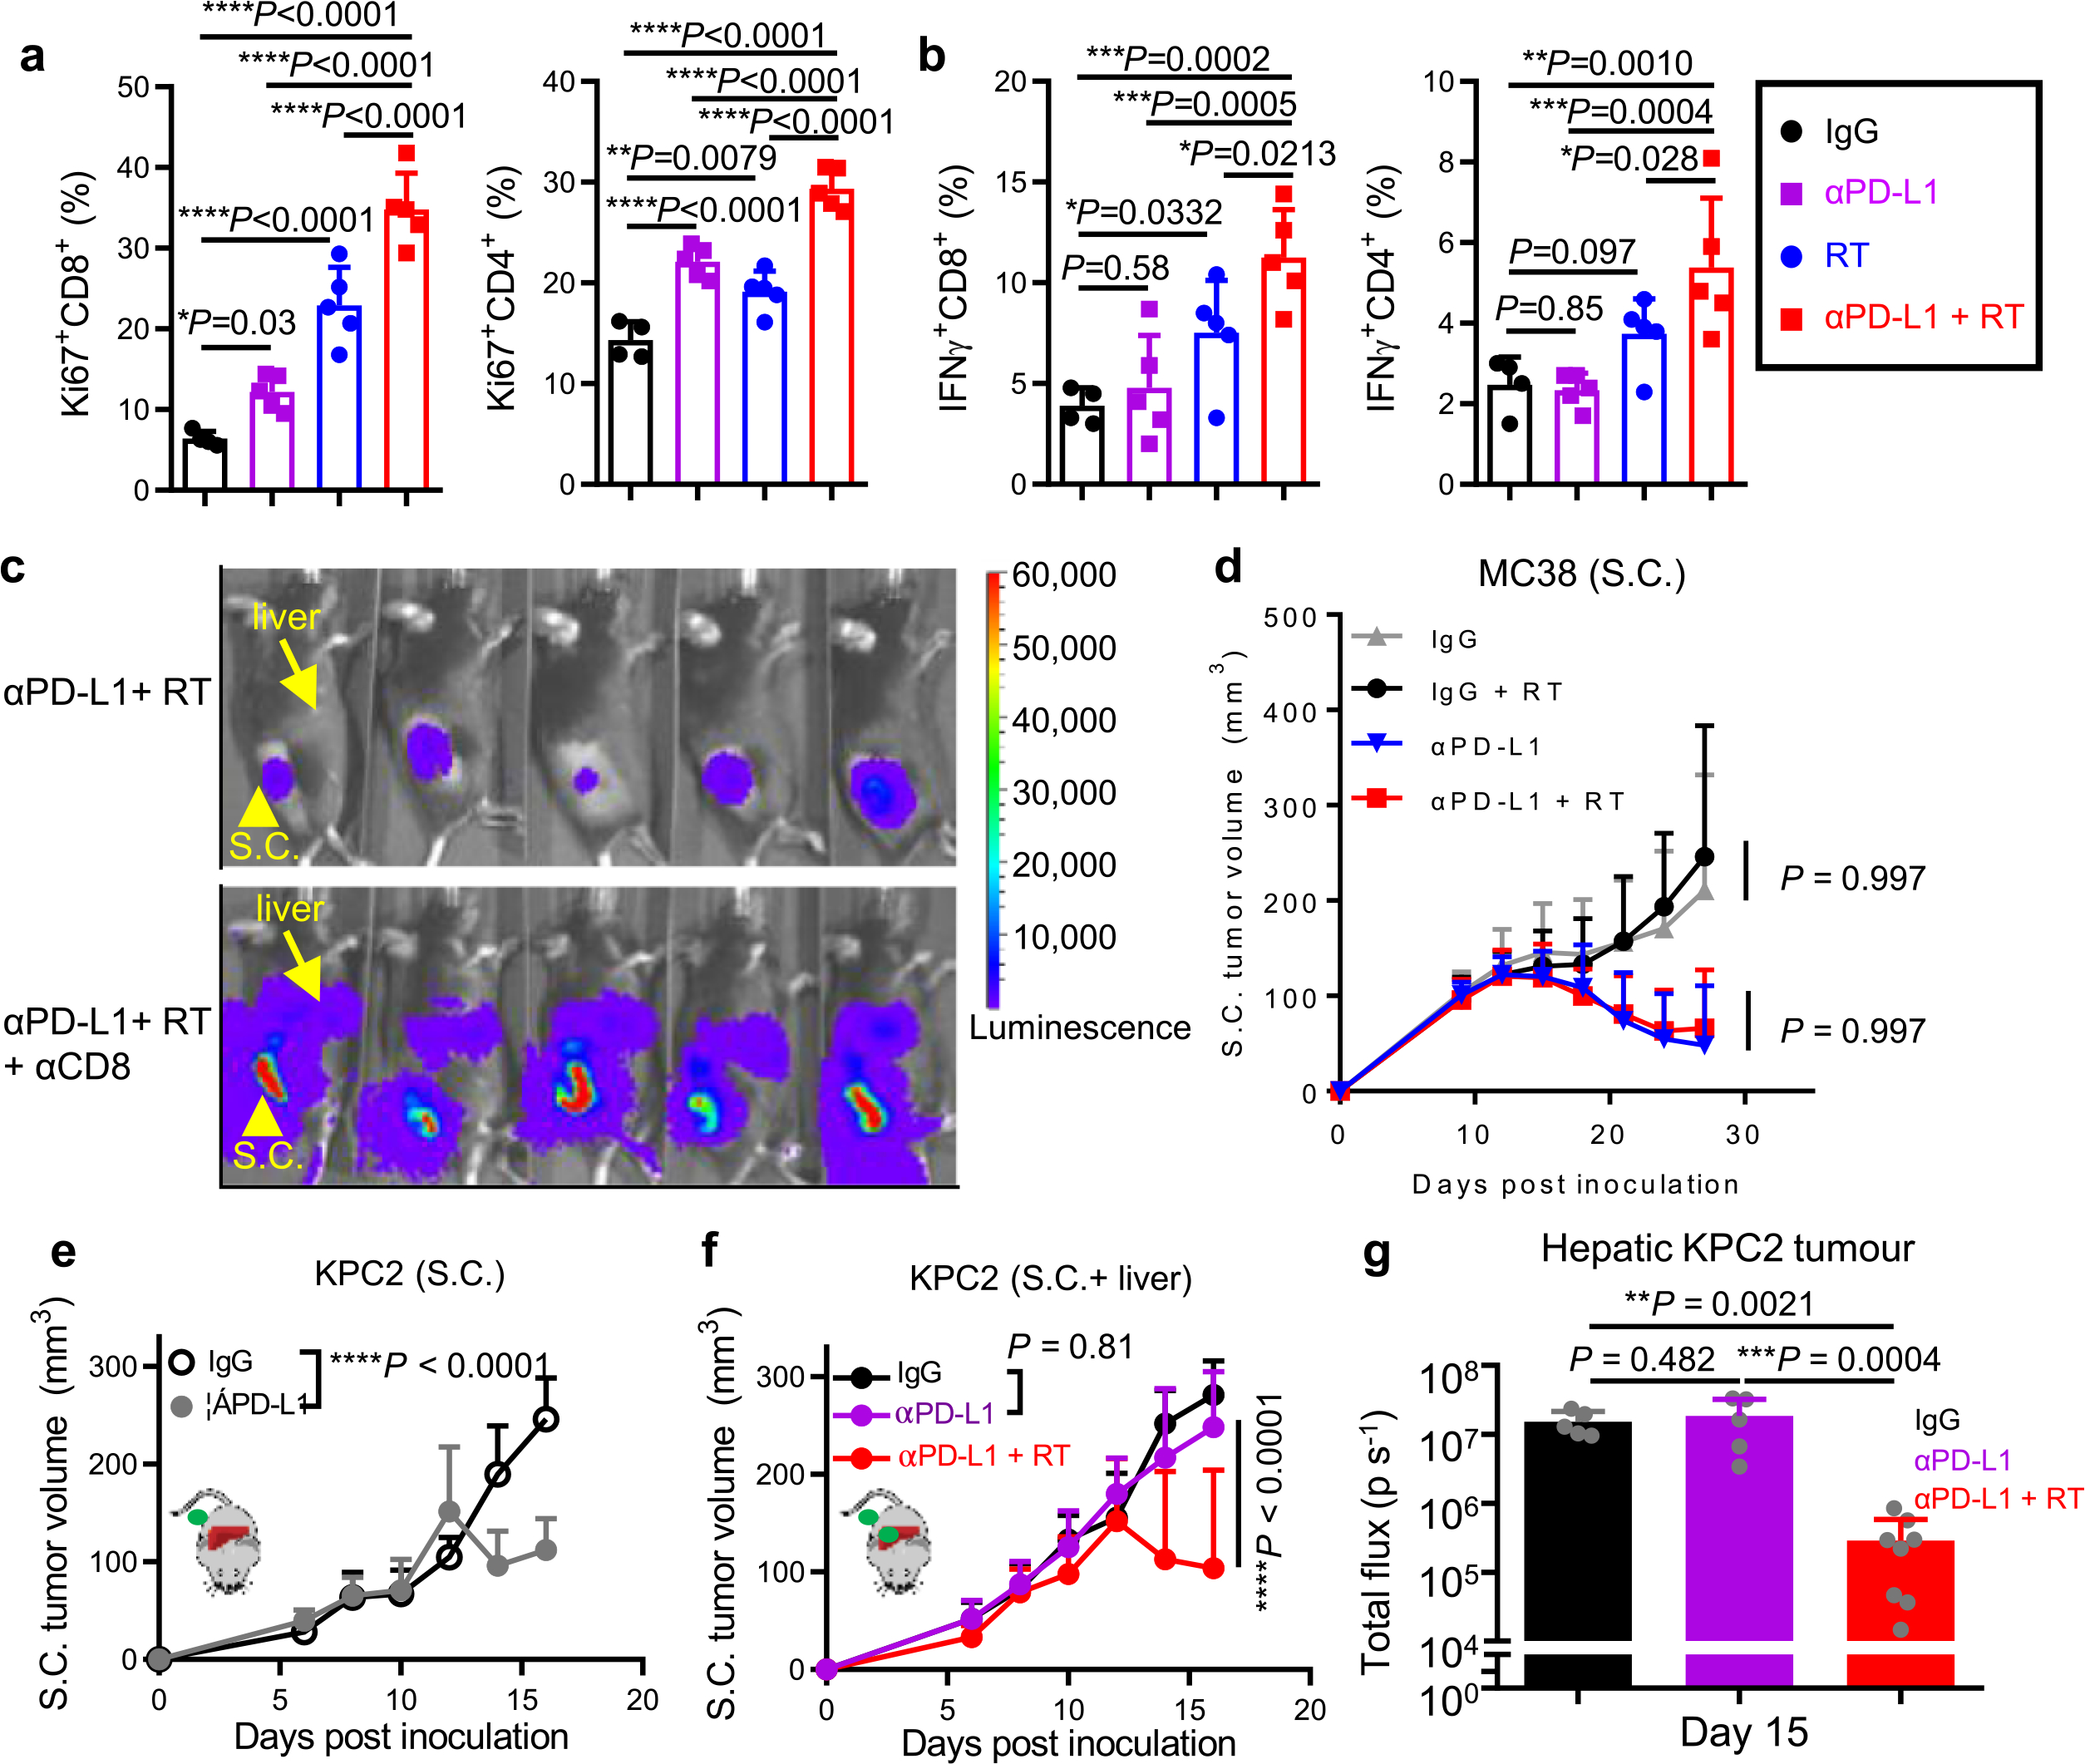
a, b Flow cytometry quantification of subcutaneous tumour dLn Ki67+ (a) and IFnγ+ (b) in CD8+ and CD4+ T cells in mice with subcutaneous and liver metastasis treated as indicated; analysed 7 days after radiotherapy. One-way AnOVA, mean ± SD, IgG n = 4, others n = 5. c Representative bioluminescent imaging of subcutaneous and liver tumour bearing mice following treatment with anti-PD-L1, radiotherapy, and anti-CD8. d Subcutaneous tumour volume of mice bearing only subcutaneous MC38 tumours treated with radiation to the liver, anti-PD-L1, or the combination. Two-way AnOVA with Tukey’s correction, mean ± SD, n = 7 per group. e Subcutaneous tumour volume of mice bearing subcutaneous KPC2 tumours treated with anti-PD-L1. Two-way AnOVA, mean ± SD, n = 10 per group. f KPC2 subcutaneous tumour growth in mice with (S.C. +liver) or without (S.C.) liver tumours treated with anti-PD-L1, or in combination with liver directed radiotherapy. f, Two-way AnOVA, mean ± SD with Tukey’s correction, n = 10 per group. g KPC2 liver tumour growth in mice with subcutaneous and liver tumours treated as in (f). One-way AnOVA, mean ± SD, n = 5 for IgG and anti-PD-L1 group, n = 7 for anti-PD-L1+RT group. Data are representative of at least two independent experiments (a-g).
Extended Data Fig. 10 |. Impact of liver metastasis on cancer-immunity cycle.
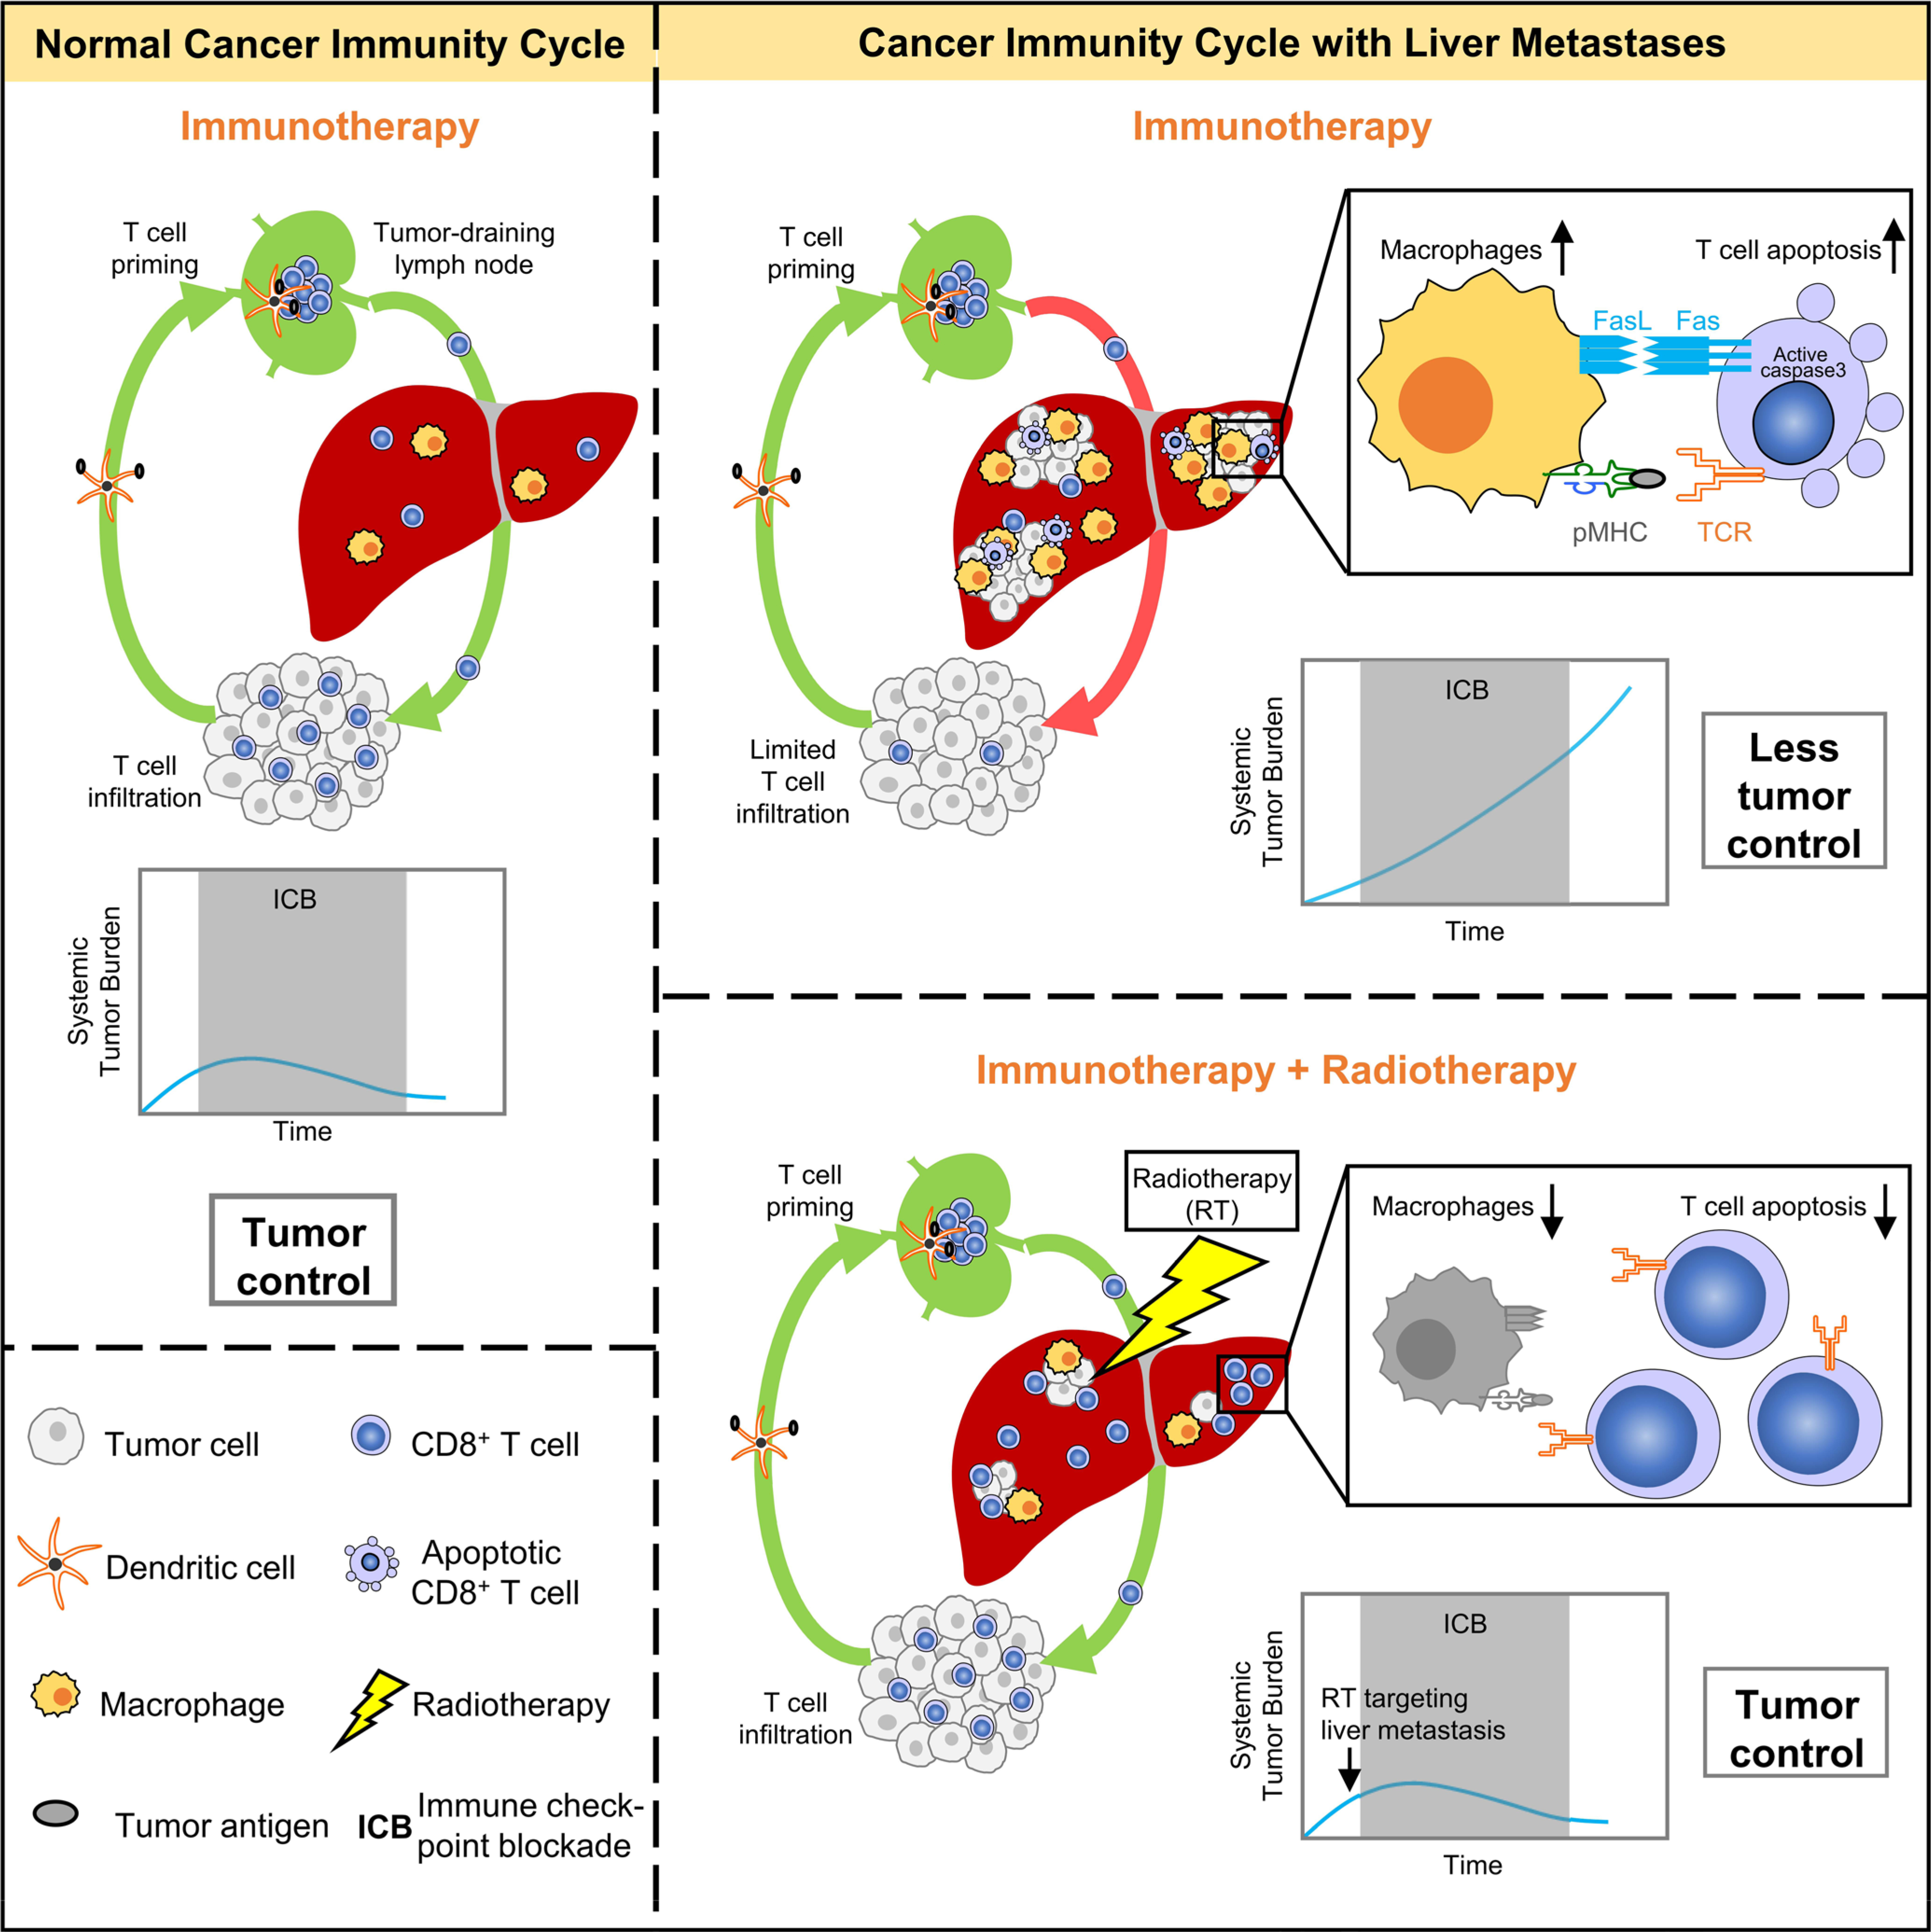
The graphical abstract describes how liver metastases alter the normal cancer immunity cycle by inducing hepatic siphoning of T cells, and further how liver-directed radiotherapy can disrupt hepatic siphoning to promote effective anti-tumoral immunity.
Supplementary Material
Acknowledgements
This work was supported in part by research grants from the NIH/NCI grants for WZ (CA248430, CA123088, CA099985, CA193136, and CA152470); AC (1UM1HG006508); TSL (U01CA216449); IEN (CA233487); FW (S10OD020053); MAM (CA240515) and the NIH through the University of Michigan Rogel Cancer Center Support Grant (P30CA46592). We would like to thank all members of the Zou and Green laboratories for their insightful feedback, as well as L. Fecher. We also acknowledge the support of the University of Michigan Experimental Irradiation Shared Resource, the Immune Monitoring Core, the Vector Core, the University of Michigan Center for Molecular Imaging, the In Vivo Animal Core and the Advanced Genomics Core.
Footnotes
Competing interests
J.Y., M.D.G., S.L., Y.S., S.N.J., J.E.C., S.M.R., J.J.W., X.L., Z.C., J.Z., Y.B., L.J., A.T., J.S., R.K.A., M.S., B.S.R., F.S., S.P.N., X.C., S.W., W.S., L.V., C.M., M.A.M., C.A.S., K.C., I.K., V.T.M., T.S.L., N.R., F.W., A.M.C. and M.C. report no conflicts. A.Q. has research funding from Merck and Clovis. I.E.N. serves as a consultant for Endectra. A.A. serves as a consultant for Merck, AstraZeneca, Bristol-Myers Squibb and Pfizer/EMD Serono. A.A. receives research funding through the University of Michigan from Merck, Genentech, Prometheus Laboratories, Mirati Therapeutics, Roche, Bayer, Progenics, Astellas Pharma, Arcus Biosciences, AstraZeneca, Bristol-Myers Squibb and Clovis Oncology. C.D.L. serves as a consultant for Immunocore. C.D.L receives travel, accommodations and expenses from Bristol-Myers Squibb and Immunocore. C.D.L. receives research funding from Bristol-Myers Squibb, Merck, Novartis and Dynavax. W.Z. has served as a scientific advisor for Cstone, Oncopia and Hengenix.
Extended data is available for this paper at https://doi.org/10.1038/s41591-020-1131-x.
Supplementary information is available for this paper at https://doi.org/10.1038/s41591-020-1131-x.
Peer review information Saheli Sadanand was the primary editor on this article and managed its editorial process and peer review in collaboration with the rest of the editorial team.
Reprints and permissions information is available at www.nature.com/reprints.
References
- 1.Mehlen P & Puisieux A Metastasis: a question of life or death. Nat. Rev. Cancer 6, 449–458 (2006). [DOI] [PubMed] [Google Scholar]
- 2.Disibio G & French SW Metastatic patterns of cancers: results from a large autopsy study. Arch. Pathol. Lab. Med. 132, 931–939 (2008). [DOI] [PubMed] [Google Scholar]
- 3.Li F & Tian Z The liver works as a school to educate regulatory immune cells. Cell. Mol. Immunol. 10, 292–302 (2013). [DOI] [PMC free article] [PubMed] [Google Scholar]
- 4.Doherty DG Immunity, tolerance and autoimmunity in the liver: a comprehensive review. J. Autoimmun. 66, 60–75 (2016). [DOI] [PubMed] [Google Scholar]
- 5.Crispe IN Hepatic T cells and liver tolerance. Nat. Rev. Immunol. 3, 51–62 (2003). [DOI] [PubMed] [Google Scholar]
- 6.Crispe IN, Dao T, Klugewitz K, Mehal WZ & Metz DP The liver as a site of T-cell apoptosis: graveyard, or killing field? Immunol. Rev. 174, 47–62 (2000). [DOI] [PubMed] [Google Scholar]
- 7.Zou W, Wolchok JD & Chen L PD-L1 (B7-H1) and PD-1 pathway blockade for cancer therapy: mechanisms, response biomarkers, and combinations. Sci. Transl. Med. 8, 328rv4 (2016). [DOI] [PMC free article] [PubMed] [Google Scholar]
- 8.Hodi FS et al. Improved survival with ipilimumab in patients with metastatic melanoma. N. Engl. J. Med. 363, 711–723 (2010). [DOI] [PMC free article] [PubMed] [Google Scholar]
- 9.Lin H et al. Host expression of PD-L1 determines efficacy of PD-L1 pathway blockade–mediated tumor regression. J. Clin. Invest. 128, 805–815 (2018). [DOI] [PMC free article] [PubMed] [Google Scholar]
- 10.Wei SC, Duffy CR & Allison JP Fundamental mechanisms of immune checkpoint blockade therapy. Cancer Discov. 8, 1069–1086 (2018). [DOI] [PubMed] [Google Scholar]
- 11.Curiel TJ, Wei S, Dong H, Alvarez X & Cheng P Blockade of B7-H1 improves myeloid dendritic cell–mediated antitumor immunity. Nat. Med. 9, 562–567 (2003). [DOI] [PubMed] [Google Scholar]
- 12.Sharma P, Hu-Lieskovan S, Wargo JA & Ribas A Primary, adaptive, and acquired resistance to cancer immunotherapy. Cell 168, 707–723 (2017). [DOI] [PMC free article] [PubMed] [Google Scholar]
- 13.Jiao S et al. Differences in tumor microenvironment dictate T helper lineage polarization and response to immune checkpoint therapy. Cell 179, e13 (2019). [DOI] [PubMed] [Google Scholar]
- 14.Spranger S & Gajewski TF Impact of oncogenic pathways on evasion of antitumour immune responses. Nat. Rev. Cancer 18, 139–147 (2018). [DOI] [PMC free article] [PubMed] [Google Scholar]
- 15.Chen DS & Mellman I Elements of cancer immunity and the cancer–immune set point. Nature 541, 321 (2017). [DOI] [PubMed] [Google Scholar]
- 16.Formenti SC et al. Radiotherapy induces responses of lung cancer to CTLA-4 blockade. Nat. Med. 24, 1845–1851 (2018). [DOI] [PMC free article] [PubMed] [Google Scholar]
- 17.Theelen WS et al. Effect of pembrolizumab after stereotactic body radiotherapy vs pembrolizumab alone on tumor response in patients with advanced non–small cell lung cancer: results of the PEMBRO-RT phase 2 randomized clinical trial. JAMA Oncol. 5, 1276–1282 (2019). [DOI] [PMC free article] [PubMed] [Google Scholar]
- 18.Golden EB, Demaria S, Schiff PB, Chachoua A & Formenti SC An abscopal response to radiation and ipilimumab in a patient with metastatic non-small cell lung cancer. Cancer Immunol. Res 1, 365–372 (2013). [DOI] [PMC free article] [PubMed] [Google Scholar]
- 19.Twyman-Saint Victor C et al. Radiation and dual checkpoint blockade activate non-redundant immune mechanisms in cancer. Nature 520, 373–377 (2015). [DOI] [PMC free article] [PubMed] [Google Scholar]
- 20.Vanpouille-Box C et al. DNA exonuclease Trex1 regulates radiotherapy-induced tumour immunogenicity. Nat. Commun. 8, 15618 (2017). [DOI] [PMC free article] [PubMed] [Google Scholar]
- 21.Deng L et al. Irradiation and anti–PD-L1 treatment synergistically promote antitumor immunity in mice. J. Clin. Invest. 124, 687–695 (2014). [DOI] [PMC free article] [PubMed] [Google Scholar]
- 22.Huang AC et al. T-cell invigoration to tumour burden ratio associated with anti-PD-1 response. Nature 545, 60–65 (2017). [DOI] [PMC free article] [PubMed] [Google Scholar]
- 23.Yarchoan M et al. PD-L1 expression and tumor mutational burden are independent biomarkers in most cancers. JCI Insight 4, e126908 (2019). [DOI] [PMC free article] [PubMed] [Google Scholar]
- 24.Petrelli F et al. Prognostic and predictive role of elevated lactate dehydrogenase in patients with melanoma treated with immunotherapy and BRAF inhibitors: a systematic review and meta-analysis. Melanoma Res. 29, 1 (2019). [DOI] [PubMed] [Google Scholar]
- 25.Tang H et al. PD-L1 on host cells is essential for PD-L1 blockade–mediated tumor regression. J. Clin. Invest. 128, 580–588 (2018). [DOI] [PMC free article] [PubMed] [Google Scholar]
- 26.Chen DS & Mellman I Oncology meets immunology: the cancer- immunity cycle. Immunity 39, 1–10 (2013). [DOI] [PubMed] [Google Scholar]
- 27.John B & Crispe IN Passive and active mechanisms trap activated CD8+ T cells in the liver. J. Immunol. 172, 5222–5229 (2004). [DOI] [PubMed] [Google Scholar]
- 28.Topalian SL et al. Five-year survival and correlates among patients with advanced melanoma, renal cell carcinoma, or non–small cell lung cancer treated with nivolumab. JAMA Oncol. 5, 1411–1420 (2019). [DOI] [PMC free article] [PubMed] [Google Scholar]
- 29.Robinson DR et al. Integrative clinical genomics of metastatic cancer. Nature 548, 297–303 (2017). [DOI] [PMC free article] [PubMed] [Google Scholar]
- 30.Rosenberg JE et al. Atezolizumab in patients with locally advanced and metastatic urothelial carcinoma who have progressed following treatment with platinum-based chemotherapy: a single-arm, multicentre, phase 2 trial. Lancet 387, 1909–1920 (2016). [DOI] [PMC free article] [PubMed] [Google Scholar]
- 31.Medina-Echeverz J, Eggert T, Han M & Greten TF Hepatic myeloid-derived suppressor cells in cancer. Cancer Immunol. Immunother. 64, 931–940 (2015). [DOI] [PMC free article] [PubMed] [Google Scholar]
- 32.Li W et al. Aerobic glycolysis controls myeloid-derived suppressor cells and tumor immunity via a specific CEBPB Isoform in triple-negative breast cancer. Cell Metab. 28, e6 (2018). [DOI] [PMC free article] [PubMed] [Google Scholar]
- 33.Zhang L et al. Single-cell analyses inform mechanisms of myeloid-targeted therapies in colon cancer. Cell 181, e29 (2020). [DOI] [PubMed] [Google Scholar]
- 34.Saio M, Radoja S, Marino M & Frey AB Tumor-infiltrating macrophages induce apoptosis in activated CD8+ T cells by a mechanism requiring cell contact and mediated by both the cell-associated form of TNF and nitric oxide. J. Immunol. 167, 5583–5593 (2001). [DOI] [PubMed] [Google Scholar]
- 35.Zhu J, Petit P-F & Van den Eynde BJ Apoptosis of tumor-infiltrating T lymphocytes: a new immune checkpoint mechanism. Cancer Immunol. Immunother. 68, 835–847 (2019). [DOI] [PMC free article] [PubMed] [Google Scholar]
- 36.Blériot C & Ginhoux F Understanding the heterogeneity of resident liver macrophages. Front. Immunol. 10, 2694 (2019). [DOI] [PMC free article] [PubMed] [Google Scholar]
- 37.David BA et al. Combination of mass cytometry and imaging analysis reveals origin, location, and functional repopulation of liver myeloid cells in mice. Gastroenterology 151, 1176–1191 (2016). [DOI] [PubMed] [Google Scholar]
- 38.Jackson WC et al. Comparison of stereotactic body radiation therapy and radiofrequency ablation in the treatment of intrahepatic metastases. Int. J. Radiat. Oncol.*Biol.*Phys. 100, 950–958 (2018). [DOI] [PMC free article] [PubMed] [Google Scholar]
- 39.Peng D et al. Epigenetic silencing of TH1-type chemokines shapes tumour immunity and immunotherapy. Nature 527, 249–253 (2015). [DOI] [PMC free article] [PubMed] [Google Scholar]
- 40.Tumeh PC et al. Liver metastasis and treatment outcome with anti-PD-1 monoclonal antibody in patients with melanoma and NSCLC. Cancer Immunol. Res 5, 417–424 (2017). [DOI] [PMC free article] [PubMed] [Google Scholar]
- 41.Li H et al. Tim-3/galectin-9 signaling pathway mediates T-cell dysfunction and predicts poor prognosis in patients with hepatitis B virus-associated hepatocellular carcinoma. Hepatology 56, 1342–1351 (2012). [DOI] [PubMed] [Google Scholar]
- 42.Zeng Z et al. Interferon-γ facilitates hepatic antiviral T cell retention for the maintenance of liver-induced systemic tolerance. J. Exp. Med. 213, 1079–1093 (2016). [DOI] [PMC free article] [PubMed] [Google Scholar]
- 43.Limmer A et al. Efficient presentation of exogenous antigen by liver endothelial cells to CD8+ T cells results in antigen-specific T-cell tolerance. Nat. Med. 6, 1348–1354 (2000). [DOI] [PubMed] [Google Scholar]
- 44.Warren A et al. T lymphocytes interact with hepatocytes through fenestrations in murine liver sinusoidal endothelial cells. Hepatology 44, 1182–1190 (2006). [DOI] [PubMed] [Google Scholar]
- 45.Goubier A et al. Plasmacytoid dendritic cells mediate oral tolerance. Immunity 29, 464–475 (2008). [DOI] [PMC free article] [PubMed] [Google Scholar]
- 46.Ma C et al. Gut microbiome–mediated bile acid metabolism regulates liver cancer via NKT cells. Science 360, eaan5931 (2018). [DOI] [PMC free article] [PubMed] [Google Scholar]
- 47.Horst AK, Neumann K, Diehl L & Tiegs G Modulation of liver tolerance by conventional and nonconventional antigen-presenting cells and regulatory immune cells. Cell. Mol. Immunol. 13, 277–292 (2016). [DOI] [PMC free article] [PubMed] [Google Scholar]
- 48.Lee JC et al. Regulatory T cell control of systemic immunity and immunotherapy response in liver metastasis. Sci. Immunol. 5, eaba0759 (2020). [DOI] [PMC free article] [PubMed] [Google Scholar]
- 49.Reck M et al. Atezolizumab plus bevacizumab and chemotherapy in non-small-cell lung cancer (IMpower150): key subgroup analyses of patients with EGFR mutations or baseline liver metastases in a randomised, open-label phase 3 trial. Lancet Respir. Med 7, 387–401 (2019). [DOI] [PubMed] [Google Scholar]
- 50.Lang X et al. Radiotherapy and immunotherapy promote tumoral lipid oxidation and ferroptosis via synergistic repression of SLC7A11. Cancer Disco. 9, 1673–1685 (2019). [DOI] [PMC free article] [PubMed] [Google Scholar]
- 51.Welsh JW et al. Phase II trial of Ipilimumab with stereotactic radiation therapy for metastatic disease: outcomes, toxicities, and low-dose radiation-related abscopal responses. Cancer Immunol. Res. 7, 1903–1909 (2019). [DOI] [PMC free article] [PubMed] [Google Scholar]
- 52.Hosein AN, Brekken RA & Maitra A Pancreatic cancer stroma: an update on therapeutic targeting strategies. Nat. Rev. Gastroenterol. Hepatol. 17, 487–505 (2020). [DOI] [PMC free article] [PubMed] [Google Scholar]
- 53.Mayo CS et al. The big data effort in radiation oncology: Data mining or data farming? Adv. Radiat. Oncol. 1, 260–271 (2016). [DOI] [PMC free article] [PubMed] [Google Scholar]
- 54.Zhang Q et al. Inhibition of ATM increases interferon signaling and sensitizes pancreatic cancer to immune checkpoint blockade therapy. Cancer Res. 79, 3940–3951 (2019). [DOI] [PMC free article] [PubMed] [Google Scholar]
- 55.Sijts AJ, Ossendorp F & Mengede EA Immunodominant mink cell focus-inducing murine leukemia virus (MuLV)-encoded CTL epitope, identified by its MHC class I-binding motif, explains MuLV specificity of MCF-directed cytotoxic T lymphocytes. J. Immunol. 152, 106–116 (1994). [PubMed] [Google Scholar]
- 56.Yu J et al. The differential organogenesis and functionality of two liver-draining lymph nodes in mice. J. Autoimmun. 84, 109–121 (2017). [DOI] [PubMed] [Google Scholar]
- 57.Zheng M, Yu J & Tian Z Characterization of the liver-draining lymph nodes in mice and their role in mounting regional immunity to HBV. Cell. Mol. Immunol. 10, 143–150 (2013). [DOI] [PMC free article] [PubMed] [Google Scholar]
- 58.Billi AC et al. The female-biased factor VGLL3 drives cutaneous and systemic autoimmunity. JCI Insight 4, e127291 (2019). [DOI] [PMC free article] [PubMed] [Google Scholar]
- 59.Kuleshov MV et al. Enrichr: a comprehensive gene set enrichment analysis web server 2016 update. Nucleic Acids Res. 44, W90–W97 (2016). [DOI] [PMC free article] [PubMed] [Google Scholar]
- 60.Mould KJ, Jackson ND, Henson PM, Seibold M & Janssen WJ Single cell RNA sequencing identifies unique inflammatory airspace macrophage subsets. JCI Insight 4, e126556 (2019). [DOI] [PMC free article] [PubMed] [Google Scholar]
- 61.Trapnell C et al. The dynamics and regulators of cell fate decisions are revealed by pseudotemporal ordering of single cells. Nat. Biotechnol. 32, 381–386 (2014). [DOI] [PMC free article] [PubMed] [Google Scholar]
- 62.Dwyer DF, Barrett NA & Austen KF, Immunological Genome Project Consortium. Expression profiling of constitutive mast cells reveals a unique identity within the immune system. Nat. Immunol. 17, 878–887 (2016). [DOI] [PMC free article] [PubMed] [Google Scholar]
- 63.Peng H et al. Liver-resident NK cells confer adaptive immunity in skin-contact inflammation. J. Clin. Invest. 123, 1444–1456 (2013). [DOI] [PMC free article] [PubMed] [Google Scholar]
- 64.Imai K & Ratkovic M Covariate balancing propensity score. J. R. Stat. Soc. Ser. B Stat. Methodol. 76, 243–263 (2014). [Google Scholar]
Associated Data
This section collects any data citations, data availability statements, or supplementary materials included in this article.
Supplementary Materials
Data Availability Statement
Raw data for single-cell sequencing are deposited at the NCBI Gene Expression Omnibus (GSE157600). Further information and requests for resources and reagents should be directed to the corresponding authors. All requests for raw and analyzed data and materials will be promptly reviewed by the corresponding authors to verify if the request is subject to any intellectual property or confidentiality obligations. Any data and materials that can be shared will be released via a Material Transfer Agreement. Patient-related data not included in the paper may be subject to patient confidentiality. Source data have been provided with this paper for Figs. 1–6 as well as Extended Figs. 1–9.