Abstract
The chemistry of urethanes plays a key role in important industrial processes. Although catalysts are often used, the study of the reactions without added catalysts provides the basis for a deeper understanding. For the non‐catalytic urethane formation and cleavage reactions, the dominating reaction mechanism has long been debated. To our knowledge, the reaction kinetics have not been predicted quantitatively so far. Therefore, we report a new computational study of urethane formation and cleavage reactions. To analyze various potential reaction mechanisms and to predict the reaction rate constants quantum chemistry and transition state theory were employed. For validation, experimental data from literature and from own experiments were used. Quantitative agreement of experiments and predictions could be demonstrated. The calculations confirm earlier assumptions that urethane formation reactions proceed via mechanisms where alcohol molecules act as auto‐catalysts. Our results show that it is essential to consider several transition states corresponding to different reaction orders to enable agreement with experimental observations. Urethane cleavage seems to be catalyzed by an isourethane, leading to an observed 2nd‐order dependence of the reaction rate on the urethane concentration. The results of our study support a deeper understanding of the reactions as well as a better description of reaction kinetics and will therefore help in catalyst development and process optimization.
Keywords: urethane derivatives, computational chemistry, reaction kinetics, transition state theory
Reaction kinetics and mechanisms of urethane formation and cleavage reactions were investigated based on advanced quantum chemical methods. These reactions represent important model reactions in urethane chemistry. The results confirm that both urethane formation and cleavage proceed via autocatalytic mechanisms. Several mechanisms contribute to the observed reaction rate for urethane formation. A validation using own experimental data and literature data confirmed that the used quantum chemical methods yield quantitative predictions.

1. Introduction
The chemistry of urethanes is the basis for important industrial processes. [1] In urethane formation reactions, isocyanates react with alcohols to form urethane links. Urethane links connect the building blocks of polyurethanes, an important class of polymer materials with a worldwide production of about 18 Mt in 2016. [2]
In turn, urethane cleavage reactions can be considered as the reverse reactions of urethane formation [3] and are part of a possible production route of industrially important isocyanates.[ 4 , 5 ] Urethane cleavage reactions are strongly endergonic and possess a very unfavorable reaction equilibrium. [6] Thus, the development of urethane cleavage processes is very challenging and a thorough understanding of the reaction system is required. Besides urethane formation and cleavage reactions, isocyanates and urethanes may undergo further reactions that are not the focus of this article, e. g., cycloaddition reactions of isocyanates or biuret formation. [4] Although catalysts are often used for urethane formation and cleavage reactions,[ 1 , 7 ] it is important to study the mechanisms and kinetics of non‐ and auto‐catalytic reactions as a basis e. g., for catalyst and process development. While we are not aware of any elaborated studies of urethane cleavage without added catalyst, urethane formation has been studied extensively. [8] In particular, urethane formation has been investigated experimentally for decades, studying the reaction kinetics of selected urethane reactions in liquid phase[ 9 , 10 , 11 , 12 , 13 , 14 , 15 , 16 , 17 ] and comparing the reactivity of different isocyanates[ 18 , 19 , 20 , 21 ] and alcohols.[ 22 , 23 , 24 , 25 , 26 , 27 , 28 , 29 , 30 , 31 , 32 ] The reactivity of isocyanates seems to be strongly influenced by different substituents. Alcohols show different reactivity depending on the position of the hydroxy group, while the reactivity of different primary alcohols seems to be very similar. Ephraim et al. [33] as well as Oberth and Bruenner [34] studied the influence of different solvents on urethane formation kinetics and found a strong acceleration of the reaction in non‐polar compared to polar reaction media. This finding is in accordance with experimentally determined activation energies of urethane formation in different reaction solvents.[ 16 , 17 , 21 , 24 , 26 , 27 , 28 , 31 , 32 , 35 ] Values of activation energies around 30 kJ mol−1 were found in very non‐polar solvents and values of up to 50 kJ mol−1 for reaction in excess alcohol.
Based on experimental results, different reaction mechanisms have been suggested for urethane formation reactions.[ 3 , 8 , 32 , 36 , 37 ] A first group of mechanisms do not involve any catalysis:
• Non‐catalytic 1‐step mechanisms:
– Addition of the hydroxy group of the alcohol to the C=N bond of the isocyanate via a transition state with 4‐ring and without charges (Figure 1, upper path).
Figure 1.
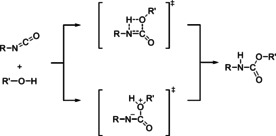
Bimolecular 1‐step mechanisms proposed for urethane formation reactions: Addition of the hydroxy group of the alcohol to the C=N bond of the isocyanate via a transition state with 4‐ring and without charges (upper path) and addition of the hydroxy group to the C=N bond via a zwitterionic transition state (lower path).
– Addition of the hydroxy group to the C=N bond via a zwitterionic transition state (Figure 1, lower path).
• Non‐catalytic 2‐step mechanisms involving a bimolecular reaction to an isourethane intermediate and a subsequent isomerization into the stable urethane. In the first step, the hydroxy group of the alcohol is added to the C=O bond of the isocyanate. As for the 1‐step mechanisms, transition states with 4‐rings as well as zwitterionic transition states have been proposed (Figure 2).
Figure 2.
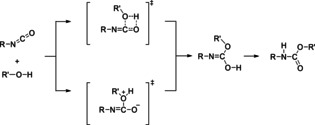
2‐step mechanisms proposed for urethane formation reactions involving a bimolecular reaction to an isourethane intermediate. In the first step, the addition of the hydroxy group of the alcohol to the C=O bond of the isocyanate occurs via a transition state with 4‐ring (upper path) or via a zwitterionic transition state (lower path).
Besides non‐catalytic mechanisms, a second group of auto‐catalytic mechanisms have been proposed due to the observation that the rate of urethane formation reactions strongly depends on the alcohol concentration and that the observed reaction order with respect to the alcohol is larger than 1 at high concentrations. [34] The proposed auto‐catalytic urethane reactions proceed via transition states with 6‐ or 8‐rings for concerted proton transport including 1 or 2 additional alcohol molecules as auto‐catalysts, respectively [14] (Figure 3). As for the non‐catalytic mechanisms, also the auto‐catalytic reaction could occur in 2 steps with addition of the hydroxy group of the alcohol to the C=O bond instead of the C=N bond of the isocyanate.
Figure 3.
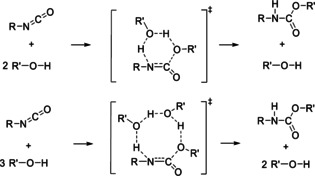
Concerted auto‐catalytic 1‐step mechanisms of urethane reactions with alcohol molecules as auto‐catalysts. The mechanisms involve 1 (upper part) or 2 (lower part) additional alcohol molecules.
Besides alcohol molecules, also the formed urethane groups are supposed to show auto‐catalytic activity.[ 3 , 17 ] Recently, experimental evidence was even found for auto‐catalytic activity of isocyanates present in excess. [38] In summary, the literature disagrees regarding the possible reaction mechanisms complicating the interpretation of experimental results. [37]
To shed light on the question of the correct mechanism, computational studies have been performed. Cysewski et al. [39] studied the non‐catalytic 2‐step mechanism with addition of the hydroxy group to the C=O bond of the isocyanate shown in the upper part of Figure 2 using the quantum‐mechanical density‐functional theory (DFT) [40] method B3LYP [41] and the polarizable continuum method (PCM) [42] to compute activation energies of urethane formation in benzene as reaction medium. The authors identified structures of transition states and intermediates, but did not observe quantitative agreement of calculated activation energies with experimental data. Wang et al. [43] investigated urethane formation via addition of the hydroxy group to the C=N bond of the isocyanate without any catalyst (Figure 1, upper path) and auto‐catalysis by the alcohol (Figure 3) based on B3LYP. The authors calculated and compared energy profiles of the different reaction paths and concluded that auto‐catalytic mechanisms are favored. In a series of studies, Samuilov et al.[ 37 , 44 , 45 , 46 , 47 , 48 , 49 , 50 , 51 ] investigated reactions of different isocyanates and alcohols based on B3LYP. The authors compared enthalpies, entropies and free energies of activation for the reaction of the alcohol hydroxy group with the isocyanate C=N and C=O bonds, respectively.[ 37 , 44 , 45 , 46 , 47 ] Reactions were considered that proceed via transition states with 4‐rings (see Figures 1 and 2) as well as mechanisms with auto‐catalysis by methanol (Figure 2). The results clearly show that the addition of the alcohol hydroxy group to the C=N bond is favored compared to the addition to the C=O bond of the isocyanate due to much lower activation barriers. Results of Samuilov et al. indicate that urethane groups may act as auto‐catalyst in a reaction via transition states with 8‐rings. [50] Moreover, the authors used the PCM solvation model to account for the influence of the reaction medium and found that the activation barriers are influenced by solvent polarity. [51] Besides Samuilov et al., also other researchers have compared reaction mechanisms with addition of the hydroxy group of the alcohol to the C=N and C=O bonds in isocyanates. Çoban and Konuklar [52] computed free energy profiles of bimolecular urethane formation in benzene based on B3LYP and PCM to compare the mechanisms shown in the upper parts of Figures 1 and 2, respectively. Raspoet et al. [14] used the Hartree‐Fock (HF) [40] method to identify various transition states of non‐catalytic and auto‐catalytic reaction mechanisms involving addition of the hydroxy group of the alcohol to the C=N and C=O bonds of the isocyanate, respectively. Subsequently, they used MP2 [40] and PCM to determine and compare energy paths corresponding to the different mechanisms. In agreement with Samuilov et al., Çoban and Konuklar as well as Raspoet et al. concluded that urethane formation involving the addition of the hydroxy group to the C=N bond of the isocyanate is favored compared to addition to the C=O bond. Moreover, Raspoet et al. also showed that auto‐catalytic mechanisms are favorable compared to non‐catalytic mechanisms in agreement with other studies discussed above. Recently, Cheikh et al. [38] used more sophisticated quantum chemical methods to study auto‐catalytic urethane formation. The authors computed paths in energy, enthalpy and free energy based on the G4MP2 [53] protocol and the SMD solvation model. [54] Based on the analysis of these paths, Cheikh et al. concluded that not only alcohols, but also isocyanates may act as auto‐catalysts for urethane formation.
Based on the findings of the computational studies discussed above, it appears that auto‐catalysis plays an important role in urethane formation. Moreover, some studies have confirmed that the reaction proceeds via addition of the hydroxy group of the alcohol to the C=N bond of the isocyanate rather than to the C=O bond. However, it is still not completely clear which reaction mechanism dominates during urethane formation without added catalyst or if even several mechanisms contribute to the reaction rates observed in experiments. Thus, we used advanced quantum chemical methods in this study to compute activation barriers in free energy for urethane formation via different reaction mechanisms and calculated reaction rate constants with transition state theory.[ 55 , 56 , 57 ] We used the reaction of phenyl isocyanate with methanol as model system. We validated the calculated rate constants by quantitative comparison with experimental data from literature. Based on the results, we investigated how different mechanisms contribute to the rate of urethane formation depending on temperature, alcohol concentration and reaction medium. Moreover, we also investigated the mechanism and kinetics of auto‐catalytic urethane cleavage. Here, the cleavage of methyl phenyl carbamate (MPC, Figure 4) to phenyl isocyanate and methanol served as model reaction. The calculated results are compared to data from our own experimental investigation.
Figure 4.

Structures of methyl phenyl carbamate (MPC, left) and methyl n‐(4‐pentylphenyl)carbamate (p‐C5‐MPC, right).
Experimental Section
Computational
Conventional transition state theory is employed55–58] to calculate reaction rate constants of elementary reactions based on the so‐called Eyring equation:
| (1) |
where k is a reaction rate constant in concentration units, T the temperature, the molar volume of the reaction phase and the activation barrier in Gibbs free energy. [59] The reaction order n is defined as the sum of the stoichiometric coefficients of the reactants, which take negative values by definition. The Boltzmann constant is denoted by , Planck's constant by h and the gas constant by R. We apply the following procedure to compute the activation barriers and rate constants k:
We employ the DFT method B3LYP [41] with dispersion correction [60] (B3LYP‐D3) and TZVP basis set to optimize the geometry of reactants and transition states and to perform vibrational analysis. B3LYP is known to provide accurate geometries at comparably low computational cost.[ 61 , 62 ] Rotor scans are used to identify possible conformations of reactants and transition states. The rigid rotor harmonic oscillator [40] (RRHO) approximation is used in frequency analysis. We employ the software Gaussian 09[ 63 , 64 ] and the UltraFine integration grid for geometry optimization and frequency analysis.
Intrinsic reaction coordinate (IRC) scans [64] are performed with Gaussian 09 to ensure that the identified transition states connect the desired reactants and products.
Accurate electronic energies are computed in single point (SP) calculations using DLPNO‐CCSD(T)[ 65 , 66 ] with aug‐cc‐pVTZ basis set and TightPNO settings. We employ the software ORCA [67] for these SP calculations.
Thermochemical calculations are performed with GoodVibes [68] to obtain the activation barriers in the ideal gas reference state. To reduce the error of the RRHO approximation for low frequencies, we use Grimme's quasi‐harmonic treatment. [69]
Using a Hess cycle, [59] activation barriers in the liquid reaction phase are calculated from the activation barriers in ideal gas and solvation free energies of reactants and transition states. For details about this treatment, the reader is referred to the literature.[ 70 , 71 , 72 , 73 , 74 ] We calculate the required solvation free energies with the advanced solvation model COSMO‐RS.[ 75 , 76 , 77 ] For this purpose, the software turbomole[ 78 , 79 ] is used to optimize the geometries of reactants and transition states with the DFT method BP86[ 80 , 81 , 82 ] and def2‐TZVP basis set. Based on the obtained geometries, COSMO [83] calculations are performed as single point calculations. Subsequently, the COSMO‐RS calculations are performed[ 84 , 85 ] to obtain solvation free energies . A pure ideal gas with a concentration of 1 mol/l and 1 mol/l of the solute dissolved in the solvent are used as gaseous and liquid reference states for the calculation of , respectively. We discussed details about the correct choice of reference states in our previous work. [74] The rate constants k computed with the procedure described here correspond to phenomenological rate constants and therefore depend on the reaction mixture composition. Thus, the solvation free energies have to be computed at the mixture compositions of interest. Using the calculated of reactants and transition states in the calculation of activation barriers in solution, the influence of the reaction solvent and the reaction mixture composition on reaction rate constants k is accounted for. In case several mechanisms and according transition states are possible for a reaction, the described computation scheme also captures the influence of solvents on the reaction mechanism because the solvent influence on differs for the different TS. It is assumed for the computations that COSMO‐RS accounts sufficiently well for different kinds of interactions between solvent molecules, reactants, and transition states, e. g., for hydrogen bonds, electrostatics and van der Waals interactions. Thus, no specific interaction must be modeled explicitly. This assumption turned out to be justified for different reactions in previous studies of our group.[ 74 , 86 ] Moreover, the examined reaction solvents must be inert with respect to the reaction under consideration. Non‐inert solvents could in principle also be handled, but would have to be included in the transition states explicitly.
Reaction rate constants k are calculated with Equation (1) using the determined activation barriers in liquid phase .
A tunneling correction to the obtained rate constants k is computed with the software package TAMkin [87] based on Eckart tunneling. [88]
All identified conformers are considered in the determination of activation barriers and rate constants k (see supporting information for details). Moreover, the influence of chirality is accounted for. [89] It should be noted that using both Grimme's quasi‐harmonic treatment [69] and the treatment of conformers and chirality may be problematic in the case that the low‐frequency vibrations largely correspond to movements that convert different conformers into each other. We did, however, not observe this case in our studies.
The expected uncertainty in rate constants k predicted with the procedure described above was discussed in previous work[ 74 , 86 ] and we only elaborate on the most important points here. The estimation of uncertainty starts with the assumption that two main contributions determine the uncertainty in k: the uncertainty in predicted solvation free energies and in electronic energies (that largely determine the activation barriers in ideal gas). The uncertainty in predicted with COSMO‐RS is estimated as 1.25 kJ mol−1. [90] The uncertainty in electronic energies computed with DLPNO‐CCSD(T) should be between the mean unsigned errors given for full CCSD(T) (∼2.5 kJ mol−1) [61] and double hybrid DFT methods like B2PLYP (∼3.3 kJ mol−1). [61] We use a value of 3.3 kJ mol−1 as upper estimate of the uncertainty. The given uncertainties approximately correspond to 1 standard deviation. A combined uncertainty is calculated based on Gaussian error propagation: [91]
| (2) |
For a bimolecular reaction, the uncertainties of 2 reactants and 1 transition state impact the calculation of the rate constant k. In accordance with the Eyring equation (1), an error factor δ is defined:
| (3) |
The error factor δ takes values of δ at T=25 °C and δ at T=220 °C. It has to be noted that these values can be regarded as upper estimates of the true uncertainty in the sense that independent errors are assumed in the calculation of δ (Equation (3)). However, the transition states of chemical reactions are usually similar to the reactants and thus, the errors can be expected to correlate positively and to cancel partly. The estimated error factor δ corresponds to 1 standard deviation. Therefore, based on the Gaussian distribution, 68 % of predicted rate constants k should deviate by less than a factor of 11.5 from values determined experimentally at T=25 °C (assuming the experimental values are accurate). At higher temperatures, the accuracy of predicted rate constants is expected to increase.
Experimental
To validate the rate constants predicted for the cleavage of methyl phenyl carbamate (MPC), we performed an experiment as described in the following. An experimental challenge for small scale cleavage experiments at temperatures above 200 °C is the volatility of the phenyl isocyanate formed with MPC as substrate, causing its removal from the reaction flask together with the by‐product methanol, which in turn leads to fast back‐reaction in piping and receiver flask. We therefore decided to replace MPC by methyl n‐(4‐pentylphenyl)carbamate (p‐C5‐MPC, Figure 4), which has an additional pentyl moiety in para position and thus a higher boiling point. The pentyl moiety can be assumed to have negligible influence on the kinetics of the cleavage reaction. Thus, the experimentally determined rate constant of p‐C5‐MPC cleavage may be used for comparison with the predicted kinetics of MPC cleavage. p‐C5‐MPC was prepared and analyzed according to descriptions in earlier work. [92] All other chemicals were purchased from commercial sources and used without further purification under dry and inert conditions. Argon was used as inert gas. All glassware was dried under vacuum and kept under argon while in use. The thermal cleavage of p‐C5‐MPC was performed in a small, customized distillation apparatus. A 4‐necked 50 ml distillation flask was connected to an inert gas inlet, a substrate solution feed and a descending condenser. The receiver flask was a tube‐like cooling trap immersed in a Dewar vessel filled with a mixture of ice and water. The 50 ml reaction flask was equipped with a magnetic stirring bar, an internal thermocouple and wrapped in electric heating band. The experiment was carried out with a mixture of 6 g (0.027 mol, 15 wt%) p‐C5‐MPC, 0.6 g (0.003 mol) phenanthrene as internal standard and 25 g (0.150 mol) diphenyl ether as solvent. A reaction temperature of 220 °C was used. An intense argon stream of 10 l/h was applied to quickly remove generated methanol from the reaction flask and drive it to the cooling trap. The generated isocyanate, diphenyl ether and minor amounts of side product (substituted urea) are high‐boiling compounds and remain in the reaction flask. In order to start the cleavage reaction under defined conditions, a preheated substrate solution was quickly transferred into the reaction flask from a Schlenk tube with a slight argon over‐pressure. Immediately after the start by injection, 0.1 ml reaction mixture were withdrawn as the first sample. In total, 10 samples were collected in 120 min. The individual samples were quenched immediately in 0.55 ml of a chloroform and pyrrolidine mixture (11 : 1 vol./vol.) and analyzed via HPLC (for details see supporting information).
2. Results and Discussion
As outlined in the Introduction, we present results of computational studies of both urethane formation and urethane cleavage without added catalyst. The urethane formation from phenyl isocyanate and methanol and the cleavage of methyl phenyl carbamate (MPC) were used as model reactions, respectively. The results of the computational study of urethane formation are presented and compared to experimental data from literature in the following. Subsequently, the findings about the kinetics and reaction mechanism of auto‐catalytic urethane cleavage are presented and validated using data from our own experimental investigation.
2.1. Urethane Formation
2.1.1. Reaction Mechanisms and Transition States
Various non‐catalytic and auto‐catalytic reaction mechanisms have been suggested for urethane formation without added catalysts, as discussed in the Introduction. Previous studies[ 14 , 37 , 44 , 45 , 46 , 47 , 52 ] have already shown that mechanisms where the hydroxy group of the alcohol is added to the C=O bond of the isocyanate are unfavorable compared to the addition to the C=N bond. Moreover, experimental literature data is mostly available for the early stage of urethane formation at low urethane concentrations. Therefore, we did not consider auto‐catalysis of urethane formation by urethane groups in this study. Consequently, we investigated the following mechanisms:
Non‐catalytic 1‐step mechanism with TS with 4‐ring (Figure 1, upper part)
Mechanisms with zwitterionic transition states (lower parts of Figures 1 and 2)
Concerted auto‐catalytic 1‐step mechanisms via transition states involving 1 or 2 additional alcohol molecules in 6‐ or 8‐rings (Figure 3)
Transition state geometries for all considered mechanisms were sought using the DFT method B3LYP with TZVP basis set. No zwitterionic transition states could be identified, even when adding a continuum with infinite polarizability during the calculations to simulate a polar environment. Moreover, experimental findings[ 33 , 34 ] show that urethane formation reactions are accelerated in non‐polar reaction media, whereas such media would destabilize zwitterionic transition states and thus slow down the reaction. This finding indicates that such zwitterionic transition states might not exist. Thus, we did not further consider the corresponding reaction mechanisms. For the non‐catalytic mechanism, we identified 1 TS geometry with a 4‐ring. For the auto‐catalytic mechanisms with alcohol molecules as catalysts, we found 2 TS geometries with 6‐rings and 3 possible TS geometries with 8‐rings. The geometries are provided in the supporting information. All identified transition states are chiral, which is considered in the calculation of reaction rate constants [89] as described in the next section. No relevant conformers of the reactants phenyl isocyanate and methanol were identified.
2.1.2. Reaction Rate Constants and Activation Energies
We calculated reaction rate constants at different reaction conditions and in different reaction media using transition state theory (TST) and quantum chemical methods as described in the Materials and Methods section. We determined individual rate constants for the reaction via every identified transition state. Experimental studies typically assume a bimolecular reaction when fitting rate constants to experimental data. In order to obtain comparable results, we here define a micro‐kinetic model to calculate pseudo‐second order rate constants :
| (4) |
In Equation (4), , and are the rate constants of reactions via the individual transition states with 4‐, 6‐ and 8‐rings, respectively. The sums run over the possible alternative TS geometries. The prefactors of 2 for all terms in Equation (4) account for the chirality of the TS geometries. [89] Equation (4) takes into account all contributions of the different reaction mechanisms and transition states to an observed 2nd‐order rate constant.
To validate the calculation of the rate constants, we use data from 4 experimental studies:
Apparent 2nd order rate constants of the reaction of phenyl isocyanate with methanol at 20 °C in 8 solvents at initial conditions given by Ephraim et al.. [33]
Apparent 2nd order rate constants of the reaction of phenyl isocyanate with butanol at 25 °C in 17 solvents given by Oberth and Bruenner. [34]
Apparent 2nd order rate constant of the reaction of phenyl isocyanate with butanol at 25 °C in Xylene given by Dyer et al.. [24]
Apparent 2nd order rate constant of the reaction of phenyl isocyanate with butanol at 25 °C in excess butanol given by Lovering and Laidler. [21]
We use all data given above for comparison with the rate constants predicted for the reaction of phenyl isocyanate with methanol because experimental findings indicate that the kinetics of urethane formation are very similar for different primary alcohols. [26] A table with all values of experimental rate constants from literature used for comparison as well as the predicted rate constants is provided in the supporting information. A log‐log plot of versus is shown in Figure 5.
Figure 5.
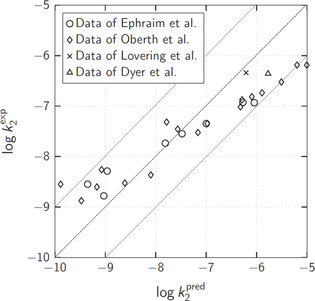
Log‐log plot of experimental rate constants from literature versus predicted rate constants . The dashed line indicates perfect match, while the dotted lines mark a deviation of factor 10 between experimental and predicted rate constants. The experimental rate constants are taken from the studies of Ephraim et al., [33] Obert and Bruenner, [34] Dyer et al. [24] as well as Lovering and Laidler. [21]
As discussed in the Materials and Methods section, it is estimated that predicted rate constants should agree with experimental values within a factor of about 11.5 at temperatures around 25 °C (assuming accurate experimental values). The agreement is even much better for most of the data (Figure 5). Most of the predicted rate constants deviate from the experimental values by much less than one order of magnitude and there is an almost perfect match for rate constants in moderately polar solvents like butyl acetate or di‐butyl ether . The rate constants in polar solvents like acetonitrile or tetrahydrofuran are underestimated by the prediction, while the rate constants in non‐polar solvents like benzene or toluene are overestimated. The general trend of increasing rate constants k with decreasing solvent polarity is reflected very well by the prediction. Moreover, this trend can be explained by the identified transition state structures. The polar hydroxy and isocyanate groups are partly shielded by non‐polar moieties in the ring structures of the transition states (see Figure 1, upper part, and Figure 3). Therefore, the relative stabilization of the transition states compared to the more polar reactants increases in non‐polar reaction media and the reaction is accelerated.
Besides experimental rate constants also experimentally determined activation energies have been reported in literature. Dyer et al. [24] reported an activation energy of the reaction of phenyl isocyanate with butanol of E A=33 kJ mol−1 in xylene. Lovering and Laidler [21] found E A=48 kJ mol−1 for the same reaction carried out in excess alcohol. As for rate constants, there is also experimental evidence that the activation energies for urethane reactions with different primary alcohols are almost equal. [26] Therefore, we use the experimentally determined activation energies given above for comparison with our prediction for the reaction of phenyl isocyanate with methanol. The predicted activation energies were determined by fitting the Arrhenius equation
| (5) |
to rate constants predicted at different temperatures between 15 and 35 °C. The according Arrhenius plots are provided in the supporting information. As shown in Figure 6, there is an almost perfect match of prediction and experiment in excess alcohol, while the deviation of ∼4 kJ mol−1 in xylene seems acceptable.
Figure 6.
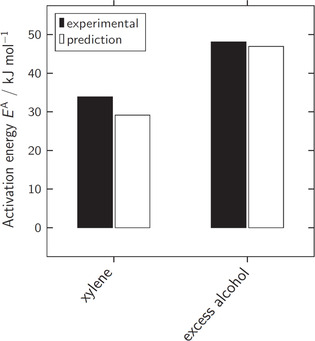
Comparison of experimentally determined and predicted activation energies for the reaction of phenyl isocyanate with primary alcohols in the solvent xylene and in excess alcohol. The experimental values were reported by Dyer et al. [24] and Lovering and Laidler, [21] respectively.
The trend of decreasing activation energies with decreasing solvent polarity is reflected very well by the prediction.
2.1.3. Influence of Solvent, Temperature and Alcohol Concentration on the Reaction Mechanism
The results reported above show that the employed procedure and methods allow to quantitatively predict rate constants of the reaction of phenyl isocyanate with methanol. For this purpose, different transition states corresponding to non‐catalytic and auto‐catalytic reaction mechanisms were considered. However, it is not yet clear how the different mechanisms contribute to the overall reaction rate and how the choice of solvent, reaction temperature and alcohol concentration influence these contributions. Therefore, these influences are discussed in the following.
Figure 7 shows the predicted contributions of the considered non‐catalytic (TS with 4‐ring) and auto‐catalytic (TS with 6‐ring and 8‐ring) mechanisms to the overall reaction rate at 20 °C in the 8 solvents investigated experimentally by Ephraim et al.. [33]
Figure 7.
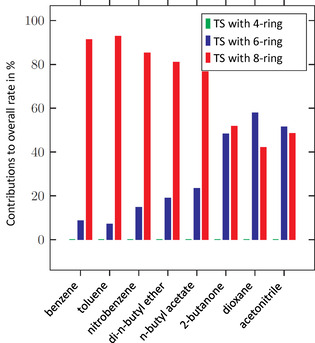
Contributions in % of different non‐catalytic (TS with 4‐ring) and auto‐catalytic (TS with 6‐ring and 8‐ring) reaction mechanisms to the overall reaction rate in 8 different solvents at T=20 °C.
It can be seen that according to our prediction, the contribution of the non‐catalytic mechanism (TS with 4‐ring) to the reaction rate is almost negligible in all solvents. This finding can be attributed to the fact that the transition state with 4‐ring has a very unfavorable energy, leading to a high energetic barrier for the reaction. The contributions of the auto‐catalytic mechanisms (TS with 6‐ring and 8‐ring, respectively) depend strongly on the used reaction solvent. The contribution of the transition states with 8‐ring is dominant in non‐polar solvents like benzene and toluene while approximately equal contributions of the transition states with 6‐ring and 8‐ring are predicted in polar solvents like acetonitrile. A plausible explanation for this behavior can be given based on the structures and energies of the different transition states: The transition states with 8‐ring lead to a lower energetic barrier of the reaction in most solvents compared to the transition states with 6‐ring. However, as the hydroxy groups of alcohols are shielded in the TS structures (see Figure 3), in polar solvents, hydrogen bonds of 3 alcohol molecules with the surrounding solvent molecules have to be broken to form a TS with 8‐ring compared to only 2 hydrogen bonds to form a TS with 6‐ring. This difference reduces the energetic benefits of transition states with 8‐ring in polar solvents, while there is no such effect in non‐polar media. As the rates of the individual reactions via TS with 6‐ring and 8‐ring show different orders with respect to the alcohol (2nd and 3rd order, respectively, see Figure 3), our results are in accordance with experimental findings that the observed reaction order of urethane formation depends on the solvent. [34]
Figure 8 shows the contributions of the different reaction mechanisms to the overall rate in the solvent 2‐butanone depending on temperature.
Figure 8.
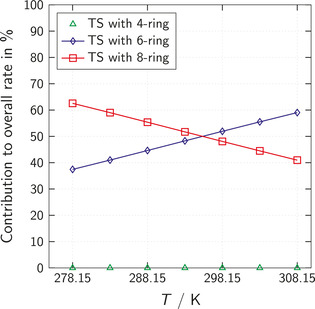
Contribution in % of different non‐catalytic (TS with 4‐ring) and auto‐catalytic (TS with 6‐ring and 8‐ring) reaction mechanisms to the overall reaction rate in 2‐butanone depending on the temperature T. The concentrations of isocyanate and alcohol both equal 250 mol m−3.
The contribution of the non‐catalytic mechanism (TS with 4‐ring) is negligible over the whole temperature range. The contribution of the auto‐catalytic reaction via TS with 6‐ring increases with increasing temperature, while the contribution of the reaction via TS with 8‐ring decreases. Again, there is a plausible explanation for this behavior: Compared to the transition states with 6‐ring, the transition states with 8‐ring are favorable regarding energy but unfavorable regarding entropy. Thus, at low temperatures where energetic effects are more important, the TS with 8‐ring are dominant. In contrast, the entropically favorable TS with 6‐ring become more and more important with increasing temperature.
Figure 9 shows the contributions of the different reaction mechanisms in the solvent 2‐butanone depending on the alcohol concentration for a fixed isocyanate concentration and at a fixed temperature.
Figure 9.
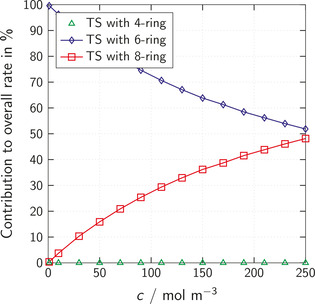
Contribution in % of different non‐catalytic (TS with 4‐ring) and auto‐catalytic (TS with 6‐ring and 8‐ring) reaction mechanisms to the overall reaction rate in 2‐butanone depending on the alcohol concentration. The isocyanate concentration is fixed to 250 mol m−3 and the temperature to 25 °C.
The contribution of the non‐catalytic mechanism (TS with 4‐ring) is negligible at all investigated concentrations. At low alcohol concentrations, the reaction via TS with 6‐ring is dominant, while the contribution of the transition states with 8‐ring increases with increasing alcohol concentration. As 1 alcohol molecule less is required to form a TS with 6‐ring compared to a TS with 8‐ring (see Figure 3), the TS with 6‐ring are more favorable at conditions where few alcohol molecules are available, while the TS with 8‐ring become more and more favorable with increasing alcohol concentration. From the perspective of thermodynamics, the entropy that is lost when forming a TS increases with decreasing alcohol concentration. This increase of entropy loss is less pronounced for the TS with 6‐ring compared to the TS with 8‐ring. Thus, the transition states with 6‐ring become dominant at low alcohol concentrations.
To sum up the findings reported in the section about urethane formation, it can be concluded that the used procedure for computing reaction rate constants based on TST and advanced quantum chemical methods is able to predict rate constants of urethane reactions quantitatively. The transition states corresponding to the non‐catalytic mechanisms proposed in literature could either not be identified at all or are too high in energy to enable a noticeable contribution to the reaction rate. These findings were enabled by advanced quantum chemical methods that have become available in recent years. Indeed, our results confirm earlier assumptions that urethane formation proceeds via auto‐catalytic mechanisms with alcohol molecules as auto‐catalysts. Different transition states with 6‐rings and 8‐rings for proton transport were identified and used in the calculation of pseudo‐2nd order rate constants (Equation (4)). The results show that the contributions of the different mechanisms depend on the used solvent, the temperature and the alcohol concentration. Consequently, both reactions via TS with 6‐ring and 8‐ring need to be considered to predict the kinetics of urethane reactions for a broad range of solvents and reaction conditions.
2.2. Auto‐Catalytic Urethane Cleavage
Urethane cleavage can be considered as reverse reaction of urethane formation. [3] It can be expected that urethane cleavage proceeds via an auto‐catalytic mechanism similar to urethane formation. However, urethane cleavage is strongly endergonic and possesses a very unfavorable reaction equilibrium.[ 5 , 6 ] Consequently, methanol has to be continuously removed from the reactor to prevent immediate limitation of the cleavage reaction by reaction equilibrium. Therefore, methanol cannot act as auto‐catalyst in urethane cleavage and it seems probable that urethane groups or tautomers of urethane groups are the catalytically active groups. Accordingly, Figure 10 shows 3 possible transition state structures:
Figure 10.

Possible transition states of auto‐catalytic urethane cleavage with urethane groups or tautomers of urethane groups as auto‐catalysts.
A TS with 8‐ring where an isourethane acts as catalyst (left).
A TS with 8‐ring where protons are exchanged between 2 urethanes that are cleaved simultaneously (middle).
A TS with 8‐ring where 1 urethane is cleaved and a second urethane group acts as auto‐catalyst (right).
All 3 transition states shown in Figure 10 could be identified by geometry optimizations with B3LYP and TZVP basis set for the model reaction (cleavage of methyl phenyl carbamate, MPC). The corresponding geometries and energies are provided in the supporting information. On the B3LYP/TZVP level, the TS shown on the right lies ∼41 kJ mol−1 higher in energy than the TS shown on the left, the TS in the middle even ∼106 kJ mo0−1. Therefore, the TS shown on the left with an isourethane acting as catalyst is most likely dominant. No relevant conformer of this TS could be identified. In contrast, we found 3 relevant conformers of the reactant MPC (a planar trans‐conformation and a chiral cis‐conformation). The complete scheme of the corresponding auto‐catalytic urethane cleavage is shown in Figure 11.
Figure 11.
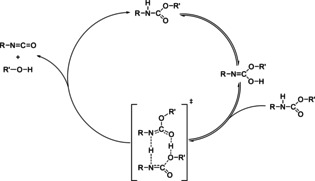
Scheme of the proposed mechanism of auto‐catalytic urethane cleavage.
The proposed scheme starts with the tautomerization of a urethane molecule (top of Figure 11). The tautomerization reaction is assumed to be fast and always in equilibrium. The formed isourethane and another urethane molecule form the transition state of the cleavage reaction that results in the products (isocyanate+alcohol) and a urethane molecule.
We computed reaction rate constants of the MPC cleavage reaction according to the scheme shown in Figure 11 with the procedure described in the Materials and Methods section at temperatures of 200, 220 and 240 °C. The values of the predicted rate constants are given in Table 1. The Arrhenius equation (see Equation (5)) was fitted to the values of and the obtained activation energy amounts to E A=88 kJ mol−1. The according Arrhenius plot is shown in the supporting information. To facilitate practical use and comparison with experimental data, we computed the rate constants and the activation energy with respect to the energy of two MPC molecules instead of one MPC and one isourethane molecule.
Table 1.
Reaction rate constants predicted for the cleavage of MPC.
|
T in °C |
in m3 mol−1 s−1 |
|
|---|---|---|
|
200 |
|
|
|
220 |
|
|
|
240 |
|
To validate the reaction mechanism and kinetics of urethane cleavage obtained in our computational study, we performed a urethane cleavage experiment as described in the Materials and Methods section. As already explained, we replaced MPC by methyl n‐(4‐pentylphenyl)carbamate (p‐C5‐MPC) in the experiment. The pentyl moiety in para position at the aromatic ring decreases the volatility of the urethane and the formed isocyanate and thus avoids unintended removal of the isocyanate from the reaction flask. The influence of the pentyl moiety on the reaction kinetics is expected to be negligible. Therefore, the rate constant determined by the p‐C5‐MPC cleavage experiment is directly compared to the value of predicted for the cleavage of MPC. The p‐C5‐MPC cleavage reaction was carried out in the solvent diphenyl ether at a reaction temperature of T=220°C with an initial amount of p‐C5‐MPC of 15 wt% (corresponding to an initial concentration of ∼1060 mol m−3). Regular measurements of the remaining p‐C5‐MPC concentration were performed. The obtained data points are shown in the concentration versus time plot in Figure 12 and provided in the supporting information.
Figure 12.
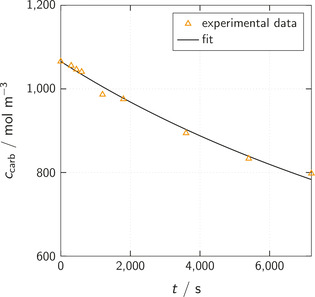
Concentration versus time plot for the cleavage reaction of methyl N‐(4‐pentylphenyl)carbamate (p‐C5‐MPC). The solid line represents a least squares fit to the experimental data points (triangles).
As a tautomer of the urethane group acts as auto‐catalyst in the cleavage reaction (Figure 11), the rate of p‐C5‐MPC depletion depends approximately with 2nd order on the p‐C5‐MPC concentration:
| (6) |
Here, the concentration of p‐C5‐MPC is denoted by and the elapsed time by t. The back reaction is neglected because the methanol formed in the cleavage reaction is very volatile and removed very fast from the reaction flask by the intense argon stream. Based on Equation (6), the expected time evolution of is described by:
| (7) |
Here, denotes the p‐C5‐MPC concentration at time t and at the beginning of the experiment. A least squares fit of Equation (7) with as fitting parameter yields k exp=4.7×10⁻⁸ m3 mol−1 s−1 with a coefficient of determination of . The fitted equation is also plotted as solid line in Figure 12. The predicted and experimental rate constants and agree within a factor of , which is significantly better than the estimated uncertainty of the prediction at T=220 °C of 4.4 (see Experimental section). Therefore, we are confident that the mechanism shown in Figure 11 with approximately 2nd‐order dependence of the reaction rate on the urethane concentration and catalysis by an isourethane is correct.
3. Conclusion
In this work, we present a computational study of urethane formation reactions as well as a combined computational and experimental study of urethane cleavage without added catalysts. Based on reaction mechanisms suggested in literature, we identified various transition states of urethane formation with ring structures for proton transport. We found both transition states for non‐catalytic reaction as well as for auto‐catalysis by the alcohol. Reaction kinetics computed based on transition state theory and advanced quantum chemical methods considering all identified transition states show quantitative agreement with experimental literature data within the expected accuracy.
Our investigation shows that in order to describe the kinetics over broad range of conditions and reaction media, it is important to consider both auto‐catalysis by 1 and by 2 additional alcohol molecules, corresponding to reaction via transition states with 6‐ and 8‐rings for proton transport, respectively. The reaction via transition states with 8‐rings seems to be dominant especially in non‐polar media and at high alcohol concentrations, whereas the reaction via transition states with 6‐ring contributes strongly in polar solvents and at low alcohol concentrations. The contribution of the completely non‐catalytic reaction to the overall observed rate of urethane formation turned out to be negligible.
For urethane cleavage, we identified different transition states for reaction with the urethane group or a tautomer thereof as auto‐catalyst. We found that the reaction with an isourethane as auto‐catalyst exhibits the lowest energetic barrier and computed reaction rate constants based on the according mechanism. For the purpose of validation, we performed a cleavage experiment and demonstrated the quantitative agreement of our computations with the kinetics observed experimentally. We are therefore confident that we identified the correct reaction mechanism of auto‐catalytic urethane cleavage.
We believe that the results of our study will be useful in the computer‐aided design and optimization of urethane formation and cleavage processes and that the insights regarding the mechanism of urethane cleavage are helpful in the interpretation of experimental data and the development of new catalysts.
Supporting Information
Experimental setup and details on HPLC measurements, experimental data from urethane cleavage experiment, details on conformer treatment, molecular geometries and energies obtained from quantum chemical calculations, experimental literature data and calculated rate constants for urethane formation, Arrhenius plots.
Conflict of interest
The authors declare no conflict of interest.
Supporting information
As a service to our authors and readers, this journal provides supporting information supplied by the authors. Such materials are peer reviewed and may be re‐organized for online delivery, but are not copy‐edited or typeset. Technical support issues arising from supporting information (other than missing files) should be addressed to the authors.
Supplementary
Acknowledgements
The authors thank the German Federal Ministry of Education and Research for funding the project Carbon2Polymers (03EK30442C). Furthermore, the authors are grateful to Dr. Leven and Dr. D. Firaha for valuable discussions. Simulations were performed with computing resources granted by RWTH Aachen University under projects rwth0284 and rwth0478.
C. Gertig, E. Erdkamp, A. Ernst, C. Hemprich, L. C. Kröger, J. Langanke, A. Bardow, K. Leonhard, ChemistryOpen 2021, 10, 534.
References
- 1.Z. Wirpsza in Polyurethanes: Chemistry, Technology – Applications, Ellis Horwood, New York, 1993.
- 2.S. Thomas, J. Datta, J. Haponiuk, A. Reghunadhan, in Polyurethane Polymers: Com- posites – Nanocomposites, Elsevier, Amsterdam, 2017.
- 3. Thiele L., Acta Polym. 1979, 30, 323–342. [Google Scholar]
- 4.C. Six, F. Richter, in Ullmann's Encyclopedia of Industrial Chemistry, Wiley Online Library, 2003.
- 5. Kaiser T., Rathgeb A., Gertig C., Bardow A., Leonhard K., Jupke A., Chem. Ing. Tech. 2018, 90, 1497–1503. [Google Scholar]
- 6. Leitner W., Franciò G., Scott M., Westhues C., Langanke J., Lansing M., Hussong C., Erdkamp E., Chem. Ing. Tech. 2018, 90, 1504–1512. [Google Scholar]
- 7. Wang P., Liu S., Deng Y., Chin. J. Chem. 2017, 35, 821–835. [Google Scholar]
- 8. Satchell D., Satchell R., Chem. Soc. Rev. 1975, 4, 231–250. [Google Scholar]
- 9. Baker J. W., Holdsworth J., J. Chem. Soc. 1947, 713–726. [Google Scholar]
- 10. Huang X. Y., Yu W., Sung C. S. P., Macromolecules 1990, 23, 390–398. [Google Scholar]
- 11. Thiele L., Monatsh. Chem. 1992, 123, 875–882. [Google Scholar]
- 12. Boufi S., Belgacem M. N., Quillerou J., Gandini A., Macromolecules 1993, 26, 6706–6717. [Google Scholar]
- 13. Cordeiro N., Belgacem M. N., Gandini A., Neto C. P., Ind. Crops Prod. 1997, 6, 163–167. [Google Scholar]
- 14. Raspoet G., Nguyen M. T., McGarraghy M., Hegarty A. F., J. Org. Chem. 1998, 63, 6878–6885. [DOI] [PubMed] [Google Scholar]
- 15. Eceiza A., Zabala J., Egiburu J., Corcuera M., Mondragon I., Pascault J., Eur. Polym. J. 1999, 35, 1949–1958. [Google Scholar]
- 16. Król P., Wojturska J., J. Appl. Polym. Sci. 2003, 88, 327–336. [Google Scholar]
- 17. Samuilov A. Y., Samuilov Y. D., Russ. J. Org. Chem. 2018, 54, 1749–1753. [Google Scholar]
- 18. Bailey M., Kirss V., Spaunburgh R., Ind. Eng. Chem. 1956, 48, 794–797. [Google Scholar]
- 19. Kogon I. C., J. Org. Chem. 1959, 24, 438–440. [Google Scholar]
- 20. Kaplan M., J. Chem. Eng. Data 1961, 6, 272–275. [Google Scholar]
- 21. Lovering E. G., Laidler K. J., Can. J. Chem. 1962, 40, 31–36. [Google Scholar]
- 22. Davis T. L., Farnum J. M., J. Am. Chem. Soc. 1934, 56, 883–885. [Google Scholar]
- 23. Baker J. W., Gaunt J., J. Chem. Soc. 1949, 19–24. [Google Scholar]
- 24. Dyer E., Taylor H. A., Mason S. J., Samson J., J. Am. Chem. Soc. 1949, 71, 4106–4109. [Google Scholar]
- 25. Lammiman S. A., Satchell R. S., J. Chem. Soc., Perkin Transact. 2 1972, 2300–2305. [Google Scholar]
- 26. Sivakamasundari S., Ganesan R., J. Org. Chem. 1984, 49, 720–722. [Google Scholar]
- 27. Xu L., Li C., Ng K. S., J. Phys. Chem. A 2000, 104, 3952–3957. [Google Scholar]
- 28. Yang P. F., Yu Y. H., Li T. D., Zhang M., Int. J. Polym. Anal. Charact. 2013, 18, 57–63. [Google Scholar]
- 29. Karpov S. V., Lodygina V. P., Komratova V. V., Dzhalmukhanova A. S., Malkov G. V., Badamshina E. R., Kinet. Catal. 2016, 57, 319–325. [Google Scholar]
- 30. Karpov S. V., Lodygina V. P., Komratova V. V., Dzhalmukhanova A. S., Malkov G. V., Badamshina E. R., Kinet. Catal. 2016, 57, 422–428. [Google Scholar]
- 31. López C. O. C., Fejes Z., Viskolcz B., J. Flow Chem. 2019, 9, 199–204. [Google Scholar]
- 32. Nagy L., Juhász A., Zsuga M., Kéki S., eXPRESS Polym. Lett. 2020, 14, 336–347. [Google Scholar]
- 33. Ephraim S., Woodward A., Mesrobian R., J. Am. Chem. Soc. 1958, 80, 1326–1328. [Google Scholar]
- 34. Oberth A. E., Bruenner R. S., J. Phys. Chem. 1968, 72, 845–855. [Google Scholar]
- 35. Kössl F., Lisaj M., Kozich V., Heyne K., Kühn O., Chem. Phys. Lett. 2015, 621, 41–45. [Google Scholar]
- 36. Entelis S. G., Nesterov O. V., Russ. Chem. Rev. 1966, 35, 917–930. [Google Scholar]
- 37. Samuilov A. Y., Zenitova L. A., Samuilov Y. D., Konovalov A. I., Russ. J. Org. Chem. 2008, 44, 1316. [Google Scholar]
- 38. Cheikh W., Rózsa Z. B., Camacho López C. O., Mizsey P., Viskolcz B., Szöri M., Fejes Z., Polymer 2019, 11, 1543. [DOI] [PMC free article] [PubMed] [Google Scholar]
- 39. Cysewski P., Król P., Shyichuk A., Macromol. Theory Simul. 2007, 16, 541–547. [Google Scholar]
- 40.P. Atkins, R. Friedman, in Molecular Quantum Mechanics, Oxford University Press, Oxford, 2011.
- 41. Stephens P., Devlin F., Chabalowski C., Frisch M. J., J. Phys. Chem. 1994, 98, 11623–11627. [Google Scholar]
- 42. Barone V., Cossi M., J. Phys. Chem. A 1998, 102, 1995–2001. [Google Scholar]
- 43. Wang X., Hu W., Gui D., Chi X., Wang M., Tian D., Liu J., Ma X., Pang A., Bull. Chem. Soc. Jpn. 2013, 86, 255–265. [Google Scholar]
- 44. Samuilov A. Y., Zenitova L. A., Samuilov Y. D., Konovalov A. I., Russ. J. Org. Chem. 2009, 45, 68–73. [Google Scholar]
- 45. Samuilov A. Y., Balabanova F. B., Kamalov T. A., Samuilov Y. D., Konovalov A. I., Russ. J. Org. Chem. 2010, 46, 1452–1460. [Google Scholar]
- 46. Samuilov A. Y., Balabanova F. B., Samuilov Y. D., Konovalov A. I., Russ. J. Org. Chem. 2012, 48, 164–174. [Google Scholar]
- 47. Samuilov A. Y., Balabanova F. B., Samuilov Y. D., Konovalov A. I., Russ. J. Org. Chem. 2012, 48, 1512–1517. [Google Scholar]
- 48. Samuilov A. Y., Nesterov S. V., Balabanova F. B., Samuilov Y. D., Konovalov A. I., Russ. J. Org. Chem. 2013, 49, 968–973. [Google Scholar]
- 49. Samuilov A. Y., Nesterov S. V., Balabanova F. B., Samuilov Y. D., Konovalov A. I., Russ. J. Org. Chem. 2014, 50, 155–159. [Google Scholar]
- 50. Samuilov A. Y., Kamalov T. A., Balabanova F. B., Samuilov Y. D., Konovalov A. I., Russ. J. Org. Chem. 2012, 48, 158–163. [Google Scholar]
- 51. amuilov A. Y., Balabanova F. B., Samuilov Y. D., Konovalov A. I., Russ. J. Org. Chem. 2013, 49, 22–27. [Google Scholar]
- 52. Çoban M., Konuklar F. A. S., Comput. Theor. Chem. 2011, 963, 168–175. [Google Scholar]
- 53. Curtiss L. A., Redfern P. C., Raghavachari K., J. Chem. 2007, 127, 124105. [DOI] [PubMed] [Google Scholar]
- 54. Marenich A. V., Cramer C. J., Truhlar D. G., J. Phys. Chem. B 2009, 113, 6378–6396. [DOI] [PubMed] [Google Scholar]
- 55. Brønsted J. N., Z. Phys. Chem. 1922, 102, 169–207. [Google Scholar]
- 56. Bjerrum N., Z. Phys. Chem. 1924, 108, 82–100. [Google Scholar]
- 57. Eyring H., J. Chem. Phys. 1935, 3, 107–115. [Google Scholar]
- 58. Vereecken L., Glowacki D. R., Pilling M. J., Chem. Rev. 2015, 115, 4063–4114. [DOI] [PubMed] [Google Scholar]
- 59.P. Atkins, J. de Paula, in Physical Chemistry, Oxford University Press, Oxford, 2010.
- 60. Grimme S., J. Chem. Phys. 2006, 124, 034108. [DOI] [PubMed] [Google Scholar]
- 61. Zheng J., Zhao Y., Truhlar D. G., J. Chem. Theory Comput. 2009, 5, 808–821. [DOI] [PubMed] [Google Scholar]
- 62. Gottschalk H. C., et al., J. Chem. Phys. 2018, 148, 014301. [DOI] [PubMed] [Google Scholar]
- 63.M. J. Frisch, et al., Gaussian 09, Revision D.01. 2013.
- 64.J. B. Foresman, A. E. Frisch, in Exploring Chemistry with Electronic Structure Methods, Gaussian, Inc., Wallingford, 2015.
- 65. Riplinger C., Neese F., J. Chem. Phys. 2013, 138, 034106. [DOI] [PubMed] [Google Scholar]
- 66. Riplinger C., Sandhoefer B., Hansen A., Neese F., J. Chem. Phys. 2013, 139, 134101. [DOI] [PubMed] [Google Scholar]
- 67. Neese F., Wiley Interdiscip. Rev.: Comput. Mol. Sci. 2018, 8, e1327. [Google Scholar]
- 68.I. Funes-Ardoiz, R. S. Paton, GoodVibes: GoodVibes 2.0.3., 2018; DOI: 10.5281/zen- odo.595246.
- 69. Grimme S., Chem. Eur. J. 2012, 18, 9955–9964. [DOI] [PubMed] [Google Scholar]
- 70. Peters M., Greiner L., Leonhard K., AIChE J. 2008, 54, 2729–2734. [Google Scholar]
- 71. Deglmann P., Müller I., Becker F., Schäfer A., Hungenberg K.-D., Weiß H., Macromol. React. Eng. 2009, 3, 496–515. [Google Scholar]
- 72. Coote M. L., Macromol. Theory Simul. 2009, 18, 388–400. [Google Scholar]
- 73. Hellweg A., Eckert F., AIChE J. 2017, 63, 3944–3954. [Google Scholar]
- 74. Gertig C., Kröger L. C., Fleitmann L., Scheffczyk J., Bardow A., Leonhard K., Ind. Eng. Chem. Res. 2019, 58, 22835–22846. [Google Scholar]
- 75. Klamt A., J. Phys. Chem. 1995, 99, 2224–2235. [Google Scholar]
- 76. Klamt A., Jonas V., Bürger T., Lohrenz J. C., J. Phys. Chem. A 1998, 102, 5074–5085. [Google Scholar]
- 77. Klamt A., Eckert F., Arlt W., Annu. Rev. Chem. Biomol. Eng. 2010, 1, 101–122. [DOI] [PubMed] [Google Scholar]
- 78. Ahlrichs R., Bär M., Häser M., Horn H., Kölmel C., Chem. Phys. Lett. 1989, 162, 165–169. [Google Scholar]
- 79.TURBOMOLE V7.0.1 2015, Development of University of Karlsruhe and Forschungszentrum Karlsruhe GmbH. http://www.turbomole.com.
- 80. Becke A. D., Phys. Rev. A 1988, 38, 3098. [DOI] [PubMed] [Google Scholar]
- 81. Perdew J. P., Phys. Rev. B 1986, 33, 8822. [DOI] [PubMed] [Google Scholar]
- 82. Perdew J. P., Phys. Rev. B 1986, 34, 7406. [PubMed] [Google Scholar]
- 83. Klamt A., Schüürmann G., J. Chem. Soc. Perkin Trans. 2 1993, 799–805. [Google Scholar]
- 84.COSMOtherm, C3.0, release 1701, COSMOlogic GmbH & Co KG, Leverkusen. http: //www.cosmologic.de.
- 85. Eckert F., Klamt A., AIChE J. 2002, 48, 369–385. [Google Scholar]
- 86. Kröger L. C., Kopp W. A., Leonhard K., J. Phys. Chem. B 2017, 121, 2887–2895. [DOI] [PubMed] [Google Scholar]
- 87. Ghysels A., Verstraelen T., Hemelsoet K., Waroquier M., van Speybroeck V., J. Chem. Inf. Model. 2010, 50, 1736–1750. [DOI] [PubMed] [Google Scholar]
- 88. Eckart C., Phys. Rev. 1930, 35, 1303–1309. [Google Scholar]
- 89. Fernández-Ramos A., Ellingson B. A., Meana-Panẽda R., Marques J. M., Truhlar D. G., Theor. Chem. Acc. 2007, 118, 813–826. [Google Scholar]
- 90.T. M. Letcher, in Development and Applications in Solubility, Royal Society of Chemistry, Cambridge, 2007.
- 91.W. Dahmen, A. Reusken, Numerik für Ingenieure und Naturwissenschaftler, Springer, Berlin, 2006.
- 92.A. Ernst, Diploma Thesis, RWTH Aachen University, 2014.
Associated Data
This section collects any data citations, data availability statements, or supplementary materials included in this article.
Supplementary Materials
As a service to our authors and readers, this journal provides supporting information supplied by the authors. Such materials are peer reviewed and may be re‐organized for online delivery, but are not copy‐edited or typeset. Technical support issues arising from supporting information (other than missing files) should be addressed to the authors.
Supplementary


