

Abstract
Glucose-stimulated insulin secretion (GSIS) is regulated by calcium (Ca2+) entry into pancreatic β-cells through voltage-dependent Ca2+ (CaV) channels. Tetraspanin (TSPAN) transmembrane proteins control Ca2+ handling, and thus they may also modulate GSIS. TSPAN-7 is the most abundant islet TSPAN and immunostaining of mouse and human pancreatic slices shows that TSPAN-7 is highly expressed in β- and α-cells; however, the function of islet TSPAN-7 has not been determined. Here, we show that TSPAN-7 knockdown (KD) increases glucose-stimulated Ca2+ influx into mouse and human β-cells. Additionally, mouse β-cell Ca2+ oscillation frequency was accelerated by TSPAN-7 KD. Because TSPAN-7 KD also enhanced Ca2+ entry when membrane potential was clamped with depolarization, the effect of TSPAN-7 on CaV channel activity was examined. TSPAN-7 KD enhanced L-type CaV currents in mouse and human β-cells. Conversely, heterologous expression of TSPAN-7 with CaV1.2 and CaV1.3 L-type CaV channels decreased CaV currents and reduced Ca2+ influx through both channels. This was presumably the result of a direct interaction of TSPAN-7 and L-type CaV channels because TSPAN-7 coimmunoprecipitated with both CaV1.2 and CaV1.3 from primary human β-cells and from a heterologous expression system. Finally, TSPAN-7 KD in human β-cells increased basal (5.6 mM glucose) and stimulated (45 mM KCl + 14 mM glucose) insulin secretion. These findings strongly suggest that TSPAN-7 modulation of β-cell L-type CaV channels is a key determinant of β-cell glucose-stimulated Ca2+ entry and thus the set-point of GSIS.
Keywords: calcium handling, insulin secretion, pancreatic β-cell, tetraspanin-7, voltage-dependent calcium channel
Introduction
Glucose-stimulated insulin secretion (GSIS) from pancreatic β-cells serves a critical role in maintaining glucose homeostasis and preventing hyperglycaemia (Prentki & Matschinsky, 1987; Rhodes & White, 2002; Röder et al. 2016). It is well established that calcium (Ca2+) influx into β-cells, primarily through L-type voltage-dependent Ca2+ (CaV) channels (e.g. CaV1.2 and CaV1.3), is required for GSIS (Curry et al. 1968; MacDonald et al. 2005; Rorsman et al. 2012; Reinbothe et al. 2013). Glucose metabolism increases the β-cell ATP:ADP ratio leading to closure of ATP-sensitive K+ (KATP) channels; the resulting membrane potential (Vm) depolarization activates β-cell CaV channels. Although CaV channel α1-subunits contain the pore-forming domain and voltage sensing domain (VSD), interactions with auxiliary proteins greatly affect channel surface expression, voltage gating, as well as activation/inactivation kinetics (Hofmann et al. 1999; Catterall, 2011; Dolphin, 2016). Thus, β-cell CaV auxiliary protein composition governs CaV channel control of Ca2+ handling and insulin secretion. Furthermore, CaV auxiliary protein expression patterns are altered during conditions of glucolipotoxicity, which contributes to perturbations in islet Ca2+ oscillations and pulsatile insulin secretion (Mastrolia et al. 2017; Lee et al. 2018; Luan et al. 2019). Although it is clear that CaV auxiliary proteins serve an important role in tuning insulin secretion, the identity and function of these channel subunits is incompletely understood.
The tetraspanin superfamily of transmembrane proteins includes key regulators of CaV channel function (Andronache et al. 2007; Chen et al. 2007; Wu et al. 2015; Luan et al. 2019). The tetraspanin superfamily is categorized by the presence of four transmembrane domains (Charrin et al. 2014; Termini & Gillette, 2017). Two extracellular domains result from this structural architecture; disulphide bonding between cysteine residues in the larger extracellular domain play a prominent role in determining protein structure and function, as well as facilitating formation of tetraspanin-enriched signalling microdomains (Charrin et al. 2014; Termini & Gillette, 2017). In addition, the intracellular N- and C-termini of tetraspanin proteins can facilitate protein–protein interactions, as well as guide intracellular trafficking (Charrin et al. 2014; Termini & Gillette, 2017). One prominent tetraspanin subgroup comprises the CaV γ-subunits (encoded by CACNG1-8), which control CaV channel activation and inactivation kinetics through interactions with channel VSDs (Andronache et al. 2007; Chen et al. 2007; Sandoval et al. 2007; Wu et al. 2015; Luan et al. 2019). Of these, CaVγ4 is expressed in β-cells where it increases GSIS by enhancing L-type CaV channel activity (Luan et al. 2019). Another subgroup of tetraspanin proteins, explicitly designated as TSPANs (encoded by TSPAN1-33) like CaV γ-subunits influence Ca2+ handling via interactions with CaV channels (Kahle et al. 2011; Mallmann et al. 2013). For example, TSPAN-13 interacts with the VSD of CaV2.2 leading to acceleration of activation and inactivation kinetics (Mallmann et al. 2013). However, the roles of TSPANs in controlling islet Ca2+ handling and hormone secretion have not been investigated.
TSPAN7 is the most abundant TSPAN transcript in mouse and human islets and is highly expressed in all major islet cell types (i.e. α-, β and δ-cells) (Blodgett et al. 2015; DiGruccio et al. 2016; Segerstolpe et al. 2016). Additionally, antibody-based proteomics have identified TSPAN-7 as a surface marker of mature pancreatic endocrine cells (Lindskog et al. 2010; Hald et al. 2012). Although many TSPAN proteins are ubiquitously expressed, TSPAN-7 protein is primarily restricted to islets and a subset of neurons (Uhlén et al. 2015). Although RNA sequencing of human islets suggests that TSPAN7 transcript is not altered during diabetic conditions (i.e. palmitate treatment, low grade inflammatory cytokine exposure) (Eizirik et al. 2012; Cnop et al. 2014), after 16 weeks on a high-fat diet, TSPAN-7 protein was reduced in the islets of non-obese diabetic and New Zealand obese mice compared to C57Bl6 wild-type animals (Mitok et al. 2018). Therefore, it is possible that expression of human TSPAN-7 is regulated post-transcriptionally or post-translationally during diabetes pathogenesis. Interestingly, autoantibodies against TSPAN-7 have been identified in type 1 diabetic serum and are predictive of deteriorating β-cell function during latent autoimmune iabetes in adults (LADA), linking TSPAN-7 and diabetes (McLaughlin et al. 2016; Walther et al. 2016; Shi et al. 2019). Moreover, a protein interaction study has shown that TSPAN-7 may interact with CaV channels (CaV2.1), and thus it is possible that TSPAN-7 modulates islet CaV channel function (Kahle et al. 2011). Taken together, these findings indicate that TSPAN-7 may control islet Ca2+ handling and hormone secretion.
Here, to the best of our knowledge, we show for the first time that TSPAN-7 is an auxiliary protein of β-cell L-type CaV1.2 and CaV1.3 channels, which reduces glucose-stimulated Ca2+ influx, decelerates Ca2+ oscillation frequency, and limits basal and glucose-stimulated insulin secretion. L-type CaV channel interactions with TSPAN-7 decreased the Ca2+ conductance of both CaV1.2 and CaV1.3 channels. TSPAN-7 also reduced the rate of CaV1.3 channel inactivation, slowed CaV1.2 channel activation and sped up CaV1.2 channel recovery from voltage-dependent inactivation (VDI). Because TSPAN-7 interacted with both CaV1.2 and CaV1.3 channels but did not influence channel surface localization, TSPAN-7 probably directly modulates channel function. Thus, these findings suggest that TSPAN-7 control of CaV channel activity serves a key role in controlling β-cell Ca2+ handling and defining the set-point of insulin secretion during periods of secretagogue stimulation.
Methods
Ethical approval
All mice were 12–18-week old, age-matched males on a C57Bl6/J background that were bred in-house (Stock #: 000664; The Jackson Laboratory, Bar Harbor, ME, USA). Animals were housed in a Vanderbilt University Institutional Animal Care and Use Committee (IACUC) approved facility under a 12:12 h light/dark cycle with access to water and standard chow (5L0D; Lab Diets, St Louis, MO, USA) ad libitum. All experiments were carried out in accordance with guidelines established by the Vanderbilt University IACUC and conform to the principles and regulations for the use of animals outlined in Grundy et al. (2015). As approved in IACUC protocol #M1600063-01 (SOP.AWEL.01), mice were humanely euthanized by cervical dislocation followed by exsanguination by experienced personnel; to preserve islet ion channel function mice were not treated with anaesthesia (IACUC protocol #M1600063-01; SOP.AWEL.01).
All studies detailed here were approved by the Vanderbilt University Health Sciences Committee Institutional Review Board (IRB# 110164). Healthy human islets were provided from multiple isolation centers by the Integrated Islet Distribution Program (IIDP). Deidentified human donor information is provided in Table 1. The IIDP obtained informed consent for deceased donors in accordance with NIH guidelines prior to reception of human islets for our studies.
Table 1.
Summary of human islet donor information
| RRID | Age (years) |
Sex | BMI | Assay performed |
|---|---|---|---|---|
| SAMN08611211 | 45 | F | 29.8 | KDE |
| SAMN08617638 | 49 | M | 34.0 | KDE |
| SAMN08744571 | 32 | M | 32.3 | KDE; IS |
| SAMN08799544 | 45 | F | 32.1 | IS |
| SAMN08971735 | 50 | M | 32.3 | IS |
| SAMN09001166 | 42 | F | 32.1 | KDE |
| SAMN09768368 | 56 | F | 26.6 | IS |
| SAMN09929594 | 51 | F | 29.7 | IS |
| SAMN10023853 | 25 | F | 33.5 | IS |
| SAMN10176536 | 49 | M | 28.2 | IS |
| SAMN10252228 | 55 | F | 35.7 | IS |
| SAMN11250012 | 57 | F | 29.2 | CR |
| SAMN11476721 | 50 | M | 32.8 | CI |
| SAMN11522709 | 51 | M | 26.7 | CI |
| SAMN11578698 | 57 | M | 25.8 | CR; CI |
| SAMN11864195 | 53 | F | 40.0 | CR |
| SAMN12011371 | 33 | M | 33.2 | CR |
| SAMN12227196 | 51 | M | 32.8 | CR |
| SAMN13067487 | 57 | M | 21.3 | CoIP |
| SAMN13108021 | 42 | M | 25.0 | CoIP |
| SAMN13134368 | 62 | M | 31.3 | CoIP |
| SAMN14121359 | 64 | F | 17.5 | CI |
BMI, body mass index; KDE, TSPAN-7 shRNA knockdown efficiency; IS, insulin secretion; CR, CaV current recording; CI, intracellular Ca2+ imaging; CoIP, TSPAN-7 coimmunoprecipatation.
Chemicals and reagents
Unless otherwise noted all chemicals and reagents were purchased from Sigma-Aldrich (St Louis, MO, USA) or Thermo-Fisher (Waltham, MA, USA). DNA plasmids expressing CaV1.2 α1-HA, CaV1.3 α1-HA, CaVβ2A and CaVα2δ1 were provided by the laboratory of Roger Colbran (Wang et al. 2017 b,c). The DNA plasmid expressing TSPAN-7-pIRES-EGFP was provided by the laboratory of Maria Passafaro (Bassani et al. 2012). A stable cell line with tetracycline-inducible Kir6.2/SUR1 expression was provided by the laboratory of Jerod Denton (Raphemot et al. 2014).
Islet isolation and cell culture
Mouse pancreata were digested with collagenase P (Roche; Basel, Switzerland) and islets were isolated using density gradient centrifugation as described previously (Vierra et al. 2015; Dickerson et al. 2017; Dickerson et al. 2018). Mouse islets were dispersed into single cells by titrating in 0.005% trypsin or maintained as whole islets. Human islets were dispersed into single cells by gently titrating in Accutase™ (Innovative Cell Technologies, Inc., San Diego, CA, USA) for 2 min at 37°C or maintained as whole islets. Whole mouse islets and dispersed mouse islet cells were cultured in RPMI-1640 medium (RPMI) with 11 mM glucose supplemented with 15% fetal bovine serum (FBS), 100 IU · ml−1 penicillin and 100 mg · ml−1 streptomycin at 37°C, 5% CO2. Whole human islets and dispersed human islet cells were also cultured in RPMI with 5.6 mM glucose.
Generation of TSPAN-7 small hairpin RNA (shRNA) lentiviruses
Binding domains in the coding sequence of TSPAN-7 predicted to facilitate small interfering RNA-mediated gene silencing were identified and utilized to produce third-generation lentiviral plasmids that express shRNAs targeted toward mouse TSPAN-7 (mTSPAN-7shRNA: GCTGACTTTGGGAACCTATAT), human TSPAN-7 (hTSPAN-7shRNA 1: ACTTACTCTGGGCACCTATAT, hTSPAN-7shRNA 2: GTAAATGCCACACACCTTTAA, hTSPAN-7shRNA 3: GTTAACCAGAAGGGTTGTTAT), or a scramble shRNA with no mouse or human target (CCTAAGGTTAAGTCGCCCTCG) driven by a U6 promoter as well as an mCherry fluorescent reporter driven by a hPGK promoter (VectorBuilder, Chicago, IL, USA). A GCaMP6s fluorescent Ca2+ indicator driven by an optimized rat insulin promoter was cloned into a third-generation lentiviral plasmid (RIP-GCaMP6s) (Chen et al. 2013; Wang et al. 2017a). HEK293FT cells were grown to 80% confluence in T175 tissue cultures flasks in Dulbecco’s modified Eagle’s medium GlutaMax-I (Thermo Fisher) supplemented with 10% FBS, 100 IU·ml−1 penicillin and 100 mg·ml−1 streptomycin (DMEM) at 37°C, 5% CO2. On the day of transfection, media was replaced with 25 mL of antibiotic free DMEM supplemented with 10% heat inactivated FBS. Cells were transfected with the following DNA plasmids utilizing calcium phosphate transfection in the presence of 70 μM chloroquine at 37°C, 5% CO2: 53.5 μg of lentivirus plasmid, 40.5 μg of psPAX2 lentivirus packaging plasmid (plasmid #: 12 260; Addgene; Watertown, MA, USA) and 16.2 μg of pMD2.G lentivirus envelope plasmid (plasmid #: 12 259; Addgene). After 6 h, transfection mixtures were replaced with 25 mL of fresh DMEM and transfected cells were cultured for 48 h at 37°C, 5% CO2. Lentivirus-containing media was then collected, centrifuged at 300 × g for 5 min, and filtered through 0.45 μm filters to remove cell debris. Lentiviruses were purified with PEG-it™ Virus Precipitation Solution (System Biosciences, Mountain View, CA, USA) for 48 h at 4°C in accordance with the manufacturer’s instructions. Purified lentiviruses were resuspended in 250 μL of DMEM containing 25 mM HEPES buffer, aliquoted and stored at −80°C. To confirm the efficacy of lentiviral shRNA-mediated TSPAN-7 knockdown (KD), 300 mouse or human islets were dispersed into single cells, transduced for 6 h (5 μL of lentivirus stock, 0.008 mg·mL−1 polybrene, 100 μL of FBS-free RPMI), and cultured for 48 h in RPMI with 11 mM glucose (5.6 mM glucose for human islet cells). Mouse and human islet cell lysates were isolated and resolved on a nitrocellulose membrane. Immunoblots were probed with rabbit anti-TSPAN-7 (dilution 1:200; catalogue no. NBP1-90310; Novus, Phoenix, AZ, USA) and TSPAN-7 protein bands visualized with anti-rabbit HRP-conjugated secondary (dilution 1:2500; catalogue no. 711-036-152; Jackson ImmunoResearch Laboratories, West Grove, PA, USA) and SuperSignal™ Femto Substrate (Thermo Fisher) utilizing a ChemiDoc Imaging System (Bio-Rad, Hercules, CA, USA). Immunoblots were stripped, probed with mouse anti-α-tubulin (dilution 1:1000; catalogue no. A11126; Thermo Fisher) and α-tubulin protein bands visualized with anti-mouse HRP-conjugated secondary (dilution 1:2500; catalogue no. 715-036-150; Jackson ImmunoResearch Laboratories) and SuperSignal™ Femto Substrate.
Immunofluorescence imaging
Paraffin-embedded mouse and human pancreas sections were processed and probed as previously described (Vierra et al. 2015; Dickerson et al. 2017; Vierra et al. 2017). Rehydrated pancreas sections were stained with primary antibodies (dilution 1:300 guinea pig anti-insulin (Dako, Santa Clara, CA, USA) or rat anti-C-peptide (dilution 1:200; catalogue no. GN-ID4; DSHB; Iowa City, IA, USA), mouse anti-glucagon (dilution 1:200; ab10988; Abcam, Cambridge, MA, USA) and rabbit anti-TSPAN-7 (dilution 1:200; catalogue no. NBP1-90310; Novus, Phoenix, AZ, USA)) followed by secondary antibodies (dilution 1:500 anti-guinea pig or anti-rat Alexa Fluor 488, dilution 1:500 anti-mouse Alexa Fluor 647, and 1:500 anti-rabbit Alexa Fluor 546). Mouse islets were dispersed, transduced with lentiviral shRNAs for 6 h, and cultured for 72 h at 37°C, 5% CO2. Transduced mouse islet cells were fixed on ice with 4% paraformaldehyde in PBS for 20 min then stained with rabbit anti-TSPAN-7 (dilution 1:200) followed by anti-rabbit Alexa Fluor 650 (dilution 1:500). Immunofluorescence images were collected with a LSM 780 multiphoton confocal microscope (Carl Zeiss, Oberkochen, Germany), a LSM 880 confocal microscope with AIRY scan (Carl Zeiss) (both equipped with Zeiss Zen software; 20× and 63× magnification), or a Ti2 epifluorescence microscope (Nikon, Yokyo, Japan) equipped with a Prime 95B camera (Teledyne Photometrics, Tucson, AZ, USA) with 25 mm complementary metal oxide semi-conductor sensors and Elements software (Nikon) (20× magnification; Nikon Ti2 microscope).
Intracellular Ca2+ imaging
Mouse and human islets or partially dispersed mouse islet clusters (100–200 cells) were transduced with lentiviral shRNAs for 6 h then cultured in RPMI with 11 mM glucose (5.6 mM for human islets) for 48 h at 37°C, 5% CO2. Human islets were cotransduced with lentiviral RIP-GCaMP6s. Mouse islets were loaded with 10 μM Cal-630 or Cal 520 (AAT Bioquest; Sunnyvale, CA) for 1 h before the start of an experiment. Mouse islet clusters were loaded with 2 μM Fura-2 AM for 30 min before the start of an experiment. Islets and islet clusters were incubated in RPMI with 2 mM glucose for 30 min then washed and perifused with Krebs-Ringer HEPES buffer (KRHB) containing (mM) 119.0 NaCl, 4.7 KCl, 2.0 CaCl2, 1.2 MgSO4, 1.2 KH2PO4, and 10.0 HEPES (pH 7.35 adjusted by NaOH) supplemented with 2 mM glucose. β-cell glucose-stimulated Ca2+ influx was triggered with KRHB containing the glucose concentrations indicated in figure legends. Human islet KATP channels were subsequently activated with KRHB supplemented with 125 μM diazoxide and Vm depolarized using KRHB containing 45 mM KCl to investigate KATP independent TSPAN-7 effects on β-cell Ca2+ handling. Transduced mouse β-cells were identified by mCherry fluorescence; transduced human β-cells were identified by a combination of mCherry and GCaMP6s fluorescence. Mouse β-cell Cal-630 fluorescence was measured every 5 s as an indicator of intracellular Ca2+ using the Nikon Ti2 microscope. Human β-cell GCaMP6s fluorescence was measured every 5 s as an indicator of intracellular Ca2+ using a Zeiss Observer Z1 confocal microscope equipped with a Yokogawa CSU-X1 spinning disk head and PerkinElmer Volocity software.
HEK293 cells were grown to 80% confluence in 35 mm tissue culture dishes then transfected for 24 h with the following DNA plasmids utilizing lipofectamine 3000: 625 ng CaV1.2 α1 (plasmid #: 26572; Addgene), 625 ng CaV β2A, 625 ng CaV α2δ1, and 625 ng TSPAN-7-pIRES-EGFP or pIRES-EGFP (catalogue no. 6029-1; Takara Bio USA; Mountain View, CA). As CaV1.3 channels undergo VDI at the resting Vm of HEK293 cells (~ −50 mV), a stable cell line with tetracycline inducible TALK1 K2P leak channels (T3H16) was utilized to tonically hyperpolarize Vm and thus enhance CaV1.3 activity (Dickerson et al. 2017). T3H16 cells were transfected for 24 h with the following DNA plasmids utilizing lipofectamine 3000:625 ng CaV1.3 α1 (plasmid #: 49 333; Addgene), 625 ng CaV β2A, 625 ng CaV α2δ1, and 625 ng TSPAN-7-pIRES-EGFP or pIRES-EGFP. Transfected cells were dispersed into single cells and cultured overnight in DMEM (T3H16 culture media was supplemented with 1 μg·ml−1 tetracycline to induce TALK-1 expression) at 37°C, 5% CO2. Cells were loaded with 10 μM Cal-590 (AAT Bioquest) for 1 h then washed and perifused with buffer containing (mM) 150.0 NaCl, 5.0 KCl, 2.5 CaCl2, 2.0 MgCl2, 10.0 HEPES, and 10.0 glucose (pH 7.35 adjusted by NaOH) until Cal-590 fluorescence signal stabilized. The cells were then perifused for at least 10 min with buffer containing (mM) 105.0 NaCl, 50.0 KCl, 2.5 CaCl2, 2.0 MgCl2, 10.0 HEPES, and 10.0 glucose (pH 7.35 adjusted by NaOH) to stimulate Ca2+ influx through CaV channels. Transfected cells were identified by green fluorescent protein (GFP) fluorescence and Cal-590 fluorescence was measured every 5 s as an indicator of intracellular Ca2+ with the Nikon Ti2 microscope.
Whole-cell patch clamp electrophysiology
Mouse and human islets were dispersed into single cells, transduced with lentiviral shRNAs for 6 h (human islet cells were cotransduced with lentiviral RIP-GCaMP6s to identify β-cells) and cultured for 48 h. Patch electrodes (3–4 MΩ) utilized for CaV current recordings were backfilled with intracellular solution containing (mM) 132.0 CsCl, 10.0 tetraethylammonium chloride (TEA-Cl), 10.0 EGTA, 3.0 Na-ATP and 5.0 HEPES (pH 7.25 adjusted by CsOH). Mouse and human β-cells were patched in KRHB; after a whole-cell configuration was established (seal resistance >1 GΩ) the bath was exchanged for buffer containing (mM) 82.0 NaCl, 5.0 CsCl, 30.0 CaCl2, 1.0 MgCl2, 0.1 EGTA, 20.0 TEA-Cl, 0.1 tolbutamide and 17.0 glucose (pH 7.35 with NaOH). Mouse and human β-cells were perifused with this solution for 3 min prior to measuring CaV currents. A whole-cell patch clamp technique was utilized to record CaV currents in single β-cells using an Axopatch 200B amplifier with pCLAMP10 software (Molecular Devices, Sunnyvale, CA, USA). Sequential 10 mV steps ranging from −60 to 70 mV (500 ms) were applied from a holding potential of −80 mV to generate CaV currents; linear leak currents were subtracted using a P/4 protocol. The L-type CaV channel inhibitor isradipine (10 μM) was perifused into the bath solution and isradipine-insensitive currents were subtracted from total CaV currents to determine mouse and human β-cell L-type CaV currents.
HEK293 cells were grown to 80% confluence in 35 mm tissue culture dishes then transfected with the DNA plasmids utilizing lipofectamine 3000 and cultured for 24 h at 37°C, 5% CO2: 625 ng CaV1.2 α1 or CaV 1.3 α1, 625 ng CaV β2A, 625 ng CaV α2δ1, and 625 ng TSPAN-7-pIRES-EGFP or pIRES-EGFP. Alternatively, a cell line with stable expression of SUR1 and tetracycline-inducible Kir6.2 expression (functional KATP channels) was transfected with 2500 ng of TSPAN-7-pIRES-EGFP or pIRES-EGFP (Raphemot et al. 2014). Cells were dispersed and cultured for 24 h in DMEM at 37°C, 5% CO2 prior to an experiment. Culture media was supplemented with 1 μg·ml−1 tetracycline to induce Kir6.2 expression for KATP current recordings. Cells utilized for CaV current recordings were patched in extracellular solution containing (mM) 112.0 NaCl, 5.0 CsCl, 10.0 CaCl2, 1.0 MgCl2, 10.0 HEPES, 5.0 glucose and 20.0 TEA-Cl (pH 7.35 adjusted by NaOH) and current densities through heterologously expressed CaV channels were measured as a function of Vm. Maximum CaV current traces (CaV1.2max acquired at 10 mV; CaV1.3max acquired at −20 mV) were divided into an activation phase (e.g. period of increasing current) and an inactivation phase (e.g. period of decreasing current). CaV current activation curves were fit to a model of one-phase exponential association (Eqn (1)) and CaV current inactivation curves were fit to a model of one-phase exponential decay (Eqn (2)) using Prism, version 8 (GraphPad Software Inc., San Diego, CA, USA), then the associated kinetic parameters determined. Iact (pA/pF) is current density as a function of time during CaV channel activation, I0 (pA/pF) indicates CaV current density at time equal to zero, plateau (pA/pF) refers to a steady state CaV current density as time approaches infinity, Kact (s−1) is the CaV channel activation rate constant, Iinact (pA/pF) is current density as a function of time during CaV channel inactivation, Kinact (s−1) is the CaV channel inactivation rate constant and t (s) is time.
| (1) |
| (2) |
Patch electrodes employed for KATP current recordings were backfilled with intracellular solution containing (mM) 140.0 KCl, 0.5 MgCl2, 10.0 EGTA, 0.1 Mg-ATP and 5.0 HEPES (pH 7.25 adjusted with KOH). Cells utilized for KATP current recordings were patched in KRHB. Immediately after a whole-cell configuration was established currents were recorded every 15 s as a function of Vm utilizing a voltage ramp from −120 mV to 60 mV (Vierra et al. 2015; Dickerson et al. 2017; Dickerson et al. 2018). This voltage clamp protocol was continued until intracellular ATP equilibrated with ATP in the recording pipette (0.1 mM Mg-ATP) and thus maximum whole-cell currents were reached. KATP currents activated by a reduction in intracellular ATP were calculated by subtracting initial current traces from maximum current traces. Finally, VDI of heterologously expressed CaV channels was evaluated by applying sequential 10 mV prepulse steps ranging from −80 to 10 mV (5 s), then measuring the magnitude of CaV currents (CaV1.2max at 10 mV; CaV1.3max at −20 mV).
Coimmunoprecipitation of TSPAN-7 with L-type CaV channels
Cell lysates were isolated from healthy human islets, combined with 5 μg·ml−1 rabbit anti-CaV1.2 (catalogue no. ACC-003; knockout (KO) validated (Jeon et al. 2010); Alomone Labs, Jerusalem, Israel) or rabbit anti-CaV1.3 (catalogue no. ACC-005; KO validated (Shi et al. 2017); Alomone Labs) and mixed with Pierce protein A/G magnetic beads (catalogue no. 88803; 30 μL per sample) overnight at 4°C with agitation as described previously (Dickerson et al. 2017). Purified anti-CaV1.2 (or anti-CaV1.3)/islet protein immunocomplexes were isolated and resolved on nitrocellulose membranes. Immunoblots were probed with mouse anti-TSPAN-7 (dilution 1:200; catalogue no. NBP2-52894; Novus Biologicals, Centennial, CO, USA) and TSPAN-7 protein bands visualized with anti-mouse HRP-conjugated secondary (dilution 1:2500) and SuperSignal™ Femto Substrate.
HEK293 cells were grown to 80% confluence in 100 mm tissue culture dishes, transfected with DNA plasmids utilizing calcium phosphate transfection (5 μg each of CaV1.2 α1-HA or CaV1.3 α1-HA, CaV β2A, CaV α2ä1, and TSPAN-7-pIRES-EGFP or pIRES-EGFP, and cultured for 48 h at 37°C, 5% CO2. HEK293 cell lysates were isolated, equal amounts of each lysate were combined with 5 μg·ml−1 mouse anti-HA (catalogue no. VAPR12CA5; Vanderbilt Antibody and Protein Resource, Nashville, TN, USA) or mouse IgG isotype control (catalogue no. 31903; Invitrogen; Carlsbad, CA) and incubated for 1 h at 4°C with agitation. Anti-HA/protein immunocomplexes were immunoprecipitated at 4°C overnight with protein A/G magnetic beads (30 μL per sample) and resolved on a nitrocellulose membrane. Immunoprotein complex western blots were probed with anti-TSPAN-7 (dilution 1:200) and protein bands were visualized with donkey anti-rabbit HRP-conjugated secondary (dilution 1:2500) and SuperSignal™ Femto Substrate. Alternatively, surface proteins were biotinylated and purified utilizing neutravidin agarose resin in accordance with the manufacturer’s instructions (catalogue no. A44390; Cell Surface Biotinylation and Isolation Kit; Pierce, Rockford, IL, USA); equal amounts of each lysate were loaded and resolved on a nitrocellulose membrane. Surface protein western blots were probed with mouse anti-HA (dilution 1:500) and CaV1.2-HA or CaV1.3-HA protein bands visualized with anti-mouse HRP-conjugated secondary (dilution 1:2500) and SuperSignal™ Femto Substrate.
Insulin secretion assays
Upon reception human islets were dispersed into single cells and cultured overnight in 24-well plates at 37°C, 5% CO2. The islet cells were transduced with lentiviral shRNAs for 6 h the nest day then cultured for at least 72 h in RPMI supplemented with 5.6 mM glucose prior to an experiment. On the day of an experiment, the culture media was replaced with 500 μL of DMEM containing 0.5 mg·mL−1 BSA, 0.5 mM CaCl2 and 10.0 mM HEPES (DMEM*) supplemented with 10% FBS and 5.6 mM glucose and incubated for 1 h at 37°C, 5% CO2. On ice the culture media was replaced with 500 μL of FBS-free DMEM* supplemented with the glucose concentrations and/or treatments as indicated where appropriate. Insulin secretion was measured over a 1 h period at 37°C in 5% CO2, after which the supernatants were collected, supplemented with mammalian protease inhibitor (catalogue no. 4693132001; Roche, Basel, Switzerland) and stored at −20°C until analysed. Human islet cells were gently washed twice with cold 1× phosphate-buffered saline and collected in 100 μL of acid-ethanol supplemented with mammalian protease inhibitor for analysis of total islet insulin content. The insulin concentrations of islet secretion supernatants and insulin extracted from islet cells were analysed by the Vanderbilt Hormone Assay and Analytical Services Core (Nashville, TN, USA). Secreted insulin was normalized to total insulin content.
Statistical analysis
Islet TSPAN-7 localization and KD, CaV1.2/1.3 surface expression and intracellular Ca2+ imaging data were quantified using Zen software and the ImageJ Fiji image processing pack (NIH, Bethesda, MD, USA); CaV currents and KATP currents were quantified with Axon Clampfit software (Molecular Devices). Statistical analysis was carried out using Excel (Microsoft Corp., Redmond, WA, USA) and Prism, version 8 (GraphPad Software Inc.) as indicated where appropriate. Data were normalized when appropriate. All data are presented as the mean ± 95% confidence interval (CI) for the specified number of samples (n). P < 0.05 was considered statistically significant.
Results
TSPAN-7 is expressed in both pancreatic β- and α-cells
To investigate islet TSPAN-7 protein expression, mouse and human pancreas sections were stained for insulin (or C-peptide), glucagon (GCG) and TSPAN-7. TSPAN-7 was found to be expressed in β- and α-cells, although not in surrounding acinar tissue (Fig. 1A). TSPAN-7 displayed greater heterogeneity in staining intensity in α-cells compared to in β-cells. Interestingly, although TSPAN-7 is a transmembrane protein (Lindskog et al. 2010; Hald et al. 2012), significant cytoplasmic staining with a punctate distribution was also observed, which may indicate that TSPAN-7 serves additional intracellular roles (Fig. 1B). Punctate distribution of TSPAN-7 at the plasma membrane and in the cytosol was confirmed in dispersed mouse islet cells (Fig. 2A). TSPAN-7 staining was observed in islet cells that were negative for both insulin and GCG staining, which indicates that TSPAN-7 is also expressed in other islet cell types such as δ-cells and/or pancreatic polypeptide cells.
Figure 1. TSPAN-7 is highly expressed in mouse and human pancreatic islets.

A, representative immunofluorescence images of mouse (upper) and human (lower) pancreas sections (TSPAN-7, green; insulin, red; glucagon, magenta; nuclei, blue; scale bars = 50 μm). B, representative immunofluorescence images of a human pancreas section (63× magnification; TSPAN-7, green; C-peptide, red; nuclei, blue; scale bars = 10 μm).
Figure 2. Knockdown of islet TSPAN-7 utilizing lentiviral shRNA delivery.

A, representative mouse islet cell immunofluorescence imaging showing TSPAN-7 KD relative to scramble shRNA controls (mCherry, red; TSPAN-7, green). B, average TSPAN-7 immunofluorescence of mouse islet cells expressing mTSPAN-7 shRNA (dark grey; n = 28 islet cells) relative to scramble shRNA controls (white; n = 37 islet cells); P = 5.0 × 10⁻¹¹. C, representative western blot showing TSPAN-7 KD in dispersed mouse islet cells (upper left) relative to α-tubulin (lower left) and representative western blot of TSPAN-7 KD in dispersed human islet cells (upper right) relative to α-tubulin (lower right). D, average TSPAN-7 protein in dispersed mouse islet cells expressing mTSPAN-7 shRNA (dark grey; n = 4 mice) relative to scramble shRNA controls (white; n = 4 mice); values normalized to α-tubulin protein; P = 0.0005. E, average TSPAN-7 protein in dispersed human islet cells expressing hTSPAN-7 shRNA (light grey; n = 4 islet donors) relative to scramble shRNA controls (white; n = 4 islet donors); hTSPAN-7 shRNA refers to hTSPAN-7 shRNA 3; values normalized to α-tubulin protein; P = 0.0003. Statistical analysis was conducted using an unpaired two-sample t test (B) or one-sample t tests (D and E); uncertainty is expressed as the 95% CI.
TSPAN-7 KD in mouse and human β-cells enhances glucose-stimulated Ca2+ influx
To investigate the function of TSPAN-7 in primary mouse and human β-cells, lentiviral shRNA constructs with an mCherry fluorescent reporter were used to KD TSPAN-7 protein expression. Quantification of TSPAN-7 immunofluorescence in TSPAN-7 KD mouse islet cells showed a significant decrease in fluorescence intensity (53.1 ± 11.1% reduction; P = 5.0 × 10⁻¹¹) (Fig.2A and B) compared to scramble controls. TSPAN-7 KD efficiency was confirmed in dispersed islet cells utilizing western blot analysis. Mouse islet cells expressing TSPAN-7 shRNA showed significant loss of TSPAN-7 protein compared to scramble shRNA controls (63.2 ± 7.6% reduction; P = 0.0005) (Fig. 2C and D). All three tested lentiviral hTSPAN-7 shRNA constructs knocked down TSPAN-7 in dispersed human islets; because hTSPAN-7 shRNA 3 was the most effective at knocking down TSPAN-7 expression (64.2 ± 6.5% reduction; P = 0.0003) (Fig. 2C and E), it was utilized for all subsequent experiments (hTSPAN-7 shRNA). Because α-cell lentiviral transduction efficiency is very low in our hands, the overall TSPAN-7 KD efficiency was probably greater in transduced β-cells compared to total islet TSPAN-7 KD. Interestingly, two TSPAN-7 bands were observed for human islet immunoblots. Because TSPAN-7 is glycosylated and palmitoylated, it is possible that multiple bands represent differential post-translational modification of TSPAN-7 (Skaar et al. 2015).
TSPANs have been shown to regulate Ca2+ handling; thus, the effect of TSPAN-7 KD on β-cell glucose-stimulated Ca2+ influx was evaluated. When mouse islets were stimulated with 14 mM glucose, TSPAN-7 KD enhanced Ca2+ influx into β-cells compared to scramble controls (38.3 ± 3.7% increase in Cal-630 area under the curve (AUC); P = 0.002) (Fig. 3A and B). TSPAN-7 did not affect β-cell Ca2+ at low (2 mM) glucose (P = 0.8); however, under basal (7 mM) glucose conditions, TSPAN-7 KD β-cell Ca2+ was modestly elevated compared to scramble shRNA controls (7.2 ± 2.7% increase in Fura-2 AM AUC; P = 0.04) (Fig. 2C and D). As pulsatile insulin secretion is controlled by oscillations in β-cell intracellular Ca2+, we next assessed whether TSPAN-7 affects glucose-mediated islet Ca2+ oscillation frequency. TSPAN-7 KD mouse islets stimulated with 10 mM glucose exhibited more rapid Ca2+ oscillations compared to control islets expressing scramble shRNA (29.4 ± 19.8% increased Ca2+ oscillation frequency; P = 0.002) (Fig. 3E-G). The impact of TSPAN-7 on glucose-stimulated Ca2+ influx into human islets was also measured by quantifying AUC of GCaMP6s fluorescence. During stimulation with 10 mM glucose, TSPAN-7 KD increased Ca2+ influx into human β-cells compared to scramble shRNA controls (82.3 ± 11.2% increase in GCaMP6s AUC; P = 0.001) (Fig. 3H and I). To determine whether TSPAN-7 control of β-cell Ca2+ is a result of effects on CaV channel function, Vm was clamped in a depolarized state (diazoxide and KCl). Under these conditions, we observed significantly more Ca2+ influx into TSPAN-7 KD β-cells compared to scramble shRNA controls (37.8 ± 10.8% increase in GCaMP6s; P = 0.006) (Fig. 3H and J) suggesting a role for TSPAN-7 in controlling CaV channel activity. TSPAN-7 did not alter Ca2+ in human β-cells at 2 mM glucose and the time required to reach minimum Ca2+ following diazoxide-induced KATP channel activation was unaffected by TSPAN-7. Interestingly, TSPAN-7 KD had a larger impact on glucose-stimulated Ca2+ influx than on depolarization-stimulated Ca2+ entry.
Figure 3. TSPAN-7 controls islet glucose-stimulated Ca2+ entry and Ca2+ oscillation frequency.
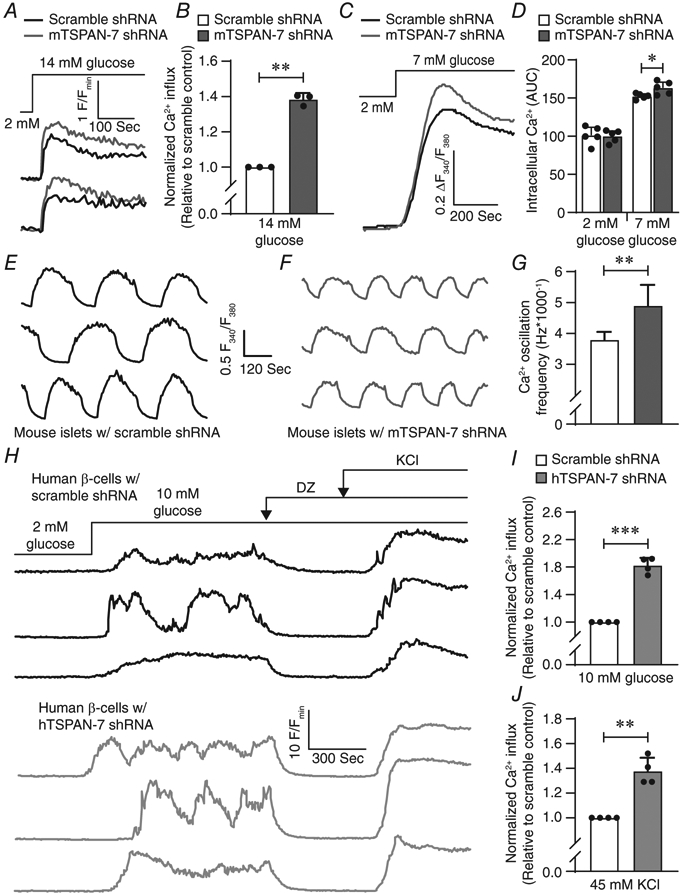
A, representative Cal-630 recordings as an indicator of intracellular Ca2+ in mouse islets expressing scramble shRNA (black) or mTSPAN-7 shRNA (dark grey); treatments are as indicated above Ca2+ traces. B, average AUC of glucose-stimulated Ca2+ influx into mouse islets expressing scramble shRNA (white; n = 3 mice) or mTSPAN-7 shRNA (dark grey; n = 3 mice); P = 0.002. C, average ratio-metric Fura-2 AM recordings as an indicator of intracellular Ca2+ in mouse islets expressing scramble shRNA (black; n = 5 mice) or mTSPAN-7 shRNA (dark grey; n = 5 mice). D, average AUC of islet Ca2+ expressing scramble shRNA (white; n = 5 mice) or mTSPAN-7 shRNA (dark grey; n = 5 mice) at 2 mm and 7 mm glucose; P = (2 mm: 0.8, 7 mm: 0.04). E, representative Cal-520 recordings as an indicator of glucose-stimulated (10 mM glucose) Ca2+ oscillations in mouse islets expressing scramble shRNA. F, representative Cal-520 recordings as an indicator of glucose-stimulated Ca2+ oscillations in mouse islets expressing mTSPAN-7 shRNA. G, average Ca2+ oscillation frequency of mouse islets expressing scramble shRNA (white; n = 60 islets from 3 mice) or mTSPAN-7 shRNA (dark grey; n = 53 islets from 3 mice); P = 0.002. H, representative GCaMP6s recordings as an indicator of intracellular Ca2+ in human β-cells expressing scramble shRNA (black; upper) or hTSPAN-7 shRNA (light grey; lower). I, average normalized glucose-stimulated Ca2+ influx into human β-cells within intact islets expressing hTSPAN-7 shRNA (light grey; n = 4 human islet donors) relative to scramble shRNA controls (white; n = 4 human islet donors); P = 0.001. J, average normalized depolarization-stimulated Ca2+ influx into human β-cells within intact islets expressing hTSPAN-7 shRNA (light grey; n = 4 human islet donors) relative to scramble shRNA controls (white; n = 4 human islet donors); P = 0.006. Statistical analysis was conducted using a one-sample t test (B, I and J) or an unpaired two-sample t test (D and G); uncertainty is expressed as 95% CI.
TSPAN-7 decreases β-cell L-type Ca2+ currents
Because TSPAN-7 KD increased Ca2+ influx into human β-cells when Vm was clamped in a depolarized state, control of β-cell L-type CaV channel activity by TSPAN-7 was measured. CaV currents were generated by applying sequential depolarizing steps (Fig. 4A) to transduced mouse and human β-cells; maximum CaV current densities were plotted as a function of Vm. The L-type CaV channel inhibitor isradipine was utilized to isolate the L-type component of β-cell CaV currents (Fig. 4B). TSPAN-7 KD significantly increased L-type CaV currents in mouse β-cells across a wide range of Vm (Fig. 4C). TSPAN-7 KD also augmented L-type CaV currents in human β-cells (Fig. 4D). TSPAN-7 KD did not affect non-L-type CaV currents in mouse or human β-cells (Fig. 4E and F). These results suggest that TSPAN-7 limits L-type CaV channel activity, which diminishes glucose-stimulated Ca2+ entry into β-cells.
Figure 4. TSPAN-7 regulates β-cell isradipine sensitive voltage-dependent Ca2+ currents.
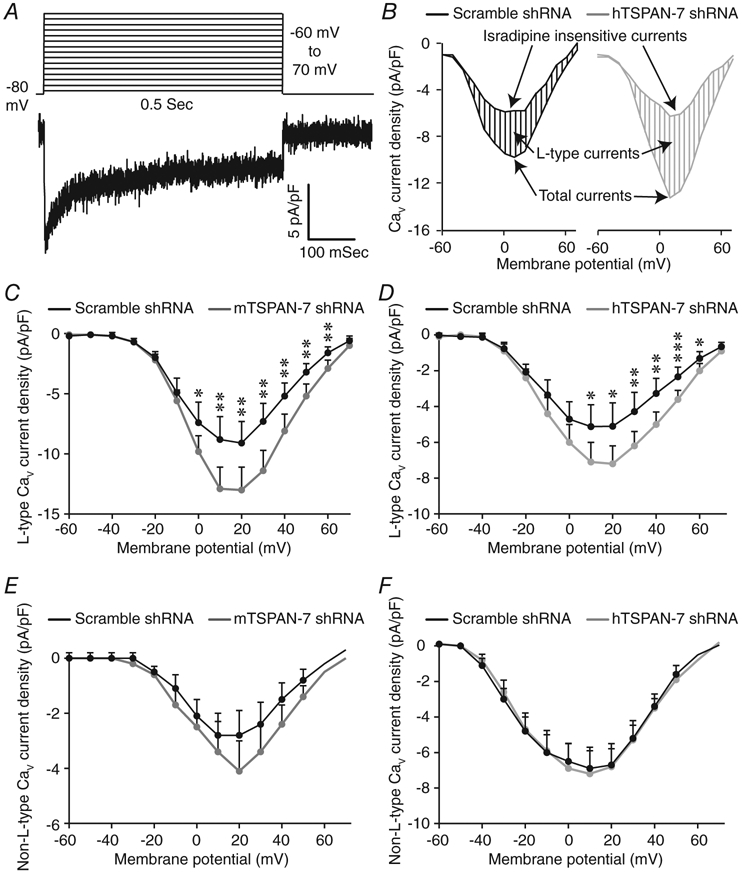
A, summary of whole-cell voltage step protocol utilized to generate CaV currents (upper) and representative β-cell CaV current recording (lower). B, representative human β-cell CaV currents before and after the addition of isradipine. L-type CaV currents were calculated by subtracting isradipine insensitive component from total current density. C, average isradipine sensitive (L-type) CaV current densities as a function of Vm recorded from dispersed mouse β-cells expressing scramble shRNA (black; n = 12 cells from 4 mice) or mTSPAN-7 shRNA (dark grey; n = 14 cells from 4 mice); P = (−60 mV: 0.8, −50 mV: 0.7, −40 mV: 0.8, −30 mV: 0.9, −20 mV: 0.6, −10 mV: 0.4, 0 mV: 0.04, 10 mV: 0.005, 20 mV: 0.007, 30 mV: 0.002, 40 mV: 0.005, 50 mV: 0.004, 60 mV: 0.008, 70 mV: 0.3). D, average isradipine sensitive CaV current densities as a function of Vm recorded from dispersed human β-cells (identified by GCaMP6s fluorescence) expressing scramble shRNA (black; n = 23 cells from four human islet donors) or hTSPAN-7 shRNA (light grey; n = 22 cells from four human islet donors); P = (−60 mV: 0.6, −50 mV: 0.5, −40 mV: 1.0, −30 mV: 0.6, −20 mV: 0.4, −10 mV: 0.1, 0 mV: 0.08, 10 mV: 0.02, 20 mV: 0.01, 30 mV: 0.008, 40 mV: 0.003, 50 mV: 0.001, 60 mV: 0.02, 70 mV: 0.2). E, average isradipine insensitive (non-L-type) CaV current densities as a function of Vm recorded from dispersed mouse β-cells expressing scramble shRNA (black; n = 12 cells from four mice) or mTSPAN-7 shRNA (dark grey; n = 15 cells from four mice); P = (−60 mV: 0.5, −50 mV: 0.3, −40 mV: 0.4, −30 mV: 0.6, −20 mV: 0.8, −10 mV: 0.5, 0 mV: 0.9, 10 mV: 0.8, 20 mV: 0.2, 30 mV: 0.3, 40 mV: 0.2, 50 mV: 0.1, 60 mV: 0.5, 70 mV: 0.2). F, average non-L-type CaV current densities as a function of Vm recorded from dispersed human β-cells (identified by GCaMP6s fluorescence) expressing scramble shRNA (black; n = 23 cells from four human islet donors) or hTSPAN-7 shRNA (light grey; n = 22 cells from four human islet donors); P = (−60 mV: 0.2, −50 mV: 0.2, −40 mV: 0.3, −30 mV: 0.7, −20 mV: 0.9, −10 mV: 1.1, 0 mV: 1.4, 10 mV: 1.3, 20 mV: 1.0, 30 mV: 0.8, 40 mV: 0.5, 50 mV: 0.4, 60 mV: 0.3, 70 mV: 0.1). Statistical analysis was conducted using unpaired two-sample t tests; uncertainty is expressed as 95% CI.
TSPAN-7 interacts with and limits Ca2+ entry through L-type CaV channels in human β-cells
Although TSPAN-7 regulates β-cell Ca2+ handling in part by controlling L-type CaV channel activity, it is unclear whether TSPAN-7 modulates CaV channel function directly or indirectly. To determine whether TSPAN-7 interacts with β-cell CaV channels, CaV1.2 and CaV1.3 immunoprotein complexes were pulled down from human islet cell lysates (n = 3 human islet donors) and coimmunoprecipitated TSPAN-7 was analysed by western blot analysis. Bands corresponding to TSPAN-7 were observed for all CaV1.2 and CaV1.3 immunoprotein complex preparations, indicating a direct interaction between TSPAN-7 and L-type CaV channels in human islets (Fig. 5A). TSPAN-7 also coimmunoprecipitated with heterologously expressed CaV1.2-HA and CaV1.3-HA immunoprotein complexes (Fig. 5B and C). TSPAN-7 only pulled down with immunoprotein complexes containing anti-HA and not with immunocomplexes containing an IgG isotype control, which shows that the observed TSPAN-7 bands are not a result of nonspecific protein binding.
Figure 5. TSPAN-7 regulation of Ca2+ handling is mediated via interactions with CaV1.2 and CaV1.3.
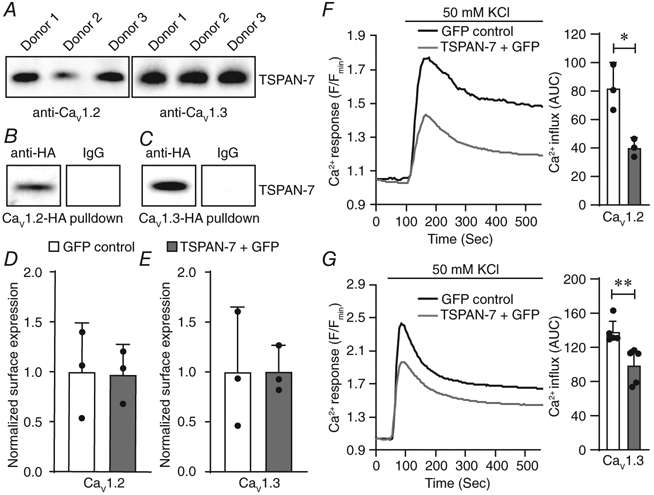
A, representative western blot of CaV1.2 (left; n = 3 human islet donors) or CaV1.3 (right; n = 3 human islet donors) immunocomplexes isolated from human islet preparations and probed with anti-TSPAN-7. B, representative western blot of heterologously expressed CaV1.2-HA immunocomplexes purified with anti-HA (left) or an IgG isotype control (right) from HEK293 cells; heterologously expressed, coimmunoprecipitated TSPAN-7 detected using anti-TSPAN-7. C, representative western blot of heterologously expressed CaV1.3-HA immunocomplexes purified with anti-HA (left) or an IgG isotype control (right) from HEK293 cells; heterologously expressed, coimmunoprecipitated TSPAN-7 detected using anti-TSPAN-7. D, average normalized plasma membrane CaV1.2 heterologously expressed with TSPAN-7 + GFP (light grey; n = 3 biological replicates) relative to GFP alone (white; n = 3 biological replicates); P = 0.9. E, average normalized plasma membrane CaV1.3 heterologously expressed with TSPAN-7 + GFP (light grey; n = 3 biological replicates) relative to GFP alone (white; n = 3 biological replicates); P = 1.0. F, average Cal-590 traces normalized to minimum fluorescence intensity (Fmin) as an indicator of depolarization-stimulated Ca2+ entry into HEK293 cells coexpressing CaV1.2 and GFP (left; black; n = 3 biological replicates) or TSPAN-7 + GFP (light grey; n = 3 biological replicates); quantification of AUC of depolarization-stimulated Ca2+ influx into GFP-positive HEK293 cells (right); P = 0.01. G, average Cal-590 traces normalized to Fmin as an indicator of depolarization-stimulated Ca2+ entry into induced T3H16 cells coexpressing CaV1.3 and GFP (left; black; n = 5 biological replicates) or TSPAN-7 + GFP (light grey; n = 5 biological replicates); quantification of AUC of depolarization-stimulated Ca2+ influx into GFP-positive T3H16 cells (right); P = 0.008. Statistical analysis was conducted using unpaired two-sample t tests; uncertainty is expressed as 95% CI.
TSPAN proteins serve diverse biological functions, including the control of protein trafficking and regulation of ion channel activity; thus, the mechanism underlying TSPAN-7 modulation of β-cell CaV channel function was examined. TSPAN-7 was heterologously expressed in HEK293 cells with CaV1.2 or CaV1.3 L-type CaV channels, plasma membrane proteins were biotinylated and captured on neutravidin-conjugated beads, and the impact of TSPAN-7 on CaV channel surface expression analysed by western blot analysis. When normalized to total surface protein, TSPAN-7 expression had no effect on the number of CaV1.2 or CaV1.3 channels at the plasma membrane (P = 0.9 and P = 1.0, respectively) (Fig. 5D and E). Furthermore, overexpression of TSPAN-7 significantly decreased the AUC of depolarization-stimulated Ca2+ entry through both CaV1.2 (51.0 ± 13.9% decrease in Cal-590 fluorescence; P = 0.01) (Fig. 5F) and CaV1.3 (28.4 ± 14.7% decrease in Cal-590 fluorescence; P = 0.008) (Fig. 5G) channels. Taken together, these data show that TSPAN-7 interacts with and directly modulates Ca2+ entry through L-type CaV channels.
TSPAN-7 differentially regulates L-type CaV1.2 and CaV1.3 channels
Because TSPAN-7 reduced Ca2+ influx through CaV1.2 and CaV1.3 channels, the impact of TSPAN-7 expression on CaV channel activation/inactivation kinetics was examined. Heterologous TSPAN-7 expression significantly decreased Ca2+ conductance through both CaV1.2 and CaV1.3 channels over a range of Vm (Fig. 6A and B). Maximum CaV1.2 (measured at 10 mV) and CaV1.3 (measured at −20 mV) channel current traces were also fit to a model of one-phase exponential association (or decay) to investigate the influence of TSPAN-7 on CaV channel activation and inactivation kinetics, respectively. TSPAN-7 expression decreased peak CaV1.2 currents (32.8 ± 21.2% decrease; P = 0.03) (Fig. 6C) and slowed channel activation kinetics (Kact: 52.7 ± 10.6% decrease; P = 6.0 × 10⁻⁶) (Fig 6C, inset). TSPAN-7 expression also decreased peak CaV1.3 currents (65.4 ± 15.3% decrease; P = 0.001) (Fig. 6D) and slowed channel inactivation kinetics (Kinact: 32.8 ± 9.4% decrease; P = 8.0 × 10⁻⁶) (Fig 6D, inset). Because TSPANs are structurally similar to CaV γ-subunits, which modulate CaV channel VDI kinetics (Klugbauer et al. 2000), we explored the effect of TSPAN-7 on L-type CaV channel VDI. Five second depolarizing steps were applied sequentially from −80 to 10 mV and L-type CaV current densities were measured after each voltage step (Fig. 6E); TSPAN-7 expression significantly accelerated recovery of CaV1.2 channels from VDI following depolarization to −20 mV or greater (Fig. 6F), although it did not affect VDI of CaV1.3 channels (Fig. 6G).
Figure 6. TSPAN-7 controls CaV1.2 and CaV1.3 activity in a channel specific manner.
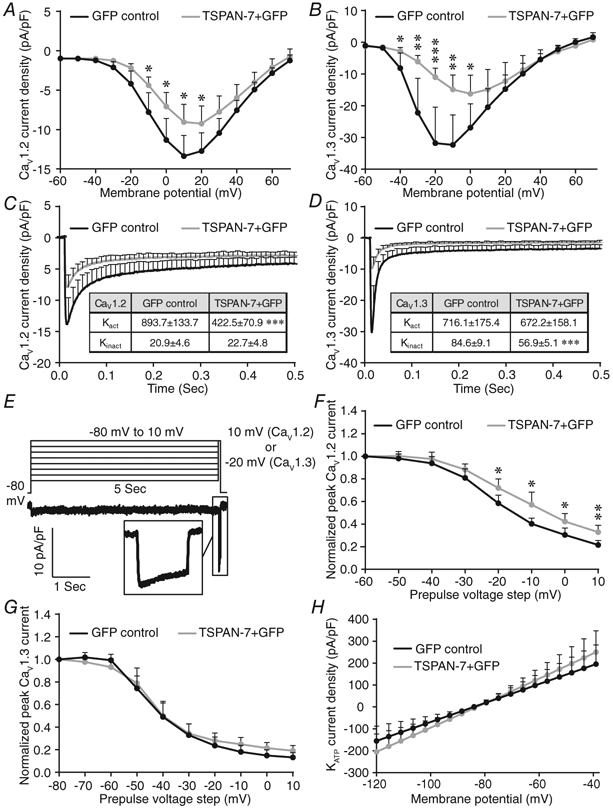
A, average CaV current densities as a function of Vm recorded from HEK293 cells coexpressing CaV1.2 and GFP (black; n = 19 cells) or TSPAN-7 + GFP (light grey; n = 13 cells); P = (−60 mV: 1.0, −50 mV: 0.8, −40 mV: 0.1, −30 mV: 0.07, −20 mV: 0.06, −10 mV: 0.04, 0 mV: 0.03, 10 mV: 0.03, 20 mV: 0.05, 30 mV: 0.07, 40 mV: 0.1, 50 mV: 0.3, 60 mV: 0.2, 70 mV: 0.4). B, average CaV current densities as a function of Vm recorded from HEK293 cells coexpressing CaV1.3 and GFP (black; n = 17 cells) or TSPAN-7 + GFP (light grey; n = 18 cells); P = (−60 mV: 0.2, −50 mV: 0.4, −40 mV: 0.03, −30 mV: 0.006, −20 mV: 0.001, −10 mV: 0.002, 0 mV: 0.03, 10 mV: 0.2, 20 mV: 0.5, 30 mV: 0.7, 40 mV: 1.0, 50 mV: 0.6, 60 mV: 0.2, 70 mV: 0.4). C, average maximum (measured at 10 mV) CaV1.2 current traces recorded from HEK293 cells coexpressing CaV1.2 and GFP (black; n = 19 cells) or TSPAN-7 + GFP (light grey; n = 13 cells). Inset table shows activation (Kact) and inactivation (Kinact) rate constants for CaV1.2; P = (Kact: 6.0 × 10⁻⁶, Kinact: 0.6). D, average maximum (measured at −20 mV) CaV1.3 current traces recorded from HEK293 cells coexpressing CaV1.3 and GFP (black; n = 17 cells) or TSPAN-7 + GFP (light grey; n = 18 cells). Inset table shows Kact and Kinact for CaV1.3; P = (Kact: 0.7, Kinact: 8.0 × 10⁻⁶). E, summary of whole-cell voltage step protocol utilized to measure rate of CaV1.2 and CaV1.3 recovery from VDI (upper) and a representative CaV current recording (lower); inset shows a representative CaV current generated after a 5 s depolarizing step. F, average normalized CaV currents recorded from HEK293 cells coexpressing CaV1.2 and GFP (black; n = 19 cells) or TSPAN-7 + GFP (light grey; n = 13 cells) relative to maximum CaV1.2 currents measured after a 5 s depolarizing step; P = (−50 mV: 0.5, −40 mV: 0.4, −30 mV: 0.2, −20 mV: 0.03, −10 mV: 0.01, 0 mV: 0.03, 10 mV: 0.007). G, average normalized CaV currents recorded from HEK293 cells coexpressing CaV1.3 and GFP (black; n = 16 cells) or TSPAN-7 + GFP (light grey; n = 13 cells) relative to maximum CaV1.3 currents measured after a 5 s depolarizing step; P = (−70 mV: 0.1, −60 mV: 0.2, −50 mV: 0.6, −40 mV: 0.9, −30 mV: 0.8, −20 mV: 0.4, −10 mV: 0.1, 0 mV: 0.08, 10 mV: 0.06). H, average KATP current densities as a function of Vm recorded from induced KATP cells expressing GFP (black; n = 12 cells) or TSPAN-7 + GFP (light grey; n = 12 cells); P = (−120 mV: 0.4, −100 mV: 0.3, −80 mV: 0.8, −60 mV: 0.5, −40 mV: 0.4). Statistical analysis was conducted using unpaired two-sample t tests; uncertainty is expressed as 95% CI.
Because the impact of TSPAN-7 on glucose-stimulated Ca2+ influx was greater than on depolarization-mediated Ca2+ influx, we went on to examine the effect of TSPAN-7 on glucose-regulated KATP channels. Heterologous expression of TSPAN-7 with KATP channels did not affect KATP current density (Fig. 6H). This suggests that the glucose-dependent modulation of β-cell Ca2+ by TSPAN-7 is primarily mediated through interactions with L-type CaV channels.
TSPAN-7 KD augments insulin secretion from human β-cells
Regulation of β-cell L-type CaV channel activity by TSPAN-7 would be predicted to influence GSIS; therefore, basal and stimulated insulin secretion from human β-cells were measured. Interestingly, under basal (5.6 mM) glucose conditions, where CaV channel activity is low, TSPAN-7 KD β-cells secreted significantly more insulin compared to scramble shRNA controls (113.4 ± 90.2% increase in insulin secretion per hour; P = 0.04) (Fig. 7A). Because TSPAN-7 KD increased intracellular Ca2+ in mouse β-cells under basal glucose conditions, this could indicate a left-shift in glucose concentration required for CaV channel activation. Insulin secretion was also increased from β-cells stimulated with 14 mM glucose and 45 mM KCl (36.4 ± 23.1% increase in insulin secretion per hour; P = 0.02) (Fig. 7B). This suggests that TSPAN-7 controls not only human β-cell glucose sensitivity, but also maximum secretory capacity.
Figure 7. TSPAN-7 regulation of β-cell L-type voltage-dependent Ca2+ channel activity limits GSIS.
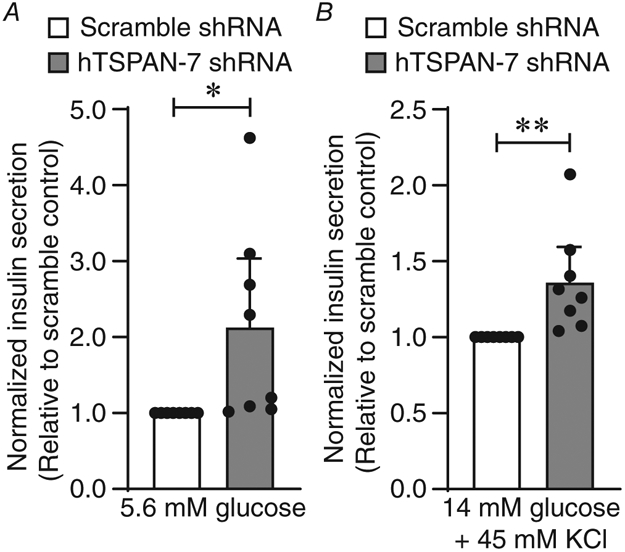
A, average normalized basal (5.6 mM glucose) insulin secretion from dispersed human islets expressing hTSPAN-7 shRNA (light grey; n = 8 human islet donors) relative to scramble shRNA (white; n = 8 human islet donors); P = 0.04. B, average normalized stimulated (14 mM glucose + 45 mM KCl) insulin secretion from dispersed human islets expressing hTSPAN-7 shRNA (light grey; n = 8 human islet donors) relative to scramble shRNA (white; n = 8 human islet donors); P = 0.02. Statistical analysis was conducted using one-sample t tests; uncertainty is expressed as 95% CI.
Discussion
Proper control of insulin secretion is critical for prevention of hyperglycaemia and maintenance of blood glucose homeostasis (Prentki & Matschinsky, 1987; Rhodes & White, 2002; Röder et al. 2016). It is well established that Ca2+ entry into β-cells through L-type CaV channels is a critical regulator of GSIS (Curry et al. 1968; MacDonald et al. 2005; Rorsman et al. 2012; Reinbothe et al. 2013); however, the mechanisms that control β-cell L-type CaV channel function are incompletely understood. Here, we demonstrate that TSPAN-7 regulates β-cell Ca2+ handling and GSIS in part by modulating L-type CaV channel activity. TSPAN-7 interaction with both CaV1.2 and CaV1.3 channels decreased Ca2+ conductance. TSPAN-7 also altered activation/inactivation kinetics in a channel-specific manner and accelerated recovery of CaV1.2 channels from VDI. The importance of TSPAN-7 control of CaV channel function was exemplified in β-cells with TSPAN-7 KD, which displayed enhanced glucose-stimulated Ca2+ influx, accelerated Ca2+ oscillation frequency and increased insulin secretion. This suggests that TSPAN-7 tunes the set-point of GSIS and regulates the rate of Ca2+ oscillations and thus pulsatile insulin release. Furthermore, during sustained secretagogue stimulation, a TSPAN-7-mediated decrease in CaV1.2 channel VDI could increase β-cell Ca2+ influx and therefore help maintain GSIS.
We provide the first evidence indicating that TSPAN-7 controls L-type CaV channel function. However, previous studies have reported that TSPAN proteins can interact with and control CaV channel activity (Kahle et al. 2011; Mallmann et al. 2013). For example, TSPAN-13 regulates CaV2.2 through an interaction with the channel VSD in membrane-spanning domain IV of the α1-subunit (Mallmann et al. 2013). Similarly, tetraspanin CaV γ-subunits control CaV channel function through interactions with the channel VSD (Wu et al. 2015). Because TSPAN-13 modulation of CaV2.2 function is caused by diminished coupling efficiency between voltage sensor activation and pore opening (Mallmann et al. 2013), it is possible that TSPAN-7 limits movement of L-type CaV channel VSDs and/or allosterically controls pore opening. A yeast two-hybrid assay also showed that TSPAN-7 interacts with P/Q-type CaV channels (Kahle et al. 2011). Therefore, TSPAN-7 may affect the function of non-L-type CaV channels. However, in β-cells, this is probably not the case because non-L-type CaV currents were unaffected by TSPAN-7 KD. TSPAN-7 regulation of CaV channel activity would also be predicted to influence all islet cell types where it is expressed. Single cell RNA sequencing and immunofluorescence staining reveal that TSPAN-7 expression is not restricted to β-cells, although it is also expressed in α- and δ-cells (Blodgett et al. 2015; DiGruccio et al. 2016; Segerstolpe et al. 2016). Activation of P/Q-type CaV channels is required for GCG secretion; thus, it is probable that an interaction between α-cell TSPAN-7 and P/Q-type CaV channels regulates α-cell function (Ramracheya et al. 2010; Rorsman et al. 2012). Heterogenous TSPAN-7 staining in α-cells may also suggest that relative TSPAN-7 expression contributes to differences in α-cell Ca2+ handling. In addition, R- and L-type CaV channels control δ-cell function (Zhang et al. 2007); therefore, an interaction of TSPAN-7 with δ-cell CaV channels presumably impacts glucose-stimulated Ca2+ entry and somatostatin (SST) secretion. Taken together, these findings suggest an important role for TSPAN-7 in regulating islet Ca2+ handling.
In addition to direct regulation of L-type CaV channels TSPAN-7 modulates phospholipid signalling through an interaction with phosphatidylinositol 4-kinase, a key regulator of phosphatidylinositol 4,5-bisphosphate (PIP2) production (Yauch & Hemler, 2000; Bassani et al. 2012; Lee et al. 2017). PIP2 is an important signalling molecule that influences the function of many islet ion channels (Baukrowitz et al. 1998; Shyng et al. 2000; Wu et al. 2002). For example, PIP2 binds to and holds KATP in an open conformation through an association with Kir6.2 close to the SUR1 binding site (Martin et al. 2017). However, because heterologous expression of TSPAN-7 did not affect KATP activity, this suggests that PIP2 control of KATP channel activity is not the primary mediator of TSPAN-7 regulation of β-cell Ca2+ handling. PIP2 also supports CaV channel function but, instead, decreases open probability by right-shifting the voltage threshold for channel activation (Wu et al. 2002). Because TSPAN-7 did not affect the voltage threshold for CaV activation, PIP2 modulation of CaV channel function probably does not play a role in the effect of TSPAN-7 on β-cell Ca2+ handling. Although our data do not suggest that TSPAN-7 control of PIP2 influences β-cell L-type CaV channel or KATP channel activity, it is possible that modulation of PIP2 locally in TSPAN-enriched microdomains impacts β-cell function.
TSPAN-7 control of receptor signalling could also directly or indirectly modulate β-cell Ca2+ handling and insulin secretion. For example, TSPAN-7 regulates the function and trafficking of ionotropic AMPA receptors (AMPARs) in hippocampal neurons (Bassani et al. 2012; Murru et al. 2017). Because glutamate stimulation of β-cell AMPARs has been shown to enhance glucose-stimulated Ca2+ influx and GSIS by directly depolarizing Vm and by indirectly inhibiting KATP activity (Wu et al. 2012), it is possible that TSPAN-7 regulation of AMPAR activity also influences β-cell Ca2+ handling and hormone secretion. However, other studies have reported that expression of GRIA1-4 (i.e. genes encoding AMPAR subunits) is low in β-cells and that glutamate only modestly affects β-cell Ca2+ handling and insulin secretion (Cabrera et al. 2008). Therefore, TSPAN-7 regulation of AMPAR function would be expected to serve a more prominent role in pancreatic α-cells, which display higher GRIA1-4 expression and a larger response to glutamate stimulation (Cabrera et al. 2008; Cho et al. 2010). TSPAN-7 has also been shown to interact with D2 dopamine receptors (DRD2s), which promotes DRD2 endocytosis (Lee et al. 2017). DRD2s are D2-like dopamine receptors (e.g. DRD2, DRD3 and DRD4), which are Gαi-coupled G protein-coupled receptors. DRD2s, as well as DRD3s, are expressed in β-cells, and thus dopamine secreted from β-cells at high glucose reduces intracellular cAMP and activates hyperpolarizing G protein-coupled inwardly-rectifying K+ channels; this results in decreased CaV channel activity and GSIS (Rubí et al. 2005; Ustione & Piston, 2012; Farino et al. 2019). Therefore, TSPAN-7 control of Gαi-coupled DRD2 turnover in β-cells could influence receptor desensitization kinetics and/or surface expression, and thus tune dopamine inhibition of GSIS. Importantly, because AMPAR and DRD2/D3 expression is not restricted to β-cells, it is probable that TSPAN-7 regulation of one or both affects Ca2+ handling and hormone secretion in other islet cell types (i.e. α- and/or δ-cells). Additional experiments will examine whether TSPAN-7 regulation of AMPAR activity and/or DRD2/D3 signalling influences islet cell Ca2+ handling and hormone secretion.
TSPAN-7 also regulates filamentous (F)-actin formation, which controls β-cell insulin granule trafficking, membrane access and exocytosis (Bassani et al. 2012; Ménager & Littman, 2016; Ménager, 2017). Under low glucose conditions, a dense subplasmalemmal F-actin network is generated by the actin-related protein 2/3 (ARP2/3) complex, which restricts insulin secretion; glucose stimulation induces β-cell F-actin remodelling that facilitates GSIS (Goley et al. 2010; Tran et al. 2015; Ménager & Littman, 2016). Cytosolic protein interacting with C kinase 1 (PICK1) acts as an allosteric switch for F-actin polymerization by inhibiting the ARP2/3 complex (Ménager & Littman, 2016; Ménager, 2017). PICK1 exists as a homodimer containing spatially separated PDZ and lipid binding BAR domains; this arrangement facilitates plasma membrane tethering and interactions with as many as two binding partners. TSPAN-7 contains a C-terminal PDZ-binding domain that interacts with the PDZ domain of PICK1, which locks PICK1 in an inactive conformation and results in the formation of highly branched F-actin networks (Bassani et al. 2012; Ménager & Littman, 2016; Ménager, 2017). Therefore, β-cell TSPAN-7 may play an important role in limiting insulin secretion under low glucose conditions by stabilizing F-actin. This is supported by our data showing that TSPAN-7 KD leads to an increase in basal (5.6 mM glucose) insulin secretion. F-actin also influences hormone granule fusion and exocytosis in α-cells (Hutchens & Piston, 2015; Hughes et al. 2018) and presumably δ-cells; therefore, TSPAN-7 modulation of actin dynamics probably does not affect GCG and/or SST secretion. Interestingly, PICK1 also localizes to the surface of insulin granules and global PICK1 KO impairs proinsulin processing and insulin granule maturation (Cao et al. 2013; Li et al. 2018). This results in decreased GSIS and elevated secretion of proinsulin from immature insulin granules. Based on a strong cytosolic staining pattern in islets, it is probable that TSPAN-7 serves additional intracellular functions possibly through interactions with PICK1. Therefore, improved proinsulin processing and insulin granule maturation resulting from TSPAN-7 KD could contribute to the observed increase in basal insulin secretion and GSIS. Future studies will aim to investigate the properties of islet TSPAN-7/PICK1 complexes and examine whether these interactions influence hormone secretion.
The importance of β-cell TSPAN-7 is further demonstrated by the presence of autoantibodies against TSPAN-7 in the serum of 35% of type 1 diabetic patients and in 21% of LADA patients, which could indicate a link between TSPAN-7 and diabetes (McLaughlin et al. 2016; Shi et al. 2019). Because the majority of islet autoantigens associated with type 1 diabetes (T1D) pathogenesis are important components of the β-cell secretory pathway (i.e. insulin, zinc transporter 8, islet antigen 2/2β, islet cell autoantigen 69) (Pihoker et al. 2005; Roep & Peakman, 2012), it is probable that TSPAN-7 also plays a part in this process. Moreover, L-type CaV channels form clusters that interact with and facilitate insulin granule plasma membrane fusion and exocytosis (Gandasi et al. 2017). Because we show that TSPAN-7 directly modulates L-type CaV channel activity, TSPAN-7 also would be predicted to localize to and could influence formation of CaV channel clusters where insulin secretion occurs. Interestingly, TSPAN-7 has also been shown to localize to β-cell exosomes along with another known T1D autoantigen, glutamate decarboxylase 65 (Sheng et al. 2011). Exosomes are small (50–100 nm) extracellular vesicles that originate from exocytosis of multivesicular bodies, and which transport protein, lipid and/or nucleic acid cargo to neighbouring or distant cells. Importantly, exosomes are secreted in response to stressful conditions and have been identified as targets of autoimmune response in non-obese diabetic mice (Sheng et al. 2011). Thus, it is possible that secretion of proinflammatory exosomes during T1D pathogenesis contributes to development of TSPAN-7 autoantibodies.
In conclusion, these finding show that β-cell L-type CaV channel activity is controlled by TSPAN-7, which limits glucose-stimulated Ca2+ influx, reduces the speed of Ca2+ oscillations and decreases insulin secretion. Our data indicate that TSPAN-7 interacts with and directly regulates L-type CaV channel function. Binding of TSPAN-7 reduces CaV1.2 and CaV1.3 channel Ca2+ conductance, modulates activation/inactivation kinetics in a channel specific manner, and accelerates the recovery of CaV1.2 channels from VDI. These results suggest that TSPAN-7 serves important roles in determining the set-point at which GSIS occurs, tuning the speed of Ca2+ oscillations and pulsatile insulin secretion, as well as sustaining insulin secretion during periods of secretagogue stimulation. Furthermore, these results can be extended to other cell types that express TSPAN-7 and where Ca2+ serves as an important intracellular signal, such as in hippocampal neurons, as well as in pancreatic α- and δ-cells.
Supplementary Material
Key points.
Tetraspanin (TSPAN) proteins regulate many biological processes, including intracellular calcium (Ca2+) handling. TSPAN-7 is enriched in pancreatic islet cells; however, the function of islet TSPAN-7 has not been identified.
Here, we characterize how β-cell TSPAN-7 regulates Ca2+ handling and hormone secretion. We find that TSPAN-7 reduces β-cell glucose-stimulated Ca2+ entry, slows Ca2+ oscillation frequency and decreases glucose-stimulated insulin secretion.
TSPAN-7 controls β-cell function through a direct interaction with L-type voltage-dependent Ca2+ channels (CaV1.2 and CaV1.3), which reduces channel Ca2+ conductance. TSPAN-7 slows activation of CaV1.2 and accelerates recovery from voltage-dependent inactivation; TSPAN-7 also slows CaV1.3 inactivation kinetics.
These findings strongly implicate TSPAN-7 as a key regulator in determining the set-point of glucose-stimulated Ca2+ influx and insulin secretion.
Acknowledgements
We thank Roger Colbran (Vanderbilt University) for providing CaV channel subunit plasmids, Maria Passafaro (CNR, Institute of Neuroscience) for providing the TSPAN-7-pIRES-EGFP plasmid and Jerod Denton (Vanderbilt University) for providing the stable tetracycline-inducible Kir6.2/SUR1 cell line. We thank the Vanderbilt Hormone Assay Core (supported by NIH Grants DK-059637 and DK-020593) for performing insulin secretion immunoassays. We are also grateful for the confocal microscopy resources provided by the Vanderbilt Cell Imaging Shared Resource (CISR; supported by NIH grants CA-68485, DK-20593, DK-58404, DK-59637 and EY-08126). This research was performed with the support of the Integrated Islet Distribution Program (https://iidp.coh.org/). We especially thank the organ donors and their families.
Funding
This research has been supported by a Vanderbilt Integrated Training in Engineering and Diabetes Grant (T32DK101003), National Institutes of Health Grants (DK-097392 and DK-115620), American Diabetes Association Grant (1-17-IBS-024), Juvenile Diabetes Reseach Foundation Grant (2-SRA-2019-701-S-B), and a Pilot and Feasibility grant through the Vanderbilt Diabetes Research and Training Center Grant (P60-DK-20593).
Biography

Matthew T. Dickerson is a Research Instructor in the Molecular Physiology and Biophysics (MPB) Department at Vanderbilt University in Nashville, TN, USA. He has a BS (2006) and PhD (2012) in Chemical Engineering from the University of Kentucky in Lexington, KY. His continuing research focuses on tetraspanin regulation of pancreatic islet function.
Footnotes
Competing interests
The authors declare that they have no competing interests.
Supporting information
Additional supporting information may be found online in the Supporting Information section at the end of the article.
Statistical Summary Document
Raw data for Figure 3
Data availability statement
The data that support the findings of this study are available from the corresponding author upon reasonable request.
References
- Andronache Z, Ursu D, Lehnert S, Freichel M, Flockerzi V & Melzer W (2007). The auxiliary subunit γ1 of the skeletal muscle L-type Ca2+ channel is an endogenous Ca2+ antagonist. Proc Natl Acad Sci U S A 104, 17885–17890. [DOI] [PMC free article] [PubMed] [Google Scholar]
- Bassani S, Cingolani LA, Valnegri P, Folci A, Zapata J, Gianfelice A, Sala C, Goda Y & Passafaro M (2012). The X-linked intellectual disability protein TSPAN7 regulates excitatory synapse development and AMPAR trafficking. Neuron 73, 1143–1158. [DOI] [PMC free article] [PubMed] [Google Scholar]
- Baukrowitz T, Schulte U, Oliver D, Herlitze S, Krauter T, Tucker SJ, Ruppersberg JP & Fakler B (1998). PIP2 and PIP as determinants for ATP inhibition of KATP channels. Science 282, 1141–1144. [DOI] [PubMed] [Google Scholar]
- Blodgett DM, Nowosielska A, Afik S, Pechhold S, Cura AJ, Kennedy NJ, Kim S, Kucukural A, Davis RJ & Kent SC (2015). Novel observations from next-generation RNA sequencing of highly purified human adult and fetal islet cell subsets. Diabetes 64, 3172–3181. [DOI] [PMC free article] [PubMed] [Google Scholar]
- Cabrera O, Jacques-Silva MC, Speier S, Yang S-N, Köhler M, Fachado A, Vieira E, Zierath JR, Kibbey R & Berman DM (2008). Glutamate is a positive autocrine signal for glucagon release. Cell Metab 7, 545–554. [DOI] [PMC free article] [PubMed] [Google Scholar]
- Cao M, Mao Z, Kam C, Xiao N, Cao X, Shen C, Cheng KK, Xu A, Lee K-M & Jiang L (2013). PICK1 and ICA69 control insulin granule trafficking and their deficiencies lead to impaired glucose tolerance. PLoS Biol 11, e1001541. [DOI] [PMC free article] [PubMed] [Google Scholar]
- Catterall WA (2011). Voltage-gated calcium channels. Cold Spring Harb Perspect Biol 3, a003947. [DOI] [PMC free article] [PubMed] [Google Scholar]
- Charrin S, Jouannet S, Boucheix C & Rubinstein E (2014). Tetraspanins at a glance. J Cell Sci 127, 3641–3648. [DOI] [PubMed] [Google Scholar]
- Chen R-S, Deng T-C, Garcia T, Sellers ZM & Best PM (2007). Calcium channel γ subunits: a functionally diverse protein family. Cell Biochem Biophys 47, 178–186. [DOI] [PubMed] [Google Scholar]
- Chen T-W, Wardill TJ, Sun Y, Pulver SR, Renninger SL, Baohan A, Schreiter ER, Kerr RA, Orger MB & Jayaraman V (2013). Ultrasensitive fluorescent proteins for imaging neuronal activity. Nature 499, 295–300. [DOI] [PMC free article] [PubMed] [Google Scholar]
- Cho J-H, Chen L, Kim M-H, Chow RH, Hille B & Koh D-S (2010). Characteristics and functions of α-amino-3-hydroxy-5-methyl-4-isoxazolepropionate receptors expressed in mouse pancreatic α-cells. Endocrinology 151, 1541–1550. [DOI] [PMC free article] [PubMed] [Google Scholar]
- Cnop M, Abdulkarim B, Bottu G, Cunha DA, Igoillo-Esteve M, Masini M, Turatsinze J-V, Griebel T, Villate O & Santin I (2014). RNA sequencing identifies dysregulation of the human pancreatic islet transcriptome by the saturated fatty acid palmitate. Diabetes 63, 1978–1993. [DOI] [PubMed] [Google Scholar]
- Curry DL, Bennett LL & Grodsky GM (1968). Requirement for calcium ion in insulin secretion by the perfused rat pancreas. American Journal of Physiology-Legacy Content 214, 174–178. [DOI] [PubMed] [Google Scholar]
- Dickerson MT, Bogart AM, Altman MK, Milian SC, Jordan KL, Dadi PK & Jacobson DA (2018). Cytokine-mediated changes in K+ channel activity promotes an adaptive Ca2+ response that sustains β-cell insulin secretion during inflammation. Sci Rep 8, 1–15. [DOI] [PMC free article] [PubMed] [Google Scholar]
- Dickerson MT, Vierra NC, Milian SC, Dadi PK & Jacobson DA (2017). Osteopontin activates the diabetes-associated potassium channel TALK-1 in pancreatic β-cells. PLoS One 12, e0175069. [DOI] [PMC free article] [PubMed] [Google Scholar]
- DiGruccio MR, Mawla AM, Donaldson CJ, Noguchi GM, Vaughan J, Cowing-Zitron C, van der Meulen T & Huising MO (2016). Comprehensive alpha, beta and delta cell transcriptomes reveal that ghrelin selectively activates delta cells and promotes somatostatin release from pancreatic islets. Mol Metab 5, 449–458. [DOI] [PMC free article] [PubMed] [Google Scholar]
- Dolphin AC (2016). Voltage-gated calcium channels and their auxiliary subunits: physiology and pathophysiology and pharmacology. J Physiol 594, 5369–5390. [DOI] [PMC free article] [PubMed] [Google Scholar]
- Eizirik DL, Sammeth M, Bouckenooghe T, Bottu G, Sisino G, Igoillo-Esteve M, Ortis F, Santin I, Colli ML & Barthson J (2012). The human pancreatic islet transcriptome: expression of candidate genes for type 1 diabetes and the impact of pro-inflammatory cytokines. PLos Genet 8, e1002552. [DOI] [PMC free article] [PubMed] [Google Scholar]
- Farino ZJ, Morgenstern TJ, Maffei A, Quick M, De Solis AJ, Wiriyasermkul P, Freyberg RJ, Aslanoglou D, Sorisio D & Inbar BP (2019). New roles for dopamine D2 and D3 receptors in pancreatic beta cell insulin secretion. Mol Psychiatry, 1–16. [DOI] [PMC free article] [PubMed] [Google Scholar]
- Gandasi NR, Yin P, Riz M, Chibalina MV, Cortese G, Lund P-E, Matveev V, Rorsman P, Sherman A & Pedersen MG (2017). Ca2+ channel clustering with insulin-containing granules is disturbed in type 2 diabetes. J Clin Invest 127, 2353–2364. [DOI] [PMC free article] [PubMed] [Google Scholar]
- Goley ED, Rammohan A, Znameroski EA, Firat-Karalar EN, Sept D & Welch MD (2010). An actin-filament-binding interface on the Arp2/3 complex is critical for nucleation and branch stability. Proc Natl Acad Sci U S A 107, 8159–8164. [DOI] [PMC free article] [PubMed] [Google Scholar]
- Grundy D (2015). Principles and standards for reporting animal experiments in The Journal of Physiology and Experimental Physiology. Exp Physiol 100, 755–758. [DOI] [PubMed] [Google Scholar]
- Hald J, Galbo T, Rescan C, Radzikowski L, Sprinkel AE, Heimberg H, Ahnfelt-Rønne J, Jensen J, Scharfmann R & Gradwohl G (2012). Pancreatic islet and progenitor cell surface markers with cell sorting potential. Diabetology 55, 154–165. [DOI] [PubMed] [Google Scholar]
- Hofmann F, Lacinova L & Klugbauer N (1999). Voltage-dependent calcium channels: from structure to function. In Reviews of Physiology, Biochemistry and Pharmacology, Vol. 139, pp. 33–87. Springer. [DOI] [PubMed] [Google Scholar]
- Hughes JW, Ustione A, Lavagnino Z & Piston DW (2018). Regulation of islet glucagon secretion: Beyond calcium. Diabetes Obes Metab 20, 127–136. [DOI] [PMC free article] [PubMed] [Google Scholar]
- Hutchens T & Piston DW (2015). EphA4 receptor forward signaling inhibits glucagon secretion from α-cells. Diabetes 64, 3839–3851. [DOI] [PMC free article] [PubMed] [Google Scholar]
- Jeon D, Kim S, Chetana M, Jo D, Ruley HE, Lin S-Y, Rabah D, Kinet J-P & Shin H-S (2010). Observational fear learning involves affective pain system and CaV1.2 Ca2+ channels in ACC. Nat Neurosci 13, 482. [DOI] [PMC free article] [PubMed] [Google Scholar]
- Kahle JJ, Gulbahce N, Shaw CA, Lim J, Hill DE, Barabasi A-L & Zoghbi HY (2011). Comparison of an expanded ataxia interactome with patient medical records reveals a relationship between macular degeneration and ataxia. Hum Mol Genet 20, 510–527. [DOI] [PMC free article] [PubMed] [Google Scholar]
- Klugbauer N, Dai S, Specht V, Lacinová L, Marais E, Bohn G & Hofmann F (2000). A family of γ-like calcium channel subunits. FEBS Lett 470, 189–197. [DOI] [PubMed] [Google Scholar]
- Lee K, Kim J, Köhler M, Yu J, Shi Y, Yang S-N, Ryu SH & Berggren P-O (2018). Blocking Ca2+ channel β3 subunit reverses diabetes. Cell Rep 24, 922–934. [DOI] [PMC free article] [PubMed] [Google Scholar]
- Lee S-A, Suh Y, Lee S, Jeong J, Kim SJ, Kim SJ & Park SK (2017). Functional expression of dopamine D2 receptor is regulated by tetraspanin 7-mediated postendocytic trafficking. FASEB J 31, 2301–2313. [DOI] [PubMed] [Google Scholar]
- Li J, Mao Z, Huang J & Xia J (2018). PICK1 is essential for insulin production and the maintenance of glucose homeostasis. Mol Biol Cell 29, 587–596. [DOI] [PMC free article] [PubMed] [Google Scholar]
- Lindskog C, Asplund A, Engkvist M, Uhlen M, Korsgren O & Ponten F (2010). Antibody-based proteomics for discovery and exploration of proteins expressed in pancreatic islets. Discov Med 9, 565–578. [PubMed] [Google Scholar]
- Luan C, Ye Y, Singh T, Barghouth M, Eliasson L, Artner I, Zhang E & Renström E (2019). The calcium channel subunit gamma-4 is regulated by MafA and necessary for pancreatic beta-cell specification. Commun Biol 2, 1–14. [DOI] [PMC free article] [PubMed] [Google Scholar]
- MacDonald PE, Joseph JW & Rorsman P (2005). Glucose-sensing mechanisms in pancreatic β-cells. Philos T R Soc B 360, 2211–2225. [DOI] [PMC free article] [PubMed] [Google Scholar]
- Mallmann RT, Wilmes T, Lichvarova L, Bührer A, Lohmüller B, Castonguay J, Lacinova L & Klugbauer N (2013). Tetraspanin-13 modulates voltage-gated Ca v 2.2 Ca 2+ channels. Sci Rep 3, 1777. [DOI] [PMC free article] [PubMed] [Google Scholar]
- Martin GM, Yoshioka C, Rex EA, Fay JF, Xie Q, Whorton MR, Chen JZ & Shyng S-L (2017). Cryo-EM structure of the ATP-sensitive potassium channel illuminates mechanisms of assembly and gating. Elife 6, e24149. [DOI] [PMC free article] [PubMed] [Google Scholar]
- Mastrolia V, Flucher SM, Obermair GJ, Drach M, Hofer H, Renström E, Schwartz A, Striessnig J, Flucher BE & Tuluc P (2017). Loss of α2δ−1 calcium channel subunit function increases the susceptibility for diabetes. Diabetes 66, 897–907. [DOI] [PMC free article] [PubMed] [Google Scholar]
- McLaughlin KA, Richardson CC, Ravishankar A, Brigatti C, Liberati D, Lampasona V, Piemonti L, Morgan D, Feltbower RG & Christie MR (2016). Identification of tetraspanin-7 as a target of autoantibodies in type 1 diabetes. Diabetes 65, 1690–1698. [DOI] [PubMed] [Google Scholar]
- Ménager MM (2017). TSPAN7, effector of actin nucleation required for dendritic cell-mediated transfer of HIV-1 to T cells. Biochem Soc Trans 45, 703–708. [DOI] [PubMed] [Google Scholar]
- Ménager MM & Littman DR (2016). Actin dynamics regulates dendritic cell-mediated transfer of HIV-1 to T cells. Cell 164, 695–709. [DOI] [PMC free article] [PubMed] [Google Scholar]
- Mitok KA, Freiberger EC, Schueler KL, Rabaglia ME, Stapleton DS, Kwiecien NW, Malec PA, Hebert AS, Broman AT & Kennedy RT (2018). Islet proteomics reveals genetic variation in dopamine production resulting in altered insulin secretion. J Biol Chem 293, 5860–5877. [DOI] [PMC free article] [PubMed] [Google Scholar]
- Murru L, Vezzoli E, Longatti A, Ponzoni L, Falqui A, Folci A, Moretto E, Bianchi V, Braida D & Sala M (2017). Pharmacological Modulation of AMPAR Rescues Intellectual Disability-Like Phenotype in Tm4sf2−/y Mice. Cereb Cortex 27, 5369–5384. [DOI] [PMC free article] [PubMed] [Google Scholar]
- Pihoker C, Gilliam LK, Hampe CS & Lernmark Å (2005). Autoantibodies in diabetes. Diabetes 54, S52–S61. [DOI] [PubMed] [Google Scholar]
- Prentki M & Matschinsky FM (1987). Ca2+, cAMP, and phospholipid-derived messengers in coupling mechanisms of insulin secretion. Physiol Rev 67, 1185–1248. [DOI] [PubMed] [Google Scholar]
- Ramracheya R, Ward C, Shigeto M, Walker JN, Amisten S, Zhang Q, Johnson PR, Rorsman P & Braun M (2010). Membrane potential-dependent inactivation of voltage-gated ion channels in α-cells inhibits glucagon secretion from human islets. Diabetes 59, 2198–2208. [DOI] [PMC free article] [PubMed] [Google Scholar]
- Raphemot R, Swale DR, Dadi PK, Jacobson DA, Cooper P, Wojtovich AP, Banerjee S, Nichols CG & Denton JS (2014). Direct activation of β-cell KATP channels with a novel xanthine derivative. Mol Pharmacol 85, 858–865. [DOI] [PMC free article] [PubMed] [Google Scholar]
- Reinbothe TM, Alkayyali S, Ahlqvist E, Tuomi T, Isomaa B, Lyssenko V & Renström E (2013). The human L-type calcium channel CaV1.3 regulates insulin release and polymorphisms in CACNA1D associate with type 2 diabetes. Diabetologia 56, 340–349. [DOI] [PubMed] [Google Scholar]
- Rhodes CJ & White MF (2002). Molecular insights into insulin action and secretion. Eur J Clin Invest 32, 3–13. [DOI] [PubMed] [Google Scholar]
- Röder PV, Wu B, Liu Y & Han W (2016). Pancreatic regulation of glucose homeostasis. Exp Mol Med 48, e219–e219. [DOI] [PMC free article] [PubMed] [Google Scholar]
- Roep BO & Peakman M (2012). Antigen targets of type 1 diabetes autoimmunity. Cold Spring Harb Perspect Med 2, a007781. [DOI] [PMC free article] [PubMed] [Google Scholar]
- Rorsman P, Braun M & Zhang Q (2012). Regulation of calcium in pancreatic α-and β-cells in health and disease. Cell Calcium 51, 300–308. [DOI] [PMC free article] [PubMed] [Google Scholar]
- Rubí B, Ljubicic S, Pournourmohammadi S, Carobbio S, Armanet M, Bartley C & Maechler P (2005). Dopamine D2-like receptors are expressed in pancreatic beta cells and mediate inhibition of insulin secretion. J Biol Chem 280, 36824–36832. [DOI] [PubMed] [Google Scholar]
- Sandoval A, Andrade A, Beedle AM, Campbell KP & Felix R (2007). Inhibition of recombinant N-type CaV channels by the γ2 subunit involves unfolded protein response (UPR)-dependent and UPR-independent mechanisms. J Neurosci 27, 3317–3327. [DOI] [PMC free article] [PubMed] [Google Scholar]
- Segerstolpe Å, Palasantza A, Eliasson P, Andersson E-M, Andréasson A-C, Sun X, Picelli S, Sabirsh A, Clausen M & Bjursell MK (2016). Single-cell transcriptome profiling of human pancreatic islets in health and type 2 diabetes. Cell Metab 24, 593–607. [DOI] [PMC free article] [PubMed] [Google Scholar]
- Sheng H, Hassanali S, Nugent C, Wen L, Hamilton-Williams E, Dias P & Dai YD (2011). Insulinoma-released exosomes or microparticles are immunostimulatory and can activate autoreactive T cells spontaneously developed in nonobese diabetic mice. J Immunol 187, 1591–1600. [DOI] [PMC free article] [PubMed] [Google Scholar]
- Shi L, Ko ML & Ko GY-P (2017). Retinoschisin facilitates the function of L-type voltage-gated calcium channels. Front Cell Neurosci 11, 232. [DOI] [PMC free article] [PubMed] [Google Scholar]
- Shi X, Huang G, Wang Y, Liu Z, Deng C, Li X, Zheng P & Zhou Z (2019). Tetraspanin 7 autoantibodies predict progressive decline of beta cell function in individuals with LADA. Diabetologia 62, 399–407. [DOI] [PubMed] [Google Scholar]
- Shyng S-L, Cukras CA, Harwood J & Nichols CG (2000). Structural determinants of PIP2 regulation of inward rectifier KATP channels. J Gen Physiol 116, 599–608. [DOI] [PMC free article] [PubMed] [Google Scholar]
- Skaar K, Korza HJ, Tarry M, Sekyrova P & Högbom M (2015). Expression and subcellular distribution of GFP-tagged human tetraspanin proteins in Saccharomyces cerevisiae. PLoS One 10, e0134041. [DOI] [PMC free article] [PubMed] [Google Scholar]
- Termini CM & Gillette JM (2017). Tetraspanins function as regulators of cellular signaling. Front Cell Dev Biol 5, 34. [DOI] [PMC free article] [PubMed] [Google Scholar]
- Tran DT, Masedunskas A, Weigert R & Ten Hagen KG (2015). Arp2/3-mediated F-actin formation controls regulated exocytosis in vivo. Nat Commun 6, 1–10. [DOI] [PMC free article] [PubMed] [Google Scholar]
- Uhlén M, Fagerberg L, Hallström BM, Lindskog C, Oksvold P, Mardinoglu A, Sivertsson Å, Kampf C, Sjöstedt E & Asplund A (2015). Tissue-based map of the human proteome. Science 347, 1260419–1260419. [DOI] [PubMed] [Google Scholar]
- Ustione A & Piston DW (2012). Dopamine synthesis and D3 receptor activation in pancreatic β-cells regulates insulin secretion and intracellular [Ca2+] oscillations. Mol Endocrinol 26, 1928–1940. [DOI] [PMC free article] [PubMed] [Google Scholar]
- Vierra N, Dadi P, Jeong I & Jacobson D (2015). The type 2 diabetes associated K+ channel TALK-1 modulates pancreatic beta cell electrical excitability and 2nd-phase insulin secretion. In Diabetologia, pp. S209–S209. Springer, New York, NY, USA. [DOI] [PMC free article] [PubMed] [Google Scholar]
- Vierra NC, Dadi PK, Milian SC, Dickerson MT, Jordan KL, Gilon P & Jacobson DA (2017). TALK-1 channels control β-cell endoplasmic reticulum Ca2+ homeostasis. Sci Signal 10, eaan2883. [DOI] [PMC free article] [PubMed] [Google Scholar]
- Walther D, Eugster A, Jergens S, Gavrisan A, Weinzierl C, Telieps T, Winkler C, Ziegler AG & Bonifacio E (2016). Tetraspanin 7 autoantibodies in type 1 diabetes. Diabetologia 59, 1973–1976. [DOI] [PubMed] [Google Scholar]
- Wang H, Bender A, Wang P, Karakose E, Inabnet WB, Libutti SK, Arnold A, Lambertini L, Stang M & Chen H (2017a). Insights into beta cell regeneration for diabetes via integration of molecular landscapes in human insulinomas. Nat Commun 8, 1–15. [DOI] [PMC free article] [PubMed] [Google Scholar]
- Wang S, Stanika RI, Wang X, Hagen J, Kennedy MB, Obermair GJ, Colbran RJ & Lee A (2017b). Densin-180 controls the trafficking and signaling of L-type voltage-gated CaV1. 2 Ca2+ channels at excitatory synapses. J Neurosci 37, 4679–4691. [DOI] [PMC free article] [PubMed] [Google Scholar]
- Wang X, Marks CR, Perfitt TL, Nakagawa T, Lee A, Jacobson DA & Colbran RJ (2017c). A novel mechanism for Ca2+/calmodulin-dependent protein kinase II targeting to L-type Ca2+ channels that initiates long-range signaling to the nucleus. J Biol Chem 292, 17324–17336. [DOI] [PMC free article] [PubMed] [Google Scholar]
- Wu J, Yan Z, Li Z, Yan C, Lu S, Dong M & Yan N (2015). Structure of the voltage-gated calcium channel CaV1. 1 complex. Science 350, aad2395. [DOI] [PubMed] [Google Scholar]
- Wu L, Bauer CS, Zhen X-G, Xie C & Yang J (2002). Dual regulation of voltage-gated calcium channels by PtdIns(4, 5)P2. Nature 419, 947–952. [DOI] [PubMed] [Google Scholar]
- Wu ZY, Zhu LJ, Zou N, Bombek LK, Shao CY, Wang N, Wang XX, Liang L, Xia J & Rupnik M (2012). AMPA receptors regulate exocytosis and insulin release in pancreatic β cells. Traffic 13, 1124–1139. [DOI] [PubMed] [Google Scholar]
- Yauch RL & Hemler ME (2000). Specific interactions among transmembrane 4 superfamily (TM4SF) proteins and phosphoinositide 4-kinase. Biochem J 351, 629–637. [PMC free article] [PubMed] [Google Scholar]
- Zhang Q, Bengtsson M, Partridge C, Salehi A, Braun M, Cox R, Eliasson L, Johnson PR, Renström E & Schneider T (2007). R-type Ca2+-channel-evoked CICR regulates glucose-induced somatostatin secretion. Nat Cell Biol 9, 453–460. [DOI] [PubMed] [Google Scholar]
Associated Data
This section collects any data citations, data availability statements, or supplementary materials included in this article.
Supplementary Materials
Data Availability Statement
The data that support the findings of this study are available from the corresponding author upon reasonable request.