

Abstract
Background:
Workplace physical aggressions determine severe consequences for people and organizations. Previous studies reported their spread in organizations and described factors related to their occurrence (e.g. aggressor within/outside the organization, type of activity, etc.). However, such data are not available in the Italian work contexts, limiting the possibility of intervention.
Objectives:
This study aims to provide a description of workplace physical aggressions in the Italian context and the Emilia-Romagna region, considering the main variables described in the literature.
Methods:
We used data available from the "Flussi informativi" database, containing national data provided by INAIL (National Institute for Insurance against Accidents at Work), which concern all injuries, occupational illness and insured companies’ information, from 2000 to 2018. Information about aggressions in the workplace in Italy and Emilia-Romagna are derived from a subset of these data, coded according to ESAW (European Statistics for Accidents at Work) requirements. The number of events per year per 100,000 estimated insured employees by INAIL is considered as an indicator.
Results:
In the period 2014-2018, 23,084 injures from aggression were registered in Italy (an average of 28.7 events per 100,000 employees) and 2,308 in Emilia Romagna (30.2). Aggressions by people outside the organization accounted for 85.14 % in Italy and 87.87 % in Emilia-Romagna region. “Health and social services”, “Offices and other activities” and “Transportation” were the sectors that showed the highest numbers of events and rates. Furthermore, we reported detailed results about the variation of the events between professions, the site and nature of the lesion and gravity of events.
Discussion:
The study provides a description of workplace physical aggressions in the Italian context and we discuss the implication of these results for primary, secondary and tertiary prevention strategies of intervention.
Keywords: Injuries, workplace physical aggression, trend
Introduction
The issue of workplace physical aggressions (or violence) constitutes an important area of research and intervention, due to its spread and the consequences that the phenomenon causes for people and organizations (1-3). Eurofound’s Fourth European Working Condition Surveys (4) showed that physical violence at work increased slightly between 1995 and 2005 in European Member States, from 4% to 6% of workers. Barling, Dupré and Kelloway (1), reported similar data relating to physical violence at work in their 2009 review, with percentages ranging between 1% and 5% of the workers of the studies considered.
The information available on the extent of this phenomenon in Italy is limited to few working contexts, although understanding the prevalence and severity of aggressions on workers is important in order to develop specific guidelines and interventions (5). Several studies have been conducted in the Italian health sector (see for example 6 – 10), describing the prevalence of physical and non-physical violence in different working units, showing the most exposed occupational categories, and analysing both relevant antecedents and consequences of such events. However, a similar thorough knowledge is not available for others working contexts in Italy and even the extent of aggression episodes is not yet known. Consequently, this contribution aims to provide an overall description of the frequency of workplace violence in Italy and in the Emilia-Romagna region.
It has long been pointed out in the literature that workplace aggression and workplace violence are closely related, but the two terms are not interchangeable (11, 12). Workplace aggression can be defined as the conduct of one or more individuals (internal or external to an organization), which occurs in the work context and which is intended to physically or psychologically harm one or more workers (3). Workplace Violence is understood as a particular case of aggression at work, a subcategory, which implies the use of physical force in order to hurt people or property, or to limit personal rights or freedoms (3). It follows that all violent conducts are also aggressive, but not all aggressions are violent (1).
For the purpose of this work (and the general aim mentioned above), the data available in Emilia-Romagna and in Italy on aggression injuries (data available within the “Flussi informativi” project) will be analysed, considered here as an indicator of (physical) violence at work. Therefore, the terms workplace aggression or violence will refer, in this paper, only to events involving the use of physical force, as defined above. In contrast, because it is not possible to obtain useful data from the available database, psychological workplace aggressions will not be treated, even if it is an equally important topic.
This survey aims to improve the knowledge of workplace violence on various aspects. In addition to providing a description of these events in the Italian context, we further detail the description according to the characteristics described as relevant in the literature. In particular, we will observe the trend over time in the period 2010-2018, we will distinguish the events caused by people outside the work organization from those related to internal staff (e.g. between colleagues) taking into account the business sector as well. Finally, information will be provided regarding the site and nature of the injury and the outcome. In this way, we intend to contribute to the issue by providing a detailed description of the phenomenon, which can be used in the design of research and interventions (13).
Methods
For the purpose of this study we used data extracted from the dataset “Flussi informativi” (Information Flows) for prevention in the workplace, which is the result of an agreement for the exchange of information between INAIL (Italian National Institute for Insurance against Accidents at Work), Regions and autonomous Provinces, and the Ministry of Health. Basically, it consists of an internet portal and database, managed by INAIL, containing the largest information assets in Italy on accidents and occupational diseases. It contains archives extracted directly from the INAIL management systems: information on all the companies insured since 2000 (personal data, economic classifications, employees and local offices); information on all accidents reported since 2000 (personal data and characteristics of workers, place, manner of occurrence and injuries suffered) and information on all occupational diseases reported since 1994 (personal data and characteristics of the technopathic, first certificate, coroner diagnosis and consequences of the pathology). The word “Flows” emphasises that the information is constantly updated every six months since 2002, the year in which the project began, reaching today tens of millions of records. This wealth of information is accessible only to specific INAIL figures (statisticians, prevention representatives and medical examiners) and to the heads of the prevention services of the Regions and health agencies. Only the latter, as judicial police officers, are also permitted access to personal and sensitive data. The use of confidential information for scientific studies poses a problem of verifiability of the data. In recent times, the Emilia-Romagna region established a Regional Information System for Prevention (SIRP) by creating the portal of the Regional Observatory on Occupational Accidents and Work-Related Illnesses (OReIL, www.oreil.it). The portal can be publicly consulted and contains the details of the Information Flows data, in anonymous form and limited to regional data. The details of the information are identical, which is why we will focus for a large part of our study on data from the Emilia-Romagna region, hoping to stimulate further studies and insights.
For the purpose of this investigation, injuries in the Emilia-Romagna region referring to the time span between 2010 and 2018, and summarized data of Italy of last five years (2014-2018) were extracted. Injuries “in itinere” (defined as accidents occurring during the journey home - work or place of refreshment and vice versa or on the occasion of travel necessary to reach any other service locations), road traffic injuries (secondary event of a road, rail, plane or naval accident, with the involvement of any means of transport), and those happened to students (events related to public and private schools) have been excluded.
The data on violence are derived from the information on the methods of occurrence in Information Flows and now also in OReIL. These are the eight ESAW (European Statistics for Accidents at Work) variables coded by Eurostat: working environment, working process, specific physical activity, activity material agent, deviation, deviation material agent, contact, contact material agent. The aggressions are coded as deviations and precisely: 82 Violence, aggression, threat - between company employees subjected to the employer’s authority; 83 Violence, aggression, threat - from people external to the company towards victims performing their duties (bank holdup, bus drivers, etc.).
The chosen items, in their formulation, are adequate to identify the accidents due to aggression, including the information about the agent. The extracted data are calculated as the number of events, per 1,000 injuries.
Subsequently, the data were examined by type of injury and by the variable “Gruppo Tariffa” (indicative of the type of activity carried out) observing the trend over time and considering as an indicator the number of events per year, per 100,000 employees.
It should be noted that in this case these are “INAIL employees”, defined as “Number of men-years insured by INAIL” approximated to the first decimal place. The man-year is a unit of account corresponding to an employee for 300 days a year and for the weekly duration of the work required by the current employment contract. The data relating to employees by territory and activity were collected from the company databases which were also made available as part of the “Flussi informativi” project.
Finally, we used data on the Injury outcome (classified as mild if resulted less or equal 40 days lost, serious otherwise), site of the injury, nature of injury, type of activity carried out by the worker at the time of the accident (using fields insurance premium tariff groups and insurance premium tariff voices) and professions (ISTAT CP 2011 classification).
On this basis, the frequency indices, cumulative for the period 2010-2018, were calculated by site and nature of the injury and insurance premium tariff groups and voices in Emilia-Romagna.
Results
In the period 2014-2018, a mean of 4,617 and 462 injures per year from aggression were reported in the workplace, respectively in Italy and in the Emilia-Romagna region. Aggressions by people outside the organization account for 87.87% in Emilia-Romagna region and 85.14% in Italy. Aggressions were 1% of the total with a frequency of approximately 10 case per 1,000 injuries recognized by INAIL for all causes. Table 1 and Figure 1 compare the trend over time (separately for Italy and Emilia-Romagna region) of the injuries from aggression reported in the period 2014-2018 (as mentioned, excluding those “in itinere”, on the road and for students) considering as an indicator the number of events per year and calculated as the number of events, per 100,000 employees (crude rate), between Italy and the Emilia-Romagna region.
Table 1.
Aggressions from people within or outside the organization in the period 2014 -2018 in Italy and Emilia Romagna region and rate by 100,000 employees
| Year | Within | Outside | Employees | Injuries/100,000 | |
| ITALIA | 2014 | 918 | 4,754 | 15,340,250 | 37.0 |
| 2015 | 835 | 4,178 | 15,796,483 | 31.7 | |
| 2016 | 800 | 4,085 | 16,224,094 | 30.1 | |
| 2017 | 468 | 3,349 | 16,546,281 | 23.1 | |
| 2018 | 409 | 3,288 | 16,962,411 | 21.8 | |
| Mean | 686 | 3,931 | 16,173,904 | 28.7 | |
| Emilia-Romagna | 2014 | 62 | 450 | 1,462,089 | 35.0 |
| 2015 | 70 | 360 | 1,496,023 | 28.7 | |
| 2016 | 47 | 437 | 1,522,869 | 31.8 | |
| 2017 | 48 | 387 | 1,568,804 | 27.7 | |
| 2018 | 51 | 396 | 1,621,785 | 27.6 | |
| Mean | 56 | 406 | 1,534,314 | 30.2 |
Figure 1:
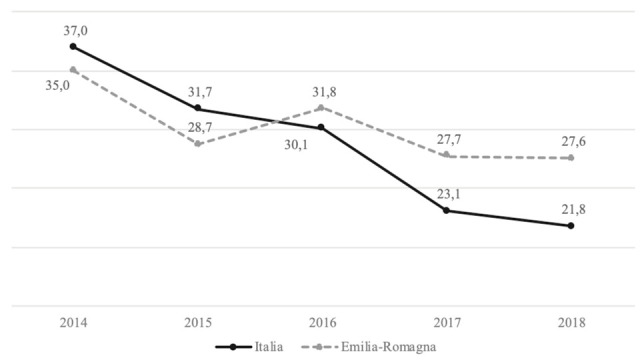
Trend rate of aggressions injuries/100,000 employees in the period 2014 – 2018, in Italy and Emilia Romagna region
There is a slight oscillation of the values in the period considered. Examining the number of events per 100,000 employees, an average of 28.7 events occurred in Italy (21.8 – 37.0) and 30.2 in Emilia-Romagna (27.6 – 35.0). The values show a slightly different trend as regards of Italy and Emilia-Romagna.
Using the Italian data in the period 2014-2018, Table 2 shows the number of injuries due to aggression within and outside the organization by type of activity (insurance premium tariff group). The Healthcare and Social Services sector was the one that showed the highest number of events (8,353) and also the highest crude rate (582.06 events per 100,000 employees), followed by the office and other activities sector (104.05 cases per 100,000 employees with 6,283 events) and the transport sector (413.32 cases per 100,000 employees with 2,465 events).
Table 2.
Aggressions from people within and outside the organization in Italy by type of activity (insurance premium tariff groups), between 2014-2018.
| Insurance premium tariff groups | Within | Outside | No. of Employees | Injuries/100,000 |
| 0300 Health and social services | 1,025 | 7,328 | 1,435,080 | 582.06 |
| 9100 Transportation | 167 | 2,298 | 596,395 | 413.32 |
| 0500 Cinema and shows | 107 | 159 | 117,297 | 226.77 |
| 0400 Cleaning and sanitation | 110 | 315 | 323,590 | 131.34 |
| 0200 Tourism and catering | 208 | 692 | 819,015 | 109.89 |
| 0700 Offices and other activities | 540 | 5,743 | 6,038,406 | 104.05 |
| 9200 Porterage | 23 | 14 | 35,835 | 103.25 |
| 0600 Education and research | 63 | 197 | 305,597 | 85.08 |
| 0100 Commercial activities | 113 | 930 | 1,322,819 | 78.85 |
| 9300 Warehouses | 61 | 42 | 181,172 | 56.85 |
| 4100 Electricity | 2 | 14 | 28,340 | 56.46 |
| 1200 Mattation and slaughter | 11 | 5 | 34,937 | 45.80 |
| 3200 Hydraulic construction | 2 | 6 | 17,562 | 45.55 |
| 4400 Water and steam systems | 1 | 7 | 24,686 | 32.41 |
| 1100 Work mechanical-agricultural | 1 | 13 | 45,194 | 30.98 |
| 3300 Roads and railways | 12 | 22 | 111,771 | 30.42 |
| 4300 Gas and oil pipelines | 1 | 3 | 14,636 | 27.33 |
| 2300 Skins and leathers | 5 | 3 | 30,834 | 25.95 |
| 6400 Means of transport | 22 | 44 | 292,849 | 22.54 |
| 3400 Urban lines and pipelines | 5 | 22,808 | 21.92 | |
| 5200 Carpentry and restoration | 22 | 12 | 179,006 | 18.99 |
| 6200 Metalworking | 75 | 43 | 675,021 | 17.48 |
| 7200 Processing of rocks | 12 | 6 | 103,813 | 17.34 |
| 4200 Communications | 4 | 24,954 | 16.03 | |
| 5100 First timber processing | 2 | 12,554 | 15.93 | |
| 1400 Food production | 27 | 27 | 339,740 | 15.89 |
| 2200 Paper and polygraphy | 15 | 7 | 151,619 | 14.51 |
| 6500 Instruments and apparatus | 24 | 29 | 390,018 | 13.59 |
| 3600 Installations | 23 | 42 | 490,829 | 13.24 |
| 2100 Chemistry, plastics and rubber | 40 | 8 | 363,820 | 13.19 |
| 6100 Metallurgy | 9 | 4 | 108,024 | 12.03 |
| 7100 Geology and mining | 1 | 1 | 17,493 | 11.43 |
| 8200 Packs | 13 | 18 | 310,896 | 9.97 |
| 3100 Building construction | 30 | 44 | 765,064 | 9.67 |
| 7300 Glass processing | 1 | 2 | 34,688 | 8.65 |
| 8100 Textile processing | 5 | 3 | 94,705 | 8.45 |
| 6300 Machines | 11 | 11 | 303,363 | 7.25 |
| Agriculture and State * | 646 | 1,553 | — | — |
| Total | 3,430 | 19,654 | 16,173,922 | 142.72 |
* For Agriculture and State the rate is not calculated because INAIL does not have a denominator
We used the data limited to the region Emilia Romagna to better explain the results described by type of activity (insurance premium tariff groups), and to further explore the sectors that showed the highest numbers of events and rates: “Health and social services”, “Offices and other activities” and “Transportation”. Table 3 explicates the results of the analyses relating to aggressions within and outside the organization by the more detailed description of activities (insurance premium tariff voice). The results highlight that, within healthcare and social services, most of the events happen in the group 0311 Hospitals and nursing homes, as can be expected. However, the highest index is detected for 312 Centres for the elderly and retired (18.7 injuries per 1,000 employees). Data are also relevant for “ambulance services” (12.9 injuries per 1,000 employees) and “Activities carried out for disabled people and drug addicts” (8.0 injuries per 1,000 employees). Among other activities, high indices are observed for “Security and surveillance services; Inspection of goods or materials” (77.0 injuries per 1,000 employees); “Security guards in general” (54.7 injury per 1,000 employees); “Rail transport; Underground transport; Tramway transport; Catering services on board trains; Management” (57.6 injuries per 1,000 employees); “Public services for the transport of persons” (28.7 injuries per 1,000 employees).
Table 3.
Aggressions from people within and outside the organization in Emilia Romagna region, by insurance premium tariff voices
| Insurance premium tariff groups | Within | Outside | No. of Employees | Injuries/1.000 |
| 0300 Health and social services | ||||
| 0311 Hospitals and nursing homes; etc. | 79 | 811 | 162,465 | 5.5 |
| 0312 Centres for the elderly and retirees; etc. | 63 | 720 | 41,787 | 18.7 |
| 0313 Ambulance services | 0 | 25 | 1,938 | 12.9 |
| 0314 Activities of disabled and drug addicts | 2 | 19 | 2,637 | 8.0 |
| 0321 Services in cemeteries | 1 | 1 | 594 | 3.4 |
| 0322 Funeral homes | 0 | 1 | 1,306 | 0.8 |
| 0700 Offices and other activities | ||||
| 0712 Security guards in general | 9 | 148 | 2,857 | 54.9 |
| 0713 Forest or country guards, gamekeepers | 1 | 2 | 384 | 7.8 |
| 0714 Security and surveillance services; etc. | 6 | 120 | 1,636 | 77.0 |
| 0721 Operational duties in general; etc. | 12 | 99 | 36,420 | 3.0 |
| 0722 VDT workers; Cash register workers; etc. | 34 | 174 | 626,833 | 0.3 |
| 0723 Personnel using motor vehicles | 33 | 458 | 150,893 | 3.3 |
| 0724 Personnel making access to factories; etc. | 2 | 9 | 53,535 | 0.2 |
| 0725 Managerial staff accessing factories; etc. | 2 | 7 | 6,812 | 1.3 |
| 0730 Personnel assigned to work & mixed services | 0 | 7 | 5,570 | 1.3 |
| 0750 Barbers, hairdressers and similar | 1 | 0 | 23,494 | 0.0 |
| 0761 Travelers and touts | 0 | 2 | 18,341 | 0.1 |
| 0762 Travelers and touts who deliver the goods | 0 | 1 | 2,496 | 0.4 |
| 9100 Transportation | ||||
| 9111 Rail transport; Underground transport; etc. | 4 | 77 | 1,406 | 57.6 |
| 9121 Transport with motor vehicles; etc. | 4 | 30 | 26,012 | 1.3 |
| 9123 Transportation of goods by motor vehicle | 8 | 22 | 27,396 | 1.1 |
| 9124 Public services for the transport of persons | 15 | 346 | 12,557 | 28.7 |
| 9125 Vehicle rental services; Driving schools | 0 | 13 | 6,881 | 1.9 |
| 9160 Services performed by airport companies; etc. | 0 | 3 | 1,950 | 1.5 |
| 9210 Porterage in land stations, overhead stations... | 0 | 1 | 226 | 4.4 |
| 9232 Loading, unloading, porterage of other goods | 2 | 0 | 6,164 | 0.3 |
| 9300 Postal warehouses; Other storage warehouses | 2 | 0 | 6,274 | 0.3 |
With this analysis it was possible to highlight also that in the category “Offices and other activities”, operational tasks such as inspections and safety have been included. In particular, in these operational tasks there is a high number of injuries and rather high indices (injuries per 1,000 employees).
Tables 4 analyse the site and nature of the lesion. The results presented show that most injuries occur to the head and trunk and the nature of the injury is for the most part (wounds and fractures) severe enough to require medical intervention. Therefore, the type of violence exercised and the location of the injury can be indicative of the severity of the injuries. This is consistent with the possible major underreporting of minor injuries or injuries that do not require medical intervention.
Table 4.
Site and nature of the lesion in the Emilia Romagna region
| Nature of the injury | Site of the lesion | |||
| Head | Trunk | Limbs | Total | |
| 1 - Wound | 127 | 180 | 12 | 319 |
| 2 - Contusion | 916 | 741 | 779 | 2,436 |
| 3 - Dislocation, sprain | 68 | 504 | 388 | 960 |
| 4 - Fracture | 119 | 125 | 71 | 315 |
| 5 - Anatomical loss | 1 | 2 | 0 | 3 |
| 6 - Injuries from infections, parasites | 3 | 0 | 1 | 4 |
| 7 - Injuries from other agents | 114 | 6 | 16 | 136 |
| 8 - Foreign bodies | 5 | 0 | 0 | 5 |
| 9 - Injuries from stress | 1 | 5 | 10 | 16 |
| No information | 304 | |||
| TOTAL | 1,354 | 1,563 | 1,277 | 4,498 |
Based on the ISTAT classification of professions (also used in the INAIL database), table 5 describes the professions with more serious injuries. In this case, the disability criterion > equal to 40 days was used. Essentially, these results confirm what was previously described with regard to the working sectors.
Table 5.
Injuries with prognosis greater than/equal to 40 days in Emilia Romagna region, by professions
| Voices Professions | 0300 Health | 0700 Offices | 9000 Transport | Total |
| 5.3.1.1.0.4 Social health operator | 390 | 20 | 0 | 410 |
| 3.2.1.1.1.1 Nurse | 272 | 20 | 0 | 292 |
| 5.4.8.2.0.6 Traffic policeman | 1 | 228 | 0 | 229 |
| 3.2.1.2.7.1 Professional educator | 96 | 6 | 0 | 102 |
| 5.4.8.6.0.6 Security guard | 0 | 101 | 1 | 102 |
| 5.4.4.3.0.12 Social welfare worker | 91 | 3 | 0 | 94 |
| 7.4.2.2.0.1 Bus driver | 0 | 0 | 90 | 90 |
| 4.4.1.2.0.4 Transport company controller | 0 | 2 | 59 | 61 |
| 5.4.8.2.0.4 Municipal policeman | 0 | 47 | 0 | 47 |
| 7.4.2.2.0.6 Bus driver | 0 | 2 | 42 | 44 |
| 3.2.1.5.2.1 Health assistant | 38 | 3 | 0 | 41 |
| 2.6.5.1.0.1 Educator for the disabled | 31 | 6 | 0 | 37 |
| 3.1.6.4.0.3 Railway train leader | 0 | 1 | 35 | 36 |
| 5.4.8.6.0.2 Private security services officer | 0 | 34 | 0 | 34 |
| 5.4.8.6.0.4 Bouncer | 0 | 33 | 0 | 33 |
| 8.1.5.2.0.1 Hospital auxiliary | 28 | 2 | 0 | 30 |
| 5.4.4.3.0.6 Assistant and carer for disabled | 24 | 1 | 0 | 25 |
| 4.1.1.2.0.6 Administrative employee | 2 | 21 | 1 | 24 |
| 4.4.1.2.0.6 Traveling controller | 0 | 0 | 17 | 17 |
| 7.4.2.1.0.6 Ambulance driver | 15 | 1 | 0 | 16 |
| 8.1.5.2.0.2 Auxiliary sanitary bearer | 13 | 3 | 0 | 16 |
| 4.2.1.2.0.6 Junior postal counter operator | 0 | 14 | 0 | 14 |
| 3.4.5.2.0.4 Social professional educator | 13 | 0 | 0 | 13 |
| 3.4.5.2.0.5 Active elderly care expert | 12 | 0 | 0 | 12 |
| 5.4.4.3.0.9 Social and health assistant | 10 | 2 | 0 | 12 |
| 2.4.1.2.0.27 Psychiatrist | 10 | 0 | 0 | 10 |
| 5.4.8.2.0.1 Municipal guard | 0 | 10 | 0 | 10 |
| 8.1.6.1.1.11 Company concierge | 0 | 10 | 0 | 10 |
| Other professions <10 cases | 81 | 151 | 90 | 322 |
| No information | 595 | 406 | 212 | 1,213 |
| Totals | 1,722 | 1127 | 547 | 3,396 |
Finally, table 6 reports the outcome of the events. Mild injuries (≤ 40 days absence) are the most frequent outcomes, but permanent disabilities and fatal outcomes are also recorded. The cut-off ≤ 40 days of absence is relevant not only as an index of severity, but also because the Italian penal code defines serious personal injuries with a prognosis of more than 40 days, and establishes that they are prosecuted ex officio and are subject to investigation by the Public Prosecutor’s Office.
Table 6.
Outcome of injuries by insurance premium tariff groups in Emilia Romagna region and percentage of serious cases in the total
| Insurance premium tariff groups | > 40 days absence | > 40 days absence | Permanent disability | Death | % serious* |
| 0300 Health and social services | |||||
| 0311 Hospitals and nursing homes; etc. | 775 | 64 | 51 | 0 | 12.9% |
| 0312 Centres for the elderly and retirees; etc. | 694 | 53 | 36 | 0 | 11.4% |
| 0313 Ambulance services | 21 | 4 | 0 | 0 | 16.0% |
| 0314 Activities of disabled and drug addicts | 17 | 1 | 3 | 0 | 19.0% |
| 0321 Services in cemeteries | 1 | 0 | 1 | 0 | 50.0% |
| 0322 Funeral homes | 1 | 0 | 0 | 0 | 0.0% |
| 0700 Offices and other activities | |||||
| 0712 Security guards in general | 132 | 13 | 12 | 0 | 15.9% |
| 0713 Forest or country guards. gamekeepers | 3 | 0 | 0 | 0 | 0.0% |
| 0714 Security and surveillance services; etc. | 107 | 10 | 9 | 0 | 15.1% |
| 0721 Personnel with operational duties in general; etc. | 95 | 6 | 10 | 0 | 14.4% |
| 0722 VDT workers; Cash register workers; etc. | 167 | 17 | 23 | 1 | 19.7% |
| 0723 Personnel using motor vehicles | 422 | 30 | 39 | 0 | 14.1% |
| 0724 Personnel making access to factories; etc. | 10 | 1 | 0 | 0 | 9.1% |
| 0725 Managerial staff accessing factories; etc. | 8 | 0 | 1 | 0 | 11.1% |
| 0730 Personnel assigned to work and mixed services | 5 | 1 | 1 | 0 | 28.6% |
| 0750 Barbers. hairdressers and similar | 1 | 0 | 0 | 0 | 0.0% |
| 0761 Travelers and touts | 1 | 0 | 1 | 0 | 50.0% |
| 0762 Travelers and touts who deliver the goods | 1 | 0 | 0 | 0 | 0.0% |
| 9100 Transportation | |||||
| 9111 Rail transport; Underground transport; etc. | 67 | 10 | 4 | 0 | 17.3% |
| 9121 Transport with motor vehicles; etc. | 26 | 2 | 6 | 0 | 23.5% |
| 9123 Transportation of goods by motor vehicle | 20 | 3 | 7 | 0 | 33.3% |
| 9124 Public services for the transport of persons | 310 | 25 | 26 | 0 | 14.1% |
| 9125 Vehicle rental services; Driving schools | 10 | 0 | 3 | 0 | 23.1% |
| 9160 Services performed by airport companies; etc. | 2 | 0 | 1 | 0 | 33.3% |
| 9210 Porterage in land stations. overhead stations, etc. | 0 | 0 | 1 | 0 | 100.0% |
| 9232 Loading, unloading, porterage of other goods | 1 | 1 | 0 | 0 | 50.0% |
| 9300 Postal warehouses; Other storage warehouses | 1 | 0 | 1 | 0 | 50.0% |
| 9111 Rail transport; Underground transport; etc. | 17 | 2 | 1 | 0 | 15.0% |
| TOTAL | 2,915 | 243 | 237 | 1 | 14.2% |
* Resulting in absence from work > 40 days, a permanent disability or the death of the worker.
The percentage of serious accidents show that in some sectors a high number of minor accidents are reported, while in others only serious ones are reported.
Discussion
Given the scarcity of information present in the Italian context, this investigation aimed to describe the presence of (physical) violence at work through the analysis of injures.
Barling et al. (1) highlighted that the possibility of describing and comparing the prevalence of violence at work (as well as psychological aggression) is limited by various difficulties, including, for example, the different definitions available to delimit the concept, the selection and data collection methods used (qualitative, quantitative, national data sets, etc.), the time frame considered, the employment context and the cultural differences in feeling victimized by violence. In particular, the authors stressed that it is problematic to make comparisons starting from different studies due to the different methods of selection and data collection used (1). However, these comparisons could provide useful information to better define primary, secondary and tertiary prevention strategies specific to the different working contexts (5, 13).
In our study, the use of a single method of selecting and collecting data has made it possible to compare different years and sectors of activity, bringing information scarcely available in the literature (5, 13).
The general results obtained show a decreasing trend of injuries both in Italy and in Emilia Romagna, with a reduction that seems greater in Italy. This trend could be explained with a minor under notification, considering overall data relating to accident notifications, from which it emerges that Emilia-Romagna appears among the Italian regions that report more injuries.
Our following results are generally in line with the international literature. As regards the aggressor Piquero et al. (2) summarized the available researches highlighting that the physical aggressor is more frequently a person outside the organization (for example, client, patient, etc.) and less often within the organization (a colleague, or, more rarely, a superior). Consistently, our results show that the aggressor is more frequently external to the organization, with a ratio of about 1 to 5 on the national territory and 1 to 6 in the Emilia-Romagna region. The analysis by activities for aggressions outside the organization, highlights the relevance of the possible “difficulty” in which one finds an external person not belonging to the organization: for physical or mental illness in health and assistance, for possible loss of control in other situations (transport, supervision). This is evidently the manifestation, in the workplace, that a more general response is possible in any context. This conclusion is consistent with the observation (2) that the factors connected with the violence at work seem to be above all situational, related to stressful situations and intentional, where the attacker was denied a service or request.
As regard the sector and work activity Piquero et al. (2) summarized the available researches highlighting that there are strong differences in exposure. The work setting most at risk of violence was healthcare (in particular nurses, doctors, mental health workers, emergency workers), followed by the education sector, law enforcement, military sector, social services and public transport drivers (2, 4). These categories of workers at risk have been studied through (even very numerous) specific surveys (for example, healthcare in Italy, see above), while researches that have compared different contexts and different categories of workers are rare. Our results on the Italian context are partly coherent with the literature, showing “Healthcare and Social Services”, “Office and other activities” and “Transport” as the sectors with the higher number of injuries due to aggression.
These sectors were further explored using the data collected in the context of the Emilia Romagna and considering the type of activity, the nature of the lesion, the professions and the outcome of the injuries.
Overall, the results observed in Tables 2, 3 and 6 show that the highest number of notifications of injuries with absence <40 days occur in sectors such as healthcare and public transport. Typically, in our country these are large companies where greater protection of workers is guaranteed, which facilitates the reporting of even minor events. Therefore, it can be assumed that in sectors where only serious incidents are reported, there is greater underestimation. Furthermore, the results regarding the type of violence exercised and the location of the lesion are consistent with what has been highlighted above as they are indicative of the possible underestimation of less serious injuries that do not require medical intervention.
The results of our survey are generally consistent, and mainly highlight two aspects. One concerns the definition of the sectors and professions that suffer most from the phenomenon of physical aggression and the other aspect concerns the already known under-reporting of minor injuries. Both of these aspects must be carefully evaluated for the planning of primary prevention interventions in the workplace, both in terms of opportunities and evaluation of effectiveness.
From a preventive point of view, the diffusion of the phenomenon, intrinsic to human nature, requires a widespread and specific training of workers (in particular in these sectors) to prevent and manage these situations, an intervention ascribable to those of primary prevention (4).
However, it appears evident that the possible aggression is one of the risks that must be taken into consideration to analyse the ways in which work is organized (for those who have to carry it out) and the offer of the service (for outsiders accessing the service).
In this sense, aggressions should be considered specifically in the organization of those activities and designing interventions aimed to improve the organization of work, many of which currently fall under the guidelines of prevention of work stress.
The evidence indicates that it is not possible to eliminate the risks for psychosocial well-being with a single type of intervention, but it is necessary to activate a process with different phases that require changes in the work environment, in particular at an organizational level, in a structured way, and that the more active worker involvement is sought the more effective (5). In other words, effective prevention of workplace violence can only be achieved within the framework of an overall improvement in the quality of work (7).
Only careful and constant monitoring will be able to highlight and evaluate the effects of improving working conditions and preventive interventions. To this end, future research and interventions should develop standard and comprehensive assessment tools for measuring workplace violence (5).
With regard to the quality of INAIL data, two aspects can be considered. The first concerns the percentage of missing values on the total of recognized accidents, which is on average 7% in the last five years. The other aspect concerns the correct attribution of ESAW items. It is not possible to evaluate exactly the propriety of the attribution but it can be considered, as regards the aggressions, that attribution mistake, compared to other types of events, is rather low.
The data we use provide an objective basis but have the limitation of referring only to events formally reported. It follows that in order to have a more complete picture of the phenomenon, it is necessary to rely also on other more subjective forms of evaluation, in order to direct the resources dedicated to prevention based on all available data. Alternatively, as Martini et al. (10) highlighted, the sensitivity of the method (so that it closely reflects active reporting of events) can be increased implementing a procedure for reporting events in a “company register of acts of violence” and making workers more aware of the need to report all such episodes.
No potential conflict of interest relevant to this article was reported by the authors
Sitography
INAIL institutional site http://www.inail.it
Open Data Inail (downloadable analytical data in csv format) https://dati.inail.it
Statistical INAIL database (aggregate data with user interface) https://bancadaticsa.inail.it
Independent portal using Open Data Inail (analytical data with user interface) http://www.opendatainail.it.
Emilia-Romagna complete anonymous data from Flussi Informativi and other regional sources (analytical data with user interface) http://www.oreil.it.
References
- 1.Barling J, Dupré KE, Kelloway EK. Predicting workplace aggression and violence. Annu Rev Psychol. 2009;60:671–692. doi: 10.1146/annurev.psych.60.110707.163629. [DOI] [PubMed] [Google Scholar]
- 2.Piquero NL, Piquero AR, Craig JM, Clipper SJ. Assessing research on workplace violence, 2000-2012. Aggression Violent Behav. 2013;18(3):383–394. [Google Scholar]
- 3.Schat ACH, Kelloway EK. Workplace violence. In: Barling J, Kelloway EK, Frone M, editors. Handbook of Work Stress. Thousand Oaks, CA: Sage; 2005. pp. 189–218. [Google Scholar]
- 4.Parent-Thirion A, Fernández Macías E, Hurley J, Vermeylen G. Fourth, European Working Conditions Survey, European Foundation for the Improvement of Living and Working Conditions. 2007. Available online at: http://www.eurofound.europa.eu/ewco/surveys/ewcs2005/index.htm. (last access 7-7-2020)
- 5.Li Y-L, Li R-Q, Qiu D, Xiao S-Y. Prevalence of workplace physical violence against health care professionals by patients and visitors: A systematic review and meta-analysis. Int J Environ Res Public Health. 2020;17(1) doi: 10.3390/ijerph17010299. [DOI] [PMC free article] [PubMed] [Google Scholar]
- 6.Acquadro Maran D, Varetto A, Zedda M, Magnavita N. Workplace Violence Toward Hospital Staff and Volunteers: A Survey of an Italian Sample. J Aggression Maltreat Trauma. 2018;27:76–95. [Google Scholar]
- 7.Magnavita N. The exploding spark: Workplace violence in an infectious disease hospital - A longitudinal study. BioMed Res Int 2013. 2013 doi: 10.1155/2013/316358. [DOI] [PMC free article] [PubMed] [Google Scholar]
- 8.Magnavita N, Heponiemi T. Violence towards health care workers in a Public Health Care Facility in Italy: A repeated cross-sectional study. BMC Health Serv Res. 2012;12(1) doi: 10.1186/1472-6963-12-108. [DOI] [PMC free article] [PubMed] [Google Scholar]
- 9.Magnavita N, Heponiemi T, Chirico F. Workplace Violence Is Associated With Impaired Work Functioning in Nurses: An Italian Cross-Sectional Study. J Nurs Scholarsh. 2020;52(3):281–291. doi: 10.1111/jnu.12549. [DOI] [PubMed] [Google Scholar]
- 10.Martini A, Fantini S, D’Ovidio MC, Ceracchi A, De Santis A. Risk assessment of aggression toward emergency health care workers. Occup Med. 2012;62(3):223–225. doi: 10.1093/occmed/kqr199. [DOI] [PubMed] [Google Scholar]
- 11.Hills DJ. Defining and classifying aggression and violence in health care work. Collegian. 2018;25(6):607–612. [Google Scholar]
- 12.Jiang L, Probst TM, Benson W, Byrd J. Voices carry: Effects of verbal and physical aggression on injuries and accident reporting. Accid Anal Prev. 2018;118:190–199. doi: 10.1016/j.aap.2018.02.017. [DOI] [PubMed] [Google Scholar]
- 13.Geoffrion S, Goncalves J, Sader J, Boyer R, Marchand A, Guay S. Workplace aggression against health care workers, law enforcement officials, and bus drivers: Differences in prevalence, perceptions, and psychological consequences. J Workplace Behav Health. 2017;32(3):172–189. [Google Scholar]
- 14.Nielsen K. How can we make organizational interventions work? Employees and line managers as actively crafting interventions. Hum Relat. 2013;66(8):1029–1050. [Google Scholar]