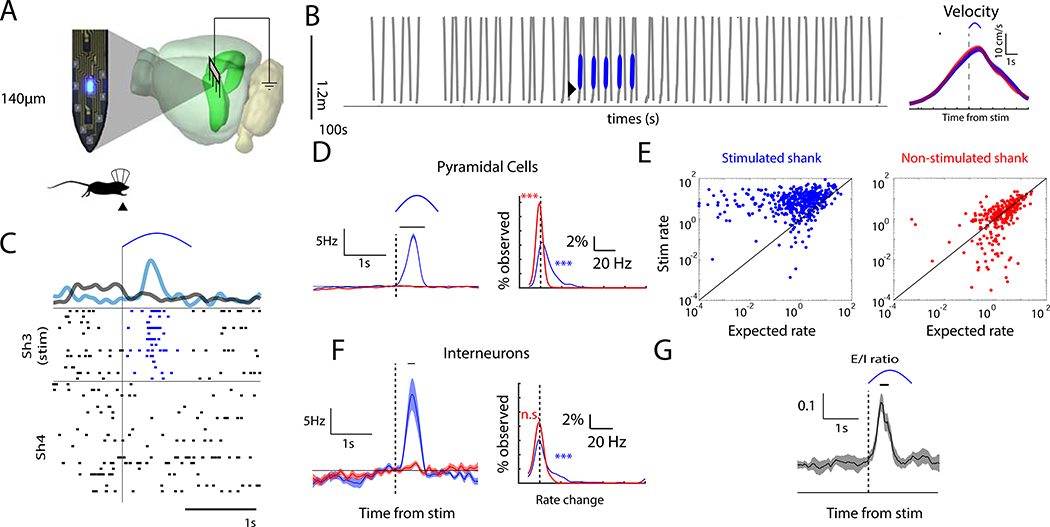
Figure 1. Location-specific optogenetic depolarization drives neural activity within a 125 μm radius.
(A) Schematic of a single shank from a μLED silicon probe. (B) Left, Mice (CaMKIIα − Cre :: Ai32) ran laps on a linear track (1.2m) retrieving water reward at each end. Breaking an infrared-beam (triangle) triggered 1s half-sine blue light via μLED probes implanted in area CA1. Right, the mean velocity of mice passing through the stimulation site before (red) and during (blue) optogenetic perturbation. Black bar indicates significant difference at p < 0.01 (C) Example sweep showing that light delivery drove pyramidal cells (rows = neurons) on the stimulated shank (Sh3). (D) Left, mean firing rate change of pyramidal cells recorded on the stimulated shank (blue, N = 631 cells) and non-stimulated shanks (red, N = 529 cells) around stimulation, relative to expected firing at that position. Bar indicates p < 0.001 comparing firing rate on stimulated versus non-stimulated shanks. Right, distribution of observed firing rate changes across neurons. Dashed line = no change. *** p < 0.001 comparing change in rate from zero. (E) For each neuron recorded on the stimulated shank (left) and non-stimulated shanks (right), the evoked firing rate as a function of the expected rate in that location based off of pre-Stim firing fields. (F) Same analysis as Panel D, for interneurons. (G) The mean excitatory/inhibitory ratio (E/I ratio) across sessions increases during stimulation. Bar indicates p < 0.001 comparing E/I ratio post-stimulation to the median E/I during the 2s prior to stim. See also Figure S1 and Figure S2.

