

Abstract
High‐grade oligodendroglial tumors, that is, anaplastic oligodendroglial tumors and glioblastomas with oligodendroglial component, differ significantly in terms of prognosis and response to chemotherapy. Differentiation might be difficult because the histological differences are vague and reliable markers are not established. We correlated the presence of putative cancer stem cells (CSC) in high‐grade oligodendroglial tumors (WHO grades III and IV) with clinical outcome. Tumors with favorable prognosis neither contained CSC nor did they show CD133 expression. Tumor cells resembled lineage‐restricted progenitor cells with limited proliferative capacity and differentiation profile. In contrast, CD133 expression and stem cell‐like tumor cells characterized tumors with poor prognosis. They showed neurosphere‐like growth, differentiated into cells of all neural lineages, and were tumorigenic in nude mice. In our series, CSC and expression of CD133 predicted the clinical course of disease better than the histological grading. To confirm these results, we retrospectively analyzed 36 high‐grade oligodendroglial tumors. Again, CD133 expression indicated shorter survival and predicted clinical outcome more reliable than the histological assessment.
Our data show that detection of CSC and expression of CD133 is predictive of prognosis in high‐grade oligodendroglial tumors. The presence or absence of CD133+ CSC might explain the crucial biological difference between WHO grade III and IV oligodendroglial tumors.
Keywords: oligodendroglial tumor, cancer stem cells, CD133, prognosis
INTRODUCTION
The WHO classification distinguishes between astrocytomas, oligodendrogliomas and mixed gliomas (11). They are further differentiated into grade II–IV tumors according to histological signs of malignancy with grade IV tumors being referred to as glioblastomas (GBM). The histological classification of different high‐grade oligodendroglial tumors, that is anaplastic oligodendrogliomas, anaplastic oligoastrocytomas (WHO grade III), and GBM with oligodendroglial component (WHO grade IV) might be difficult because of intratumoral diversity and poor differentiation 9, 13, 15. Nevertheless, a precise differentiation between these tumor entities is of special clinical interest as anaplastic oligodendroglial tumors have a more favorable prognosis than GBM and respond much better to chemotherapy 4, 15, 19. The response of anaplastic oligodendroglial tumors to chemotherapy can be predicted by the loss of heterozygosity (LOH) on chromosomes 1p and 19q, providing an independent prognostic marker 4, 21. In GBM, however, where this alteration is also found in about 20% of all cases, LOH 1p19q does not correlate with an improved outcome (8). Thus, it does not help to differentiate between WHO grades III and IV tumors. Given that the underlying biological differences between GBM and anaplastic oligodendroglial tumors are poorly understood, reliable markers of malignant progression, prognosis and the therapeutic response are highly sought.
Cancer stem cells (CSC—also referred to as “brain tumor initiating cells”) have only recently been described in a variety of brain tumors 2, 7, 18. The underlying cancer stem cell hypothesis postulates that malignancies are maintained by a rare subpopulation of stem cell‐like cells deriving from the cell of origin of a given tumor 1, 3, 5, 6, 16. CSC further differentiate into cells with limited proliferative potential that represent the vast majority of all tumor cells. Thus, only CSC fulfill stem cell criteria, that is self‐renewal, infinite proliferative potential and multipotency (20). In contrast, progenitor cells are characterized by limited proliferative potential and restricted differentiation properties 10, 20. Singh et al described CSC expressing the marker CD133 in a variety of brain tumors, among them GBM, pilocytic astrocytomas, and medulloblastomas. In oligodendroglial tumors, both the cell of origin and the existence of the putative CSC are uncertain 12, 22.
We have now investigated for the first time the putative CSC of eight high‐grade oligodendroglial tumors proposing that detection of CSC and expression of CD133 predict prognosis of high‐grade oligodendroglial tumors and might reflect the crucial biological difference between WHO grade III and IV oligodendroglial tumors.
MATERIAL AND METHODS
Patients
Tumor samples were provided by the Department of Neurosurgery (University of Regensburg). Experiments with human material were approved by the local ethics committee; all patients gave written informed consent (University of Regensburg, No. 05/105, June 14, 2005 and 06/025, March 16, 2006). Paraffin sections of six anaplastic oligoastrocytomas, four anaplastic oligodendrogliomas and 10 primary GBM were obtained from Dr Rümmele (Department of Pathology, University of Regensburg). Histological analyses and the determination of the 1p/19q LOH were performed in the Department of Pathology (University of Regensburg) and the German National Reference Center for Neuropathology (Universities of Bonn and Düsseldorf).
Culture of primary tumor cells and spheres
Samples were stored in sterile saline at 4°C and processed within 24 h after resection. They were washed and dissociated by mechanical and enzymatic means. Erythrocytes were lysed using NH4Cl. Trypan‐blue staining confirmed 80%–90% of viable cells after the procedure. Tumor cells were resuspended in DMEM‐F12 medium containing 20 ng/mL of EGF, bFGF (both from R&D Systems, Wiesbaden, Germany), and LIF (Chemicon International, Hamsphire, UK), and B27 (1:50, Gibco, Karlsruhe, Germany) as a stem cell permissive medium (2). Three representative visual fields were photographed weekly and sphere size was analyzed at 25x magnification.
Intracerebral injection of tumor cells
A total of 1 × 10⁶ tumor cells were dissociated in 2 µL PBS and injected into T‐lymphocyte‐deficient NMRI (nu/nu) mice as previously described (2). Animals were killed after 30 days. All experimental procedures were conducted in accordance with German laws governing animal care. Protocols were approved by the ethics committee for animal research of the local authorities. Tumor samples were snap‐frozen and stained with hematoxylin and eosin using standard protocols.
Flow cytometry
Cells were mechanically dissociated, centrifuged at 1500 U/minute for 5 minutes, and resuspended in PBS containing 0.5% BSA and 2 mM EDTA. Ten microlitres of CD133/2‐phycoerythrin, CD31‐allophycocyanin or fluorochrome‐conjugated IgG1 isotype control (all from Miltenyi Inc., Bergisch‐Gladbach, Germany) were added, the proportions of CD133+, CD31+, and CD133+/CD31+ cells were evaluated by flow cytometry (FACS Calibur or FACS Aria for cell sorting, both from Becton Dickinson). Initial analysis was carried out within 1 day of pimary cell culture.
Immunocytochemistry
Spheres derived from one single tumor cell were dissociated and stained as previously described (2). Primary antibodies were anti‐ß‐tubulin III (clone 5G8—Promega, Mannheim, Germany), anti‐glial fibrillary acidic protein (anti‐GFAP, DAKO, Hamburg, Germany), anti‐galactocerebroside C (anti‐GalC), and anti‐nestin (both from Chemicon, Chandlers Ford, UK). Anti‐mouse Alexa Fluor 488 (Molecular Probes, Leiden, NL, USA) was used for visualization. Nuclei were counterstained using DAPI (Sigma, Deisenhofen, Germany).
Immunohistochemistry
Four micrometres of sections were deparaffinized, rehydrated and heated 3 × 5 minutes with citrate buffer pH 6.0 for antigen retrieval. Nonspecific binding was blocked with 3% donkey serum and slides were double stained with anti‐human CD133 (clone K‐18, 1:50, Santa Cruz Biotechnology, Heidelberg, Germany) and anti‐human CD31 (clone JC70A, 1:50, Dako, Glostrup, DK). Visualization was achieved with donkey anti‐mouse IgG‐RHOX and biotinylated donkey anti‐goat/streptavidin‐FITC. Positive (Medulloblastoma) and negative controls (monoclonal mouse IgGκ1 and omission of the primary antibody) were run with each batch of staining. Nuclei were counterstained using DAPI (Sigma, Deisenhofen, Germany).
Microarray data and statistical analysis
Microarrays and survival data (13) have been published online previously 1 and were used with permission of Dr. Catherine Nutt (Massachusetts General Hospital and Harvard Medical School, Boston, USA). CD133 expression was assumed regardless of the absolute expression level, if a gene was classified as “present” in the array analysis. Array analysis was performed using BRB‐ArrayTools Version 3.4.0a developed by Dr Richard Simon and Amy Peng. 2 JMPin 5.1 was used for statistical calculations. All data presented are given as mean ± SEM.
RESULTS
We investigated eight oligodendroglial tumors categorized as anaplastic oligodendroglioma, anaplastic oligoastrocytoma, or GBM with oligodendroglial component. In order to investigate CSC characteristics in these tumors, we used culture conditions that promote the growth of neural stem cells and primary GBM‐derived CSC 2, 18.
Tumor cells from high‐grade oligodendroglial tumors with favorable prognosis resemble CD133‐ lineage‐restricted progenitor cells
In the initial FACS analysis within 24 h after resection, all five tumors with “favorable prognosis”, that is a progression‐free survival (PFS) of more than 52 weeks, were virtually devoid of CD133+ cells (Table 1). Upon prolonged in vitro culture of dissociated tumor cells, four out of five tumors displayed a typical growth pattern with little spheres consisting of 20–100 cells (Figure 1A), whereas one tumor showed no detectable growth at all. Spheres formed within the first week but then they stopped growing (Figure 1A,B) and started to disaggregate within the following 6–8 weeks with detritus and dying cells remaining (data not shown). We could neither show asymmetrical cell division nor infinite growth using the sequential minimal dilution assay (data not shown). Interestingly, tumor cells showed restricted differentiation patterns with cells expressing predominantly markers of oligodendroglial and neuronal lineages (Figure 1C), whereas only one tumor, histologically classified as anaplastic oligoastrocytoma, gave rise to scattered GFAP‐positive cells with typical astroglial morphology (data not shown). Implantation into nude‐mice was not feasible because of insufficient cell numbers.
Table 1.
Clinical, histological and in vitro properties of the CSC lines used. Abbreviations: C = chemotherapy; RT = radiotherapy; TMZ = temozolomid; n.d. = not determined because of lack of material.
| CSC line No. | PFS (weeks) | CD133 (%) | Neurospheres (Clongenic cells %) | Histology (Regensburg) | Histology (National Reference Center) | KI‐67 (%) | LOH 1p/19q | Therapy between surgery and progression |
|---|---|---|---|---|---|---|---|---|
| R24 | >74 | <3 | No | Glioblastoma (GBM) with oligodendroglial component | Oligoastrocytoma WHO grade III | 70 | yes | RT with concomitant TMZ, C with TMZ and pegylated liposomal doxorubucine |
| R26 | >72 | <3 | No | GBM with oligodendroglial component | Oligodendroglioma WHO grade III | 10 | 1p | C with TMZ and 13 cis retinoic acid |
| R31 | >68 | <3 | No | Oligoastrocytoma WHO grade III | Oligoastrocytoma WHO grade III | 30 | n.d. | C with TMZ and 13 cis retinoic acid |
| R42 | >62 | <3 | No | Oligoastrocytoma WHO grade III | Oligodendroglioma WHO grade III | 15 | yes | C with TMZ and 13 cis retinoic acid |
| R37 | >52 | <3 | No | GBM with oligodendroglial component | n.d. | >70 | n.d. | RT with concomitant TMZ, C with TMZ |
| R33 | 12 | 34 | Yes (0.01%) | GBM with oligodendroglial component | Oligoastrocytoma WHO grade III | 15–40 | yes | C with TMZ |
| R40 | 12 | 4 | Yes (5.3%–10.7%) | GBM with oligodendroglial component | GBM without oligodendroglial component | 25 | n.d. | RT with concomitant TMZ, C with TMZ |
| R52 | 12 | 24 | Yes (1%–3.5%) | GBM with oligodendroglial component | GBM with oligodendroglial component | 10 | n.d. | RT with concomitant TMZ, C with TMZ and pegylated liposomal doxorubicine |
Figure 1.
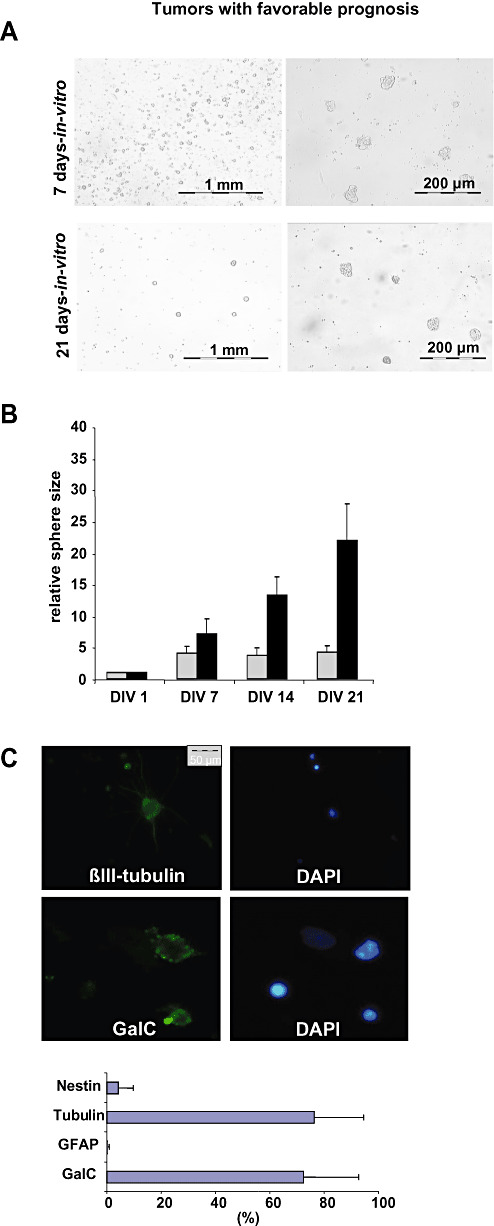
Tumor cells of high‐grade oligodendroglial tumors with favorable prognosis resemble CD133‐ lineage‐restricted progenitor cells. A. The in vitro growth pattern of tumors with favorable prognosis was analyzed after 7 and 21 days. Representative photographs are shown. B. Tumor spheres in high‐grade oligodendroglial tumors with favorable prognosis did not grow infinitely. The relative average sphere size of representative tumors with favorable prognosis (R24, R42, gray bars) as compared with primary GBM lacking an oligodendroglial component (R28 and R44, black bars) is given. Sphere size was determined weekly (DIV = days in vitro). C. Cells within spheres differentiated almost exclusively into GalC (Galactocerebrosid C, oligodendroglial marker) and βIII‐tubulin positive (neuronal marker) but barely GFAP‐ (glial fibrillary acid protein, astrocytic marker) or nestin‐expressing cells (stem cell marker). A representative differentiation profile is shown.
Thus, tumor cells derived from high‐grade oligodendroglial tumors with favorable prognosis neither contained) CSC nor showed CD133 expression but rather resembled CD133‐ lineage‐restricted progenitor cells with limited proliferative potential.
Tumor cells from high‐grade oligodendroglial tumors with poor prognosis are characterized by CSC and CD133 expression
Tumors with poor prognosis showed a distinct CD133+ population (Table 1). After 21 days of primary cell culture, dissociated cells from all three investigated tumors showed non‐adherent neurosphere‐like growth with few spheres of continuously increasing size (CSC‐like spheres) and multiple small spheres showing limited growth (Figure 2A,B).
Figure 2.
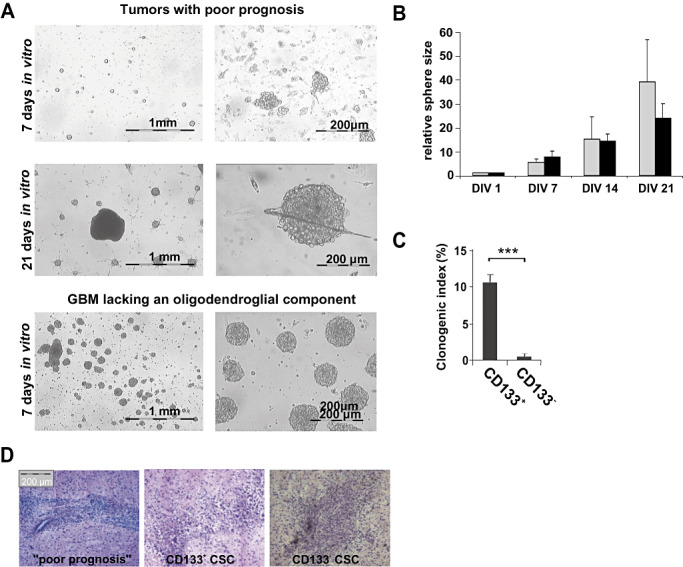
Tumor cells of high‐grade oligodendroglial tumors with poor prognosis are characterized by CSC and CD133 expression. A. Tumors with poor prognosis showed non‐adherent neurosphere‐like growth with few spheres of continuously increasing size within multiple small spheres showing limited growth. The growth pattern of primary glioblastomas (GBM) lacking an oligodendroglial component (R44) is shown for comparison (lower row). Representative photographs at DIV 7 and 21 are shown. B. The relative average sphere size of tumors with poor prognosis (R40, R52, R30, gray bars) as compared with GBM lacking an oligodendroglial component (R28 and R44, black bars) is given. Sphere size was determined weekly. C. Cancer stem cell (CSC) lines derived from tumors with poor prognosis were sorted for CD133 expression and plated with 10 cells/well. The number of spheres formed by CD133+ and CD133‐ cells after 14 days is given (clonogenic index: spheres per 100 cells plated). D. GBMs with oligodendroglial component were driven by CSC reconstituting a new tumor when injected into immunodeficient mice (n = 4) and were similarly tumorigenic as CD133+ and CD133‐ CSC isolated from primary GBM lacking an oligodendroglial component (2).
Using the minimal dilution assay, we found that 0.01%–10% of the replated tumor cells were able to form spheres and to proliferate (Table 1). When sorted for CD133 expression, only the CD133+ subset of cells retained their proliferative potential and showed neurosphere‐like growth in vitro (Figure 2C). Spheres originated from individual proliferating cells and not as a result of cell clustering (Supplementary Figure S1). These CSC grew rapidly (0.2–4 passages per month) and even upon prolonged propagation in vitro (over 1 year) no limitation of replicative potential became apparent. When implanted into immunodeficient nude mice, putative CSC formed glioblastoma‐like lesions within 30 days, displaying similar tumorigenicity as CD133+ CSC or CD133‐ CSC derived from different subtypes of primary GBM lacking an oligodendroglial component (2) (Figure 2D). Tumor cells within spheres expressed markers of all three neural lineages (Figure 3A), which indicates that the sphere‐forming single CSC is multipotent. Notably, primary GBM with oligodendroglial component and GBM lacking an oligodendroglial component did not display markedly different differentiation profiles (i.e. proportions of cells expressing the respective neural lineage markers) in vitro (Figure 3B).
Figure 3.
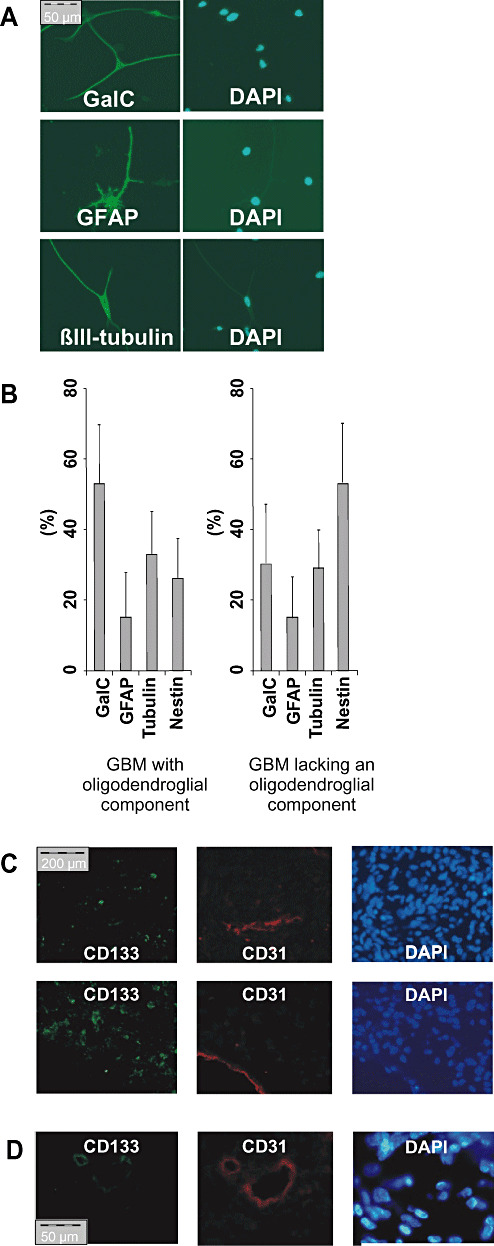
CD133 + cells derived from high‐grade oligodendroglial tumors with poor prognosis differentiate into cells expressing all neural lineage markers. A. Spheres derived from single CD133+ tumor cells were stained as in Figure 1C for markers of all three neural lineages. B. A representative differentiation profile of CSC derived from a glioblastomas with (left) and without an oligodendroglial component (right) is given. C,D. Immunofluorescence staining against CD133 (green) and CD31 (red). (C) Two representative pictures of CD133+ tumors without CD133+/CD31+ cells. (D) One of 20 tumors investigated showed CD133+/CD31+ vessel‐like structures.
As more malignant tumors also show increased vascularization, we wanted to exclude the possibility that the intratumoral CD133 expression was due to presence of CD133+ vascular progenitor cells (17). Immunohistochemical double staining performed on 20 WHO grade III and IV gliomas confirmed that the vast majority of CD133‐positive cells did not co‐express the panvascular marker CD31 (Figure 3C). In fact, weakly double‐positive cells for CD133 and CD31 were only detected in one of 20 tumors investigated (Figure 3D). We confirmed these results by FACS analysis of five CSC lines and four freshly resected high‐grade gliomas (Supplementary Table S1).
Thus, CD133 is not a marker for vascularization but rather characterizes cells displaying the hallmarks of stem cells. Intriguingly, these CD133+ cells were only found in oligodendroglial tumors with poor prognosis—and they strongly resembled CSC derived from primary GBM lacking an oligodendroglial component (2). Accordingly, we further investigated whether the presence or absence of CD133+ cells might be of prognostic value for primary GBM with an oligodendroglial component.
In high‐grade oligodendroglial tumors, CD133 expression indicates stem cell‐like tumor cells and is a negative prognostic marker
CD133 expression was strongly associated with neurosphere‐like growth and the existence of CSC (Table 1). The PFS of patients with and without CD133+ cells differed significantly in spite of the limited patient population (Figure 4A, Table 1). Patients with CD133+ tumors containing CSC progressed within 3 months after resection despite multimodal therapy (Table 1). In contrast, all patients with CD133‐ tumors devoid of CSC showed stable disease at the time of publication. The histological grading alone (WHO grade III vs. IV, Figure 4A) was inferior in predicting the PFS of patients with high‐grade oligodendroglial tumors. Conversely, 20 high‐grade gliomas analyzed by immunohistochemistry showed a significant correlation between CD133 expression and histological tumor grading (Figure 4B). In order to confirm our results, we retrospectively analyzed the prognostic significance of CD133 expression in 36 previously published patients (13). In this study, tumors were classified by senior neuropathologists as classical anaplastic oligodendrogliomas, non‐classical anaplastic oligodendrogliomas or non‐classical GBM and analyzed using Affymetrix U95Av2 GeneChips. Whereas the histological diagnosis correlated with the proportion of long term survivors, it failed to predict the clinical course within the first 2 years (Figure 4C). Our re‐analysis of these data confirmed CD133 to be negatively associated with survival (Supplementary Table S2). In fact, similar to our study, patients with CD133‐ tumors survived significantly longer than patients with CD133+ tumors (176 vs. 83.6 weeks, P < 0.05, Wilcoxon rank test; Figure 4D). Unfortunately, the lack of additional patient information concerning for example age and treatment precluded a multivariate Cox analysis that could have further substantiated our findings. Nevertheless, the present data already confirm that CD133 expression is a superior and less subjective predictor of patient survival as compared with the histological diagnosis, at least within the first 2 years.
Figure 4.
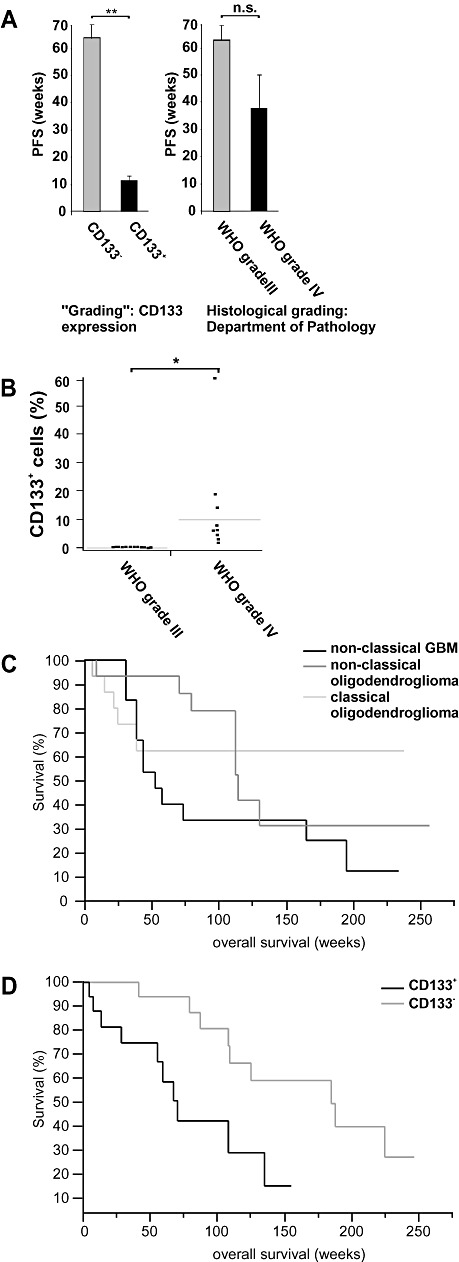
In high‐grade oligodendroglial tumors, CD133 expression indicates stem cell‐like tumor cells and is a negative prognostic marker. A. The progression‐free survival (PFS) of patients with CD133+ high‐grade oligodendroglial tumors was significantly shorter as compared to CD133‐ tumors (left panel, **P < 0.01, Wilcoxon rank test). The histological grading (Department of Pathology, University of Regensburg) did not significantly correlate with PFS (right panel, P = 0.74, Wilcoxon rank test). B. The CD133 expression in six anaplastic oligoastrocytomas (WHO grade III), four anaplastic oligodendrogliomas (WHO grade III), and 10 primary GBM lacking an oligodendroglial component (WHO grade IV) is given (*P < 0.05). C,D. Previously published microarrays and corresponding prognostic data were analyzed for CD133 expression (13). C. Tumors were classified by senior neuropathologists as classical anaplastic oligodendrogliomas, non‐classical anaplastic oligodendrogliomas and non‐classical GBM. A tumor was considered to be “classical” if it had a textbook‐like histological appearance [i.e. anaplastic oligodendroglioma or glioblastomas (GBM)] and if all neuropathologists involved agreed on the diagnosis. Otherwise, the tumor was classified as “non‐classical” oligodendroglioma or GBM. The histological diagnosis did not significantly correlate with survival (P > 0.10, Wilcoxon rank test). D. Tumors were grouped according to microarray data documenting the presence (i.e. “P call” in the array analysis) or absence (i.e. “A call” or “M call”) of CD133 mRNA expression. Patients with CD133‐ tumors survived significantly longer than patients with CD133+ tumors (P < 0.05, Wilcoxon rank test, n = 36).
DISCUSSION
CSC have only recently been isolated in various brain tumors including GBM 2, 12, 16, 18. In this study, we investigated tumor‐initiating cells in high‐grade oligodendroglial tumors, that is, anaplastic oligodendroglioma, anaplastic oligoastrocytoma, and GBM with oligodendroglial component. Our data suggest that tumor‐initiating cells in high‐grade oligodendroglial tumors with favorable prognosis do not have stem cell properties but rather resemble a progenitor‐like cell type. They neither proliferated infinitely nor differentiated into cells of all neural lineages. In contrast, tumors that rapidly progressed were driven by cells fulfilling all stem cell criteria (including infinite growth, multipotency and tumorigenicity in vivo). In addition, their differentiation into cells expressing markers of all three neural lineages confirmed that these cells were indeed of neural origin and not invading vascular progenitor cells (Figure 3C,D). In line with a recent report (22), these cells could therefore be addressed as CSC. Together, these data suggest that the existence of CSC within a given high‐grade oligodendroglial tumor might be the major biological difference between anaplastic oligodendroglial tumors (WHO grade III) and GBM with oligodendroglial component (WHO grade IV).
The proportion of CD133+ cells and CSC within a tumor varied considerably. Even if only a very small subset of cells displayed neurosphere‐like growth in vitro (e.g. 0.01% in tumor R33), the patient's tumor progressed within a few weeks under multimodal therapy despite the “favorable histology” and the LOH 1p/19q. This suggests that the acquisition of “stemness” by one or few cells within anaplastic oligodendroglial tumors might govern their clinical “behavior” and thus be the crucial step in the transition to a secondary GBM.
This hypothesis is supported by the prognostic significance of CD133, a marker for neural stem cells (20) and CSC in a variety of brain tumors comprising one subset of GBM 2, 14, 18. In our small series of cases as well as in previously published patient data (Figure 4C,D), CD133 expression was associated with a poor prognosis and correlated better with clinical course than LOH 1p19q and the histological grading. While the prognostic significance of the histological diagnosis strongly depends on the experience of the respective neuropathologist, analysis of both available data sets revealed that CD133 expression was superior in predicting the patient's survival within the first 2 years (13). CD133 might thus help to identify patients with slowly progressing negative tumors that could be initially treated with less toxic chemotherapeutical protocols (e.g. temozolomide). On the other hand, patients with CD133+ tumors might benefit from a more intensified combined radiochemotherapy 19, 21. Therefore, CD133 staining protocols suitable for routine screening need to be established that will allow the reproduction of our results in additional patient populations.
We propose that CD133 is a marker for “stemness” in high‐grade oligodendroglial tumors, the acquisition of which might be the pivotal step in the malignant progression into a secondary GBM. Hence, the analysis of CD133 expression might additionally help the neuropathologist to differentiate between sometimes hard to distinguish WHO grade III and WHO grade IV oligodendroglial tumors.
Supporting information
Figure S1. Cells were seeded at one cell per well in 96‐well plates. Spheres that developed from single cells were photographed at regular intervals. A representative sphere originating from a single cell (and not from cell clustering) is shown at various time points.
Table S1. Proportion of CD133+ and CD31+ cells determined by FACS analysis.
Table S2. Genes associated with survival.
This material is available as part of the online article from: http://www.blackwellsynergy.com
Please note: Blackwell Publishing is not responsible for the content or functionality of any supplementary materials supplied by the authors. Any queries (other than missing material) should be directed to the corresponding author for the article.
Supporting info item
Supporting info item
Supporting info item
ACKNOWLEDGMENTS
We are indebted to Dr Catherine Nutt (Massachusetts General Hospital and Harvard Medical School, Boston, USA) for valuable discussion and the permission to use the microarrays and survival data, to Michel Mittelbronn (Department of Neuropathology, University of Zürich) and Jens Schittenhelm (Department of Neuropathology, University of Tübingen) for valuable discussion and to Guenther Eissner (Department of Internal Medicine, University of Regensburg) for establishing the CD31 FACS. We thank Annett Dörffelt, Annette Lohmeier and Eva‐Maria Stoerr for their excellent technical assistance.
Footnotes
REFERENCES
- 1. Bao S, Wu Q, McLendon RE, Hao Y, Shi Q, Hjelmeland AB et al (2006) Glioma stem cells promote radioresistance by preferential activation of the DNA damage response. Nature 444:756–760. [DOI] [PubMed] [Google Scholar]
- 2. Beier D, Hau P, Proescholdt M, Lohmeier A, Wischhusen J, Oefner PJ et al (2007) CD133+ and CD133‐ glioblastoma‐derived cancer stem cells show differential growth characteristics and molecular profiles. Cancer Res 67:4010–4015. [DOI] [PubMed] [Google Scholar]
- 3. Bjerkvig R, Tysnes BB, Aboody KS, Najbauer J, Terzis AJ (2005) Opinion: the origin of the cancer stem cell: current controversies and new insights. Nat Rev Cancer 5:899–904. [DOI] [PubMed] [Google Scholar]
- 4. Cairncross JG, Macdonald DR (1988) Successful chemotherapy for recurrent malignant oligodendroglioma. Ann Neurol 23:360–364. [DOI] [PubMed] [Google Scholar]
- 5. Clarke MF (2005) Self‐renewal and solid‐tumor stem cells. Biol Blood Marrow Transpl 11:14–16. [DOI] [PubMed] [Google Scholar]
- 6. Dirks PB (2005) Brain tumor stem cells. Biol Blood Marrow Transpl 11:12–13. [DOI] [PubMed] [Google Scholar]
- 7. Hemmati HD, Nakano I, Lazareff JA, Masterman‐Smith M, Geschwind DH, Bronner‐Fraser M, Kornblum HI (2003) Cancerous stem cells can arise from pediatric brain tumors. Proc Natl Acad Sci USA 100:15178–15183. [DOI] [PMC free article] [PubMed] [Google Scholar]
- 8. Houillier C, Lejeune J, Benouaich‐Amiel A, Laigle‐Donadey F, Criniere E, Mokhtari K et al (2006) Prognostic impact of molecular markers in a series of 220 primary glioblastomas. Cancer 106:2218–2223. [DOI] [PubMed] [Google Scholar]
- 9. Kraus JA, Wenghoefer M, Schmidt MC, Von Deimling A, Berweiler U, Roggendorf W et al (2000) Long‐term survival of glioblastoma multiforme: importance of histopathological reevaluation. J Neurol 247:455–460. [DOI] [PubMed] [Google Scholar]
- 10. Liu Y, Rao MS (2004) Glial progenitors in the CNS and possible lineage relationships among them. Biol Cell 96:279–290. [DOI] [PubMed] [Google Scholar]
- 11. Louis DN, Ohgaki H, Wiestler OD, Cavenee WK, Burger PC, Jouvet A et al (2007) The 2007 WHO classification of tumours of the central nervous system. Acta Neuropathol (Berl) 114:97–109. [DOI] [PMC free article] [PubMed] [Google Scholar]
- 12. Noble M, Dietrich J (2004) The complex identity of brain tumors: emerging concerns regarding origin, diversity and plasticity. Trends Neurosci 27:148–154. [DOI] [PubMed] [Google Scholar]
- 13. Nutt CL, Mani DR, Betensky RA, Tamayo P, Cairncross JG, Ladd C et al (2003) Gene expression‐based classification of malignant gliomas correlates better with survival than histological classification. Cancer Res 63:1602–1607. [PubMed] [Google Scholar]
- 14. Piccirillo SG, Reynolds BA, Zanetti N, Lamorte G, Binda E, Broggi G et al (2006) Bone morphogenetic proteins inhibit the tumorigenic potential of human brain tumour‐initiating cells. Nature 444:761–765. [DOI] [PubMed] [Google Scholar]
- 15. Reifenberger G, Collins VP (2004) Pathology and molecular genetics of astrocytic gliomas. J Mol Med 82:656–670. [DOI] [PubMed] [Google Scholar]
- 16. Reya T, Morrison SJ, Clarke MF, Weissman IL (2001) Stem cells, cancer, and cancer stem cells. Nature 414:105–111. [DOI] [PubMed] [Google Scholar]
- 17. Salven P, Mustjoki S, Alitalo R, Alitalo K, Rafii S (2003) VEGFR‐3 and CD133 identify a population of CD34+ lymphatic/vascular endothelial precursor cells. Blood 101:168–172. [DOI] [PubMed] [Google Scholar]
- 18. Singh SK, Hawkins C, Clarke ID, Squire JA, Bayani J, Hide T et al (2004) Identification of human brain tumour initiating cells. Nature 432:396–401. [DOI] [PubMed] [Google Scholar]
- 19. Stupp R, Mason WP, Van Den Bent MJ, Weller M, Fisher B, Taphoorn MJ et al (2005) Radiotherapy plus concomitant and adjuvant temozolomide for glioblastoma. N Engl J Med 352:987–996. [DOI] [PubMed] [Google Scholar]
- 20. Uchida N, Buck DW, He D, Reitsma MJ, Masek M, Phan TV et al (2000) Direct isolation of human central nervous system stem cells. Proc Natl Acad Sci USA 97:14720–14725. [DOI] [PMC free article] [PubMed] [Google Scholar]
- 21. Van Den Bent MJ, Carpentier AF, Brandes AA, Sanson M, Taphoorn MJ, Bernsen HJ et al (2006) Adjuvant procarbazine, lomustine, and vincristine improves progression‐free survival but not overall survival in newly diagnosed anaplastic oligodendrogliomas and oligoastrocytomas: a randomized European organisation for Research and treatment of cancer phase III trial. J Clin Oncol 24:2715–2722. [DOI] [PubMed] [Google Scholar]
- 22. Yi L, Zhou ZH, Ping YF, Chen JH, Yao XH, Feng H et al (2007) Isolation and characterization of stem cell‐like precursor cells from primary human anaplastic oligoastrocytoma. Mod Pathol 20:1061–1068. [DOI] [PubMed] [Google Scholar]
Associated Data
This section collects any data citations, data availability statements, or supplementary materials included in this article.
Supplementary Materials
Figure S1. Cells were seeded at one cell per well in 96‐well plates. Spheres that developed from single cells were photographed at regular intervals. A representative sphere originating from a single cell (and not from cell clustering) is shown at various time points.
Table S1. Proportion of CD133+ and CD31+ cells determined by FACS analysis.
Table S2. Genes associated with survival.
This material is available as part of the online article from: http://www.blackwellsynergy.com
Please note: Blackwell Publishing is not responsible for the content or functionality of any supplementary materials supplied by the authors. Any queries (other than missing material) should be directed to the corresponding author for the article.
Supporting info item
Supporting info item
Supporting info item