

Abstract
Hypoxic injury in the perinatal period results in periventricular white matter (PWM) lesions with axonal damage and oligodendroglial loss. It also alters macrophage function by perpetuating expression of inflammatory mediators. Relevant to this is the preponderance of amoeboid microglial cells (AMC) characterized as active macrophages in the developing PWM. This study aimed to determine if AMC produce proinflammatory cytokines that may be linked to the oligodendroglial loss observed in hypoxic PWM damage (PWMD). Wistar rats (1 day old) were subjected to hypoxia, following which upregulated expression of tumor necrosis factor‐α (TNF‐α), interleukin‐1β (IL‐1β), TNF receptor 1 (TNF‐R1) and IL‐1 receptor 1 (IL‐1R1) was observed. This was coupled with apoptosis and expression of TNF‐R1 and IL‐1R1 in oligodendrocytes. Primary cultured microglial cells subjected to hypoxia (3% oxygen, 5% CO2 and 92% nitrogen) showed enhanced expression of TNF‐α and IL‐1β. Furthermore, mitogen‐activated protein (MAP) kinase signaling pathway was involved in the expression of TNF‐α and IL‐1β in microglia subjected to hypoxia. Our results suggest that following a hypoxic insult, microglial cells in the neonatal rats produce inflammatory cytokines such as TNF‐α and IL‐1β via MAP kinase signaling pathway. These cytokines are detrimental to oligodendrocytes resulting in PWM lesion.
Keywords: amoeboid microglial cells, hypoxia, IL‐1β, MAP kinase, oligodendrocytes, PWMD, TNF‐α
INTRODUCTION
Hypoxia is an important factor affecting the normal development and maturation of the central nervous system. Many maternal causes such as diabetes, asthma, anemia and smoking, and intrapartum events such as prolonged labor are associated with fetal hypoxia 24, 35. In neonates, pulmonary or cardiac dysfunction and neonatal stroke result in hypoxia (25). Although damage to selected regions of the immature brain is caused by hypoxia–ischemia, the periventricular white matter (PWM) is especially vulnerable prior to 32 weeks of gestation (18). PWM damage (PWMD) contributes significantly to neonatal mortality and long‐term neurodevelopmental deficits 28, 36 such as cerebral palsy, impaired vision, hearing impairments and mental retardation in the premature infant.
Damage to axons and developing oligodendrocytes before the onset of myelination has been described as a characteristic feature of PWMD 9, 27, but the factors leading to this are not clear. Activated immune cells are thought to play an important role in damaging the axons and oligodendrocytes by releasing inflammatory cytokines such as interleukin‐1β (IL‐1β) and tumor necrosis factor‐α (TNF‐α) 15, 17, 31. In search of the putative cellular source of these proinflammatory cytokines, attention has been drawn to the wide occurrence of amoeboid microglial cells (AMC), which are resident immune cells in the developing PWM (22). Indeed, microglial cells have been detected in periventricular lesions in children with signs of periventricular leukomalacia 10, 19.
The role of AMC in PWMD in neonatal brain under hypoxic conditions has not been fully elucidated. This study sought to determine if AMC contribute to the occurrence of PWMD under hypoxic conditions in the neonatal brain. The expression of cytokines such as TNF‐α and IL‐1β in AMC through activated mitogen‐activated protein (MAP) kinase signaling pathway was first examined. We then ascertained whether developing oligodendrocytes in the PWM in hypoxic neonatal rats would be the potential target by expressing TNF receptor 1 (TNF‐R1) and IL‐1 receptor 1 (IL‐1R1), and if so, whether they would undergo apoptosis. We report here that AMC indeed are the main source of proinflammatory cytokines that may contribute to development of PWMD by affecting the oligodendrocytes in hypoxia.
MATERIALS AND METHODS
Animals
Wistar rats (1 day old) were used in this study as the developmental stage of white matter in rats at birth has been described to be equivalent to mid‐gestation in humans (34). Eighty rats were subjected to hypoxia by placing them in a chamber filled with a gas mixture of 5% oxygen and 95% nitrogen (model: MCO 18M; Sanyo Biomedical Electrical Co, Ltd., Tokyo, Japan.). The rats were then allowed to recover under normoxic conditions for 3 and 24 h, and for 3, 7 or 14 days before being killed. Another group of 80 rats kept outside the chamber were used as age‐matched controls (Table 1). Animal handling and experiments were approved by the Institutional Animal Care and Use Committee, National University of Singapore (NUS).
Table 1.
Number of rats killed at various time points after the hypoxic exposure (in brackets) and their age‐matched controls for various methods (outside the brackets).
| Control (hypoxia) | Double Immunofluorescence | Real‐time RT‐PCR | Western blotting | Electron microscopy |
|---|---|---|---|---|
| 1 day (3 h) | 3 (3) | 5 (5) | 5 (5) | 3 (3) |
| 2 days (24 h) | 3 (3) | 5 (5) | 5 (5) | 3 (3) |
| 4 days (3 days) | 3 (3) | 5 (5) | 5 (5) | 3 (3) |
| 8 days (7 days) | 3 (3) | 5 (5) | 5 (5) | 3 (3) |
| 15 days (14 days) | 3 (3) | 5 (5) | 5 (5) | 3 (3) |
Microglial cell culture
Mixed glial cells separated from the cerebral cortex of 1‐day‐old postnatal Wistar rats (obtained from Laboratory Animal Center, NUS) were plated on a 75‐cm2 flask at a density of 1.2 × 10⁶ cells/mL of Dulbecco's Modified Eagle's medium® (Sigma, St. Louis, MO, USA) supplemented with 10% fetal calf serum (Hyclone, Logan, UT, USA). The culture medium was changed after 24 h and then twice a week. Two weeks later, the mixed glial cells were purified with mild trypsinization (0.05%–0.12%) in the presence of 0.2–0.5 mM EDTA and 0.5–0.8 mM Ca2+ for 10 minutes as described before by Saura et al (32). For immunocytochemistry, purified microglial cells in the 75‐cm2 flask were isolated by trypsinization and the detached cells were plated at 2.5 × 10⁵ per well on a 24‐multi‐well culture dish and incubated at 37°C in a humidified atmosphere of 95% air and 5% CO2 for 24 h. For Western blotting and mRNA extraction, purified cells were plated at 1 × 10⁶ cells per flask. The following day, the cells were subjected to different treatments. The purity of microglia was assessed by cytochemical detection of microglia using tomato (Lycopersicon esculentum) lectin (1:100; Sigma), a widely used marker for rat microglia, and 4′‐6‐Diamidino‐2‐phenylindole (DAPI) (20 µg/mL; Sigma), a nuclear marker of all cells. The microglial cultures with above 96% purity were used in this study.
Treatment of microglial cell culture
Microglial cell cultures were divided into three groups.
Group I
To study the effects of hypoxia on expression of TNF‐α and IL‐1β in microglial cells. For this, the cells were exposed in a hypoxia chamber (model MCO18 Multi‐gas incubator, Sanyo Company Pte. Ltd., Tokyo, Japan) for 1, 2, 4 and 6 h at 3% oxygen, 5% CO2 and 92% nitrogen at 37°C.
Group II
To study the effects of hypoxia on MAP kinase pathway. In this, the microglial cells were placed in a hypoxia chamber for 0.5, 1, 2 and 4 h at 3% oxygen, 5% CO2 and 92% nitrogen at 37°C.
Group III
To examine the effects of MAP kinase inhibitors on hypoxia‐induced TNF‐α and IL‐1β expression in microglial cells. Microglial cell cultures were treated with either SP600125 (1 µM; Scientific, Inc., Ocala, FL, USA) or SB203580 (1 µM; MERCK, Darmstadt, Germany), inhibitors of c‐Jun N‐terminal kinase (JNK) and p38, respectively, 30 minutes before hypoxia treatment. In all the experiments, microglial cells in matching controls were incubated at 37°C incubator with 95% air and 5% CO2.
Real‐time RT‐PCR
Total RNA was extracted from the corpus callosum or from cultured microglial cells using RNAesy mini kit® (Qiagen, Valencia, CA, USA) according to the manufacturer's protocol. The quantity of total RNA was measured with a Biophotometer® (Eppendorf, CA, USA). For the reverse transcription, 2 µg of total RNA was combined with 1 µm of Oligo (dT) 15 primer (Invitrogen, Carlsbad, CA, USA) mixture then heated at 70°C for 5 minutes and then placed on ice. Single‐strand cDNA was synthesized from the RNA by adding the following reagents (final concentrations): 1× first strand buffer, 1 U/µL RNAsin®, 25 µm of each Deoxyribonucleotide triphosphate (dNTP) and 200 U M‐MLV reverse transcriptase® (Promega, Madison, WI, USA). The reaction mixture (20 µL) was incubated at 42°C for 50 minutes and the mixture was heated to 95°C for 5 minutes in order to terminate the reaction. The samples were stored at −20°C for PCR analysis.
Quantitative RT‐PCR was carried out on a LightCycler 3® instrument using a FastStart DNA Master plus SYBR Green I kit® (Roche Diagnostics, GmbH, Roche Applied Science, Mannheim, Germany) according to the manufacturer's instructions. Briefly, a LightCycler 3 master mix was prepared using 2 µL Light Cycler‐FastStart DNA Master plus SYBR Green I with forward and reverse primers at a final concentration of 0.5 µM each. A 2‐µL sample of the cDNA was added into 18 µL of LightCycler master mix and transferred into LightCycler glass capillaries. The capillaries were capped, placed in a LightCycler carousel and centrifuged in a specific LightCycler centrifuge. Thermal cycling was carried out. The first segment of the amplification cycle consisted of a denaturation program at 95°C for 10 minutes. The second segment consisted of denaturation, primer annealing, elongation and a quantification program repeated for 35 cycles. The third segment consisted of a melting‐curve program. The final segment consisted of a cooling program at 40°C.
The expression of target genes was measured in triplicate and was normalized to β‐actin as an internal control. Forward and reverse primer sequences for each gene and their corresponding amplicon size are provided in Table 2. Gene expression was quantified using a modification of the 2−ΔΔct method as previously described (23).
Table 2.
Sequence of specific primers. Abbreviations: TNF‐α = tumor necrosis factor‐α; IL‐1β = interleukin‐1β; TNF‐R1 = TNF receptor 1; IL‐1R1 = IL‐1 receptor 1.
| Primer | Forward | Reverse | Amplicon size |
|---|---|---|---|
| TNF‐α | ccaacaaggaggagaagttcc | ctctgcttggtggtttgctac | 134 bp |
| IL‐1β | ggaacccgtgtcttcctaaag | ctctgcttggtggtttgctac | 123 bp |
| TNF‐R1 | ggcccacttctaatgtgtgaa | aggctacaagagggagacagc | 163 bp |
| IL‐1R1 | taaacctctgcctcttgacga | tgcttcccctggtatgtgtag | 146 bp |
| β‐actin | tcatgaagtgtgacgttgacatccgt | cctagaagcatttgcggtgcaggatg | 285 bp |
Western blotting
Proteins were extracted from the corpus callosum or from microglial cells using a protein extraction kit (Pierce Biotechnology Inc, IL, USA) according to the manufacturer's protocol. Protein concentrations were determined by the Bradford method (4) using bovine serum albumin (BSA) (Sigma‐Aldrich, St Louis, MO, USA) as a standard. Samples of supernatants containing 20 µg of protein were heated to 95°C for 5 minutes and were separated by sodium dodecyl sulfate–polyacrylamide gel electrophoresis in 12% gels in a Mini‐Protein 3 apparatus (Bio‐Rad Laboratories, Hercules, CA, USA). Protein bands were electroblotted onto 0.45‐µm polyvinylindene difluoride membranes (Bio‐Rad) at 1.5 mA/cm2 of membrane for 1 h in Towbin buffer, pH 8.3, to which 20% (v/v) methanol had been added. After transfer, the membranes were blocked with 5% (mass/vol) nonfat dried milk in Tris‐buffered saline containing 0.05% Tween 20 (TBST) [0.05% (v/v) Tween‐20 in 20 mm Tris‐HCl buffer, pH 7.6, containing 137 mm sodium chloride] for 1 h, then incubated with the primary antibodies according to the manufacturer's recommendations. The primary antibodies used were as follows: phospho‐JNK (1:500), JNK (1:1000), phospho‐p38 (1:500), p38 (1:1000), phospho‐ERK1/2 (1:500), ERK1/2 (1:1000) [all from Cell Signaling Technology, Beverly, MA, USA; Cat. No. 9250, 9210, 9100; all are rabbit polyclonal immunoglobulin G (IgG)], TNF‐α (rabbit polyclonal IgG 1:1000) (Chemicon International, Temecula, CA, USA; Cat. No.AB1837P), IL‐1β (rabbit polyclonal IgG 1:5000) (Chemicon International; Cat. No. AB1832P), TNF‐R1 (rabbit polyclonal IgG 1:500) (Santacruz Biotechnology, Santacruz, CA, USA; Cat. No.sc‐7895), IL‐1 receptor 1 (rabbit polyclonal IgG 1:500) (Santa Cruz Biotechnology; Cat. No.sc‐689) and β‐actin (mouse monoclonal IgG 1:5000) (Sigma; Cat. No. A2172). After three washes with Tris‐buffered saline with 0.1% Tween‐20, the membranes were incubated with the horshradish peroxidase (HRP)‐conjugated secondary antibodies (Cell Signaling Technology; Cat. No 7074) for 1 h. The immunoblots were developed using the enhanced chemiluminescence detection system (Pierce Biotechnology Inc., Rockford, IL, USA). Blots were stripped with stripping buffer (Pierce Biotechnology Inc.; Cat. No. 0021059) and hybridized with total kinases or β‐actin. The signal intensity of MAP kinase and TNF‐α, and IL‐1β levels relative to control were measured with Quantity One Software®, version 4.4.1 (BioRad Laboratories).
Double immunofluorescence
Double immunofluorescence staining in the corpus callosum from hypoxic rats along with their corresponding controls was carried out to confirm whether TNF‐α and IL‐1β immunoreactive cells were indeed AMC. Coronal frozen sections of the brain of 30 µm thickness at the level of the optic chiasma were cut and rinsed in PBS. Endogenous peroxidase activity was blocked with 0.3% hydrogen peroxide in methanol for 30 minutes followed by rinsing with PBS. Some sections were then incubated overnight in a humidified chamber with antibodies directed against TNF‐α (rabbit polyclonal IgG 1:200; Cat. No.AB1837P) and IL‐1β (rabbit polyclonal IgG 1:100; Cat. No.AB1832P). This and all incubations that followed were at room temperature. On the following day, the sections were washed and incubated with a secondary antibody: CY3‐conjugated goat anti‐rabbit IgG (1:100; Sigma, Cat. No. AP307 F) for 1 h. After this, the sections were washed and incubated with lectin (1:100) for 1 h. The other sections were incubated overnight with a cocktail mix of TNF‐R1 (rabbit polyclonal IgG 1:100; Cat. No.sc‐7895), IL‐1R1 (rabbit polyclonal IgG 1:100; Cat. No.sc‐689) and CC1 monoclonal antibody against adenomatus polyposis coli (CC1) (oncogene, mouse monoclonal IgG 1:20; Cat. No.OP80). CC1 antibody specifically stains the cell bodies of oligodendrocytes. Subsequent antibody detection was carried out with secondary antibody: fluorescein isothiocyanate‐conjugated goat anti‐mouse (1:100; Chemicon International; Cat. No. AP130F) for 1 h. The sections were then washed and incubated with CY3‐conjugated sheep anti‐rabbit IgG (1:100; Sigma; Cat. No.c2306) for 1 h. Following rinsing in PBS, they were mounted with a fluorescent mounting medium (DAKO Cytomation, Glostrup, Denmark). Cellular colocalization was observed in a confocal microscope (LSM FV1000; Olympus Company Pte. Ltd., Tokyo, Japan).
Quantitative analysis of the cell number of TNF‐α‐ and IL‐1β‐positive microglial cells and TNF‐R1‐ and IL‐1R1‐positive oligodendrocytes in the corpus callosum at the corresponding level of the different rats (n = 3) was carried out through counting labeled cells in eight randomly selected microscopic fields from sections obtained from three rats at ×40 and ×60 objective, respectively, by a blinded observer. The cells with a green lectin labeling fluorescent cell body overlapping with red were counted as TNF‐α‐, IL‐1β‐, TNF‐R1‐ and IL‐1R1‐positive cells, while those cell bodies emitting only green fluorescence were counted as TNF‐α‐, IL‐1β‐, TNF‐R1‐ and IL‐1R1‐negative cells. The percentages of cells with positive expression for the respective antibodies were calculated and averaged.
For cultured microglial cells, the cells were treated with 3% oxygen either for 45 minutes (for c‐Jun and phospho‐c‐Jun detection) or for 4 h (for TNF‐α or IL‐1β detection). After the hypoxic treatment, the cells were fixed in 4% paraformaldehyde for 30 minutes, blocked in 1% BSA for 30 minutes and incubated with primary antibodies overnight at 4°C. Immunofluorescence labeling was carried out using primary antibodies directed against TNF‐α (rabbit polyclonal IgG 1:200; Cat. No. AB1837P), IL‐1β (rabbit polyclonal IgG 1:200; Cat. No.AB1832P) and anti‐phospho‐c‐Jun (ser73, rabbit polyclonal IgG 1:100; Cell Signaling Technology; Cat. No 9164). The cells were then incubated with CY3‐conjugated goat anti‐rabbit secondary antibody (1:100; Cat. No. AP307 F) for 1 h. After this, the cells were washed and incubated with lectin (1:100) for 1 h. Finally, the cells were counterstained with DAPI and examined under a confocal microscope.
Quantitative analysis of the number of TNF‐α, IL‐1β and phospho‐c‐Jun nuclear‐positive cells was carried out through counting eight randomly selected microscopic fields at ×40 objective by a blinded observer. Each area contained about 40 cells in the control and in the microglial cultures treated with hypoxia. The cells whose cell body emitted green fluorescence and overlapped with red immunofluorescence were counted as TNF‐α and IL‐1β positive, while those with only green fluorescent cell bodies were counted as TNF‐α and IL‐1β negative. The cells with only blue nuclei were counted as phospho‐c‐Jun negative, while those with blue nuclei overlapped with red were counted as phospho‐c‐Jun positive. The percentages of cells with positive expression for the respective antibodies were calculated and averaged. Each experiment was done in triplicate.
Electron microscopy
The rats were perfused with a mixed aldehyde fixative composed of 2% paraformaldehyde and 3% glutaraldehyde in 0.1 M phosphate buffer, pH 7.2. After perfusion, the brain was removed and coronal slices (approximately 1 mm thick) were cut. Blocks of corpus callosum were trimmed from these slices. Vibratome sections (Model 3000TM, The Vibratome Company, St Louis, MO, USA) of 80–100 µm thickness were prepared from these blocks and rinsed overnight in 0.1 M phosphate buffer. They were then postfixed for 2 h in 1% osmium tetraoxide, dehydrated and embedded in Araldite mixture. Ultrathin sections were cut and viewed in a Philips CM 120 electron microscope (FEI Company, Hillsboro, Oregon, USA).
Detection of oligodendrocyte apoptosis by fluorescence terminal deoxynucleotidyl transferase (Tdt)‐mediated dUTP nick end labeling (TUNEL) assay
TUNEL assays were performed with an in situ cell‐death detection kit (Roche Diagnostics, GmbH, Roche Applied Science) according to the manufacturer's instructions. Briefly, frozen sections were incubated at room temperature with CC1 antibody (oncogene, mouse monoclonal IgG 1:20; Cat. No.OP80) overnight. Subsequent antibody detection was carried out with secondary antibody: CY3‐conjugated sheep anti‐mouse IgG (1:100, Sigma; Cat. No. C2181) for 1 h at 37°C in the dark. The sections were washed and mounted with a fluorescent mounting medium. Finally, the tissue sections were counterstained with DAPI and examined under a confocal microscope. The number of total and TUNEL‐positive oligodendrocytes in the corpus callosum was calculated by counting eight randomly selected microscopic fields in sections obtained from each rat (n = 3) at ×60 objective by a blinded observer. The percentage of TUNEL‐positive oligodendrocytes against the total number of oligodendrocytes was calculated and averaged.
Statistical analysis
The data were presented as means ±SD. Statistical significance was evaluated by the Student's t‐test. Results were considered as significant at P < 0.05.
RESULTS
Real‐time RT‐PCR analysis of TNF‐α, IL‐1β, TNF‐R1 and IL‐1R1 mRNA expression in the corpus callosum
TNF‐α mRNA expression was significantly increased in the corpus callosum at 3 and 24 h, and at 3 and 7 days after the hypoxic exposure in comparison with the corresponding controls (P < 0.05) (Figure 1A). Increase in IL‐1β mRNA expression paralleled that of TNF‐α mRNA after the hypoxic exposure at 3 and 24 h, and at 3 and 7 days as compared with the matching controls (P < 0.05) (Figure 1B). There was no significant difference between the mRNA expression of TNF‐α and IL‐1β at 14 days when compared with the corresponding control rats (Figure 1A,B). TNF‐R1 mRNA expression remained relatively unchanged at 3 and 24 h (Figure 1C), but was markedly increased at 3 days and was sustained until 14 days in the hypoxic rats when compared with the controls (P < 0.05) (Figure 1C). Increase in IL‐1R1 mRNA expression was first observed at 24 h, peaking at 3 days and maintained at a high level until 14 days after the hypoxic exposure in comparison with the controls (P < 0.05) (Figure 1D). There was no significant difference between IL‐1R1 mRNA expression at 3 h after the hypoxic exposure when compared with the corresponding control rats (Figure 1D).
Figure 1.
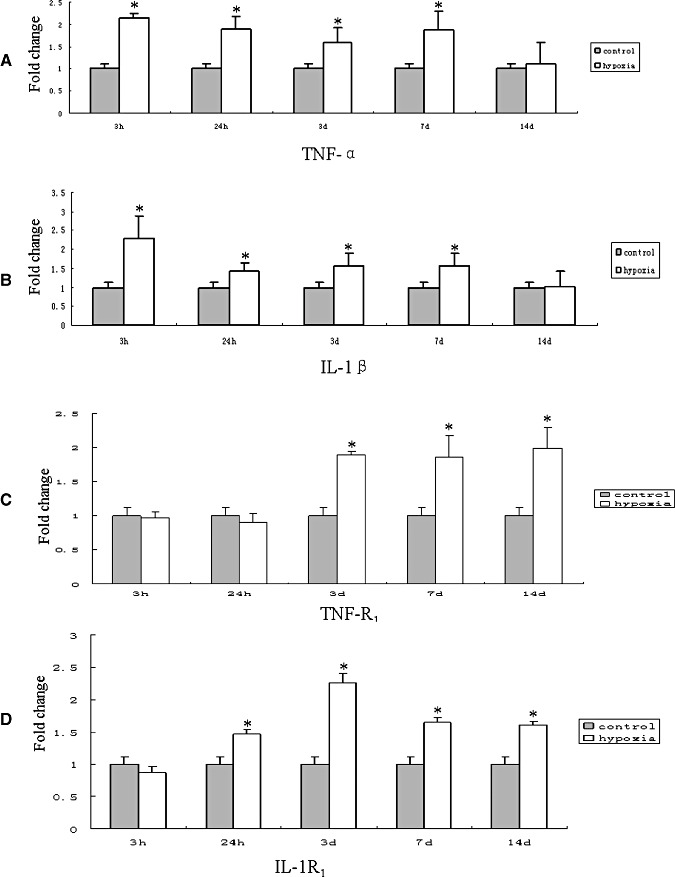
Real‐time RT‐PCR analysis of tumor necrosis factor‐α (TNF‐α), interleukin‐1β (IL‐1β), TNF receptor 1 (TNF‐R1) and IL‐1 receptor 1 (IL‐1R1) mRNA expression in the corpus callosum of postnatal rats at 3, 24 h, 3, 7 and 14 days after the hypoxic exposure and their corresponding controls. A–D. Graphical representations of the fold changes in TNF‐α, IL‐1β, TNF‐R1 and IL‐1R1, respectively, quantified by normalization to the β‐actin as an internal control. Each bar represents the mean ± SD. There is a significant difference in mRNA levels after the hypoxic exposure when compared with the corresponding controls. (*P < 0.05.)
Western blotting analysis of TNF‐α, IL‐1β, TNF‐R1 and IL‐1R1 protein expression in the corpus callosum
The immunoreactive bands of TNF‐α and IL‐1β protein levels that appeared at approximately 30 kDa and 17 kDa, respectively (Figure 2A), increased significantly (P < 0.05) in optical density at 3 and 24 h, and at 3, 7 and 14 days after hypoxic exposure as compared with the controls (Figure 2B,C). The immunoreactive band of TNF‐R1 protein levels appeared at approximately 55 kDa (Figure 2A). The optical density was increased significantly (P < 0.05) at 7 and 14 days after hypoxic exposure as compared with the controls (Figure 2D). However, there was no expression of TNF‐R1 protein at 3 and 24 h and at 3 days both in the hypoxic and control rats. The immunoreactive band of IL‐1R1 protein levels appeared at approximately 80 kDa (Figure 2A). It was augmented significantly (P < 0.05) at 24 h, and at 3, 7 and 14 days after hypoxic exposure when compared with the controls (Figure 2E). There was no significant difference between the protein expression of IL‐1R1 at 3 h after the hypoxic exposure when compared with the corresponding control rats.
Figure 2.
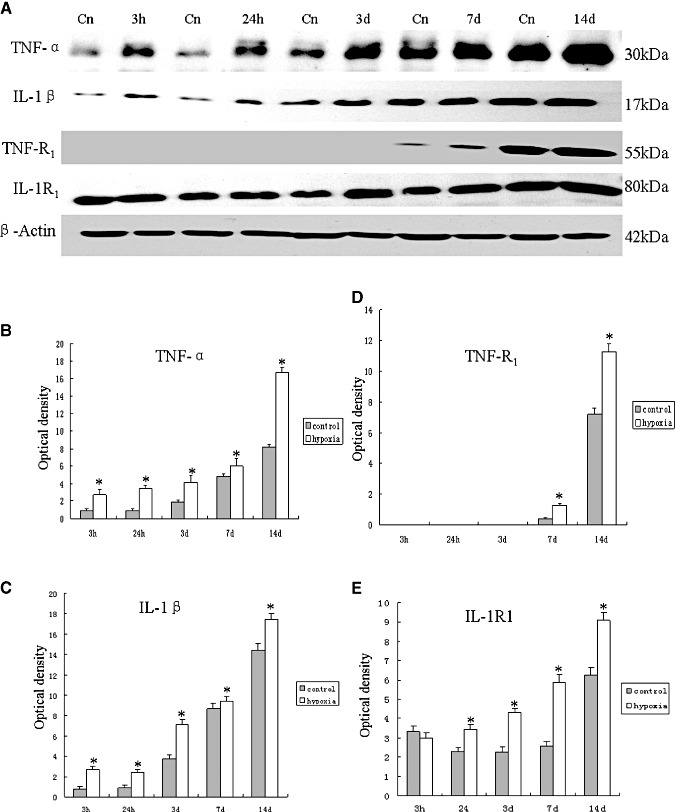
Western blotting of tumor necrosis factor‐α (TNF‐α), interleukin‐1β (IL‐1β), TNF receptor 1 (TNF‐R1) and IL‐1 receptor1 (IL‐1R1) protein expression in the corpus callosum tissue supernatants of rats at 3 and 24 h, and at 3, 7 and 14 days after the hypoxic exposure and their corresponding controls (Cn). A. TNF‐α (30 kDa), IL‐1β (17 kDa), TNF‐R1 (55 kDa) and IL‐1R1 (80 kDa) immunoreactive bands, respectively. B–E. Bar graphs showing significant changes in the optical density of TNF‐α, IL‐1β, TNF‐R1 and IL‐1R1, respectively, following hypoxic exposure when compared with their corresponding controls (mean ± SD). (*P < 0.05.)
Cellular localization of TNF‐α, IL‐1β, TNF‐R1 and IL‐1R1 protein expression in the corpus callosum by double labeling
In the corpus callosum of the control rats, TNF‐α as well as IL‐1β expression was specifically detected in sporadic cells, confirmed to be the AMC by double labeling with lectin staining (Figure 3A–L). At 24 h following hypoxic exposure, immunoreactivity for TNF‐α and IL‐1β was detected and enhanced in large numbers of AMC (Figure 3D–F,J–L) when compared with the controls (Figure 3A–C,G–I). The statistical analysis showed that the percentages of TNF‐α and IL‐1β immunoreactive‐positive microglia in the corpus callosum at 24 h following hypoxic exposure were significantly higher than that in the corresponding controls (Figure 3M). Expression of TNF‐R1 and IL‐1R1 was localized in the soma of occasional oligodendrocytes as confirmed by double immunofluorescence showing colocalization of CC1 (Figure 4A–L). At 7 days following hypoxic exposure, immunoreactivity for TNF‐R1 and IL‐1R1 was markedly enhanced in the soma of oligodendrocytes (Figure 4D–F,J–L) as compared with the control (Figure 4A–C,G–I). Furthermore, the incidence of immunoreactive cells was noticeably increased (Figure 4E,K). The percentages of TNF‐R1 and IL‐1R1 immunoreactive‐positive oligodendrocytes in the corpus callosum at 7 days following hypoxic exposure were significantly higher than that in the corresponding controls (Figure 4M).
Figure 3.
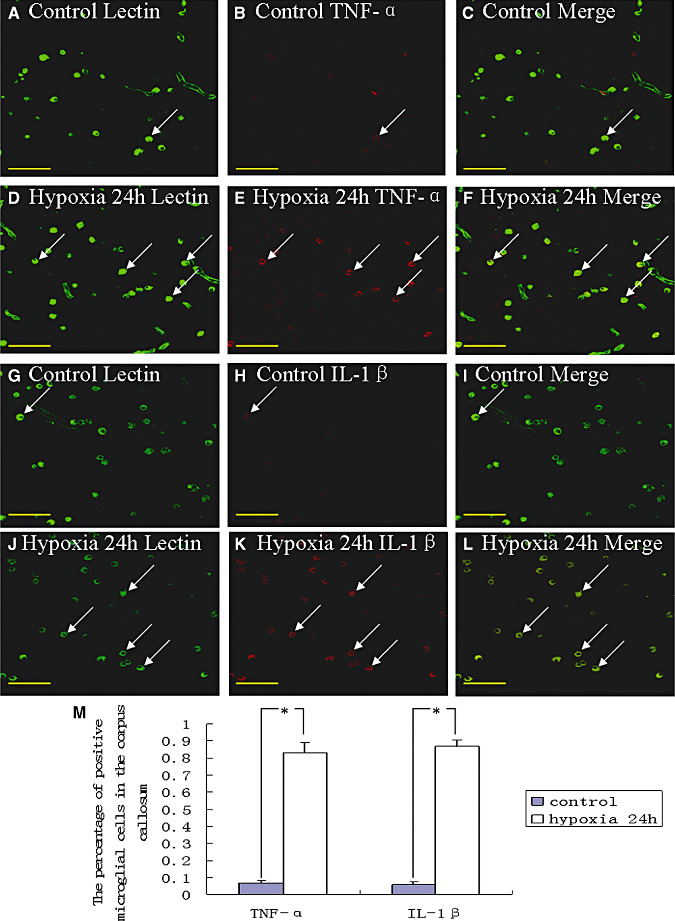
Confocal images showing the distribution of lectin‐labeled (A,D,G,J, green), tumor necrosis factor‐α (TNF‐α) (B,E, red) and interleukin‐1β (IL‐1β) (H,K, red) immunoreactive amoeboid microglial cells (AMC; arrows) in the corpus callosum at 24 h after the hypoxic exposure and the corresponding control rat. The colocalized expression of lectin and TNF‐α as well as lectin and IL‐1β AMC can be seen in C and F, and I and L, respectively. The expression of TNF‐α (E) and IL‐1β (K) in AMC (arrows) is markedly enhanced after the hypoxic exposure. The bar graph in M shows a significant increase in the percentage of TNF‐α and IL‐1β immunoreactive microglia after the hypoxic exposure when compared with their corresponding controls (*P < 0.01). Scale bars: A–L, 50 µm.
Figure 4.
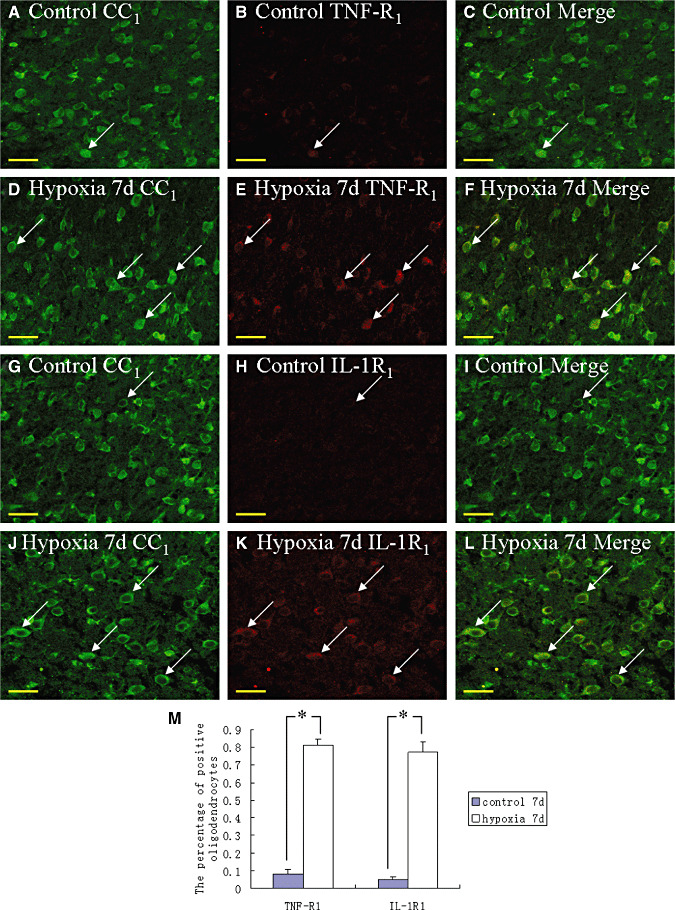
Confocal images showing the distribution of CC1 (A,D,G,J, green), tumor necrosis factor receptor 1 (TNF‐R1) (B,E, red) and interleukin‐1 receptor 1 (IL‐1R1) (H,K, red) in oligodendrocytes (arrows) and their processes in the corpus callosum at 7 days after the hypoxic exposure and the corresponding control. The colocalized expression of CC1 with TNF‐R1 and IL‐1R1 is depicted in C and F, I and L, respectively. Note the expression of TNF‐R1 and IL‐1R1 is upregulated after the hypoxic exposure. The percentage of TNF‐R1 and IL‐1R1 immunoreactive positive oligodendrocytes is significantly increased as shown in bar graph M (*P < 0.01). Scale bars: A–L, 20 µm.
Ultrastructural study
Apoptotic and necrotic cells were common features in the corpus callosum of hypoxic rats at 24 h and at 3 and 7 days (Figure 5A–D). These cells appeared to be phagocytosed by the AMC (Figure 5E,F). Both apoptotic and necrotic cells were rarely encountered in the corpus callosum of the control rats.
Figure 5.
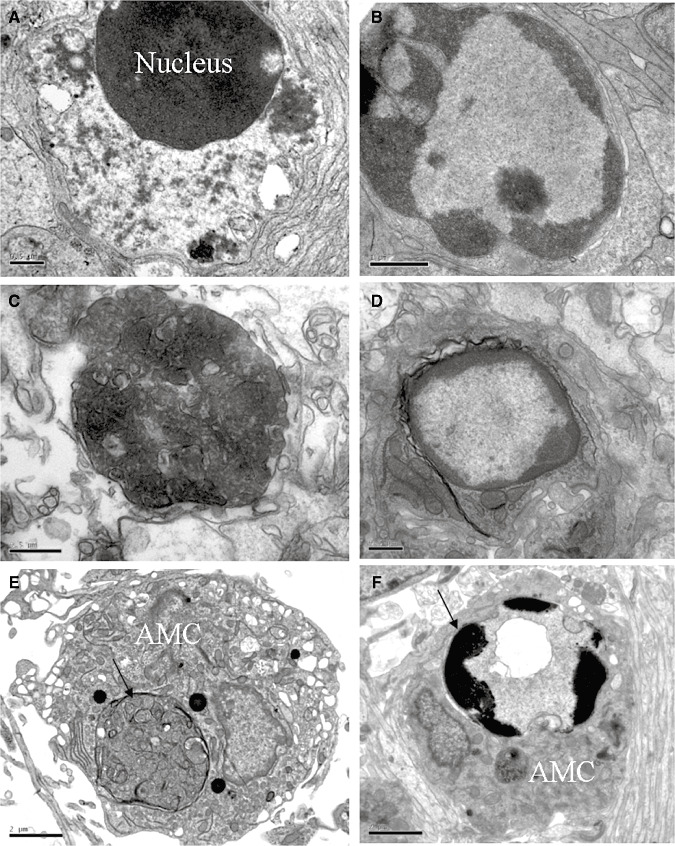
Electron micrographs showing necrotic cells in the corpus callosum at 24 h (A) and at 7 days (C) after the hypoxic exposure, Apoptotic cells (B,D) and amoeboid microglial cells (AMC) with internalized necrotic (E) and apoptotic (F) cells (arrows) in the corpus callosum at 7 days after the hypoxic exposure. Scale bars A, C, D = 0.5 μm; B = 1 μm; E, F = 2 μm.
Apoptosis of oligodendrocytes in the corpus callosum
Immunoreactive CC1‐labeled oligodendrocytes characterized by an oval cell body were identified in the corpus callosum in the control rats (Figure 6A–C). There was less evidence of cells marked by TUNEL labeling (Figure 6B). Following hypoxia exposure, however, CC1 immunoreactive cells showing TUNEL‐labeled nuclei were increased significantly (Figure 6D–F). The percentage of TUNEL‐positive oligodendrocytes at 7 days following hypoxic exposure was significantly higher than that in the corresponding controls (Figure 6G). Another salient feature in the hypoxic rats was that the number of CC1‐positive immunoreactive oligodendrocytes/mm2 was decreased significantly ((Figure 6D–F,H).
Figure 6.
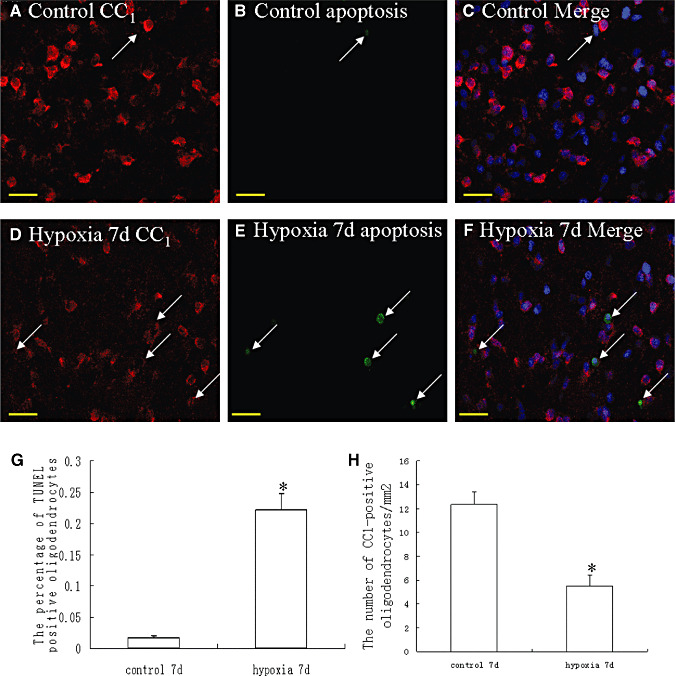
Confocal images showing CC1‐immunolabeled oligodendrocytes (arrows) (A,D, red) and apoptotic cells (B,E; green) (arrows) as detected by terminal deoxynucleotidyl transferase (Tdt)‐mediated dUTP nick end labeling (TUNEL) in the corpus callosum of a control and a hypoxic rat at 7 days after the hypoxic exposure. The colocalized expression of CC1 and TUNEL labeling can be seen in C and F. Bar graphs in G and H show the significant increase in percentage of apoptotic nuclei (G) and decrease in the number of CC1‐positive oligodendrocytes/mm2 (H) in the corpus callosum after the hypoxic exposure (*P < 0.01). Scale bars: A–F, 20 µm.
mRNA and protein expression of TNF‐α and IL‐1β in activated microglia under hypoxic conditions
An upregulation of TNF‐α mRNA expression was observed at different time points after hypoxia, peaking at 2 h (P < 0.05) when compared with the matching controls (Figure 7A). The IL‐1β mRNA expression was likewise increased after the hypoxic exposure, peaking at 1 h as compared with the controls (P < 0.05) (Figure 7B). Upregulation of TNF‐α protein peaking at 4 h (P < 0.05) after the hypoxic exposure was observed when compared with the controls (Figure 7C,D). The IL‐1β protein quantity also increased significantly after the hypoxic exposure, peaking at 4 h as compared with the controls (P < 0.05) (Figure 7C,E). Double immunofluorescence labeling showed that the lectin labeling in microglial cells was completely colocalized with TNF‐α and IL‐1β expression (Figure 8A–L). At 4 h after hypoxia, the expression of TNF‐α and IL‐1β in microglial cells was increased significantly (Figure 8D–F,J–L) in comparision with the control cells (Figure 8A–C,G–I). The percentages of TNF‐α and IL‐1β immunoreactive microglia at 4 h after hypoxic exposure were significantly higher than that in the controls (Figure 8M).
Figure 7.
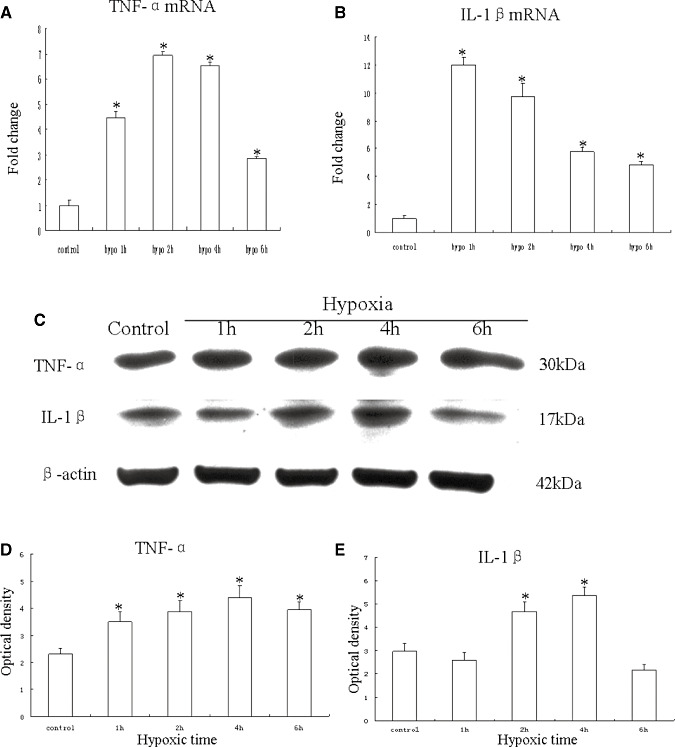
mRNA and protein expression of tumor necrosis factor‐α (TNF‐α) and interleukin‐1β (IL‐1β) in cultured control microglia and at 1, 2, 4 and 6 h after hypoxic exposure. A,B. Graphical representations of the fold changes in TNF‐α mRNA and IL‐1β mRNA, respectively, quantified by normalization to the β‐actin as an internal control. C. TNF‐α (30 kDa) and IL‐1β (17 kDa) immunoreactive protein bands. D,E. Bar graphs showing changes in the optical density of TNF‐α and IL‐1β, respectively, following hypoxic exposure. Significant differences in mRNA and protein levels in microglial cells after the hypoxic exposure are evident when compared with controls. (*P < 0.05.)
Figure 8.
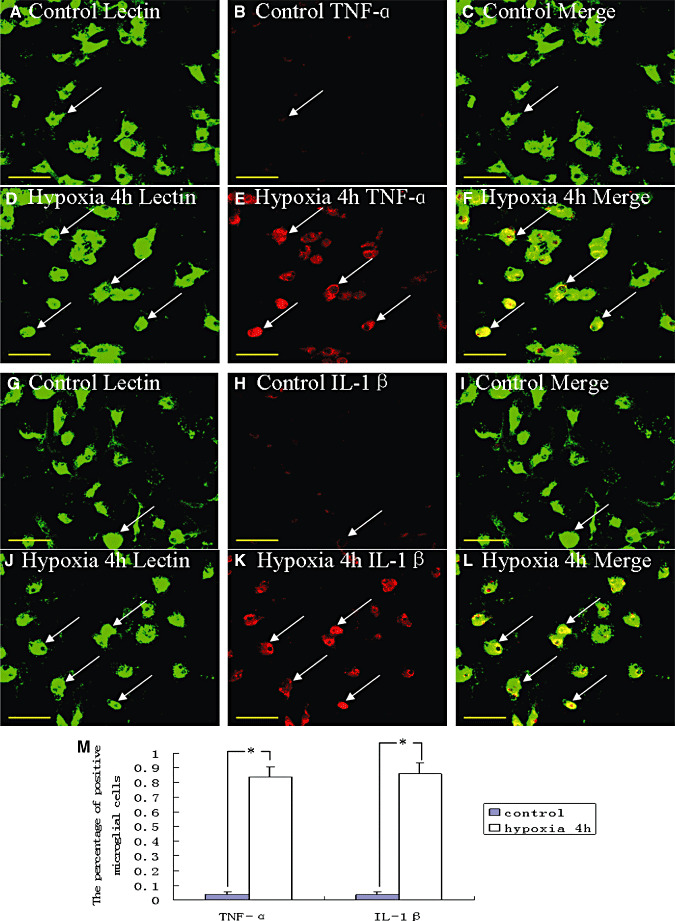
Confocal images of cultured control microglia showing the expression of lectin (A,G, green), tumor necrosis factor‐α (TNF‐α) (B, red), interleukin‐1β (IL‐1β) (H, red) and colocalized expression of lectin and TNF‐α (C) as well as lectin and IL‐1β (I). D–F show the expression of lectin (D, green), TNF‐α (E, red) and colocalized expression of lectin and TNF‐α (F) after treatment with 3% oxygen for 4 h. Note the elevated expression of TNF‐α following treatment with 3% oxygen for 4 h (E) as compared with the control cells (B). J–L show the expression of lectin (J, green), IL‐1β (K, red) and colocalized expression of lectin and IL‐1β (L) after treatment with 3% oxygen for 4 h. The expression of IL‐1β is greatly increased in the microglial cells after hypoxic exposure for 4 h. The bar graph (M) shows a significant increase in the percentage of TNF‐α and IL‐1β immunoreactive microglia after the hypoxic exposure when compared with the control cells (*P < 0.01). Scale bars: A–L, 50 µm.
Hypoxia elicited MAP kinase signaling pathway in activated microglia
MAP kinase signaling transduction pathway plays a significant role in inducing the expression of inflammatory genes in many immune cell types. We therefore examined whether hypoxia induced the activation of MAP kinases in primary microglial cultures. Western blot analysis showed that the hypoxia treatment induced rapid and time‐dependent phosphorylation of JNK (Figure 9A,H) and p38 (Figure 9B,I) in microglial cells. The phosphorylated JNK and p38 levels increased at 30 minutes and gradually declined to basal levels at 4 h. In addition, hypoxia treatment induced phosphorylation of ERK1/2 in microglial cells (Figure 9C,J). The phosphorylated ERK level was increased to peak at 30 minutes of incubation. Unlike JNK and p38, however, ERK1/2 level was only moderately decreased at 1, 2 and 4 h after hypoxia.
Figure 9.
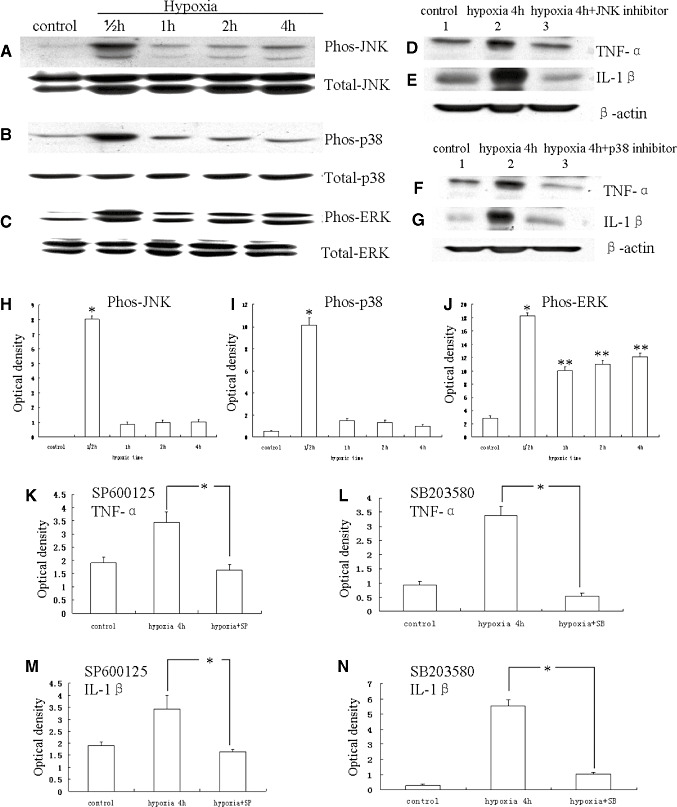
Western blot analysis showing hypoxia‐induced tumor necrosis factor‐α (TNF‐α) and interleukin‐1β (IL‐1β) production via activation of mitogen‐activated protein kinase pathway in microglia. A–C. c‐Jun N‐terminal kinase (JNK), p38 and ERK phosphorylation, and total JNK, p38 and ERK immunoreactive bands. D–G. Immunoreactive bands that indicate that SP600125 (a JNK inhibitor) and SB203580 (a p38 inhibitor) suppress the expression TNF‐α and IL‐1β, respectively, in the microglial cells after hypoxic exposure for 4 h. H–J. Bar graphs showing significant changes in the optical density of JNK, p38 and ERK phosphorylation, respectively, following hypoxic exposure. K–N. Bar graphs showing significant suppression in expression of TNF‐α and IL‐1β by SP600125 and SB203580, respectively. (*P < 0.05.)
Because JNK mediates N‐terminal phosphorylation of c‐Jun, the effect of hypoxia on the c‐Jun phosphorylation was examined. Phospho‐c‐Jun immunoreactivity was detected in a few microglial cells in the control. It was markedly induced in a majority of microglial cells in cultures treated with 3% oxygen (Figure 10D–F) when compared with the controls (Figure 10A–C). The percentage of phospho‐c‐Jun‐positive microglial cells treated with 3% oxygen was significantly higher than the controls (Figure 10G) (P < 0.01). The majority of the microglial cells exhibited total c‐Jun immunoreactivity, and the treatment of hypoxia did not affect the total c‐Jun immunoreactivity in microglial cells (data not shown).
Figure 10.
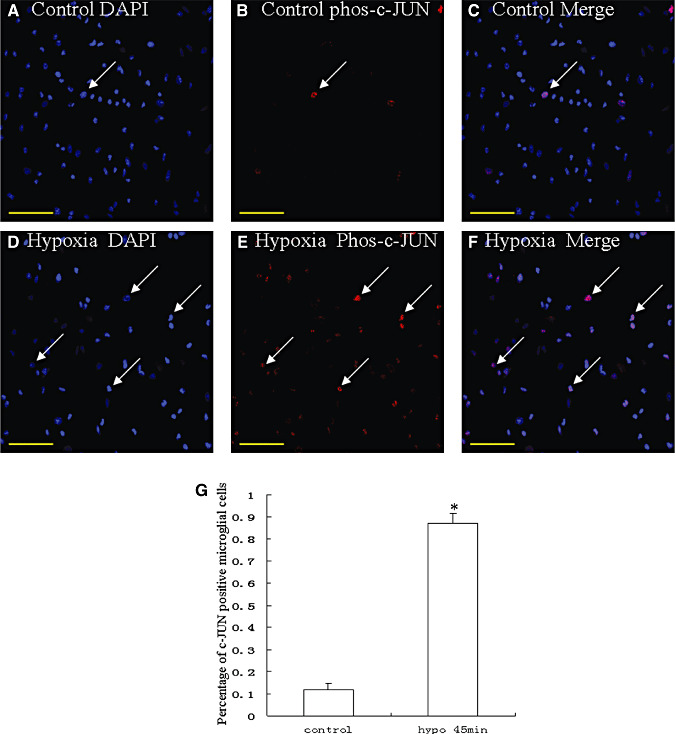
Confocal images of cultured microglia showing the expression of the N‐terminal phosphorylated c‐Jun (phos‐c‐Jun) (B, red), counter‐staining with DAPI (A, blue) and colocalized expression of DAPI and phos‐c‐Jun (C). D–F show the expression of phos‐c‐Jun (E, red), counter‐staining with DAPI (D, blue), and colocalized expression of DAPI and phos‐c‐Jun (F) after treatment of cells with 3% oxygen for 45 minutes. The expression of phos‐c‐Jun in the nucleus is greatly increased after hypoxia for 45 minutes. G represents the percentage of phospho‐c‐Jun‐positive control microglial cells and cells treated with 3% oxygen (P < 0.01). Scale bars: A–F, 50 µm.
Hypoxia induced the TNF‐α and IL‐β production via activation of MAP kinase pathway in activated microglia
It was hypothesized that hypoxia induced TNF‐α and IL‐1β production in activated microglial cells by altering the MAP kinase pathways. In order to address this, TNF‐α and IL‐1β productions were measured by Western blotting in hypoxia‐induced microglial cells exposed to pharmacological agents SP600125 and SB203580, which are selective inhibitors of JNK and p38, respectively. Incubation of microglial cells with SP600125 or SB203580 30 minutes prior to hypoxia treatment for 4 h decreased the hypoxia‐induced TNF‐α and IL‐1β expression (Figure 9D–G,K–N).
DISCUSSION
It has been well documented that hypoxia is an important stimulus that initiates an inflammatory response with enormous production of inflammatory cytokines such as TNF‐α and IL‐1β5, 14, 30. The present study has shown an upregulation of the mRNA expression of TNF‐α and IL‐1β in the PWM of neonatal rats following a hypoxic exposure up to 7 days, suggesting that a strong and persistent inflammatory response occurs in the PWM of neonatal rats after hypoxic insult. Double immunofluorescence staining has shown that expression of TNF‐α and IL‐1β was detected in AMC as verified by their colocalization with lectin, a cellular marker for microglial cells. Western blotting results have further demonstrated that protein expression of TNF‐α and IL‐1β in the corpus callosum was increased throughout the period of study, i.e. up to 14 days in hypoxic rats. It has been reported that under inflammatory conditions, microglia may be responsible for the early phase of inflammatory response, and astrocytes may contribute to inflammatory response at later stages (33). AMC expressed TNF‐α and IL‐1β up to 7 days in hypoxic rats. This suggests that in the evolution of inflammation in the developing brain, the AMC would be the main cellular source for proinflammatory cytokine production at least up to 7 days after hypoxic insult, while astrocytes would perhaps play a significant role at a later stage.
TNF‐α acts through its receptors TNF‐R1 or TNF‐R2. TNF‐R1 has an intracellular death domain and its activation elicits caspase signaling pathways that lead to cell apoptosis (26), whereas TNF‐R2 activates the Akt signaling pathway to promote cell growth and proliferation (12). In the central nervous system, under physiological conditions, TNF‐α is expressed to induce growth and proliferation of some cells via binding to TNF‐R2 (1). Under pathological conditions, excessive expression of TNF‐α may induce apoptosis of some cells via binding to TNF‐R1. Oligodendrocytes and astrocytes primarily express TNF‐R1 3, 11. Our results have shown that the expression of TNF‐R1 in the relatively mature oligodendrocytes increased significantly at 7 days after hypoxic exposure. This was coupled with increased cell death by apoptosis and necrosis in the corpus callosum. The apoptotic cells were confirmed to be the oligodendrocytes by double immunofluorescence labeling. We speculate that TNF‐α produced by AMC in hypoxic conditions had induced the oligodendrocyte apoptosis via TNF‐R1 on the oligodendrocytes in hypoxic rats. Although IL‐1β can bind equally to type I and type II IL‐1R, signal transduction across the plasma membrane has been reported to be accomplished via the type I receptor (7). At present, there is no evidence that a signal can be transmitted through the type II receptor (13). Unlike TNF‐α, IL‐1β was reported as being nontoxic to oligodendrocyte lineage cells as oligodendrocyte apoptosis was not induced through this receptor (37). However, some studies have demonstrated that IL‐1β can block oligodendrocyte proliferation at the late progenitor/ pro‐oligodendrocyte stage (37). Our results demonstrated that the expression of IL‐1R1 on the CC1 immunoreactive‐positive oligodendrocytes at 7 days after hypoxic exposure was increased significantly. It is therefore postulated that IL‐1β produced by AMC in hypoxic conditions may delay the white matter development and recovery in hypoxic conditions via inhibition of oligodendrocyte progenitor proliferation.
Our in vitro study has shown that the mRNA and protein expression of TNF‐α and IL‐1β in cultured microglia was upregulated significantly after hypoxia exposure for 4 h. This indicates that hypoxia could activate isolated microglia to produce inflammatory mediators. We suggest that hypoxia may initiate inflammation by direct activation of microglia that would damage oligodendrocytes directly or indirectly. Hence, microglial cells may play a pivotal role in the pathophysiological mechanism of PWMD in hypoxic conditions in the neonatal brain.
Recently, the MAP kinase pathway has been identified as being responsible for inducing inflammatory gene expression 2, 8, 38. Members of MAP kinase family include three subgroups: JNK/stress‐activated protein kinase, p38 MAP kinase and extracellular signal‐regulated kinase (ERK) (16). The JNK and p38 are cell stress‐ and inflammation‐activated pathways that are associated with the regulation of cell apoptosis and inflammatory cytokine production 20, 21. The ERK signaling pathway is involved in cell growth, proliferation and survival (6). The JNK, p38 MAP kinase and ERK are activated by phosphorylation of both tyrosine and threonine residues, which are phosphorylated by specific upstream MAP kinases (29). Usually, these phosphorylated MAP kinases result in the phosphorylation and subsequent activation of transcription factors, producing corresponding gene transcription (16). The present results have demonstrated that the phosphorylated JNK and p38 levels were markedly increased at 30 minutes and gradually declined to basal levels at 4 h in hypoxic microglial cells. The phosphorylated ERK level was increased to peak at 30 minutes of hypoxic treatment. However, unlike JNK and p38, ERK1/2 level was found to be decreased only moderately after hypoxic exposure at 1, 2 and 4 h. The c‐Jun phosphorylation was markedly induced in a majority of microglial cell nuclei in cultures treated with 3% oxygen for 45 minutes as compared with control microglial cells. Incubation of microglial cells with SP600125 or SB203580, which are selective inhibitors of JNK and p38, respectively, 30 minutes prior to hypoxia treatment for 4 h decreased the hypoxia‐induced TNF‐α and IL‐1β release. Based on this, we suggest that one of the mechanisms through which hypoxia damages the PWM may be the activation of microglial cells and production of inflammatory cytokines such as TNF‐α and IL‐1β via MAP kinase signaling. Moreover, our finding that MAP kinase is involved in the hypoxic PWMD has provided a potential site of pharmacological intervention for the treatment of such damage.
CONCLUSIONS
This study has shown that under hypoxic conditions, the AMC in the PWM in the neonatal brain produces inflammatory cytokines such as TNF‐α and IL‐1β via the MAP kinase signaling pathway. The possible interaction between AMC and oligodendrocytes via the abovementioned proinflammatory cytokines and their respective receptors would lead to damage of the latter cell type. This was shown by the common occurrence of apoptotic oligodendrocytes and reduction in the number of oligodendrocytes. It is suggested that the decrease in the number of oligodendrocytes would result in myelination deficits, a hallmark in PWMD. A fuller understanding of the above processes will undoubtedly help to develop potential therapeutic strategies for mitigation of the hypoxia‐induced damage in neonatal brain.
ACKNOWLEDGMENTS
This study was supported by a research grant (R‐181‐000‐098‐112) from the National University of Singapore. The technical assistance of Ms Y.G. Chan is gratefully acknowledged.
REFERENCES
- 1. Arnett HA, Mason J, Marino M, Suzuki K, Matsushima GK, Ting JP (2001) TNF alpha promotes proliferation of oligodendrocyte progenitors and remyelination. Nat Neurosci 4:1116–1122. [DOI] [PubMed] [Google Scholar]
- 2. Bhat NR, Zhang P, Lee JC, Hogan EL (1998) Extracellular signal‐regulated kinase and p38 subgroups of mitogen‐activated protein kinases regulate inducible nitric oxide synthase and tumor necrosis factor‐alpha gene expression in endotoxin‐stimulated primary glial cultures. J Neurosci 18:1633–1641. [DOI] [PMC free article] [PubMed] [Google Scholar]
- 3. Bohatschek M, Kloss CU, Hristova M, Pfeffer K, Raivich G (2004) Microglial major histocompatibility complex glycoprotein‐1 in the axotomized facial motor nucleus: regulation and role of tumor necrosis factor receptors 1 and 2. J Comp Neurol 470:382–399. [DOI] [PubMed] [Google Scholar]
- 4. Bradford MM (1976) A rapid and sensitive method for the quantitation of microgram quantities of protein utilizing the principle of protein‐dye binding. Anal Biochem 72:248–254. [DOI] [PubMed] [Google Scholar]
- 5. Carloni S, Mazzoni E, Cimino M, De Simoni MG, Perego C, Scopa C, Balduini W (2006) Simvastatin reduces caspase‐3 activation and inflammatory markers induced by hypoxia‐ischemia in the newborn rat. Neurobiol Dis 21:119–126. [DOI] [PubMed] [Google Scholar]
- 6. Chang L, Karin M (2001) Mammalian MAP kinase signalling cascades. Nature 410:37–40. [DOI] [PubMed] [Google Scholar]
- 7. Curtis BM, Gallis B, Overell RW, McMahan CJ, DeRoos P, Ireland R, et al (1989) T‐cell interleukin 1 receptor cDNA expressed in Chinese hamster ovary cells regulates functional responses to interleukin 1. Proc Natl Acad Sci USA 86:3045–3049. [DOI] [PMC free article] [PubMed] [Google Scholar]
- 8. Da SJ, Pierrat B, Mary JL, Lesslauer W (1997) Blockade of p38 mitogen‐activated protein kinase pathway inhibits inducible nitric‐oxide synthase expression in mouse astrocytes. J Biol Chem 272:28373–28380. [DOI] [PubMed] [Google Scholar]
- 9. Dammann O, Hagberg H, Leviton A (2001) Is periventricular leukomalacia an axonopathy as well as an oligopathy? Pediatr Res 49:453–457. [DOI] [PubMed] [Google Scholar]
- 10. Deguchi K, Mizuguchi M, Takashima S (1996) Immunohistochemical expression of tumor necrosis factor alpha in neonatal leukomalacia. Pediatr Neurol 14:13–16. [DOI] [PubMed] [Google Scholar]
- 11. Dopp JM, Kenzie‐Graham A, Otero GC, Merrill JE (1997) Differential expression, cytokine modulation, and specific functions of type‐1 and type‐2 tumor necrosis factor receptors in rat glia. J Neuroimmunol 75:104–112. [DOI] [PubMed] [Google Scholar]
- 12. Fontaine V, Mohand‐Said S, Hanoteau N, Fuchs C, Pfizenmaier K, Eisel U (2002) Neurodegenerative and neuroprotective effects of tumor necrosis factor (TNF) in retinal ischemia: opposite roles of TNF receptor 1 and TNF receptor 2. J Neurosci 22: 1–7. [DOI] [PMC free article] [PubMed] [Google Scholar]
- 13. Grehan S, Uhlar CM, Sim RB, Herbert J, Whitehead AS (1997) Expression of a biologically active recombinant mouse IL‐1 receptor antagonist and its use in vivo to modulate aspects of the acute phase response. J Immunol 159:369–378. [PubMed] [Google Scholar]
- 14. Guo G, Bhat NR (2006) Hypoxia/reoxygenation differentially modulates NF‐kappaB activation and iNOS expression in astrocytes and microglia. Antioxid Redox Signal 8:911–918. [DOI] [PubMed] [Google Scholar]
- 15. Haynes RL, Baud O, Li J, Kinney HC, Volpe JJ, Folkerth DR (2005) Oxidative and nitrative injury in periventricular leukomalacia: a review. Brain Pathol 15:225–233. [DOI] [PMC free article] [PubMed] [Google Scholar]
- 16. Hommes DW, Peppelenbosch MP, Van Deventer SJ (2003) Mitogen activated protein (MAP) kinase signal transduction pathways and novel anti‐inflammatory targets. Gut 52:144–151. [DOI] [PMC free article] [PubMed] [Google Scholar]
- 17. Jensen A, Garnier Y, Middelanis J, Berger R (2003) Perinatal brain damage–from pathophysiology to prevention. Eur J Obstet Gynecol Reprod Biol 110(Suppl. 1):S70–S79. [DOI] [PubMed] [Google Scholar]
- 18. Johnston MV (1997) Hypoxic and ischemic disorders of infants and children. Lecture for 38th meeting of Japanese Society of Child Neurology, Tokyo, Japan, July 1996. Brain Dev 19:235–239. [DOI] [PubMed] [Google Scholar]
- 19. Kadhim H, Tabarki B, Verellen G, De PC, Rona AM, Sebire G (2001) Inflammatory cytokines in the pathogenesis of periventricular leukomalacia. Neurology 56:1278–1284. [DOI] [PubMed] [Google Scholar]
- 20. Kyriakis JM, Banerjee P, Nikolakaki E, Dai T, Rubie EA, Ahmad MF et al (1994) The stress‐activated protein kinase subfamily of c‐Jun kinases. Nature 369:156–160. [DOI] [PubMed] [Google Scholar]
- 21. Lee JC, Laydon JT, McDonnell PC, Gallagher TF, Kumar S, Green D et al (1994) A protein kinase involved in the regulation of inflammatory cytokine biosynthesis. Nature 372:739–746. [DOI] [PubMed] [Google Scholar]
- 22. Ling EA, Wong WC (1993) The origin and nature of ramified and amoeboid microglia: a historical review and current concepts. Glia 7:9–18. [DOI] [PubMed] [Google Scholar]
- 23. Livak KJ, Schmittgen TD (2001) Analysis of relative gene expression data using real‐time quantitative PCR and the 2(‐Delta Delta C(T)) method. Methods 25:402–408. [DOI] [PubMed] [Google Scholar]
- 24. Manzar S (2000) Maternal sickle cell trait and fetal hypoxia. Am J Perinatol 17:367–370. [DOI] [PubMed] [Google Scholar]
- 25. Mu D, Jiang X, Sheldon RA, Fox CK, Hamrick SE, Vexler ZS, Ferriero DM (2003) Regulation of hypoxia‐inducible factor 1alpha and induction of vascular endothelial growth factor in a rat neonatal stroke model. Neurobiol Dis 14:524–534. [DOI] [PubMed] [Google Scholar]
- 26. Nakazawa T, Nakazawa C, Matsubara A, Noda K, Hisatomi T, She H et al (2006) Tumor necrosis factor‐alpha mediates oligodendrocyte death and delayed retinal ganglion cell loss in a mouse model of glaucoma. J Neurosci 26:12633–12641. [DOI] [PMC free article] [PubMed] [Google Scholar]
- 27. Ness JK, Romanko MJ, Rothstein RP, Wood TL, Levison SW (2001) Perinatal hypoxia‐ischemia induces apoptotic and excitotoxic death of periventricular white matter oligodendrocyte progenitors. Dev Neurosci 23:203–208. [DOI] [PubMed] [Google Scholar]
- 28. Nosarti C, Rushe TM, Woodruff PW, Stewart AL, Rifkin L, Murray RM (2004) Corpus callosum size and very preterm birth: relationship to neuropsychological outcome. Brain 127:2080–2089. [DOI] [PubMed] [Google Scholar]
- 29. Park SY, Lee H, Hur J, Kim SY, Kim H, Park JH et al (2002) Hypoxia induces nitric oxide production in mouse microglia via p38 mitogen‐activated protein kinase pathway. Brain Res Mol Brain Res 107:9–16. [DOI] [PubMed] [Google Scholar]
- 30. Saed GM, Munkarah AR, Bu‐Soud HM, Diamond MP (2005) Hypoxia upregulates cyclooxygenase‐2 and prostaglandin E(2) levels in human peritoneal fibroblasts. Fertil Steril 83(Suppl. 1):1216–1219. [DOI] [PubMed] [Google Scholar]
- 31. Saliba E, Marret S (2001) Cerebral white matter damage in the preterm infant: pathophysiology and risk factors. Semin Neonatol 6:121–133. [DOI] [PubMed] [Google Scholar]
- 32. Saura J, Tusell JM, Serratosa J (2003) High‐yield isolation of murine microglia by mild trypsinization. Glia 44:183–189. [DOI] [PubMed] [Google Scholar]
- 33. Sawada M, Suzumura A, Marunouchi T (1995) Cytokine network in the central nervous system and its roles in growth and differentiation of glial and neuronal cells. Int J Dev Neurosci 13:253–264. [DOI] [PMC free article] [PubMed] [Google Scholar]
- 34. Sheldon RA, Chuai J, Ferriero DM (1996) A rat model for hypoxic‐ischemic brain damage in very premature infants. Biol Neonate 69:327–341. [DOI] [PubMed] [Google Scholar]
- 35. Sugai K, Ito M, Tateishi I, Funabiki T, Nishikawa M (2006) Neonatal periventricular leukomalacia due to severe, poorly controlled asthma in the mother. Allergol Int 55:207–212. [DOI] [PubMed] [Google Scholar]
- 36. Vannucci RC, Vannucci SJ (2005) Perinatal hypoxic‐ischemic brain damage: evolution of an animal model. Dev Neurosci 27:81–86. [DOI] [PubMed] [Google Scholar]
- 37. Vela JM, Molina‐Holgado E, Revalo‐Martin A, Almazan G, Guaza C (2002) Interleukin‐1 regulates proliferation and differentiation of oligodendrocyte progenitor cells. Mol Cell Neurosci 20:489–502. [DOI] [PubMed] [Google Scholar]
- 38. Won JS, Lee JK, Suh HW (2001) Forskolin inhibits expression of inducible nitric oxide synthase mRNA via inhibiting the mitogen activated protein kinase in C6 cells. Brain Res Mol Brain Res 89:1–10. [DOI] [PubMed] [Google Scholar]