

Abstract
We previously obtained evidence for reduced cell proliferation in the dentate gyrus (DG) of fetuses with Down syndrome (DS), suggesting that the hippocampal hypoplasia seen in adulthood may be caused by defective early neuron production. The goal of this study was to establish whether DS fetuses (17–21 weeks of gestation) exhibit reduction in total cell number in the DG, hippocampus and parahippocampal gyrus (PHG). Volumes of the cellular layers and cell number were estimated with Cavalieri's principle and the optical fractionator method, respectively. We found that in DS fetuses all investigated structures had a reduced volume and cell number. Analysis of cell phenotype showed that DS fetuses had a higher percentage of cells with astrocytic phenotype but a smaller percentage of cells with neuronal phenotype. Immunohistochemistry for Ki‐67, a marker of cycling cells, showed that DS fetuses had less proliferating cells in the germinal zones of the hippocampus and PHG. We additionally found that in the hippocampal region of DS fetuses there was a higher incidence of apoptotic cell death. Results show reduced neuron number in the DS hippocampal region and suggest that this defect is caused by disruption of neurogenesis and apoptosis, two fundamental processes underlying brain building.
Keywords: dentate gyrus, hippocampus, mental retardation, neurogenesis, trisomy 21
INTRODUCTION
Down syndrome (DS, trisomy 21) is the leading genetic cause of mental retardation and most common autosomal aneuploidy compatible with postnatal survival, occurring with an incidence of one in 700–1000 live births (20, 34). DS involves several dysmorphic features, which constitute its distinctive physical phenotype, patent alterations of motor ability, endocardial, hematological and immunological alterations, behavioral and neurological defects (34). Although most of the clinical features of DS may be inconsistent in their occurrence, mental retardation remains the invariable hallmark of this disorder.
The causes of mental retardation in DS remain elusive, although certain neuroanatomical changes found in DS individuals may be involved in mental retardation. DS brains are characteristically small, with significant reduction in the size of the cerebral hemispheres, frontal lobe, temporal cortex, hippocampus and cerebellum (2, 3, 12, 23, 33, 38, 41, 45, 48, 53, 54). Other neurological alterations include defective cortical layering and reduced neuron number (15, 37, 54), shortened dendrites, a decreased number of spines, altered spine morphology, abnormal synaptic structure and delayed myelination (5, 32, 42, 46, 47, 51, 54, 55).
The widespread hypoplasia of the DS brain is considered to be the main cause of mental retardation. Although several determinants, including neurodegenerative processes, may be involved in the hypoplasia of the adult DS brain, the fact that brain volume reduction and cortical hypocellularity are already present in children and even fetuses with DS (15, 33, 41, 45, 53) strongly suggests that defective neuronogenesis during critical phases of brain building may be a major determinant of the microencephaly that characterizes the trisomic condition. The obvious obstacles inherent in using human material make it difficult to directly analyze this issue in the DS fetal brain. To overcome these obstacles, mice models have been created that replicate, to a different extent, the DS trisomic condition (11). Evidence in these mice models clearly shows neurogenesis impairment in the developing neocortex, dentate gyrus (DG) and cerebellum (9, 19, 27, 35, 39), which supports the hypothesis that the hypotrophy of the adult DS brain may be linked to defective developmental neurogenesis. Although animal models are extremely useful to study brain pathologies, observations obtained in animal models should be validated against human material and vice versa. In a comparative study in human fetuses with DS and in the Ts65Dn mouse model for DS, we recently obtained evidence that cell proliferation was severely impaired in the neurogenic zones of the hippocampal DG, both in the mouse model and DS fetal brain (10). Based on the reduced cell proliferation observed in the DG of DS fetuses, we postulate that the outcome of this defect should be a reduction in the number of neurons populating this region that starts from early developmental stages. Consequently, the first goal of our study was to establish whether the DG of DS fetuses has a reduced cell number compared with normogenic ones. As the evidence in DS fetuses and animal models for DS (9, 10, 19, 27, 35, 39) suggests that proliferation impairment may be a widespread feature in the DS brain, it is possible that disruption of development involves various structures of the hippocampal region. The second goal of our study was to establish whether fetuses with DS exhibit a reduced cell number in the hippocampus proper and in the cortices forming the parahippocampal gyrus (PHG) and whether this reduction is linked to defective cell proliferation. Apoptosis (programed cell death) is an important phenomenon that, during brain development, contributes to regulate the final number of neurons. As accumulating evidence indicates that enhanced apoptosis in the adult DS brain may play a role in mental retardation, but conflicting results are available for the fetal DS brain (13, 21, 43), the third goal of our study was to establish whether increased apoptotic cell death contributes to reduce the final number of neurons forming the fetal hippocampal region.
MATERIALS AND METHODS
Subjects
Brains from fetuses of 17–21 weeks gestational age were obtained after prior informed consent from the parents, and according to procedures approved by the Ethical Committee of the St. Orsola‐Malpighi Hospital, Bologna, Italy. Regulations of the Italian Ministry of Health and the policy of Declaration of Helsinki were followed. All fetuses derived from legal abortion and were collected with an average post‐mortem delay of approximately 2 h. Seven control fetuses with no obvious developmental or neuropathological abnormalities and six DS fetuses were used (Table 1). Some of the fetuses (cases marked with an asterisk in Table 1) are the same ones used in a previous study (10). Trisomy was karyotypically proven from the results of genetic amniocentesis procedures. All cases were classical trisomy 21 (free trisomy). Autopsies were performed at the Institute of Pathology of the St. Orsola‐Malpighi Hospital. The gestational age of each fetus was estimated by menstrual history and crown‐rump length.
Table 1.
Cases of the present study. Abbreviations: CRL = crown‐rump length; BW = body weight; F =female; M = male; n.a. = not available.
| A | ||||
|---|---|---|---|---|
| Case | Age (weeks) | Sex | CRL (cm) | BW (gm) |
| Control fetuses | ||||
| C118* | 17 | M | 13 | 180 |
| C164*+ | 19 | F | 14 | 285 |
| C27*+ | 20 | F | 17 | 230 |
| C104* | 20 | M | 15 | 330 |
| C178*+ | 21 | M | n.a. | n.a. |
| C82+ | 21 | M | 16.5 | 330 |
| C125+ | 21 | F | 18 | 515 |
| Down syndrome fetuses | ||||
| C203* | 18 | F | 14.5 | 210 |
| C166*+ | 19 | F | 14 | 240 |
| C133*+ | 20 | M | 16 | 300 |
| C134+ | 21 | F | n.a. | n.a. |
| C46*+ | 21 | M | 22 | 355 |
| C77* | 21 | F | 17.5 | 300 |
| B | |||
|---|---|---|---|
| Age (weeks) | CRL (cm) | BW (gm) | |
| Control fetuses | 19.86 ± 0.20 | 15.58 ± 0.23 | 311.67 ± 1.79 |
| Down syndrome fetuses | 20.00 ± 0.22 | 16.80 ± 0.35 | 281.00 ± 1.51 |
| P= | 0.855 | 0.455 | 0.603 |
A. List of the cases used in the present study. Cases labeled with an asterisk are the same as in a previous study (10). Cases labeled with a plus were used for morphometric and stereological analysis of the hippocampal region and cases labeled with an asterisk were used for Ki‐67, GFAP, NeuN and cleaved‐caspase‐3 immunohistochemistry. Age refers to gestational age in weeks. B. Mean ± SEM of the age, CRL and weight of Down syndrome and control fetuses and relative P‐values (two‐tailed t‐test).
Histological procedures
Whole brains were fixed within 1–2 h after abortion by subdural perfusion with Metacarnoy fixative (methyl alcohol: chloroform: acetic acid 6:1:1) injected through the anterior and posterior fontanelles. After 24–48 h, brains were removed and cut across the midline. The hippocampal region of the right hemisphere was dissected out and coronally sectioned in order to obtain three to four blocks with a thickness of 2–3 mm, that encompassed the full extent of the hippocampal region. The blocks were post‐fixed in 4% buffered formaldehyde for 5–7 days, embedded in paraffin, according to standard procedures. Sections of 8–12‐µm thick were made from the paraffin blocks. One fetal hippocampus was represented in approximately 350–500 12‐µm‐thick sections or 527–750 8‐µm‐thick sections. One out of 18 sections, in brains cut in 12‐µm‐thick sections, or one out of 28 sections, in brains cut in 8‐µm‐thick sections, was mounted on glass slides. The total number of mounted sections was 18–30 per subject. Sections were deparaffinized in xylenes, hydrated in graded ethanol to water, stained with Toluidin Blue, according to the Nissl method, differentiated in graded ethanols to xylene and cover‐slipped. In some fetuses (Table 1: cases labeled with an asterisk), the first block was cut so as to obtain, in addition to 8‐ or 12‐µm‐thick sections, five to six series of three‐four adjacent 4‐ to 5‐µm‐thick sections, 200 µm apart.
Ki‐67, GFAP, NeuN, cleaved caspase‐3 immunohistochemistry
Five to six sections of the series of 4‐ to 5‐µm‐thick sections from the first block from cases labeled with an asterisk in Table 1 were stained using monoclonal anti‐Ki‐67 (dilution 1:500; clone MM1), from Novocastra Laboratories, according to procedures previously described (10). Three to four sections of the series were stained for glial fibrillary acidic protein (GFAP) using a monoclonal antibody from Sigma Chemical Co., USA (dilution 1:1600; clone G‐A‐5), two‐four sections were immunostained using monoclonal anti‐NeuN (neuron specific nuclear protein) from Chemicon International, USA (dilution 1:200; clone A60) and two‐three sections were immunstained for cleaved caspase‐3 using a polyclonal rabbit antibody from Cell Signaling Technology, USA (dilution 1:800). Sections were retrieved with citrate buffer pH 6.0 at 98°C for 40 minutes before incubation with their proper antibody and processed as previously described (10). All sections were counterstained with Mayer's Haematoxylin.
Nomenclature
While there is extensive information on the neuroanatomy and cytoarchitecture of the adult hippocampal region, there is no similarly systematic information for fetal material. In the current study, identification of the subdivisions of the hippocampal region was based on classical neuroanatomical studies in adult brains (16, 49) and a few available data for fetal brains (1, 18, 24, 31).
The term hippocampal region, as used here, indicates the hippocampal formation and the non‐olfactory portions (49) of the PHG (Table 2). The hippocampal formation includes the DG, hippocampus proper (Cornu Ammonis) and subiculum. At the fetal ages examined in the current study, all these structures are recognizable (Figure 1A–C) (1) (see also 1, 2). The DG is formed by the granule cell layer, molecular layer and hilus (Figure 1D). The arm of the granule cell layer that faces fields CA3–CA2 is named upper blade (suprapyramidal blade) and the arm that faces the medial bank of the hippocampal fissure is named lower blade (infrapyramidal blade) (Figure 1D). The hippocampus is formed by fields CA3, CA2 and CA1. At the fetal ages examined here, fields CA3, CA2 and CA1 were recognizable (Figure 1C), but the CA1/subiculum transition was ill definable. For this reason we included the subiculum into the hippocampus proper and the term hippocampus as used here refers to the CA fields plus the subiculum. The fetal hippocampus is formed by a cellular lamina, the pyramidal layer, flanked by two cell‐poor laminae. The lamina overlying the pyramidal layer is the molecular layer. The lamina underlying the pyramidal layer is subdivided into a ventricular zone, lining the ventricle and containing densely packed neuroblasts, and a sparsely populated intermediate zone below the pyramidal layer (1) (Figure 1D). The PHG of the adult human brain forms the ventral portion of the limbic lobe (49). The lateral margin of the PHG is defined by the rhinal fissure, rostrally, and by the collateral fissure, caudally. The anteriormost part of the PHG is formed by an olfactory primary cortex (Brodmann's area 51) and the remaining intermediate and caudal parts are dominated by the entorhinal cortex (EC) (area 28). The lateral area of the PHG is the perirhinal cortex (area 35), which forms the fundus, medial and lateral bank of the rhinal and collateral sulcus. The medial most cortex of the PHG is formed by the parasubiculum (area 49) and presubiculum (area 27). The posterior cortex of the PHG is the ectorhinal cortex (area 36). The term PHG used in the current study includes only the intermediate and caudal non‐olfactory portions of the PHG. The level at which the DG first appeared was considered as the rostral border of the PHG and the level at which the DG disappeared was considered as its caudal border. At the examined fetal ages, the lateral border of the PHG was identifiable because of the presence of a collateral sulcus (Figure 1A,B). Based on cytoarchitectonic criteria, we were able to recognize three different areas in the fetal PHG. Adjacent to the subiculum there was a region resembling the adult presubiculum (PRES) (Figure 1C). It was formed by an outer cellular lamina (lamina principalis externa) populated by small, tightly packed cells, grouped in islands (Figure 1E: arrowhead), and an inner lamina (lamina principalis interna) populated by less densely packed cells. The two laminae were separated by a thin, cell‐poor zone (lamina dissecans) (Figure 1E). Going from the PRES toward the collateral sulcus there was a region clearly resembling the EC of the adult brain because of the presence of a cell poor layer (lamina dissecans) that separated two thick cellular layers (lamina principalis interna and lamina principalis externa) (Figure 1C,F) and the presence of large cells, grouped in small islands, at the outer border of lamina principalis externa (Figure 1F: arrowhead). In the adult brain, a small, wedge shaped region, the parasubiculum, is interposed between the PRES and EC. Although the pattern of the cortex close to the PRES (Figure 1C: filled triangle) was slightly different from that of the EC, suggesting that it may correspond to the adult pararasubiculum, it was difficult to recognize the transition between this region and the EC. Thus, the EC of this study very likely includes the parasubiculum. At rostral levels of the PHG, the EC stretched from the PRES to the collateral sulcus (Figure 1C). Going caudally, the lamina dissecans disappeared in the lateral portion of the PHG (Figure 1B: region between the diamond and the collateral sulcus) and the cell layers formed a single thick lamina (Figure 1G). The region without lamina dissecans occupied a progressively larger portion of the PHG going toward the caudal end of the PHG. As, based on Nissl‐stained material, it was not possible to establish whether this region corresponded to immature EC and/or to areas 35 and 36, the portion of the PHG without lamina dissecans will be called lateral parahippocampal gyrus (LPHG).
Table 2.
Structures forming the hippocamnpal region.
| Name | Name | Name | Name | Abbreviation |
|---|---|---|---|---|
| Hippocampal region | / | |||
| Hippocampal formation | / | |||
| Dentate gyrus | DG | |||
| Hippocampus proper (Cornu Ammonis) | HIPP | |||
| Field CA1 | CA1 | |||
| Field CA2 | CA2 | |||
| Field CA3 | CA3 | |||
| Subiculum | SUB | |||
| Parahippocampal gyrus | PHG | |||
| Presubiculum (area 27) | PRES | |||
| Parasubiculum (area 49)* | PARA | |||
| Entorhinal cortex (area 28) | EC | |||
| Perirhinal cortex (area 35)* | / | |||
| Ectorihinal cortex (area 36)* | / |
Structures forming the adult hippocampal region, as defined in the current study. In fetuses of 17–21 weeks gestational age, most of the structures that form the adult hippocampal region were recognizable. Only the areas labeled by an asterisk were not readily recognizable at the examined fetal ages. The lateral parahippocampal gyrus of the current study (lateral parahippocampal gyrus, see Nomenclature) may include the perirhinal and ectorhinal cortices. The abbreviations used in the current study are reported in the column “Abbreviation”.
Figure 1.
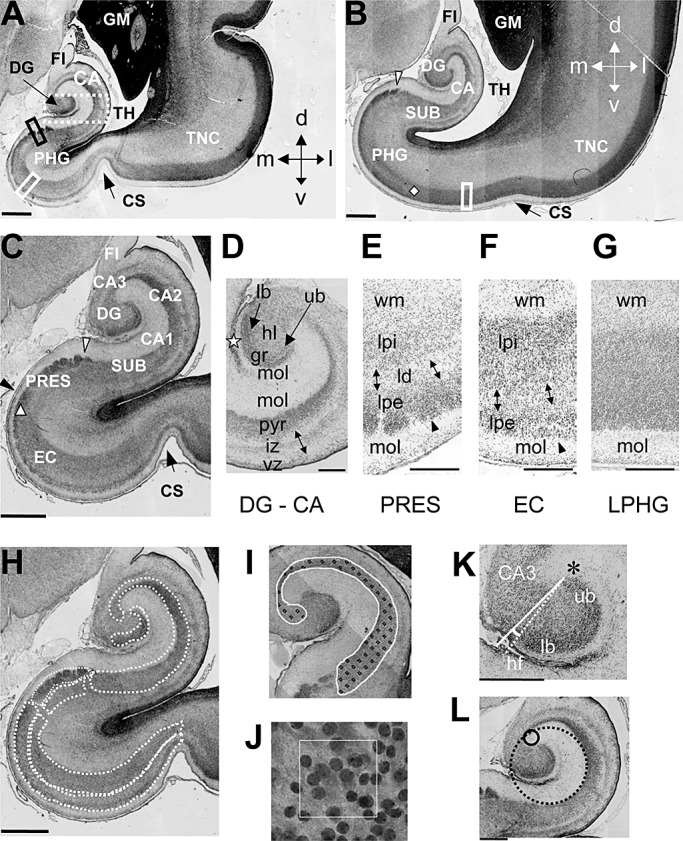
A–G. Hippocampal region in human fetuses. Nissl‐stained coronal sections across the hippocampal region of a control fetus (case 164). Sections in A and B were approximately 1 mm and 4 mm caudal to the rostral border of the hippocampal formation, respectively. Section in C is a higher magnification of section in A. The white arrowhead in B and C marks the border between the subiculum and presubiculum and the black arrowhead in C marks the border between presubiculum and EC. The diamond in B indicates the lateral border of the EC and the triangle in C indicates the transition between presubiculum and EC, possibly corresponding to the parasubiculum (see Nomenclature for explanations). Section in D corresponds to the region enclosed by a stippled rectangle in A, rotated 90° clockwise, and shows the layers of the fetal DG and hippocampus. The star indicates the obliterated hippocampal fissure. Sections in E and F correspond to the regions that in A are enclosed by a black and white rectangle, respectively and section in H corresponds to the region that in B is enclosed by a rectangle. Note the presence of a lamina dissecans in the presubiculum (E) and EC (F) but not in the cortex forming the lateral portion of the PHG (G). H–L: Measurements. The manner in which the areas of the granule cell layer, pyramidal layer and cellular laminae of the PHG (stippled contours) were measured is shown in H. I shows an example of counting frames spaced in a 150 µm square grid (fractionator) placed over the hippocampus. A higher magnification of one disector with 30 µm side length is shown in J. The manner by which the DG/CA3 angle and curvature radii of the hippocampus were measured is shown in K and L, respectively. Calibrations: A–C and H = 1000 µm; D–G= 300 µm; K,L = 500 µm. Abbreviations: CA = hippocampus (Cornu Ammonis); CA1, CA2, CA3 = hippocampal fields; CS = collateral sulcus; d = dorsal; DG = dentate gyrus; EC = entorhinal cortex; FI = fimbria; GM = germinal matrix; gr = granule cell layer; hl = hilus; iz = intermediate zone; l = lateral; lb = lower blade; ld = lamina dissecans; lpe = lamina principalis externa; lpi = lamina principalis interna; m = medial; mol = molecular layer; PHG = parahippocampal gyrus; PRES = presubiculum; pyr = pyramidal layer; SUB = subiculum; TH = temporal horn of the lateral ventricle; TNC = temporal neocotex; ub = upper blade; v = ventral; vz = ventricular zone; wm = white matter.
Figure 2.
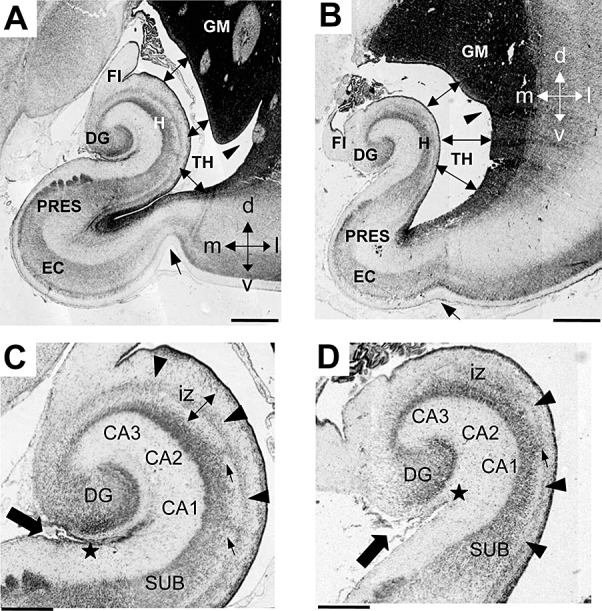
Comparison of the anatomy of the hippocampal region in DS and control fetuses. A–D. Nissl‐stained coronal sections across the hippocampal region of a control (A,C; case 164) and a DS (B,D; case 166) fetus. Sections in C and D are higher magnification of A and B, respectively. The arrow in A and B indicates the collateral sulcus, the double‐headed arrows indicate the lumen of the lateral ventricle and the arrowhead indicates the indentation in the lateral wall of the ventricle. The arrow in C and D indicates the hippocampal fissure and the star marks the point where the hippocampal fissure becomes obliterated. The arrowheads in C and D indicate the stream of cells in the intermediate zone of the hippocampus and the small arrows indicate column of cells en route toward the pyramidal layer. Calibration: A,B = 1000 µm and C,D = 500 µm. Abbreviations: CA1, CA2, CA3 = hippocampal fields; d = dorsal; DG = dentate gyrus; DS = Down syndrome; EC = entorhinal cortex; FI = fimbria; GM = germinal matrix; iz = intermediate zone; H = hippocampus; l = lateral; m = medial; PRES = presubiculum; SUB = subiculum; TH = temporal horn of the lateral ventricle; v = ventral.
Measurements
The following system was used: (i) light microscope (Leitz, Germany) equipped with a motorized stage and focus control system; (ii) color digital videocamera attached to the microscope; (iii) Image Pro Plus (Media Cybernetics, Silver Spring, MD, USA) with the StagePro module for controlling the motorized stage in the x, y and z directions, as primary software. A macro based on the BASIC programing language developed by King et al (25) was used for the automatic conducting of the optical fractionator process. Morphometry, stereology and evaluation of pyknotic cells were carried out in the series of Nissl‐stained sections from cases for which all blocks were available (five control and four DS fetuses; case labeled with + in Table 1), as for the remaining cases some blocks of the series were not available. For evaluation of cell proliferation, cell phenotype and expression of cleaved caspase‐3 we used sections from cases labeled with an asterisk in Table 1 (five control and five DS fetuses). The following measurements were carried out.
Morphometry: rotation of the DG and curvature radii of the hippocampus
To quantify the rotation of the DG with respect to the hippocampus, we evaluated the DG/CA3 angle as follows. We first drew a perpendicular line from the tip of the upper blade of the DG (Figure 1K: asterisk) to the tip of the pyramidal layer of CA3, at its entrance into the hilus (Figure 1K: continuous line). A line was then drawn joining the tips of the upper and lower blades (Figure 1K: stippled line). The angle between these two lines was considered as the CA3/DG angle. To quantify the infolding of the hippocampus, we evaluated the curvature radius at the level of field CA3 and CA1. To this purpose, we traced a circle that best fitted the curvature of the outer border of the pyramidal layer at the level of the CA3 portion close to the DG (Figure 1L: continuous circle) and at the level of field CA1 (Figure 1L: stippled circle), respectively. From the area of these circles we calculated the curvature radius of field CA3 and field CA1.
Stereology: volume, cell density and cell number
The areas of the granule cell layer of the DG, pyramidal layer of the hippocampus, lamina principalis interna and lamina principalis externa of the PRES and EC and of the single cellular lamina of the LPHG were measured in each section by tracing their contours (Figure 1H). Based on the Cavalieri principle (17, 52), we estimated the reference volume (Vref) of the granule cell layer, pyramidal layer, lamina principalis interna and lamina principalis externa of the PRES and EC and single cellular lamina of the LPHG by multiplying the sum of the areas measured in the series of sections by the distance between sections (either 224 or 216 µm). Numerical density in the DG, hippocampus, PRES, EC and LPHG was determined using the optical fractionator. Counting frames with 30 µm side length and either 8 or 12 µm height (ie, depth) spaced in a 150 µm square grid (fractionator) were systematically used (Figure 1I,J). The position of the counting frame in the PRES and EC was noted during counting, to determine separately cell density in lamina principalis interna and lamina principalis externa. Cell nuclei were counted with a ×100 (Leitz) oil objective (1.4 NA). Nuclei intersecting the uppermost focal plane and intersecting the exclusion lines of the count frame were not counted. The neuron density (Nv) is given by
where Q is the number of particles counted in the disectors hitting the region of interest, dis is the number of disectors and V dis is the volume of the disector (sampling volume). V dis is given by the area of the disector multiplied by the height. Total number of cells in the DG, hippocampus, lamina principalis interna and lamina principalis externa of the PRES and EC, and in the LPHG was evaluated using the optical disector principle, where total number (N) of cells is estimated as the product of V ref and the numerical density (Nv) in the sample
Density of Ki‐67‐positive cells
Proliferating cells were identified with immunostaining for Ki‐67 (36, 44). Ki‐67‐positive cells were counted in a series of five‐six sections from the block containing the rostral portion of the hippocampal region. The number of Ki‐67‐positive cells was determined in the ventricular zone of the hippocampus (Figure 7C: region between the arrowheads) and in the ventricular zone of the PHG that surrounded the tip of the ventricle (Figure 7C: zone bordered by a dashed line). The dorsal border of the latter was arbitrarily set at a distance of 500 µm from the tip of the ventricle. In the ventricular zone of the hippocampus and PHG, an outer and an inner region were recognizable, populated by densely and less densely packed cells, respectively. Both regions were thicker in the ventricular zone of the PHG. The areas of the outer and inner region of the ventricular zone of the hippocampus and PHG were first traced and all immunostained cells present within these areas were counted. The total number of cells counted in a single section in the ventricular zone of the hippocampus was 160–322, in control fetuses and 30–63, in DS fetuses and in the ventricular zone of the PHG was 150–630, in control fetuses and 77–533 in DS fetuses. For all regions, counts were expressed as densities (cells/mm2).
Figure 7.
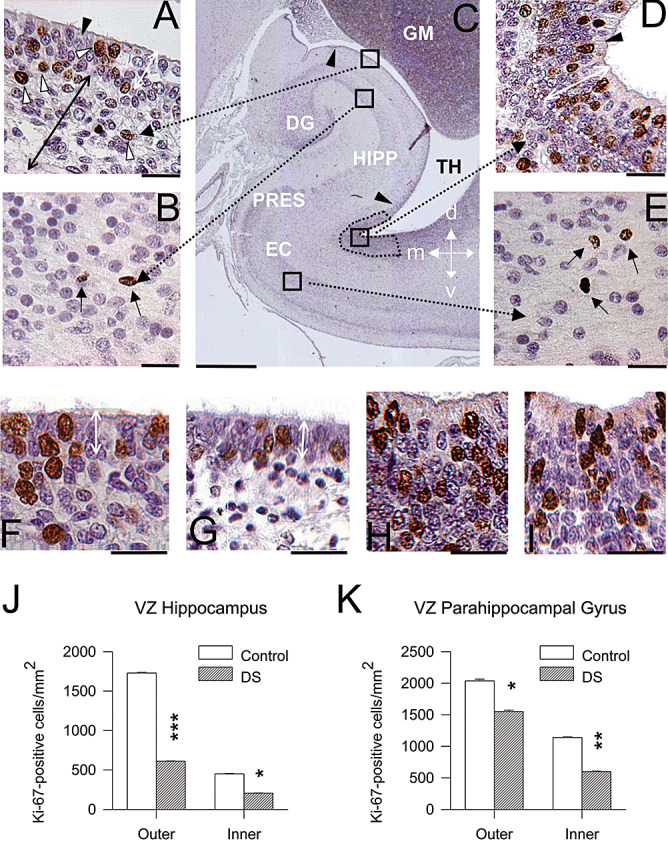
Cell proliferation in the hippocampal region of DS and control fetuses. A–E. Coronal sections across the hippocampal region of a control fetus (case 104) immunostained for Ki‐67 and counterstained with Mayer's Haematoxylin. Images in A, B, D and E are higher magnification of the regions enclosed by squares in C. Cells immunostained for Ki‐67 appear labeled in brown: for instance, the cells indicated by the white arrowheads in A and black arrows in B and E. Cells indicated by the black arrowhead in A and D are ependymal cells. The arrowheads in C mark the border of the ventricular zone of the hippocampus and the stippled area indicates the region of the ventricular zone of the PHG where proliferating cells were sampled. The double‐headed white arrow in A and D indicates the outer portion of the ventricular zone. The double‐headed black arrow in A indicates the inner portion of the hippocampal ventricular zone. F–I. Examples of sections immunostained for Ki‐67 and counterstained with Mayer's Haematoxylin from the ventricular zone overlying the hippocampus in a control (F) and a DS (G) fetus and from the outer ventricular zone of the PHG in a control (H) and a DS (I) fetus. Images are from cases 104 (F,H) and 203 (G,I). The double‐headed white arrow in F and G indicates the outer portion of the ventricular zone of the hippocampus. Calibration: A, B, D, E, F–I = 25 µm; and C = 1000 µm. J,K. Density of Ki‐67‐positive cells, expressed as number of cells/mm2 in the outer and inner ventricular zone of the hippocampus (J) and PHG (K). Values are mean ± SEM. *P < 0.05; **P < 0.01; ***P < 0.001 (two‐tailed t‐test). Abbreviations: d = dorsal; DG = dentate gyrus; EC = entorhinal cortex; GM = germinal matrix; HIPP = hippocampus; l = lateral; m = medial; PHG = parahippocampal gyrus; PRES = presubiculum; TH = temporal horn of the lateral ventricle; v = ventral.
Percentage of GFAP‐positive cells
GFAP is expressed in the cytoplasm and processes of astrocytes. In sections processed for GFAP immunohistochemistry and counterstained with Mayer's Haematoxylin, the cytoplasm around the nucleus and the processes of astrocytes appeared stained in brown, while the other cells exhibited only a pale purple nuclear staining (Figure 6B). We counted GFAP‐positive and GFAP‐negative cells in the granule cell layer of the DG, pyramidal layer of the hippocampus, and cellular layers of the PRES, EC and LPHG. To this purpose, a rectangle with 150 × 130 µm sides was randomly placed at two‐three different locations in each region and total number of GFAP‐positive and GFAP‐negative cells in each rectangle was counted. Number of GFAP‐positive and GFAP‐negative cells was expressed as percentage of total cell number.
Figure 6.
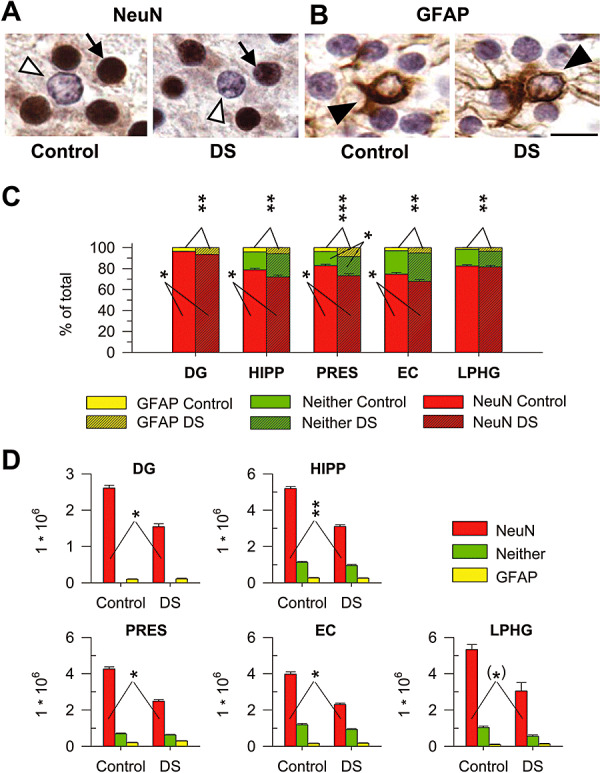
Cell phenotype. A,B. Sections immunostained for NeuN (A) and GFAP (B) from the EC of a control (case 164) and a DS (case 203) fetus. The arrow in A marks one of the NeuN‐positive cells and the empty arrowhead marks one NeuN‐negative cell. The filled arrowhead in B marks one GFAP‐positive cell. Calibration = 10 µm. C,D. Percentage (C) and total number (D) of NeuN‐positive cells (red bars), GFAP‐positive cells (yellow bars) and cells that did not express either NeuN or GFAP (green bars) in the cellular layers of the structures forming the hippocampal region of control and DS fetuses. Values are mean ± SEM. *P < 0.05; **P < 0.01; ***P < 0.001 (two‐tailed t‐test). Abbreviations: DG = dentate gyrus; DS = Down syndrome; EC = entorhinal cortex; HIPP = hippocampus; LPHG = lateral parahippocampal gyrus; PRES = presubiculum.
Percentage of NeuN‐positive cells and of cells of undetermined phenotype
NeuN is expressed in the nucleus of mature neurons. In sections processed for NeuN immunohistochemistry and counterstained with Mayer's Haematoxylin, the nuclei of neurons were heavily stained in brown, while cells that did not express NeuN exhibited a pale purple nuclear staining (Figure 6A). We counted NeuN‐positive and NeuN‐negative cells in the granule cell layer of the DG, pyramidal layer of the hippocampus and cellular layers of the PRES, EC and LPHG. To this purpose, a rectangle with 150 × 130 µm sides was randomly placed at two‐three different locations in each region and total number of NeuN‐positive and NeuN‐negative cells in each rectangle was counted. The number of NeuN‐positive cells was expressed as the percentage of a total cell number. The percentage of cells that did not express NeuN was larger than the percentage of cells with astrocytic phenotype, indicating the presence of a population of cells of undetermined phenotype. We evaluated the percentage of these cells by subtracting from the population of cells that did not express NeuN, the percentage of cells that expressed GFAP.
Number of cells of each phenotype
From the phenotype percent distribution and total number of cells in the cellular layers of the DG, hippocampus, PRES, EC and LPHG we calculated total number of cells of each phenotype in each subject. For the control and DS cases in which GFAP and NeuN immunohistochemistry was not performed (see Table 1), we used the mean values of the phenotype percent distribution, obtained by averaging the measurements of the control and DS cases, respectively.
Density of apoptotic cells
In Nissl‐stained sections, apoptotic cells were recognized based on their morphology, characterized by a pyknotic darkly stained nucleus and light or absent cytoplasm. The total number of apoptotic cells counted per section in the hippocampal region was 3–6 in control fetuses and 4–10 in DS fetuses. These cells were mainly located in the granule cell layer of the DG and ventricular zone of the hippocampus and PHG. Counts in the granule cell layer and ventricular zone of the hippocampus and PHG were divided by the area of the granule cell layer and ventricular zone, respectively, and expressed as number of apoptotic cells/mm2. In sections immunostained for cleaved caspase‐3, apoptotic cells are easily detectable based on their darkly stained nucleus. Therefore, we were able to count a sufficient number of apoptotic cells also in the cellular layers of the hippocampus and PHG. The total number of cleaved caspase‐3‐positive cells counted per section in the hippocampal region was 10–18 in control fetuses and 18–20 in DS fetuses. Counts in the granule cell layer, ventricular zone of the hippocampus and PHG, pyramidal layer of the hippocampus and cellular layers of the PHG were divided by the area of each region and expressed as number of apoptotic cells/mm2.
Statistical comparisons
All data presented are mean ± SEM. Data from single subjects were the unity of analysis. Statistical analysis was performed with Student's two‐tailed t‐test. A probability level of P ≤ 0.05 was considered to be statistically significant.
RESULTS
Morphology of the hippocampal region of DS and control fetuses
Comparison of DS and non‐DS brains showed several differences in the anatomy of the hippocampal region (Figure 2). The collateral sulcus was less pronounced in DS than in control fetuses (Figure 2A,B: arrow). Unlike in control fetuses, in DS fetuses the hippocampus and the germinal matrix scarcely protruded into the ventricle so that the latter formed a larger cavity compared with controls (Figure 2A,B). While in control fetuses there was a deep notch in the germinal matrix near the floor of the lateral ventricle (Figure 2A: arrowhead), such a notch was absent or hardly noticeable in DS fetuses (Figure 2B: arrowhead), which conferred a crescent shape to the temporal horn of the ventricle. In control fetuses the granule cell layer was U‐shaped and largely rotated around CA3 (Figure 2C). In DS fetuses it was C‐shaped and was less rotated (Figure 2D). The hippocampus of control fetuses was largely flexed (Figure 2A) so that the hippocampal fissure was almost obliterated (Figure 2C: filled arrow and filled star). In DS fetuses the hippocampus was folded at a notably lesser degree (Figure 2B) and a larger hippocampal fissure separated the DG from the hippocampus (Figure 2D: filled arrow and filled star). In control fetuses, in the intermediate zone of the hippocampus there was a thick band of cells that arched around the hippocampal fields and subiculum (Figure 2C, arrowheads). Small columns of cells appeared to leave the stream, presumably en route to the pyramidal layer (Figure 2C, small arrows). In DS fetuses, the stream of cells in the intermediate zone of the hippocampus was thinner and populated by loosely arranged cells (Figure 2D).
To quantify differences between control and DS fetuses in the rotation of the DG, we measured the angle between the DG and field CA3 (Figure 3A,B; see Materials and methods). The smaller the angle, the larger the rotation of the DG around CA3. We found that in control fetuses the DG/CA3 angle had a value of 12°, while in DS fetuses it had a value of 27° (Figure 3C). Although the curvature radius of the hippocampus gradually changes going from CA3 to the subiculum, two major flexures can be recognized (2, 3): a relatively abrupt one, close to the tip of field CA3 (CA3 flexure) and a milder one, at the level of field CA1/subiculum (CA1 flexure). To quantify differences in the flexure of the hippocampus, we measured the curvature radius of the CA3 and CA1 flexures (Figure 3D,E; see Materials and methods). The smaller the curvature radius, the larger the degree of infolding. We found that while in control fetuses the CA3 curvature radius was 260 µm, in DS fetuses it was 440 µm (Figure 3F). Likewise, while in control fetuses the CA1 curvature radius was 560 µm, in DS fetuses it was 980 µm (Figure 3G).
Figure 3.
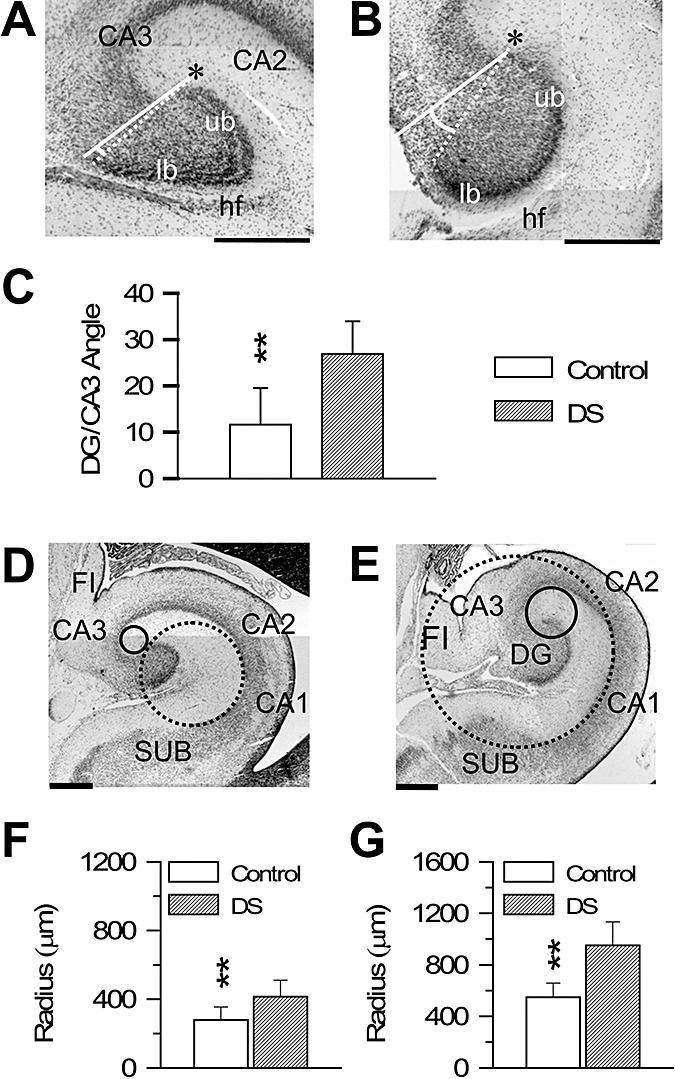
Morphometry of the DG and hippocampus in DS and control fetuses. A,B. Nissl‐stained sections across the DG of a control (A; case 27) and a DS (B; case 133) fetus, showing the manner by which the angle between the DG and CA3 was measured (see Materials and methods). The asterisk indicates the tip of the upper blade. C. Values (mean ± SEM) of the angle between the DG and CA3 in control and DS fetuses. D,E. Nissl‐stained sections across the hippocampal formation of a control (D; case 178) and a DS (E; case 134) fetus, showing the manner by which the curvature radii of the hippocampus at the level of CA3 (continuous circle) and CA1 (stippled circle) were measured (see Materials and methods). F,G. Values (mean ± SEM) of the curvature radius at the level of CA3 (F) and CA1 (G) in control and DS fetuses. Calibration in A, B, D and E=500 µm. **P < 0.01 (two‐tailed t‐test). Abbreviations: CA1, CA2, CA3 = hippocampal fields; DG = dentate gyrus; DS = Down syndrome; FI = fimbria; hf = hippocampal fissure; lb = lower blade; SUB = subiculum; ub = upper blade.
Stereology of the DG and hippocampus in DS and control fetuses
Estimation of the volume of the granule cell layer showed that in DS fetuses it was significantly smaller compared with controls (Figure 4A). No differences were found between control and DS fetuses in cell density in the granule cell layer (Figure 4A). Estimation of total cell number showed that DS fetuses had less (−39%) cells in the granule cell layer than controls (Figure 4A).
Figure 4.
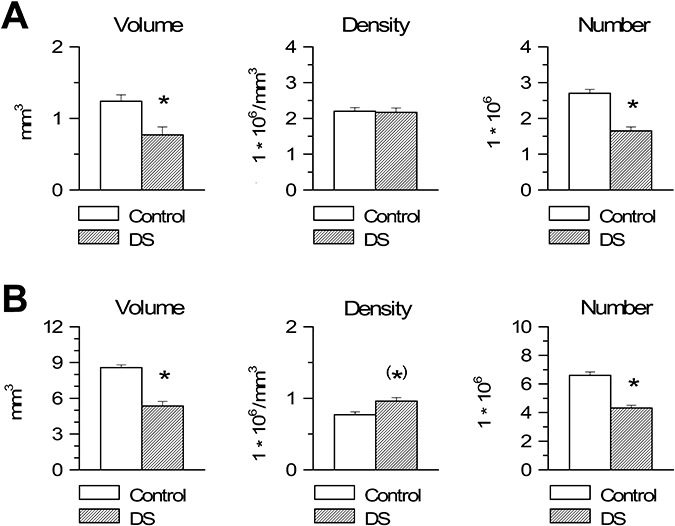
Stereology of the dentate gyrus and hippocampus in Down syndrome (DS) and control fetuses. A,B. Volume (panels on the left), cell density, expressed as number of cells/mm3 (middle panels) and total number of cells (panels on the right) of the granule cell layer (A) and pyramidal layer (B) in DS and control fetuses. Values are mean ± SEM. (*)P < 0.06; *P < 0.05 (two‐tailed t‐test).
Estimation of the volume of the pyramidal layer of the hippocampus showed that in DS fetuses it was significantly smaller than in control fetuses (Figure 4B). Cell density in the pyramidal layer was larger in DS than in control fetuses, although this difference only approached significance (Figure 4B). Estimation of total cell number showed that DS fetuses had significantly less (−35%) cells in the pyramidal layer than controls (Figure 4B).
Stereology of the PHG in DS and control fetuses
The volume of both cellular laminae of the PRES was significantly smaller in DS than in control fetuses (Figure 5A). In both laminae, no difference was found between DS and control fetuses in cell density (Figure 5A). Evaluation of total cell number showed that DS fetuses had a reduced number of cells compared with controls, both in lamina principalis interna (−38%) and lamina principalis externa (−32%) (Figure 5A).
Figure 5.
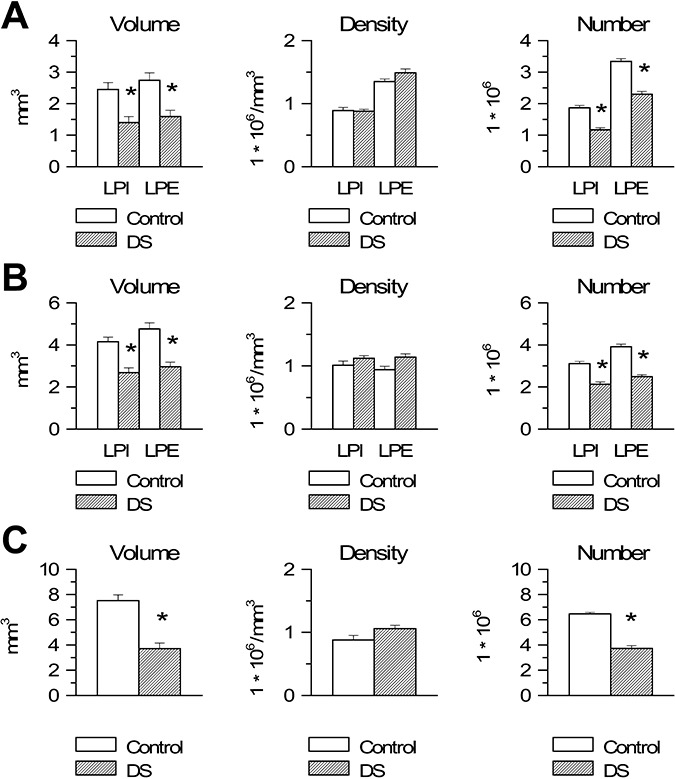
Stereology of the parahippocampal gyrus in Down syndrome (DS) and control fetuses. A–C. Volume (panels on the left), cell density, expressed as number of cells/mm3 (middle panels) and total number of cells (panels on the right) of lamina principalis interna (LPI) and lamina principalis externa (LPE) of the presubiculum (A) and entorhinal cortex (B) and of the single cellular lamina of the lateral parahippocampal gyrus (C) in DS and control fetuses. Values are mean ± SEM. *P < 0.05 (two‐tailed t‐test).
The volume of both cellular laminae of the EC was significantly smaller in DS than in control fetuses (Figure 5B). In both laminae, no difference was found between DS and control fetuses in cell density (Figure 5B). Evaluation of total cell number showed that DS fetuses had a reduced number of cells compared with controls both in lamina principalis interna (−32%) and lamina principalis externa (−37%) (Figure 5B).
A single cell lamina was recognizable in the LPHG because of the lack of a lamina dissecans. The volume of this cell lamina was significantly smaller in DS than in control fetuses (Figure 5C). No difference was found between DS and control fetuses in cell density in the LPHG (Figure 5C). Evaluation of total cell number showed that DS fetuses had a reduced number of cells (−43%) compared with controls (Figure 5C).
Cell phenotype
To establish the phenotype of the cells populating the cellular layers of the hippocampal region, we performed immnohistochemistry for GFAP, a marker of astrocytes, and NeuN, a marker of mature neurons (Figure 6A,B). We found that both in control and DS fetuses very few (2%–8%) cells had astrocytic phenotype. Comparison of control and DS fetuses showed that the latter had a percent number of astrocytes significantly larger than controls in all structures of the hippocampal region (Figure 6C). Sections processed for NeuN immunohistochemistry showed that most (70%–95%) of the cells populating the cellular layers had neuronal phenotype. Comparison of the percentage of NeuN‐positive cells showed that DS fetuses had a percent number of NeuN positive cells smaller than controls in all structures of the hippocampal region, with exception of the LPHG, where DS fetuses had a similar percentage as controls (Figure 6C).
In the granule cell layer of the DG the number of cells that did not express NeuN corresponded to the percentage of cells with astrocytic phenotype counted in sections processed for GFAP immunohistochemistry. In all other structures, the cells that did not exhibit neuronal phenotype were 17%–30% of total. As the percentage of these cells outweighed that of cells with astrocytic phenotype, evaluated in sections processed for GFAP immunohistochemistry, this implies that the NeuN‐negative cells included not only astrocytes but also cells that did not exhibit either neuronal or astrocytic phenotype. Substracting the percentage of cells with astrocytic phenotype from the pool of NeuN‐negative cells, we found that the cells that did not express either NeuN or GFAP (cells of undetermined phenotype) were approximately 14%–27% of total. Comparison of control and DS fetuses showed no significant differences in the percentage of cells with undetermined phenotype, with the exception of the PRES, where DS fetuses had more cells of undetermined phenotype (Figure 6C).
By multiplying the percentage of cells of each phenotype by the number of cells counted in the cellular layers in Nissl stained material (see preceding sections), we calculated total number of astrocytes, neurons and cells of undetermined phenotype in each structure. We found no differences between control and DS fetuses in total number of astrocytes and cells of undetermined phenotype (Figure 6D). In all structures, however, DS fetuses had a significantly smaller number of neurons compared with controls (Figure 6D).
Cell proliferation in the ventricular zone of the hippocampus and PHG in DS and control fetuses
In the human embryo, cell proliferation has long been assessed by counting mitotic figures. The limit of this method is that detection of mitotic figures requires fixation by perfusion because insufficient fixation results in loss of mitotic figures (8). Proliferating cells in formaldehyde‐fixed specimens can be identified with immunostaining for Ki‐67, an antibody that reacts with an antigen appearing in cell nuclei through S + G2 + M phases of cell cycle (36, 44). Using Ki‐67 immunohistochemistry, we previously found numerous proliferating cells in the germinal zones (migratory stream, hilus and granule cell layer) of the DG of 17–21‐week‐old human fetuses and that DS fetuses had remarkably less proliferating cells compared with controls. We have examined here the ventricular zone of the hippocampus and PHG, to establish whether proliferating cells are still present in these regions at the examined fetal ages and, if so, to quantify possible differences in proliferation rate between DS and control fetuses.
The ventricular zone of the hippocampus was formed by an outer region consisting in two to three rows of tightly packed cells and an inner 80‐ to 120‐µm‐thick region, populated by more sparsely arranged cells (Figure 7A). At the level of the PHG the ventricular zone was considerably thicker, being formed by an outer region, consisting in 5–8 rows of cells, and an inner 150–300 µm thick region (Figure 7D). An epithelial monolayer, formed by ependymal ciliated cells, lined the ventricular wall (Figure 7A,D: filled arrowhead). Numerous Ki‐67‐positive cells were present both in the outer and inner regions of the ventricular zone of the hippocampus as well as PHG (Figure 7A,D). More sparsely labeled cells were observed in the intermediate zone of the hippocampus and white matter of the PHG. These cells were apparently en route to the pyramidal layer of the hippocampus and cellular layers of the PHG, respectively. Fewer labeled cells were also found in the pyramidal layer of the hippocampus (Figure 7B) and cellular laminae of the PHG (Figure 7E).
Observation of brain sections immunostained for Ki‐67 from control and DS fetuses showed patent differences in the number of Ki‐67‐positive cells in the ventricular zone of both the hippocampus (Figure 7F,G) and PHG (Figure 7H,I). Quantification of these differences showed that in DS fetuses the density of proliferating cells in the ventricular zone of the hippocampus (Figure 7J) and PHG (Figure 7K) was significantly smaller compared with controls. In DS fetuses, the density of proliferating cells was −65%, in the outer region and −55%, in the inner region of the ventricular zone of the hippocampus, and −25%, in the outer region and –48%, in the inner region of the ventricular zone of the PHG.
Apoptotic cell death in the hippocampal region of DS fetuses
Apoptotic cell death is an important phenomenon that, during brain development, contributes to regulate the final number of neurons. We evaluated the number of apoptotic cells in the hippocampal region of control and DS fetuses, to establish whether apoptosis was affected by the trisomic condition. Apoptosis was evaluated both by counting the number of pyknotic cells, in Nissl stained material (Figure 8A) and the number of cells that expressed cleaved caspase‐3, a protein that is one of the hallmarks of apoptotic death, in sections immunostained for cleaved caspase‐3 (Figure 8D).
Figure 8.
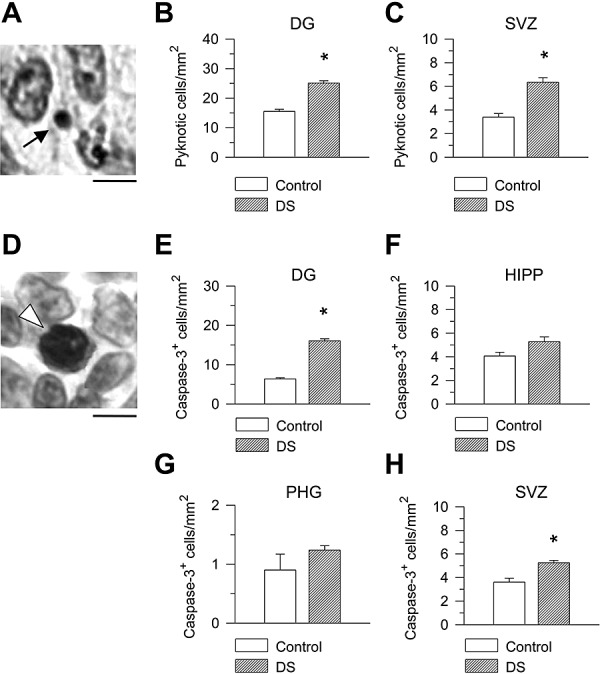
Apoptotic cell death in the hippocampal region of DS and control fetuses. A. Nissl‐stained section across the ventricular zone of the parahippocampal gyrus. The morphology of an apoptotic cell (arrow) consists in a pyknotic darkly stained nucleus with very small size and light or absent cytoplasm. Calibration = 5 µm. B,C. Density of pyknotic cells expressed as number of cells/mm2 in the granule cell layer (B) and ventricular zone of the hippocampus and parahippocampal gyrus (C). D. Example of a cleaved caspase‐3‐positive cell (arrowhead) in the ventricular zone of the parahippocampal gyrus. Cells immunostained for cleaved caspase‐3 show intense nuclear immunoreactivity. Calibration = 5 µm. E–H. Density of caspase‐3‐positive cells expressed as number of cells/mm2 in the granule cell layer (E), cellular layers of the hippocampus (F) and PHG (G) and ventricular zone of the hippocampus and parahippocampal gyrus (H). Values are mean ± SEM. *P < 0.05 (two‐tailed t‐test). Abbreviations: DG = dentate gyrus; HIPP = hippocampus; PHG = parahippocampal gyrus; SVZ = subventricular zone.
In Nissl‐stained material, we found one to four apoptotic cells per section, in the granule cell layer, and two to seven cells per section, in the ventricular zone of the hippocampus and PHG. Pyknotic cells were only occasionally recognized in the cellular layers of the hippocampus and PHG (0–1 cell per section), likely because of the small size of pyknotic cells (see Figure 8A), it is technically difficult to identify them within a large population of normal cells. In sections immunostained for cleaved caspase‐3, we found that the number of apoptotic cells in the granule cell layer and ventricular zone was approximately similar to that found in Nissl‐stained material. We were also able to sample four to ten apoptotic cells per section in the hippocampus and PHG, because with immunostaining for caspase‐3 the dark nuclei of apoptotic cells clearly emerge from the background of normal cells. Comparison of the density of apoptotic cells, evaluated with either method, in control and DS fetuses showed that DS fetuses had a larger density of apoptotic cells both in the granule cell layer (Figure 8B,E) and in the ventricular zone of the hippocampus and PHG (Figure 8C,H) compared with control fetuses. Comparison of the density of caspase‐3‐positive cells in the hippocampus and PHG of control and DS fetuses showed that DS fetuses had more apoptotic cells than controls, although this difference was not statistically significant.
DISCUSSION
The mechanisms underlying the hippocampal hypotrophy that characterizes the adult DS brain have not been elucidated so far. The current study in DS fetuses demonstrates for the first time a severe hypocellularity in all areas forming the fetal hippocampal region and that neurogenesis impairment underlies this defect. These findings allow us to trace back to early developmental stages the hippocampal hypotrophy of the adult DS brain. This precocious atrophy may explain the early impairment of hippocampus‐related memory functions observed in children with DS (7, 50).
Immature shape of the hippocampal region in DS fetuses
At 9–10 weeks gestational age, the hippocampus and the DG form two longitudinal structures, arranged in series. At about 11 weeks, the hippocampus flexes, bulging into the temporal horn of the ventricle. At 12 weeks, the DG rotates toward the hippocampus, beginning to form a C‐shaped structure. Because of a progressive increase in the DG rotation and infolding of the hippocampus from gestational weeks 11–12 to weeks 21–25, the hippocampal fissure becomes progressively less evident and the temporal horn of the lateral ventricle becomes smaller (1, 24, 31). Comparison of DS and control fetuses showed that in DS fetuses the DG was less rotated toward the hippocampus, the hippocampus was less infolded and the ventricular lumen was wider. The “rolling in” of the components of the hippocampal region derives from their size increase during development and parallel expansion of the temporal neocortex. Evaluation of the volumes of the hippocampal region showed that in DS fetuses all structures were hypotrophic (4, 5). We found that in DS fetuses cell density was similar to controls, which indicates that the size of individual cells and/or the volume occupied by individual cells were not affected by the trisomic condition. Consequently, the reduced volume of the hippocampal structures is attributable to the fact that in DS fetuses less cells were added to the cellular layers, because of impaired cell proliferation (see below). Reduced growth of the temporal neocortex has been shown in infants and adults with DS (12, 54). The hypotrophy of all hippocampal structures in conjunction with the reduced growth of the temporal cortex can account for the immature shape of the hippocampal region of DS fetuses compared with age‐matched controls.
In DS fetuses cell proliferation is impaired in all germinal zones of the hippocampal region
The DG appears around 9–10 weeks gestational age (1, 22) and, unlike the other brain regions, it exhibits cell proliferation that continues up to the first year after birth (44). The hippocampal anlage appears as early as 6–7 weeks gestational age (31). If the PHG follows the general developmental pattern of the cerebral cortex (6, 29, 31), it should appear at approximately 7–8 weeks gestational age. There are no data about the time at which neurogenesis ceases in the hippocampus and PHG, although the presence of mitotic figures in the ventricular zone of the hippocampus in 15–19 week‐old fetuses and in the ventricular zone of the PHG in 25‐week‐old fetuses (1) indicates that neurogenesis has not ceased by mid‐gestation.
In agreement with the prolonged neurogenesis of the DG, we previously found numerous proliferating cells in all germinal zones of the DG of 17–21‐week‐old fetuses (10). In the present study, we have found numerous proliferating cells also in the ventricular zone of the hippocampus and PHG, indicating that these regions retain intense proliferative capacity up to gestational week 21, the latest examined age. Comparison of cell proliferation in the ventricular zone of the hippocampus and PHG of control and DS fetuses showed that the latter had a notably reduced number of proliferating cells in both germinal regions. Current findings, in conjunction with our previous observations (10), indicate widespread impairment of cell proliferation in all neurogenic zones of the hippocampal region. It seems very likely that the reduced cell proliferation found in 17–21‐week‐old DS fetuses reflects a reduction that started at earlier stages of development. Impaired cell proliferation during these critical phases, when neurogenesis is most intense, is expected to profoundly affect the number of neurons that will form the future hippocampal region (see below).
Apoptosis is increased in the DS fetal hippocampal region
Accumulating evidence indicates that enhanced apoptosis (programmed cell death) in the adult DS brain may play a role in mental retardation. Conflicting results are available for the fetal DS brain. While some studies report upregulation of proapoptotic factors and apoptosis‐associated proteins (21, 43), there is also evidence against increased apoptosis in the fetal DS brain (13). We have examined here apoptosis in the hippocampal region and obtained evidence that DS fetuses exhibit a higher number of apoptotic cells compared with controls in the DG and germinal zones of the hippocampus and PHG. Although DS fetuses had more apoptotic cells than controls also in the cellular layer of the hippocampus and PHG, this difference was not significant. This may suggest that, at least at the examined ages, apoptosis is more prominent in regions, such as the DG and subventricular zone, characterized by neurogenic activity. The unaltered expression of caspase‐3 in fetal DS brains reported by Engidawork et al (13) may be explained by the fact that analysis was carried out in the fetal cortex, where apoptosis may be less prominent than in other brain structures. In addition, as our study showed that in absolute terms the number of apoptotic cells per brain section was very small, possible differences between DS and control fetuses may be undetectable when examined by Western blot analysis as used in Engidawork et al's study (13).
Our finding of increased apoptosis in DS fetuses is in agreement with evidence for increased apoptosis during embryogenesis in the developing cortex of the Ts16 mouse model for DS (19). The larger number of apoptotic cells in DS fetuses suggests that enhanced cell death will contribute to reduce the final number of neurons that will form the hippocampal region (see below).
DS fetuses have a reduced number of neurons in all structures of the hippocampal regions
DS fetuses had a reduced number of cells in the granule cell layer of the DG, pyramidal layer of the hippocampus and cellular laminae of the PRES, EC and LPHG. Our finding that in DS fetuses cell proliferation was severely reduced in all neurogenic zones of the hippocampal region, ranging from one‐third to three‐fourths compared with controls, points at neurogenesis disruption as crucial determinant of the reduced number of cells populating the hippocampal structures. We additionally found that in DS fetuses apoptotic cell death was up to 1.8‐fold higher than controls. Although the absolute number of apoptotic cells was small and predictions arising from a model of cortical neuronogenesis indicate that cell death plays a small role in both normal and Ts16 mouse corticogenesis (19), the increased apoptosis found here in human fetuses suggests that this process may contribute to further reduce the final number of cells populating the hippocampal region.
The finding that both cell proliferation and apoptosis were altered in the DS brain is consistent with the aberrant expression of genes regulating these processes observed in the human DS fetal brain and in animal models for DS. DSCR‐1 is a developmentally regulated gene involved in neurogenesis and its overexpression may contribute to brain atrophy through inhibition of calcineurin‐dependent gene transcription (14). An in vitro study has recently shown that the triplicate gene Sim2 may play an important role in the pathogenesis of DS, by inhibiting the cell cycle progression in the G0/G1 phase, which is related to the decreased expression of cyclin E and increased expression of p27 (28). In neuronal precursor cells derived from the cortex of fetuses with DS, SCG10, a neuron‐specific growth‐associated protein, and its regulator, the repressor element‐1 silencing transcription factor (REST), were almost undetectable in DS sample (4). Experimental REST down‐regulation has been shown to trigger apoptosis, which could account for the loss of neurons in DS fetuses (26).
Analysis of the phenotype of the cells populating the cellular layers of the hippocampal regions showed that the percentage of astrocytes was significantly larger in DS fetuses, which is in agreement with a similar evidence in a mouse model for DS (10). S‐100 beta is a protein that is expressed at high levels in brain primarily by astrocytes. The gene for the beta subunit of this protein is located on chromosome 21. The observation that in DS the number of S‐100‐positive cells in the hippocampus is greater than in controls, especially during early infancy (30) is in agreement with the increased percentage of astrocytes observed here in DS fetuses. Although both in control and DS fetuses most of the cells that populated the cellular layers had neuronal phenotype, in DS fetuses the percentage of cells with neuronal phenotype was notably smaller than in controls, This finding and the observation that DS fetuses had a higher proportion of GFAP‐positive cells suggests that DS influences the differentiation program, with a reduction in the process of neurogenesis (in the restricted sense of acquisition of neuronal phenotype) but an increase in the process of gliogenesis.
In the granule cell layer of the DG, all cells that did not express GFAP had a neuronal phenotype. In all other structures, however, we found a small fraction of cells that did not express either NeuN or GFAP. The percentage of cells that did not express NeuN found here is of the same magnitude as that reported by a previous investigation during human cortical development (40). As we found very few Ki‐67 (proliferating) cells in the cellular layers of the hippocampal region, the cells that did not express either neuronal or astrocytic phenotype may be postmitotic but still undifferentiated cells. In addition, as certain types of neurons are non‐reactive for NeuN in the fetal and adult brain (40), it is also possible that some of the cells that did not express GFAP or NeuN belong to these neuron types.
Evaluation of absolute number of cells of each phenotype showed that DS fetuses had notably less neurons than controls but a similar number of astrocytes. The large reduction in total neuron number observed in DS fetuses is attributable both to the reduced proliferation rate and reduced differentiation of new born cells into neurons. The finding that DS fetuses had a similar number of astrocytes as controls can be accounted for by the fact that in DS fetuses a larger fraction of cells differentiates into astrocytes.
CONCLUDING REMARKS
In the current study we provide novel evidence for hypocellularity in all structures forming the fetal hippocampal region and demonstrate that this defect is caused by neurogenesis disruption. Although hypocellularity in the DS brain was previously documented in several studies, it was not known whether this defect was caused by a neurodegenerative processes or to decreased neuron production. With our investigations we demonstrate for the first time that in DS subjects neurogenesis is severely impaired during early phases of brain development. The ensemble of current and previous (10) data suggests that neurogenesis impairment may be a generalized feature of the DS brain and underlie the widespread brain hypotrophy that characterizes DS subjects starting from infancy. We also found enhanced apoptotic cell death, suggesting that this may be an additional cause of brain hypotrophy. Thus, disruption of two fundamental processes underlying brain building appears to be a crucial determinant of microencephaly and mental retardation in DS. This knowledge is of obvious importance because it might open the way to future studies aimed at identifying the molecular mechanisms of altered neuron production. Once these mechanisms are clarified, it would be possible to seek therapeutic strategies aimed at ameliorating this defect.
ACKNOWLEGDMENTS
This work was supported by grant FIRB‐RBAU01BS5L from Italian Ministry for University and Research to E.C. and by a grant from the CARISBO Foundation, Bologna, Italy to R.B.
REFERENCES
- 1. Arnold SE, Trojanowski JQ (1996) Human fetal hippocampal development: I. Cytoarchitecture, myeloarchitecture, and neuronal morphologic features. J Comp Neurol 367:274–292. [DOI] [PubMed] [Google Scholar]
- 2. Aylward EH, Habbak R, Warren AC, Pulsifer MB, Barta PE, Jerram M, Pearlson GD (1997) Cerebellar volume in adults with Down syndrome. Arch Neurol 54:209–212. [DOI] [PubMed] [Google Scholar]
- 3. Aylward EH, Li Q, Honeycutt NA, Warren AC, Pulsifer MB, Barta PE et al (1999) MRI volumes of the hippocampus and amygdala in adults with Down's syndrome with and without dementia. Am J Psychiatry 156:564–568. [DOI] [PubMed] [Google Scholar]
- 4. Bahn S, Mimmack M, Ryan M, Caldwell MA, Jauniaux E, Starkey M et al (2002) Neuronal target genes of the neuron‐restrictive silencer factor in neurospheres derived from fetuses with Down's syndrome: a gene expression study. Lancet 359:310–315. [DOI] [PubMed] [Google Scholar]
- 5. Becker L, Mito T, Takashima S, Onodera K (1991) Growth and development of the brain in Down syndrome. Prog Clin Biol Res 373:133–152. [PubMed] [Google Scholar]
- 6. Campbell K (2005) Cortical neuron specification: it has its time and place. Neuron 46:373–376. [DOI] [PubMed] [Google Scholar]
- 7. Carlesimo GA, Marotta L, Vicari S (1997) Long‐term memory in mental retardation: evidence for a specific impairment in subjects with Down's syndrome. Neuropsychologia 35:71–79. [DOI] [PubMed] [Google Scholar]
- 8. Chan WY, Lorke DE, Tiu SC, Yew DT (2002) Proliferation and apoptosis in the developing human neocortex. Anat Rec 267:261–276. [DOI] [PubMed] [Google Scholar]
- 9. Clark S, Schwalbe J, Stasko MR, Yarowsky PJ, Costa AC (2006) Fluoxetine rescues deficient neurogenesis in hippocampus of the Ts65Dn mouse model for Down syndrome. Exp Neurol 200:256–261. [DOI] [PubMed] [Google Scholar]
- 10. Contestabile A, Fila T, Ceccarelli C, Bonasoni P, Bonapace L, Santini D et al (2007) Cell cycle alteration and decreased cell proliferation in the hippocampal dentate gyrus and in the neocortical germinal matrix of fetuses with Down syndrome and in Ts65Dn mice. Hippocampus 17:665–678. [DOI] [PubMed] [Google Scholar]
- 11. Davisson MT, Schmidt C, Reeves RH, Irving NG, Akeson EC, Harris BS, Bronson RT (1993) Segmental trisomy as a mouse model for Down syndrome. Prog Clin Biol Res 384:117–133. [PubMed] [Google Scholar]
- 12. De La Monte SM, Hedley‐Whyte ET (1990) Small cerebral hemispheres in adults with Down's syndrome: contributions of developmental arrest and lesions of Alzheimer's disease. J Neuropathol Exp Neurol 49:509–520. [DOI] [PubMed] [Google Scholar]
- 13. Engidawork E, Balic N, Juranville JF, Fountoulakis M, Dierssen M, Lubec G (2001) Unaltered expression of Fas (CD95/APO‐1), caspase‐3, Bcl‐2 and annexins in brains of fetal Down syndrome: evidence against increased apoptosis. J Neural Transm Suppl 149–162. [DOI] [PubMed] [Google Scholar]
- 14. Fuentes JJ, Genesca L, Kingsbury TJ, Cunningham KW, Perez‐Riba M, Estivill X, De La Luna S (2000) DSCR1, overexpressed in Down syndrome, is an inhibitor of calcineurin‐mediated signaling pathways. Hum Mol Genet 9:1681–1690. [DOI] [PubMed] [Google Scholar]
- 15. Golden JA, Hyman BT (1994) Development of the superior temporal neocortex is anomalous in trisomy 21. J Neuropathol Exp Neurol 53:513–520. [DOI] [PubMed] [Google Scholar]
- 16. Gray H (2004) Gray's Anatomy: The Anatomical Basis of Medicine and Surgery, 39th edn, 1600 pages. Churchill‐Livingstone: Oxford. [Google Scholar]
- 17. Gundersen H, Jensen E (1987) The efficiency of systematic sampling in stereology and its prediction. J Microsc 147:229–263. [DOI] [PubMed] [Google Scholar]
- 18. Hansen PE, Ballesteros MC, Soila K, Garcia L, Howard JM (1993) MR imaging of the developing human brain. Part 1. Prenatal development. Radiographics 13:21–36. [DOI] [PubMed] [Google Scholar]
- 19. Haydar TF, Nowakowski RS, Yarowsky PJ, Krueger BK (2000) Role of founder cell deficit and delayed neuronogenesis in microencephaly of the trisomy 16 mouse. J Neurosci 20:4156–4164. [DOI] [PMC free article] [PubMed] [Google Scholar]
- 20. Hayes A, Batshaw ML (1993) Down syndrome. Pediatr Clin North Am 40:523–535. [DOI] [PubMed] [Google Scholar]
- 21. Helguera P, Pelsman A, Pigino G, Wolvetang E, Head E, Busciglio J (2005) ets‐2 promotes the activation of a mitochondrial death pathway in Down's syndrome neurons. J Neurosci 25:2295–2303. [DOI] [PMC free article] [PubMed] [Google Scholar]
- 22. Humphrey T (1967) The development of the human hippocampal fissure. J Anat 101:655–676. [PMC free article] [PubMed] [Google Scholar]
- 23. Jernigan TL, Bellugi U, Sowell E, Doherty S, Hesselink JR (1993) Cerebral morphologic distinctions between Williams and Down syndromes. Arch Neurol 50:186–191. [DOI] [PubMed] [Google Scholar]
- 24. Kier EL, Kim JH, Fulbright RK, Bronen RA (1997) Embryology of the human fetal hippocampus: MR imaging, anatomy, and histology. AJNR Am J Neuroradiol 18:525–532. [PMC free article] [PubMed] [Google Scholar]
- 25. King MA, Scotty N, Klein RL, Meyer EM (2002) Particle detection, number estimation, and feature measurement in gene transfer studies: optical fractionator stereology integrated with digital image processing and analysis. Methods 28:293–299. [DOI] [PubMed] [Google Scholar]
- 26. Lawinger P, Venugopal R, Guo ZS, Immaneni A, Sengupta D, Lu W et al (2000) The neuronal repressor REST/NRSF is an essential regulator in medulloblastoma cells. Nat Med 6:826–831. [DOI] [PubMed] [Google Scholar]
- 27. Lorenzi HA, Reeves RH (2006) Hippocampal hypocellularity in the Ts65Dn mouse originates early in development. Brain Res 1104:153–159. [DOI] [PubMed] [Google Scholar]
- 28. Meng X, Shi J, Peng B, Zou X, Zhang C (2006) Effect of mouse Sim2 gene on the cell cycle of PC12 cells. Cell Biol Int 30:349–353. [DOI] [PubMed] [Google Scholar]
- 29. Meyer G (2001) Human neocortical development: the importance of embryonic and early fetal events. Neuroscientist 7:303–314. [DOI] [PubMed] [Google Scholar]
- 30. Mito T, Becker LE (1993) Developmental changes of S‐100 protein and glial fibrillary acidic protein in the brain in Down syndrome. Exp Neurol 120:170–176. [DOI] [PubMed] [Google Scholar]
- 31. O'Rahilly R, Müller F (1999) The Embryonic Human Brain—An Atlas of Developmental Stages. Editore Wiley‐Liss: New York. [Google Scholar]
- 32. Petit TL, LeBoutillier JC, Alfano DP, Becker LE (1984) Synaptic development in the human fetus: a morphometric analysis of normal and Down's syndrome neocortex. Exp Neurol 83:13–23. [DOI] [PubMed] [Google Scholar]
- 33. Pinter JD, Eliez S, Schmitt JE, Capone GT, Reiss AL (2001) Neuroanatomy of Down's syndrome: a high‐resolution MRI study. Am J Psychiatry 158:1659–1665. [DOI] [PubMed] [Google Scholar]
- 34. Roizen NJ, Patterson D (2003) Down's syndrome. Lancet 361:1281–1289. [DOI] [PubMed] [Google Scholar]
- 35. Roper RJ, Baxter LL, Saran NG, Klinedinst DK, Beachy PA, Reeves RH (2006) Defective cerebellar response to mitogenic Hedgehog signaling in Down syndrome mice. Proc Natl Acad Sci USA 103:1452–1456. [DOI] [PMC free article] [PubMed] [Google Scholar]
- 36. Rose DS, Maddox PH, Brown DC (1994) Which proliferation markers for routine immunohistology? A comparison of five antibodies. J Clin Pathol 47:1010–1014. [DOI] [PMC free article] [PubMed] [Google Scholar]
- 37. Ross MH, Galaburda AM, Kemper TL (1984) Down's syndrome: is there a decreased population of neurons? Neurology 34:909–916. [DOI] [PubMed] [Google Scholar]
- 38. Rotmensch S, Goldstein I, Liberati M, Shalev J, Ben‐Rafael Z, Copel JA (1997) Fetal transcerebellar diameter in Down syndrome. Obstet Gynecol 89:534–537. [DOI] [PubMed] [Google Scholar]
- 39. Rueda N, Mostany R, Pazos A, Florez J, Martinez‐Cue C (2005) Cell proliferation is reduced in the dentate gyrus of aged but not young Ts65Dn mice, a model of Down syndrome. Neurosci Lett 380:197–201. [DOI] [PubMed] [Google Scholar]
- 40. Sarnat HB, Nochlin D, Born DE (1998) Neuronal nuclear antigen (NeuN): a marker of neuronal maturation in early human fetal nervous system. Brain Dev 20:88–94. [DOI] [PubMed] [Google Scholar]
- 41. Schmidt‐Sidor B, Wisniewski KE, Shepard TH, Sersen EA (1990) Brain growth in Down syndrome subjects 15 to 22 weeks of gestational age and birth to 60 months. Clin Neuropathol 9:181–190. [PubMed] [Google Scholar]
- 42. Schulz E, Scholz B (1992) Neurohistological findings in the parietal cortex of children with chromosome aberrations. J Hirnforsch 33:37–62. [PubMed] [Google Scholar]
- 43. Seidl R, Bidmon B, Bajo M, Yoo PC, Cairns N, LaCasse EC, Lubec G (2001) Evidence for apoptosis in the fetal Down syndrome brain. J Child Neurol 16:438–442. [DOI] [PubMed] [Google Scholar]
- 44. Seress L, Abraham H, Tornoczky T, Kosztolanyi G (2001) Cell formation in the human hippocampal formation from mid‐gestation to the late postnatal period. Neuroscience 105:831–843. [DOI] [PubMed] [Google Scholar]
- 45. Sylvester PE (1983) The hippocampus in Down's syndrome. J Ment Defic Res 27:227–236. [DOI] [PubMed] [Google Scholar]
- 46. Takashima S, Becker LE, Armstrong DL, Chan F (1981) Abnormal neuronal development in the visual cortex of the human fetus and infant with down's syndrome. A quantitative and qualitative Golgi study. Brain Res 225:1–21. [DOI] [PubMed] [Google Scholar]
- 47. Takashima S, Iida K, Mito T, Arima M (1994) Dendritic and histochemical development and ageing in patients with Down's syndrome. J Intellect Disabil Res 38:265–273. [DOI] [PubMed] [Google Scholar]
- 48. Teipel SJ, Schapiro MB, Alexander GE, Krasuski JS, Horwitz B, Hoehne C et al (2003) Relation of corpus callosum and hippocampal size to age in nondemented adults with Down's syndrome. Am J Psychiatry 160:1870–1878. [DOI] [PubMed] [Google Scholar]
- 49. Van Hoesen GW, Augustinack JC, Dierking J, Redman SJ, Thangavel R (2000) The parahippocampal gyrus in Alzheimer's disease. Clinical and preclinical neuroanatomical correlates. Ann N Y Acad Sci 911:254–274. [DOI] [PubMed] [Google Scholar]
- 50. Vicari S, Bellucci S, Carlesimo GA (2000) Implicit and explicit memory: a functional dissociation in persons with Down syndrome. Neuropsychologia 38:240–251. [DOI] [PubMed] [Google Scholar]
- 51. Weitzdoerfer R, Dierssen M, Fountoulakis M, Lubec G (2001) Fetal life in Down syndrome starts with normal neuronal density but impaired dendritic spines and synaptosomal structure. J Neural Transm Suppl 59–70. [DOI] [PubMed] [Google Scholar]
- 52. West MJ, Gundersen HJ (1990) Unbiased stereological estimation of the number of neurons in the human hippocampus. J Comp Neurol 296:1–22. [DOI] [PubMed] [Google Scholar]
- 53. Winter TC, Ostrovsky AA, Komarniski CA, Uhrich SB (2000) Cerebellar and frontal lobe hypoplasia in fetuses with trisomy 21: usefulness as combined US markers. Radiology 214:533–538. [DOI] [PubMed] [Google Scholar]
- 54. Wisniewski KE (1990) Down syndrome children often have brain with maturation delay, retardation of growth, and cortical dysgenesis. Am J Med Genet Suppl 7:274–281. [DOI] [PubMed] [Google Scholar]
- 55. Wisniewski KE, Schmidt‐Sidor B (1989) Postnatal delay of myelin formation in brains from Down syndrome infants and children. Clin Neuropathol 8:55–62. [PubMed] [Google Scholar]