

Abstract
Neuronal cell death after brain ischemia may be regulated by activation of cyclin‐dependent kinase 5 (Cdk5). In this study, expression of Cdk5 and its activator p35/p25 was examined in human post‐mortem stroke tissue and in human cerebral cortical fetal neurons and human brain microvascular endothelial cells exposed to oxygen‐glucose deficiency and reperfusion. The majority of patients demonstrated increased expression of Cdk5 and p‐Cdk5 in stroke‐affected tissue, with about a third showing increased p35 and p25 cleaved fragment as determined by Western blotting. An increase in Cdk5‐, p‐Cdk5‐ and p35‐positive neurons and microvessels occurred in stroke‐affected regions of patients. Staining of neurons became irregular and clumped in the cytoplasm, and nuclear translocation occurred, with colocalization of p35 and Cdk5. Association of Cdk5 with nuclear damage was demonstrated by coexpression of nuclear Cdk5 in TUNEL‐positive neurons and microvessels in peri‐infarcted regions. In vitro studies showed up‐regulation and/or nuclear translocation of Cdk5, p‐Cdk5 and p35 in neurons and endothelial cells subjected to oxygen‐glucose deficiency, and strong staining was associated with propidium iodide positive nuclei, an indicator of cellular damage. These results provide new evidence for a role of Cdk5 in the events associated with response to ischemic injury in humans.
INTRODUCTION
Controlled reperfusion and re‐establishment of the local microcirculation, together with reduction in both immediate and delayed neuronal apoptosis, after stroke, could improve neuronal survival and organization, and ultimately patient recovery (28, 29).
Cyclin‐dependent kinase 5 (Cdk5) is the 35‐kDa catalytic subunit of a neuronal cell division cycle 2‐like protein kinase involved in the regulation of the dynamic neurocytoskeletal changes seen in the brain after ischemia (16). Cdk5 is activated via binding to its regulatory subunits p35 and p39 and their subsequent cleavage to the more stable fragments p25 and p29, respectively, by calpain (21).
Cdk5 is critical for the normal function of the brain and is involved in corticogenesis during development (1, 31). Cdk5 has been implicated in neuronal apoptosis in neurodegenerative diseases, including Alzheimer’s disease and amyotrophic lateral sclerosis (11), and its role in both brain development and disease, as well as in mediation of neuronal death and survival, has been reviewed by a number of authors (3, 5). Cdk5 activation modulates a plethora of signaling pathways involved in neuronal migration and synaptic transmission, and Love (17) has suggested that apoptotic or necrotic death of neurons after brain ischemia may be associated with Cdk activation.
Increased Cdk5 activity occurred in rat brain after global ischemia (9), while strong Cdk5 and p35 immunoreactivity was detected in neurons after middle cerebral artery occlusion (MCAO) in the rat (10). Increased expression of p25 occurred after focal MCAO in a rat model of stroke, while pharmacological inhibition of Cdk5 activation with indolinone D significantly reduced the infarct volume after 24 h compared with nontreated rats (34).
Cdk5 is also involved in modulation of cell growth and survival in non‐neural cells. Angiostatin inhibited cell growth in association with Cdk5 down‐regulation, while Cdk5 inhibition increased the number of apoptotic cells, suggesting a role for Cdk5 in vascular endothelial cell (EC) growth and survival (25). Here we aimed to identify in detail the expression and localization of Cdk5 in the human brain during the acute phase of ischemic stroke.
METHODS
Patient samples.
Brain tissue samples were obtained from 15 patients who died from acute ischemic stroke, with the approval of the local Ethics Committee. All patients were admitted with large middle cerebral artery strokes. The patients, 13 male and 5 female, were aged between 51 and 86 years and survived between 2 and 37 days following ischemic stroke. Age‐matched control brain samples were also obtained from two males (died from cardiac sudden death/traffic accident) and one female (died from acute pneumonia) who had no evidence of brain disease or cerebral infarction.
Routine blood parameters were determined on admission. Full clinical examinations were carried out on admission and, where possible, at l, 7, 14 and 30 days after stroke. Clinical examination was scored according to the 58‐point Scandinavian Stroke Scale (23). All patients were evaluated by CT or MRI and classified as having a large infarct (diameter >4 cm), a moderate infarct (>1.5 cm < diameter <4 cm) or a small infarct (diameter <1.5 cm) (Table 1).
Table 1.
Clinical details of patients used in the study.
| Patient no. | Age/ sex | Survival after stroke | SSS on admission | SSS final | Hypercholesterolemia * | Obesity † | Hypertension ‡ | Coronary disease | Atrial fibrillation | History of TIA | Smoking |
|---|---|---|---|---|---|---|---|---|---|---|---|
| 1 | 86/M | 2 | 0 | 0 | Yes | No | Yes | Yes | No | No | No |
| 2 | 84/M | 3 | 18 | 0 | No | No | Yes | Yes | No | No | Yes |
| 3 | 68/M | 3 | 6 | 0 | Yes | No | Yes | Yes | No | No | No |
| 4 | 71/M | 5 | 20 | 0 | No | No | Yes | Yes | Yes | No | No |
| 5 | 85/F | 5 | 8 | 0 | No | Yes | Yes | Yes | No | No | No |
| 6 | 84/M | 6 | 10 | 0 | No | No | Yes | Yes | No | No | No |
| 7 | 84/M | 9 | 56 | 0 | Yes | No | Yes | Yes | No | No | Yes |
| 8 | 51/M | 14 | 4 | 0 | No | No | Yes | No | No | Yes | No |
| 9 | 86/M | 15 | 40 | 0 | Yes | No | Yes | Yes | No | No | No |
| 10 | 58/M | 17 | 22 | 2 | Yes | No | Yes | Yes | No | No | Yes |
| 11 | 74/M | 20 | 34 | 0 | No | No | Yes | Yes | No | No | No |
| 12 | 73/M | 26 | 35 | 0 | Yes | Yes | Yes | Yes | No | No | No |
| 13 | 84/F | 29 | 34 | 0 | Yes | No | Yes | Yes | No | No | No |
| 14 | 60/F | 34 | 16 | 16 | Yes | No | Yes | Yes | No | No | Yes |
| 15 | 69/F | 37 | 30 | 0 | No | Yes | No | Yes | No | No | No |
Serum cholesterol levels greater than 5.0 mmol/L.
Body mass index greater than 30 kg/m2.
Blood pressure greater than 140/90 mm Hg.
M = male; F = female; SSS = Scandinavian Stroke Scale; TIA = transient ischemic attack.
Tissue was collected from grey and white matter of infarct and peri‐infarcted zones, and controls were obtained from the contalateral hemisphere within 6 h of death. The peri‐infarcted areas were defined as the area of tissue immediately surrounding the infarct which showed evidence of tissue disorganization confirmed by histology. Sections from each piece of cut tissue were stained with 2‐, 3‐ and 5‐triphenyltetrazolium, which stains active mitochondria pink; therefore, unstained areas represented stroke‐affected cortical regions (data not included). Tissue was frozen in liquid nitrogen, kept at −70°C, and a sample of each was processed and stained with hematoxylin and eosin to determine tissue morphology (6).
In vitro oxygen‐glucose deprivation (OGD) model.
Human brain microvascular endothelial cells (HBMEC) were obtained from TCS CellWorks (Buckingham, UK) and cultured according to the manufacturer’s instructions. Human fetal (cerebral cortical) neurons (HFN) were extracted, purified and cultured with permission from the local ethics committee. Brain tissue from fetal specimens of 14–19 weeks gestational age, legally aborted, were, after written consent from donors, collected in cold preservation medium. Cells were isolated and cultured as previously described (4).
For OGD experiments, the culture medium was replaced by glucose‐free medium containing 2% fetal bovine serum and cells were placed at 37°C into a humidified chamber perfused with 94% N2, 1% O2 and 5% CO2 for 8 h (HBMEC) or with 95% N2 and 5% CO2 for 14 h (HFN), followed by 24‐h reperfusion in fresh medium containing 4.5 g/L glucose (resulting in approximately 30% of cells undergoing apoptosis after OGD and 60% following reoxygenation, as determined from our pilot studies). Cell pellets were stored at −80°C. Cells cultured in normoxic conditions without glucose deprivation served as control. In some experiments, propidium iodide (10 µg/mL) was added to the cultures 1 h before the end of the experiment to stain dead and dying cells (4). Experiments were carried out three times.
RNA isolation.
RNA extraction was performed using standard Clontech procedures (BD Biosciences, Hertfordshire, UK). RNA quality was measured using a spectrophotometer.
Reverse transcription‐polymerase chain reaction (RT‐PCR).
Gene expression of normal cultures as well as those exposed to OGD and reperfusion was examined by semiquantitative RT‐PCR. PCR conditions were an initial denaturation step of 10 minutes at 95°C, followed by 35 cycles of 1 minute at 94°C, 1 minute at 60°C and 1 minute at 72°C, and a final extension step of 10 minutes at 72°C. The products were visualized by agarose gel electrophoresis. Samples without cDNA were used as negative controls. Primers designed by Primer3 Output Program (Version 0.2) (Whitehead Institute for Biomedical Research, MIT, MA, USA) were as follows: glyceraldehyde‐3‐phosphate dehydrogenase (GAPDH) (forward: 5′‐ATG ATC TTG AGG CTG TTG‐3′—reverse: 5′‐CTC AGA CAC CAT GGG GAA‐3′); Cdk5 (forward: 5′‐GCA CCT ATG GAA CTG TGT TCA AGG CTA‐3′—reverse: 5′‐CTT CAC AAT CTC AGG GTC CAG GTC ACC‐3′) and p35 (forward: 5′‐AAG AAC GCC AAG GAC AAG CC‐3′—reverse: 5′‐TTG ATG ACA GAG AGG CAA CG‐3′).
All experiments were carried out twice and at 20, 30 and 40 cycles to ensure the semiquantitative nature of the results. Scion Imaging Software was used for analysis (http://www.scioncorp.com).
Western blotting.
Briefly, tissue samples (50 mg) were lysed and protein separation carried out using sodium dodecyl sulfate‐polyacrylamide gel electrophoresis as described previously (27). Blots were stained overnight at 4°C with antibodies to Cdk5 (1:500), p‐Cdk5 (Ser 159; 1:1000), p35 (1:200) (Autogen Bioclear, Wiltshire, UK) and α‐actin (Sigma, Dorset, UK) (1:1000) used as a loading control. Protein concentration was estimated from the band intensity by densitometry. Results are semiquantitative and are given as a numerical (fold) change compared with the control (contralateral tissue), which was given an arbitrary value of 1.0. All experiments were performed twice and a representative example is shown.
Immu histochemistry.
The Avidin‐Biotin‐Peroxidase method (ABC Vectastain kit, Vector Laboratories, Peterborough, UK) was used for the qualitative demonstration of antigens in tissues. Antibodies to Cdk5, p‐Cdk5 and p35 were used at 1:50 dilution. Deparaffinized 5‐µm sections were treated for 10 minutes in a boiling solution of concentrated citric acid (pH 6.0; Vector Laboratories) in a pressure cooker to unmask the antigens. Sections were stained with primary antibodies for 2 h at room temperature (RT), with the appropriate horseradish peroxidase‐conjugated secondary antibody for 1 h at RT, and then counterstained with hematoxylin. Negative control slides had the primary antibody replaced with phosphate buffer saline (PBS) or the appropriate IgG preimmune serum. Matching control peptides were also used to absorb the Cdk5 and p35 antibodies to check for nonspecific binding (data not included). Cultured cells were fixed with 4% paraformaldehyde for 20 minutes, permeabilized with 0.2% Triton X100 for 8 minutes and blocked with normal serum before staining overnight at 4°C, followed by 60‐minute incubation with Alexafluor‐green conjugated dye at RT. Stained images were obtained with a confocal microscope.
Double immunofluorescence.
Following primary antibody staining, slides were incubated with normal serum and then with a second primary antibody (diluted in normal serum) for 30 minutes, followed by 30‐minute incubation with Alexafluor‐red conjugated dye.
Analysis of apoptosis in tissue sections.
The Promega DeadEnd Colorimetric TUNEL System was used according to the manufacturer’s instructions (Promega, Southampton, UK). Positive control sections pretreated with DNase I were stained in parallel (data not included). Negative control slides were performed, where terminal deoxynucleotidyl transferase enzyme was replaced with PBS and processed as above (data not included).
RESULTS
Cdk5, p35/p25 and p‐Cdk5 protein levels were up‐regulated in human brain tissue
Cdk5 expression.
Western blotting showed that Cdk5 was up‐regulated by 1.5‐ to 3.4‐fold in gray matter peri‐infarcted tissue in 10 out of 15 patients and by 1.5‐ to 3.6 fold in gray matter infarct in nine out of 15 patients. In white matter, Cdk5 was up‐regulated by 1.5‐ to 2.2‐fold in peri‐infarcted tissue in 11 out of 15 patients and by 1.5‐ to 3.2 fold in infarcted regions in 10 out of 15 patients (Figure 1Ai and ii—Table 2).
Figure 1.

Expression of cyclin‐dependent kinase 5 (Cdk5) was increased in stroked brain tissue. A. Western blots showing increased expression of Cdk5 from two patients who survived for 2 (patient 1) and 9 days (patient 7), respectively, after acute ischemic stroke. B. (i) Weak regular intracellular staining of Cdk5 in normal‐looking neurons, but no observable staining in blood vessels from the contralateral hemisphere (arrows and broken arrow, respectively). (ii and iii) Increased expression and intracellular clumping of Cdk5 (arrow) and nuclear translocation (broken arrows) in peri‐infarcted brain tissue (patient 2; 3 days survival). C. (i) Negative staining of normal blood vessels in the contralateral hemisphere, but strong staining in peri‐infarcted vessels (patient 2; 3 days survival) (ii and iii). D. Cdk5 clustering (brown) in TUNEL‐positive (blue) peri‐infarcted neurons (i and insert), and microvessels (ii; patient 2; 3 days survival). All images ×400. E. Weak staining of Cdk5 in neurons (arrows) and blood vessels (broken arrow) from gray matter of a patient who died without evidence of stroke or other brain disease.
Table 2.
Expression of cyclin‐dependent kinase 5 (Cdk5), p‐Cdk5 and p35 in stroke patients demonstrated by Western blotting. Numbers show fold increase (control = 1.0): PI is peri‐infarcted and I is infarcted region; ND = not detected.
| Patient no. | Survival (days) | Cdk5 | p35 | p‐Cdk5 | p25 | ||||||||||||
|---|---|---|---|---|---|---|---|---|---|---|---|---|---|---|---|---|---|
| Gray | White | Gray | White | Gray | White | Gray | White | ||||||||||
| PI | I | PI | I | PI | I | PI | I | PI | I | PI | I | PI | I | PI | I | ||
| 1 | 2 | 2.8 | 3.1 | 0.3 | 2.2 | 4.2 | 3.4 | 2.3 | 3.3 | 0.4 | 0.4 | 1.0 | 1.0 | ND | ND | 1.8 | ND |
| 2 | 3 | 3.4 | 3.6 | 1.5 | 0.3 | 2.6 | 2.5 | 1.5 | 0.5 | 0.5 | 0.5 | 0.5 | 0.5 | 2.2 | 2.2 | 2.3 | ND |
| 3 | 3 | 1.5 | 1.6 | 1.5 | 3.7 | 1.0 | 1.0 | 1.0 | 1.0 | 4.2 | 4.3 | 3.0 | 2.6 | 1.9 | 2.0 | 1.9 | 2.0 |
| 4 | 5 | 0.3 | 1.5 | 1.5 | 1.7 | 1.0 | 1.0 | 1.0 | 1.5 | 2.3 | 2.1 | 2.6 | 2.5 | ND | ND | 1.8 | 1.8 |
| 5 | 5 | 1.5 | 0.5 | 2.3 | 1.0 | 1.0 | 1.0 | 1.0 | 1.0 | 1.0 | 2.4 | 1.0 | 1.0 | ND | ND | ND | ND |
| 6 | 6 | 0.4 | 1.5 | 2.7 | 2.5 | 1.0 | 0.3 | 1.0 | 1.0 | 1.5 | 3.1 | 1.0 | 2.8 | ND | ND | ND | ND |
| 7 | 9 | 1.5 | 2.8 | 0.5 | 1.0 | 1.0 | 0.3 | 1.0 | 1.0 | 1.0 | 1.7 | 1.0 | 3.6 | ND | ND | ND | ND |
| 8 | 14 | 0.5 | 0.5 | 0.5 | 0.5 | 1.0 | 1.0 | 1.0 | 1.0 | 1.0 | 1.0 | 1.5 | 2.9 | ND | 1.7 | ND | ND |
| 9 | 15 | 1.0 | 1.0 | 1.5 | 1.5 | 0.4 | 1.0 | 1.0 | 1.0 | 2.5 | 2.4 | 2.6 | 2.9 | ND | ND | 0.5 | 0.5 |
| 10 | 17 | 2.4 | 3.0 | 1.7 | 2.7 | 2.2 | 1.0 | 1.0 | 1.0 | 1.0 | 3.8 | 1.0 | 1.0 | ND | ND | ND | ND |
| 11 | 20 | 1.0 | 1.0 | 2.3 | 1.6 | 1.0 | 2.5 | 1.0 | 2.2 | 1.0 | 1.0 | 1.0 | 1.0 | ND | 1.7 | 1.8 | 1.8 |
| 12 | 26 | 2.3 | 0.3 | 1.5 | 1.5 | 1.0 | 0.3 | 1.0 | 1.0 | 1.0 | 2.4 | 1.0 | 3.9 | ND | ND | 1.8 | ND |
| 13 | 29 | 2.8 | 1.0 | 0.2 | 0.3 | 2.5 | 1.5 | 1.0 | 1.0 | 1.0 | 2.8 | 1.0 | 2.5 | ND | ND | ND | ND |
| 14 | 34 | 2.3 | 2.3 | 1.5 | 1.5 | 1.5 | 1.0 | 1.0 | 1.0 | 1.0 | 1.0 | 0.4 | 0.4 | 1.5 | 1.5 | ND | ND |
| 15 | 37 | 2.3 | 2.3 | 1.5 | 1.5 | 2.5 | 1.0 | 1.6 | 3.3 | 1.0 | 1.0 | 1.0 | 1.0 | ND | ND | ND | ND |
| No. of patients | Increased | 10 | 9 | 11 | 10 | 6 | 4 | 3 | 4 | 4 | 9 | 4 | 8 | 3 | 5 | 6 | 3 |
| Decreased | 3 | 3 | 4 | 3 | 1 | 3 | 0 | 3 | 2 | 2 | 2 | 2 | 0 | 0 | 1 | 1 | |
| No change | 2 | 3 | 0 | 2 | 8 | 8 | 12 | 8 | 9 | 4 | 9 | 5 | 0 | 0 | 0 | 0 | |
| Not detected | 0 | 0 | 0 | 0 | 0 | 0 | 0 | 0 | 0 | 0 | 0 | 0 | 11 | 9 | 8 | 11 | |
In contralateral gray matter, neurons showed a regular expression of Cdk5 with cytoplasmic and axonal staining, while blood vessels were not stained in either the gray or white matter (Figure 1Bi and Ci, respectively, Table 3). A similar pattern was observed in control brain tissue (Figure 1E). In gray matter peri‐infarcted and infarcted regions, nuclear staining and intracellular clustering of Cdk5 occurred in neurons, while numerous microvessels demonstrated strong positive staining. These changes were most apparent in patients who survived for 2 to 14 days after stroke (Figure 1Bii and iii and Cii and iii, respectively). In white matter, some microvessels were also Cdk5‐positive. Increased Cdk5 staining remained in microvessels and abnormal‐looking neurons from gray matter peri‐infarcted tissue in patients surviving up to 29 days after stroke. Colocalization of Cdk5 with TUNEL‐positive neurons and microvessels was demonstrated (Figure 1Di and ii, respectively).
Table 3.
Semiquantitative analysis of immunohistochemical data for cyclin‐dependent kinase 5 (Cdk5), p35 and p‐Cdk5 expression in human brain tissue. −, no staining; +, some staining; ++, strong staining; +++, very strong staining; EC = endothelial cell.
| Patient no. | Cdk5 | p35 | p‐Cdk5 | ||||||
|---|---|---|---|---|---|---|---|---|---|
| Neurons | Glia | EC | Neurons | Glia | EC | Neurons | Glia | EC | |
| Contralateral hemisphere | Weak 1/2 + (cytoplasmic) | − | 1/2 + | Weak 1/2 + (cytoplasmic) | − | − | Weak 1/2 + (cytoplasmic) | Weak 1/2 + | − |
| 2 (3‐day survival) | +++ (nuclear) | ++ | ++ | +++ (nuclear) | + | + | +++ (nuclear) | +++ | + |
| 4 (5‐day survival) | +++ (nuclear) | +++ | ++ | ++ (nuclear) | ++ | +++ | + | ++ | ++ |
| 5 (6‐day survival) | +++ (nuclear) | ++ | ++ | ++ (nuclear) | ++ | +++ | ++ (nuclear) | ++ | +++ |
| 6 (6‐day survival) | ++ | + | ++ | +++ | ++ | ++ | ++ | + | + |
| 9 (15‐day survival) | ++ | ++ | ++ | +++ | ++ | ++ | ++ | + | ++ |
| 12 (26‐day survival) | +++ (nuclear) | ++ | +++ | ++ | ++ | + | +++ | ++ | + |
| 14 (34‐day survival) | + | − | + | + | + | + | − | − | − |
| 15 (37‐day survival) | +++ (cytoplasmic) | + | ++ | + | + | + | + | + | +++ |
p‐Cdk5 expression.
Western blotting showed that p‐Cdk5 was up‐regulated in four out of 15 patients (1.5‐ to 4.2‐fold) in peri‐infarcted gray matter, and in nine out of 15 patients (1.5‐ to 4.3‐fold) in infarcted tissue. In white matter, p‐Cdk5 was up‐regulated in the peri‐infarcted tissue of four out of 15 patients (1.5‐ to 3.0‐fold) and 1.5‐ to 3.9‐fold in infarcted tissue in eight out of 15 patients (1.5‐ to 3.8‐fold; Figure 2A—Table 2). Cdk5 phosphorylation occurred mostly near to the infarcted core. p‐Cdk5 was not expressed in normal‐looking neurons and microvessels from the contalateral hemisphere (Figure 2Bi and Ci, respectively), nor in control brain tissue (Figure 2D). p‐Cdk5 was up‐regulated in stroke‐affected neurons, with observable clumping and nuclear translocation, and in microvessels in patients who survived from 3 to 37 days after stroke (Figure 2Bii and Cii, respectively, Table 3).
Figure 2.

p‐Cyclin‐dependent kinase 5 (p‐Cdk5) staining was observed in neurons and microvessels in peri‐infarcted tissue. A. Western blot showing increased expression of p‐Cdk5 in peri‐infarcted and infracted regions, from a patient who survived for 6 days (patient 6) after acute ischemic stroke. B. Normal‐looking neurons from the contralateral hemisphere showed no observable staining of p‐Cdk5 (i, arrow), while both intracellular (arrow) and nuclear (broken arrow) staining was observed in those from peri‐infarcted areas (ii; patient 5; 6 days survival). C. Similarly, normal‐looking blood vessels from the contralateral hemisphere were not observably stained (i); however, microvessels from peri‐infarcted regions were strongly p‐Cdk5‐positive (ii; patient 6; 6 days survival). All images ×400. D. Weak cytoplasmic staining of p‐Cdk5 in neurons (arrows) and blood vessels (broken arrow) from gray matter of a patient who died without evidence of stroke or other brain disease. PI = peri‐infarcted; I = infarcted; C = control.
p35 expression.
In gray matter, p35 was up‐regulated in peri‐infarcted tissue regions in six out of 15 patients (1.5‐ to 4.2‐fold) and in infarcted areas in four of 15 patients (1.5‐ to 3.4‐fold). In white matter, p35 was up‐regulated in peri‐infarcted tissue in three out of 15 patients (1.5‐ to 1.8‐fold) and, in infarcted zones in four out of 15 patients (1.5–3.3 fold; Figure 3A—Table 2). p25 was not observed in tissue from the contalateral hemisphere, but was observed in five out of 15 patients in either peri‐infarcted or infarcted tissue.
Figure 3.

p35 was translocated to the nucleus of neurons and overexpressed in microvessels from stroke‐affected regions. A. Western blot showing increased expression of p35 in peri‐infarcted and infarcted regions, from a patient who survived for 5 days (patient 4) after acute ischemic stroke. B. Normal looking neurons from the contralateral hemisphere showed no observable staining of p35 (i, arrow showing hematoxylin positive nucleus), while nuclear staining (arrow) was observed in those from peri‐infarcted areas (ii; patient 1; 2 days survival). C. Similarly, normal looking blood vessels from the contralateral hemisphere were not observably stained (i), however microvessels from peri‐infarcted regions were strongly p35 positive (ii; patient 1; 2 days survival). All images ×400. D. Weak staining of p35 in the cytoplasm of neurons (arrow) and blood vessels (broken arrow) from gray matter of a patient who died without evidence of stroke or other brain disease. PI = peri‐infarcted; I = infarcted; C = control.
Normal‐looking neurons from the contralateral hemisphere showed weak intracellular staining for p35 while blood vessels were unstained (Figure 3Bi and Ci, respectively). A similar staining pattern was observed in control brain tissue (Figure 3D). p35 was translocated to the nucleus of neurons and was strongly expressed in microvessels in stroke‐affected regions in patients who survived from 3–6 days after stroke (Figure 3Bii and Cii, respectively, Table 3). Increased p35 staining remained up to 26 days after stroke in peri‐infarcted tissue.
Double immunofluorescence showed coexpression of Cdk5 and p35 in neuronal nuclei and microvessels from peri‐infarcted regions (Figure 4Ai–iii and Bi–iii respectively).
Figure 4.

Double fluorescent labeling showed colocalization of p35 and cyclin‐dependent kinase 5 (Cdk5) in stroke‐affected tissue. A. Nuclear colocalization in a neuron from the peri‐infarcted region (patient 1; 2 days survival; arrows) (i) p35 (green), (ii) Cdk5 (red), (iii) overlaid images (×400). Identification of neurons was by light microscopy of hematoxylin‐stained slides (data not shown). B. Increased expression of (i) p35 (green) and (ii) Cdk5 (red) and (iii) overlaid images of an infarcted blood vessel (patient 1; 2 days survival; ×400).
Cdk5 was increased in Propidium Iodide (PI)‐positive HFN following OGD.
RT‐PCR showed up‐regulation of Cdk5 in HFN exposed to OGD (12 h), which diminished during reperfusion compared with untreated cells (Figure 4A). Up‐regulation of hypoxia‐inducible factor‐1‐α and heat shock protein 72 were used as controls to monitor the effects of OGD (data not included). Western blotting showed that Cdk5 protein expression was increased in OGD‐treated HFN (2.5‐fold; Figure 4B), while immunohistochemistry (IHC) demonstrated notable increase in the intensity of staining in the soma, and coexpression in cells positively stained for propidium iodide (Figure 5Ci–iii). Much stronger Cdk5 staining was seen in propidium iodide‐positive cells, suggesting an association with cellular damage.
Figure 5.

Cyclin‐dependent kinase 5 (Cdk5) expression was increased in human fetal (cerebral cortical) neurons (HFN) exposed to oxygen‐glucose deprivation (OGD). A. Reverse transcription‐polymerase chain reaction and B. Western blotting showing Cdk5 up‐regulation in HFN exposed to OGD and/or reperfusion. 1: control, 2: OGD 14 h, 3: OGD 14 h and reperfusion 24 h. C. Immunohistochemistry Cdk5 staining of cultured human fetal (cerebral cortical) neuron (HFN). (i) Weak perinuclear staining for Cdk5 in normal untreated HFN. (ii) Shows dramatically increased intensity of Cdk5 staining following OGD. (iii) Nuclear coexpression of Cdk5 and propidium iodide after OGD. (Photographs ×250, inserts ×500). GAPDH = glyceraldehyde‐3‐phosphate dehydrogenase.
p35 gene expression was increased in HFN exposed to OGD for 12 h and remained increased during reperfusion (Figure 6A). Protein expression was increased as measured by Western blotting, although p25 was not observed (Figure 6B) and strong staining, particularly in the nuclei of cells exposed to OGD, was seen (Figure 6Ci and ii). Again, p35 staining was strongest in, and overlapped with, propidium iodide‐positive cells (Figure 6Ciii).
Figure 6.

p35 expression was also increased in human fetal (cerebral cortical) neurons (HFN) exposed to oxygen‐glucose deprivation (OGD). A. Reverse transcription‐polymerase chain reaction and B. Western blotting showing p35 up‐regulation in HFN exposed to OGD and/or reperfusion. 1: control, 2: OGD 14 h, 3: OGD 14 h and reperfusion 24 h. C. Immunohistochemistry p35 staining of cultured HFN. (i) Weak intracellular staining for Cdk5 in normal untreated HFN. (ii) Shows increased intensity of p35 staining following OGD. (iii) Nuclear co‐expression of p35 and propidium iodide after OGD. (Photographs ×250, inserts ×500). GAPDH = glyceraldehyde‐3‐phosphate dehydrogenase.
p‐Cdk5 was notably expressed in HFN cultured under normal conditions, as identified by Western blotting. IHC revealed its presence in distinct intracellular/cytoplasmic localizations. Although Western blotting failed to demonstrate an increase in expression in HFN exposed to OGD (14 h; Figure 7A), IHC showed that expression became spread throughout the nuclei and intracellular domain (Figure 7Bi and iii). Damaged propidium iodide‐positive HFN stained strongly for p‐Cdk5 and showed colocalization, suggesting a link to cellular damage (Figure 7Biii). Colocalization of p‐Cdk5 and p35 also occurred in the nuclei of OGD‐treated cells (data not shown).
Figure 7.

Increased intracellular p‐cyclin‐dependent kinase 5 (p‐Cdk5) expression was seen in damaged human fetal (cerebral cortical) neurons (HFN) exposed to oxygen‐glucose deprivation (OGD). A. Western blotting showing p‐Cdk5 expression before and after OGD/reperfusion. 1: control, 2: OGD 14 h, 3: OGD 14 h and reperfusion 24 h. B. (i) Perinuclear staining of p‐Cdk5 was seen in normal untreated HFN. (ii) Shows spreading of p‐Cdk5 throughout intracellular regions and in the nucleus following OGD. (iii) Nuclear coexpression of p‐Cdk5 and propidium iodide after OGD. (Photographs ×250, inserts ×500).
Cdk5 up‐regulation was associated with cellular damage in HBMEC following OGD.
RT‐PCR showed up‐regulation of Cdk5 and p35 mRNA in HBMEC exposed to OGD and reperfusion compared with untreated cells (Figures 8A and B and 9A and B, respectively). Up‐regulation of hypoxia‐inducible factor‐1‐α and heat shock protein 72 were used as controls to monitor the effects of OGD (data not included). Similarly, Cdk5 and p35 protein levels were increased after OGD (8, 9, respectively).
Figure 8.
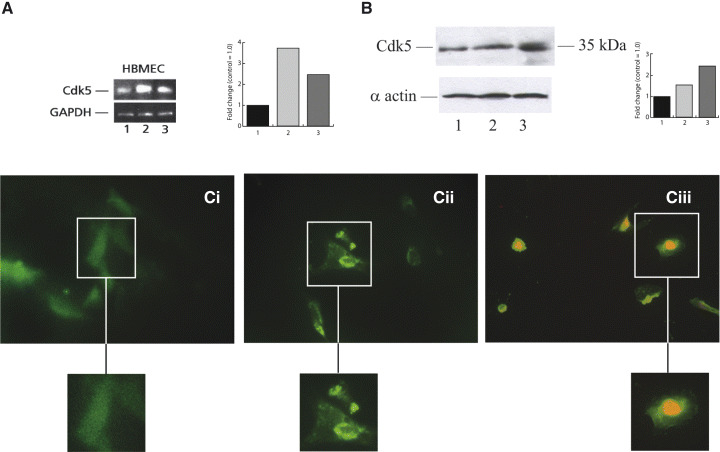
Cyclin‐dependent kinase 5 (Cdk5) expression was increased in human brain microvascular endothelial cell (HBMEC) exposed to oxygen‐glucose deprivation (OGD). A. Reverse transcription‐polymerase chain reaction and B. Western blotting showing Cdk5 up‐regulation in HBMEC exposed to OGD and/or reperfusion. 1: control, 2: OGD 12 h, 3: OGD 12 h and reperfusion 24 h. C. Immunohistochemistry Cdk5 staining of cultured HBMEC. (i) Weak diffused staining for Cdk5 in untreated cells. (ii) Shows nuclear translocation of Cdk5 following OGD. (iii) Shows nuclear coexpression of Cdk5 and propidium iodide after OGD. (Photographs ×250, inserts ×500). GAPDH = glyceraldehyde‐3‐phosphate dehydrogenase.
Figure 9.

p35 expression was also increased in human brain microvascular endothelial cell (HBMEC) exposed to oxygen‐glucose deprivation (OGD). A. Reverse transcription‐polymerase chain reaction and B. Western blotting showing p35 up‐regulation in HBMEC exposed to OGD and/or reperfusion. 1: control, 2: OGD 14 h, 3: OGD 14 h and reperfusion 24 h. C. Immunohistochemistry p35 staining of cultured HFN. (i) Diffuse staining for Cdk5 in normal untreated HFN. (ii) Shows nuclear translocation of p35 following OGD. (iii) Shows nuclear expression of p35 with propidium iodide counterstain after OGD. (Photographs ×250, inserts ×500). GAPDH = glyceraldehyde‐3‐phosphate dehydrogenase.
Increased nuclear staining of Cdk5, p35 and p‐Cdk5 occurred in HBMEC treated with OGD (8, 9, 10, respectively).
Figure 10.

Nuclear translocation of p‐cyclin‐dependent kinase 5 (p‐Cdk5) expression was seen in human brain microvascular endothelial cell (HBMEC) exposed to oxygen‐glucose deprivation. A. (i) Weak intracellular staining of p‐Cdk5 was seen in normal untreated HBMEC. (ii) Shows increased intensity of p‐Cdk5 staining following OGD. (iii) Nuclear expression of p‐Cdk5 with propidium iodide counterstain after OGD. (Photographs ×250, inserts ×500.)
DISCUSSION
This study has identified increased Cdk5/p35/p25 up‐regulation and Cdk5 phosphorylation in stroke‐affected tissue from patients in the acute phase of ischemic stroke. Intensely positively stained neurons, with evidence of nuclear translocation, occurred in stroke‐affected regions of patients who survived for up to 1 month after stroke. Colocalization of Cdk5 with TUNEL‐positive neurons provided evidence of involvement of Cdk5 in cell death pathways. Because of the limited numbers of patients examined, it was not possible to determine the statistical correlation between expression levels of Cdk5/p35 and patient survival. Also, the Western blotting data are only semiquantitative. It is also worth noting that during tissue dissection, individual pieces of tissue possessed variable areas of tissue damage, ranging from severe to less severe, with occasional normal‐looking segments. This is inevitable irrespective of the expertise of the neurologist. Western blotting results therefore are merely an indicator of changes in protein expression within broad areas of damaged tissue, which might explain the fact that some patient samples showed only a weak up‐regulation or none at all, while the more sensitive IHC enabled us to define the specific areas in more detail and of course to identify cell‐specific changes.
Cdk5 may have a role in the events associated with neuronal response to ischemic injury, because increased Cdk5 tau protein phosphorylating activity was seen in the rat postdecapitative model of brain ischemia (5). Hayashi et al, (10) demonstrated increased Cdk5 and p35 immunoreactivity and nuclear translocation in peri‐infarcted tissue, in neurons following MCAO in a rat model of stroke, in agreement with our unpublished data using a rat model of MCAO. Using the same model, Osuga et al (20) reduced the infarct volume by intracerebroventricular infusion of the pan‐Cdk5 inhibitor flavopiridol, indicating a protective effect of Cdk5 down‐regulation. Ischemic brains of rats showed increased expression of p25, 3 h after temporary MCAO followed by 6 h of reperfusion (18), or 2 h after transient MCAO (33).
HFN exposed to OGD and reperfusion also showed phosphorylation and nuclear translocation of Cdk5, particularly in propidium iodide‐positive nuclei, indicating cell damage. Previous in vitro studies showed that inhibition of Cdk5 activity using indolinone A and D protected the mitochondrial integrity of lesioned rat cortical neurons and reduced caspase activation. Interestingly, Cdk5 may modulate the N‐methyl‐d‐aspartate receptors as their direct phosphorylation by Cdk5 resulted in ischemic injury in rat CA1 pyramidal neurons following forebrain ischemia (32). Weishaupt et al (33, 34) showed that Cdk5 activated neuronal cell death pathways upstream of mitochondrial dysfunction, while Zheng et al showed that inhibitory activity against Cdk5 conferred neuroprotection, potentially promoting functional long‐term rescue of injured neurons (35). During glutamate‐induced excitotoxic cell death of murine neurons, both p25 and Cdk5 localized to the nuclei and were involved in mediation of cell death pathways, although not apoptosis. Cytoplasmic Cdk5 contributed to survival signaling, demonstrating that both the localization of Cdk5 and type of stimulation could affect the cell fate (19). Rashidan et al recently demonstrated that Cdk5 was important in mediation of excitotoxic damage in murine cerebellar granule neurons induced by glutamate; however, Cdk5 mutants did not protect against hypoxia/ischemia, rather, other Cdk such as Cdk4 appeared to participate in these delayed death pathways (22). Nuclear translocation and phosphorylation of Cdk5 also resulted in neurotoxin‐induced cerebellar granular neuronal apoptosis (30), suggesting that up‐regulation, activation and nuclear translocation of Cdk5 via p35/p25 are important features of the ischemic response in stroke and may be a key mediator of neuronal cell death. Phosphorylation of Cdk5 at either Ser159 and/or Tyr15, together with its association with p35, is a requirement for its efficient activation (26, 36). Tyrosine phosphorylation of Cdk5 was first reported by Lazaro et al in 1996 (15) in rat cerebellar lysates, and more recently, was shown to be important in mediation of axonal lengthening of developing neurons following activation by cables and c‐Abl (36), while Ser159 p‐Cdk5 appears to be the main target for Cdk5 phosphorylating kinases and is known to be activated via casein kinase I in PC12 cells (26). In our studies, Tyr15 p‐Cdk5 was not notably altered, while Ser159 p‐Cdk5 was increased in some patients after stroke, but more importantly, its nuclear translocation occurred both in vivo and in vitro. As we found that Cdk5, p‐Cdk5 and p35/25 were translocated to the nucleus in the acute phase of human stroke, and that this shift in localization occurred even in patients where the total amount of protein remained similar to the control areas, this may be an important indicator determining which cells ultimately die and which are subjected to Cdk5 cytoplasmic prosurvival signaling.
Collateral revascularization and reperfusion of potentially viable tissue in part determines patient recovery after stroke (29). Angiogenesis correlates with patient survival, and survival of neurons is greatest in areas of tissue undergoing angiogenesis (12, 13). Following MCAO in a rat model, new blood vessels initiated through vascular buds formed regular connections with intact microvessels within 1 week of ischemia, the patterns being similar to those seen in the normal brain. Apoptosis occurred within damaged EC in the “penumbra”, which resulted in collapsed lumina and a lack of reflow (14, 24). In this study, we have shown for the first time that Cdk5 may have a role in the microvessel/EC response to ischemic stroke.
Chen et al (2) isolated a novel gene IC53 from human aorta cDNA library, which had structural similarity to the Cdk5 binding protein precursor C53, and mediated proliferation of ECV304 cells. Inhibition of Cdk5 by olomoucine accelerated wound healing in corneal epithelium of organ cultured transgenic mice overexpressing Cdk5 and increased expression of activated c‐Src along the wound edge (7, 8). High levels of Cdk5 expression were associated with FGF‐2‐induced proliferation in bovine aortic EC (25).
Here, an increase in Cdk5 staining was demonstrated in microvessels from stroke‐affected regions of patients who survived up to 1 month after stroke. Cdk5‐stained microvessels also colocalized with TUNEL‐positive cells, suggesting that Cdk5 up‐regulation in ischemia‐affected EC may be associated with cell death pathways. This suggests a previously undiscovered role for Cdk5 in the inhibition of angiogenesis/revascularization within peri‐infarcted regions after stroke. Further studies should examine the role of Cdk5/p35/25 in modulating EC survival and angiogenesis, in detail, and identify the cell signaling pathways both in vitro and in vivo.
REFERENCES
- 1. Chae T, Kwon YT, Bronson R, Dikkes E, Li E, Tsai LH (1997) Mice lacking p35, a neuronal specific activator of Cdk5, display cortical lamination defects, seizures, and adult lethality. Neuron 18:29–42. [DOI] [PubMed] [Google Scholar]
- 2. Chen J, Liu B, Liu Y, Han Y, Zhang Y, Lu L, Zhen Y, Hui R (2002) A novel gene IC53 stimulates ECV304 cell proliferation and is up‐regulated in failing heart. Biochem Biophys Res Commun 294:161–166. [DOI] [PubMed] [Google Scholar]
- 3. Cheung ZH, Ip NY (2004) Cdk5: mediator of neuronal death and survival. Neurosci Lett 361:47–51. [DOI] [PubMed] [Google Scholar]
- 4. Cristofol RM, Gasso S, Vilchez D, Pertusa M, Rodriguez‐Farre E, Sanfeliu C (2004) Neurotoxic effects of trimethyltin and triethyltin on human fetal neuron and astrocyte cultures: a comparative study with rat neuronal cultures and human cell lines. Toxicol Lett 152:35–46. [DOI] [PubMed] [Google Scholar]
- 5. Cruz JC, Tsai LH (2004) A Jekyll and Hyde kinase: roles for Cdk5 in brain development and disease. Curr Opin Neurobiol 14:390–394. [DOI] [PubMed] [Google Scholar]
- 6. Eke A, Conger KA, Anderson M, Garcia JH (1990) Histological assessment of neurons in rat models. Stroke 21:299–304. [DOI] [PubMed] [Google Scholar]
- 7. Gao C, Negash S, Guo HT, Ledee D, Wang HS, Zelenka P (2002) CDK5 regulates cell adhesion and migration in corneal epithelial cells. Mol Cancer Res 1:12–24. [PubMed] [Google Scholar]
- 8. Gao CY, Stepp MA, Fariss R, Zelenka P (2004) CDK5 regulates activation and localization of Src during corneal epithelial wound closure. J Cell Sci 117:4089–4098. [DOI] [PubMed] [Google Scholar]
- 9. Green SL, Kulp KS, Vulliet R (1997) Cyclin‐dependent kinase 5 activity increases in rat brain following ischemia. Neurochem Int 31:617–623. [DOI] [PubMed] [Google Scholar]
- 10. Hayashi T, Warita H, Abe K, Itoyama Y (1999) Expression of cdk5 and its activator p35 in rat after middle cerebral artery occlusion. Neurosci Lett 265:37–40. [DOI] [PubMed] [Google Scholar]
- 11. Kesavapany S, Li BS, Amin A, Zheng YL, Grant P, Pant HC (2004) Neuronal cyclin‐dependent kinase 5: role in nervous system function and its specific inhibition by the CDK5 inhibitory peptide. Biochim Biophys Acta 697:143–153. [DOI] [PubMed] [Google Scholar]
- 12. Krupinski J, Kaluza J, Kumar P, Kumar S, Wang JM (1993) Prognostic value of blood vessel density in ischaemic stroke. Lancet 342:742. [DOI] [PubMed] [Google Scholar]
- 13. Krupinski J, Kaluza J, Kumar P, Kumar S, Wang JM (1994) Role of angiogenesis in patients with cerebral ischaemic stroke. Stroke 25:1794–1798. [DOI] [PubMed] [Google Scholar]
- 14. Krupinski J, Stroemer P, Slevin M, Marti E, Kumar P, Rubio F (2003) Three‐dimensional structure of newly formed blood vessels after focal cerebral ischaemia in rat. Neuroreport 14:1171–1176. [DOI] [PubMed] [Google Scholar]
- 15. Lazaro JB, Kitzmann M, Cavadore JC, Muller Y, Clos J, Fernandez A, Lamb NJC (1996) Cdk5 expression and association with p35nck5a in early stages of rat cerebellum neurogenesis; tyrosine dephosphorylation and activation in post‐mitotic neurons. Neurosci Lett 218:21–24. [DOI] [PubMed] [Google Scholar]
- 16. Lew J, Winkfein RJ, Paudel HK, Wang JH (1992) Brain praline‐directed protein kinase is a neurofilament kinase which displays high sequence homology to p34cdc2. J Biol Chem 267:25922–25926. [PubMed] [Google Scholar]
- 17. Love S (2003) Neuronal expression of cell‐cycle related proteins after brain ischemia in man. Neurosci Lett 353:29–32. [DOI] [PubMed] [Google Scholar]
- 18. Nath R, Davis M, Probert AW, Kupin NC, Ren X, Schielke GP, Wang KKW (2000) Processing of Cdk5 activator p35 to its truncated form (p25) by calpain in acutely injured neuronal cells. Biochem Biophys Res Commun 274:16–21. [DOI] [PubMed] [Google Scholar]
- 19. O’Hare MJ, Kushwaha N, Zhang Y, Aleyasin H, Callaghan SM, Slack RS, Albert PR, Vincent I, Park DS (2005) Differential roles of nuclear and cytoplasmic cyclin‐dependent kinase 5 in apoptotic and excitotoxic neuronal death. J Neurosci 25:8954–8966. [DOI] [PMC free article] [PubMed] [Google Scholar]
- 20. Osuga H, Osuga S, Wang F, Fetni R, Hogan MJ, Slack RS, Hakim AM, Ikeda JE, Park DS (2000) Cyclin‐dependent kinases as a therapeutic target for stroke. Proc Natl Acad Sci USA 97:10254–10259. [DOI] [PMC free article] [PubMed] [Google Scholar]
- 21. Patzke H, Tsai LH (2002) Calpain‐mediated cleavage of the cyclin‐dependent kinase‐5 activator p39 to p29. J Biol Chem 277:8054–8060. [DOI] [PubMed] [Google Scholar]
- 22. Rashidan J, Iyirhiaro G, Aleyasin H, Rios M, Vincent I, Callaghan S, Bland RJ, Slack RS, During MJ, Park DA (2005) Multiple cyclin‐dependent kinases signals are critical mediators of ischaemia/hypoxic neuronal death in vitro and in vivo. Proc Natl Acad Sci USA 102:14080–14085. [DOI] [PMC free article] [PubMed] [Google Scholar]
- 23. Scandinavian Stroke Study Group (1985) Multi‐center trial of haemodilution in ischemic stroke—background and study protocol. Stroke 16:885–890. [DOI] [PubMed] [Google Scholar]
- 24. Segura I, Serrano A, De Buitrago GG, Gonzalez MA, Abad JL, Claveria C, Gomez L, Bernad A, Martinez‐AC , Riese HH (2002) Inhibition of programmed cell death impairs in vitro vascular‐like structure formation and reduces in vivo angiogenesis. FASEB J 8:833–841. [DOI] [PubMed] [Google Scholar]
- 25. Sharma MR, Tuszynski GP, Sharma MC (2004) Angiostatin‐induced inhibition of endothelial cell proliferation/apoptosis is associated with the downregulation of cell cycle regulatory protein Cdk5. J Cell Biochem 91:398–409. [DOI] [PubMed] [Google Scholar]
- 26. Sharma P, Sharma M, Amin ND, Albers RW, Pant HC (1999) Regulation of cyclin‐dependent kinase 5 catalytic activity by phosphorylation. Proc Natl Acad Sci USA 96:11156–11160. [DOI] [PMC free article] [PubMed] [Google Scholar]
- 27. Slevin M, Kumar S, Gaffney J (2002) Angiogenic oligosaccharides of hyaluronan induce multiple signalling pathways affecting vascular endothelial cell mitogenic and wound healing responses. J Biol Chem 277:41046–41059. [DOI] [PubMed] [Google Scholar]
- 28. Slevin M, Krupinski J, Kumar P, Gaffney J, Kumar S (2005) Gene activation and protein expression following ischaemic stroke: strategies towards neuroprotection. J Cell Mol Med 9:85–102. [DOI] [PMC free article] [PubMed] [Google Scholar]
- 29. Slevin M, Gaffney J, Kumar P, Kumar S, Krupinski J (2006) Can angiogenesis be exploited to improve stroke outcome? Mechanisms and therapeutic potential. Clin Chem 111:171–183. [DOI] [PubMed] [Google Scholar]
- 30. Tang X, Wang X, Gong X, Tong M, Park D, Xia Z, Mao Z (2005) Cyclin‐dependent kinase 5 mediates neurotoxin‐induced degradation of the transcription factor myocyte enhancer factor 2. J Neurosci 25:4823–4834. [DOI] [PMC free article] [PubMed] [Google Scholar]
- 31. Tsai LH, Takahashi T, Caviness VS Jr, Harlow E (1993) Activity and expression pattern of cyclin‐dependent kinase 5 in the embryonic mouse nervous system. Development 119:1029–1040. [DOI] [PubMed] [Google Scholar]
- 32. Wang J, Liu SH, Fu YP, Wang JH, Lu YM (2003) Cdk5 activation induces hippocampal CA1 cell death by directly phosphorylating NMDA receptors. Nat Neurosci 6:1039–1047. [DOI] [PubMed] [Google Scholar]
- 33. Weishaupt JH, Kussmaul L, Grotsch P, Heckel A, Rohde G, Romig H, Bahr M, Gillardon F (2003) Inhibition of Cdk5 is protective in necrotic and apoptotic paradigms of neuronal cell death and prevents mitochondrial dysfunction. Mol Cell Neurosci 24:489–502. [DOI] [PubMed] [Google Scholar]
- 34. Weishaupt JH, Neusch C, Bahr M (2003) Cyclin‐dependent kinase (CDK5) and neuronal cell death. Cell Tissue Res 312:1–8. [DOI] [PubMed] [Google Scholar]
- 35. Zheng YL, Kesavapany S, Gravell M, Hamilton RS, Schubert M, Amin N, Albers W, Grant P, Pant HC (2005) A CDK5 inhibitory peptide reduces tau hyperphosphorylation and apoptosis in neurons. EMBO J 24:209–220. [DOI] [PMC free article] [PubMed] [Google Scholar]
- 36. Zukerberg LR, Patrick GN, Nikolic M, Humbert S, Wu CL, Lanier LM, Gertler FB, Vidal M, Van Etten RA, Tsai LH (2000) Cables links Cdk5 and c‐Abl and facilitates Cdk5 tyrosine phosphorylation, kinase upregulation and neurite outgrowth. Neuron 26:633–646. [DOI] [PubMed] [Google Scholar]