Abstract
Utrophin (Utrn) is the autosomal homolog of dystrophin, the Duchene Muscular Dystrophy (DMD) locus product and of therapeutic interest, as its overexpression can compensate dystrophin's absence. Utrn is transcribed by Utrn‐A and ‐B promoters with mRNAs differing at their 5′ ends. However, previous central nervous system (CNS) studies used C‐terminal antibodies recognizing both isoforms. As this distinction may impact upregulation strategies, we generated Utrn‐A and ‐B promoter‐specific antibodies, Taqman Polymerase chain reaction (PCR)‐based absolute copy number assays, and luciferase‐reporter constructs to study CNS of normal and dystrophic mdx mice. Differential expression of Utrn‐A and ‐B was noted in microdissected and capillary‐enriched fractions. At the protein level, Utrn‐B was predominantly expressed in vasculature and ependymal lining, whereas Utrn‐A was expressed in neurons, astrocytes, choroid plexus and pia mater. mRNA quantification demonstrated matching patterns of differential expression; however, transcription–translation mismatch was noted for Utrn‐B in caudal brain regions. Utrn‐A and Utrn‐B proteins were significantly upregulated in olfactory bulb and cerebellum of mdx brain. Differential promoter activity, mRNA and protein expressions were studied in cultured C2C12, bEnd3, neurons and astrocytes. Promoter activity ranking for Utrn‐A and ‐B was neurons > astrocytes > C2C12 > bEnd3 and bEnd3 > astrocytes > neurons > C2C12, respectively. Our results identify promoter usage patterns for therapeutic targeting and define promoter‐specific differential distribution of Utrn isoforms in normal and dystrophic CNS.
Keywords: central nervous system, DMD, dystrophin, mdx mice, utrophin‐A and ‐B promoters
INTRODUCTION
Duchene Muscular Dystrophy (DMD) is a fatal, genetic disease caused by mutations in the DMD gene leading to dystrophin deficiency 21, 30. Dystrophin is expressed in skeletal muscles at the sarcolemma and at lower levels in the central nervous system (CNS) (32) and is to bind the actin cytoskeleton to the plasma membrane 5, 11. While muscle wasting is prominent, the CNS is also affected in DMD, and one‐third of patients suffer from mental retardation (6). Dystrophin and its autosomal homolog utrophin (Utrn) associate with a complex of proteins and glycoproteins to form the dystrophin‐associated protein complex (DAPC), which effectively forms transmembrane links between the extracellular matrix and the cytoskeleton 5, 11. The NH2‐ and COOH‐termini of Utrn and dystrophin share considerable amino acid sequence homology with actin‐ and dystroglycan‐binding domains (51). Loss of dystrophin, together with consequential abnormality of the DAPC, gives rise to a complex syndrome of progressive skeletal and cardiac myopathy and mental retardation. Although the genetic defect underlying DMD was identified nearly 20 years ago, there is still no cure for this debilitating neuromuscular disease.
A number of therapeutic approaches are being pursued for treating DMD 23, 53. These include strategies attempting to replace the missing dystrophin by gene therapy, cell‐based therapies and indirect strategies by upregulating its homologue, Utrn 24, 34. Unlike dystrophin, Utrn is ubiquitously expressed in neuronal and non‐neuronal tissues 18, 24, 26, 27, 28, 33, 47. Utrn transcription is driven from two independent promoters, Utrn‐A (10) and Utrn‐B (4), resulting in two distinct full‐length mRNAs differing at their initial 5′ ends. The major Utrn isoform in muscle, Utrn‐A, is expressed primarily at the neuromuscular junction (NMJ), whereas Utrn‐B is localized to vascular endothelium (54). Utrn upregulation by transgenic, viral or Utrn‐A promoter activation by pharmacological means has been demonstrated to alleviate the dystrophic pathology in muscles of a dystrophin‐deficient mdx mouse model of DMD 31, 50, 52.
While Utrn expression in muscle has been studied in great detail, Utrn expression in the CNS has received less attention. Utrn is expressed in neurons, astrocytes and vascular endothelial cells 17, 19, 26, 28, 54. Previously, we and others defined the subcellular distribution of Utrn in brain using a C‐terminal antibody that recognized both isoforms 26, 28, 54; however, distinct patterns of Utrn‐A and ‐B expression have yet to be defined and are required to understand the roles played by Utrn isoforms in CNS. To address this question, we developed Utrn‐A and Utrn‐B promoter‐specific reagents and report here differential expression pattern of Utrn‐A and Utrn‐B transcripts, proteins, and endogenous promoter activity in the CNS of normal and mdx mice.
MATERIALS AND METHODS
Cloning of mouse Utrn‐A and Utrn‐B promoter–luciferase reporter constructs
Mouse Utrn‐A (NCBI accession no. X95524) and Utrn‐B (NCBI accession no. AJ250045) promoters were Polymerase chain reaction (PCR) amplified using mouse genomic DNA as template with Utrn‐A (Utrn‐aF, 5′ccaagcttaagcccgtaaactcccaacaag3′ and Utrn‐aR, 5′ccaagcttgcaggaatgacccgaaagaaaag3′) and Utrn‐B (Utrn‐bF: 5′ccaagcttaaagaagccagacccaacgc3′ and Utrn‐bR, 5′ccaagcttgctgctcatcacctacagtggc3′)‐specific primer sets (Figure 1A–C). Amplified products were cloned in to TOPO TA vector (PCR2.1® TOPO vector®, Invitrogen, Carlsbad, CA, USA). After sequence verification, the promoter fragments were excised by HindIII and cloned into a pGL3 basic vector (Promega, Madison, WI, USA) to obtain mUtrn‐A‐luc and mUtrn‐B‐luc.
Figure 1.
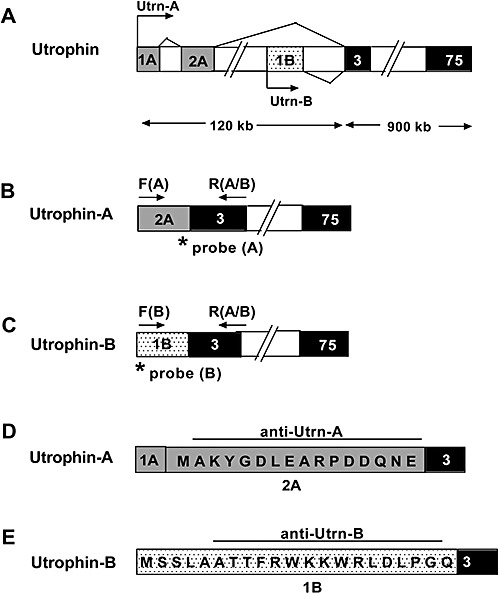
Schematic representation of the mouse utrophin gene with unique regions of Utrn‐A and Utrn‐B promoters. A. Alternative utrophin transcripts, including exons 1A and 2A of Utrn‐A, transcribed from the upstream region of the Utrn‐A promoter (light shaded rectangles) and exon 1B (dotted rectangles) of Utrn‐B, transcribed from the downstream region of the Utrn‐B promoter. The unique translated exon of Utrn‐A is 2A, and for the Utrn‐B promoter, exon 1B (exon 1A of Utrn‐A promoter is untranslated). Transcription start sites for Utrn‐A and Utrn‐B transcripts are marked by arrows. Exons 3–75 (darkly shaded rectangles) are common for both Utrn‐A and ‐B, and introns are indicated by empty boxes. B. Schematic of Utrn‐A‐specific primer locations for qPCR (Polymerase chain reaction) assays. Exon 2A (light shaded rectangles) sequence was used to design forward primer F(A) (arrow) and specific TaqMan‐FAM probe (asterisk) to quantify Utrn‐A transcripts. C. Schematic of Utrn‐B‐specific locations for qPCR assays. Exon 1B (dotted rectangles) sequence was used to design the forward primer F[B]; arrow) and specific TaqMan‐FAM probe (asterisk). A common reverse primer was designed using sequences from exon 3 R(A/B) flanking arrows in B and C to quantify both Utrn‐A and ‐B transcripts from total RNA of normal and mdx mouse tissues. D,E. Amino acid sequences of peptides used to generate specific rabbit anti‐Utrn‐A (from exon 2A) and anti‐Utrn‐B (from exon 1B) polyclonal antibodies.
Transfection of mUtrn‐A‐luc and mUtrn‐B‐luc promoter and luciferase assay
Mouse Utrn‐A and Utrn‐B constructs that were cloned into the pGL3 basic vector were used to transfect C2C12, bEnd.3, primary astrocyte and neurons using Lipofectamine2000 (Invitrogen). The pRL‐TK (Promega) construct was used as a control for efficiency of transfection. After 6 h of transfection, cells were harvested and dual‐luciferase activity was quantified using the dual‐luciferase assay system (Promega).
Utrn‐A and ‐B TaqMan‐based absolute qPCR and copy number calculation
Unique mRNAs of Utrn‐A and Utrn‐B promoter‐encoded transcripts (Figure 1A–C) were amplified using forward primers specific for Utrn‐A (5′gcgtgcagtggaccatttttcagattta3′) and Utrn‐B (5′cgctgcagcagccaccacatttcgttg3′) and a common reverse primer (R[A/B]5′gcgtgcagatcgagcgtttatccatttg3′). Amplified fragments were cloned using TOPO vector (PCR2.1® TOPO vector®, Invitrogen), and positive clones were sequence verified. A TaqMan qPCR‐based copy number assay was developed to study the mRNA expression pattern of Utrn‐A and Utrn‐B in normal and dystrophin‐deficient tissues. TaqMan assays (Applied Biosystem, Foster City, CA) were carried out using forward primer specific for Utrn‐A (F[A] 5′acgaattcagtgacatcattaagtcc3′; Figure 1B) and Utrn‐B (F[B] 5′caggcttgcaggagatccc3′; Figure 1C) and a common reverse primer (R(A/B) 5′atccatttggtaaaggttttcttctg3′) for both reactions. FAM and nonfluorescent quencher‐conjugated TaqMan probes specific for Utrn‐A (FAM‐atcattgtgttcatcagatc) and Utrn‐B (FAM‐catcattgtgttcatcggg) were synthesized and added to the reaction mix. The cDNA corresponding to 25 ng of total RNA was amplified in 20 µl of reaction mixture containing 1 pmole of forward and reverse primers each, 10 µL of 2× TaqMan® Universal PCR Master Mix (Applied Biosystems) and 0.25 µM probes. The amplification was performed in a 7900HT Sequence Detection System (ABI, Applied Biosystems Inc, Foster City, Ca, USA). A serial dilution of linearized plasmid DNA was used to generate standard curves for detecting Utrn‐A and ‐B mRNA copy numbers. The copy number or grams/mole was calculated from the total size of the vector and inserts. A detailed description for calculating the Utrn‐A and Utrn‐B copy number is given in the Supporting Information.
Production and affinity purification of Utrn‐A and ‐B antibodies
Polyclonal antibodies for Utrn‐A and ‐B were generated by immunizing New Zealand white rabbits with synthetic peptides specific for Utrn‐A (MAKYGDLEARPDDGQNEC) and Utrn‐B (CSSLAATTFRWKKWRLDLPGQ) coupled to keyhole lymphocyte hemocyanine (Figure 1D,E). Prior to injection, preimmune serum was collected from each animal to be used as negative control. Immune titers were verified by ELISA before, during and after the immunization procedure. The antiserum was affinity purified using a chromatography column that was prepared by cross‐linking antigenic peptide to CNBr‐activated Sepharose™ 4B (Pierce, Rockford, IL, USA) according to the manufacture's instruction. Briefly, matrix was equilibrated in phosphate‐buffered saline (PBS) (pH 7.4) and incubated with 0.45 µm filtered antiserum for 5 min with rocking. The matrix was washed three times with 10 volume of PBS; the antibody was eluted with 100 mM glycine (pH 2.5) and neutralized with Tris‐HCl (pH 9.5). Antibody fractions were pooled, concentrated and dialyzed in PBS (ProSci Inc., Poway, CA, USA). Specificity of both affinity purified antibodies was validated using western blots (Supporting Figure S1A,B).
Animal and tissue preparation
Adult normal (C57BL/10ScSn) and mdx(C57BL/10ScSn‐Dmdmdx/J) mice aged 8–10 months obtained from the Jackson Laboratory (Jackson Laboratory, Bar Harbor, ME, USA) were used for this study. Tissues were dissected and snap frozen in liquid nitrogen for immunoblotting or for RNA extraction. For morphological and immunofluorescence studies, tissues were flash frozen in liquid nitrogen‐cooled isopentane and stored at –80oC. All animal experiments were performed according to U.S. laws and approved by the Institutional Animal Care and Use Committee at the University of Pennsylvania School of Medicine.
Isolation of brain arteries and capillaries
Brain arteries and capillaries were isolated according to a previously described protocol (25). Briefly, adult mice were euthanized, and brains were collected in sterile cold PBS. Major brain arteries were collected and snap frozen in liquid nitrogen for RNA and protein extraction. For brain capillaries, cortices were separated and homogenized in isotonic sucrose buffer (0.32 M sucrose, 3 mM HEPES, pH 7.4). Enrichment of capillaries in fractions was monitored by light microscopy (Supporting Figure S1C). Isolated capillaries were washed in Ca2+‐ and Mg2+‐free PBS and used for either RNA or protein isolation.
Neuronal and glial cultures
Neuronal and glial cell cultures were established from neonatal and prenatal mdx (C57BL/10ScSn‐Dmdmdx/J) mice, respectively, by a standard protocol described previously 13, 26, 27. Isolated cells were cultured in Ham's F12 (Invitrogen) medium supplemented with 10% fetal bovine serum (Invitrogen), 2.5% L‐glutamine and 1% Oxaloacetate‐pyruvate‐insulin (OPI) (Invitrogen) for 10 days. To enrich astrocytes, flasks were shaken for 8 h at 37°C, the supernatant was discarded, and the attached astrocytes were trypsinized and cultured for different experiments as described.
Cell culture
Mouse myoblast cells, C2C12 cells, and mouse brain‐derived endothelial cells, bEnd.3 cells, were procured from ATCC (Manassas, VA, USA). C2C12 cells were cultured in regular Dulbesco's Modified Eagle Medium (DMEM) medium supplemented with 10% fetal bovine serum (FBS) (Invitrogen), and bEnd.3 cells were cultured in DMEM‐containing 4‐mM L‐glutamate, 4500 mg glucose/L and 1500 mg sodium bicarbonate/L (ATCC) supplemented with 10% Fetal Bovine Serum (FBS) (Invitrogen).
RNA extraction and reverse transcription
Total RNA was extracted from cells, capillaries, blood vessels and various other organs with TRIzol reagent (Invitrogen) and purified using the RNeasy® kit (Qiagen, Valencia, CA, USA) following the manufacturer's instructions. Five micrograms of total RNA was reverse transcribed using random hexamers (Invitrogen) and the SuperScript™ FirstStrand enzyme (Invitrogen).
Immunoblotting
Total protein was extracted from cells and tissues with Tris‐Sodium chloride‐NP‐40‐EDTA & Cocktail (TNEC) (50 mM Tris‐HCl, pH 8.0; 150 mM NaCl; 1% NP40; 2 mM EDTA) buffer‐containing proteases inhibitor cocktail complete (Roche, Basel, Switzerland). Protein concentration was determined using the Bradford assay (Bio‐Rad, Hercules, CA, USA). For Utrn‐A and ‐B immunoblotting, 50–75 µg of total protein was resolved on a 3%–8% Tris‐acetate gradient gel (NuPage®; Invitrogen) and electrotransferred onto polyvinylidene difluoride membranes (Immobilon® P, Millipore, Billerica, MA, USA). After blocking with 5% nonfat milk in wash buffer (0.05 M Tris, 0.15 M NaCl, 0.05% Igepal CA630 and 0.1% Bovine Serum Albumin (BSA)), blots were incubated overnight in primary antibodies (Utrn‐A: 0.5 µg/mL and Utrn‐B: 0.5 µg/mL) at 4°C. Blots were washed and incubated with either goat antirabbit or antimouse Horseradish Peroxidase (HRP)‐conjugated secondary antibodies at 1:10 000 (Jackson ImmunoResearch) to detect protein bands using an enhanced chemiluminescence kit (Pierce). Membranes were reprobed with antimouse α‐tubulin (1:6000; Sigma) to confirm the equal loading.
Immunohistochemistry
Cryo‐sections (7–10 µm) or cultured cells were fixed in cold methanol for 5 min, washed in PBS and incubated with antirabbit Utrn‐A and ‐B polyclonal antibodies (0.5 µg/mL dilution) after blocking with 10% FBS in PBS. Both Utrn‐A and ‐B were co‐labeled as follows: antimouse desmin (1:1000), Fluorescein Isothiocyanate (FITC)‐conjugated lectin from Canavalia ensiformis (1:1000), antimouse S100 (1:500) (all obtained from Sigma Chemicals), mouse NeuN (1:1500, Chemicon, Temecula, CA, USA), AF‐546 conjugated α‐BTX (1:500, Molecular Probes®/Invitrogen) and antigoat CD31 (1:1000, Santa Cruz Biotechnology, CA, USA). Primary antibodies were detected using goat antirabbit IgG‐AF‐488, goat antirabbit IgG‐AF‐546, goat antimouse IgG‐AF‐488 or by goat antimouse IgG‐AF‐546 (all 1:500; Molecular Probes®). Sections were washed in PBS and mounted in Aqua‐Mount (Lerner Lab., Pittsburgh, PA, USA) and were analyzed using an Olympus BX51 microscope equipped with epifluorescence optics and a Nikon CoolPix 995 digital camera. Confocal imaging was performed using a Nikon microscope (model TE300) equipped with Radiance 2000 imaging system (Bio‐Rad Laboratories) and a Kr/Ar‐ion laser source. Images were collected by LaserSharp software (Bio‐Rad Laboratories).
Statistical Analysis
Student's t‐test was used throughout this study to calculate P‐values for determination of statistical significance unless it is mentioned separately for any particular experiments. All results are shown as the mean ± standard deviation.
RESULTS
Characterization and validation of Utrn‐A‐ and Utrn‐B‐specific antibodies
We characterized and validated the Utrn‐A‐ and Utrn‐B‐specific antibodies in normal and mdx muscles. Consistent with previous reports, in skeletal muscles, Utrn‐A was localized at NMJs, which were identified by their morphology and by using the NMJ‐specific marker α‐BTX for co‐localization (Figure 2A). Utrn‐B was localized mainly in the blood vessels, which were identified by their morphology and by using lectin antibodies for co‐localization of vessels (Figure 2B). We independently validated these observations using an endothelial cell marker, CD31, and found co‐localization of Utrn‐B with CD31 at the luminal aspect of vascular elements (Figure 2C, D). Sections incubated with preimmune serum, by flow through (buffer before eluting the antibodies from the affinity column) or antibodies that were adsorbed with corresponding antigen did not show specific immunolabeling (data not shown). These findings were consistent with previous reports (54) and suggested that the antibodies we had generated were sensitive and specific. Similarly, we also validated specificity of both Utrn‐A and Utrn‐B antibodies using western blots. Protein lysates from mdx brain capillaries were probed with preimmune sera, affinity‐purified antibodies and affinity‐purified antibodies preadsorbed with excess peptides. In all cases, bands specific for Utrn‐A and Utrn‐B proteins were visible only in blots incubated with affinity purified Utrn‐A and Utrn‐B antibodies and could be competed with excess peptide (Supporting Figure S1A, B).
Figure 2.
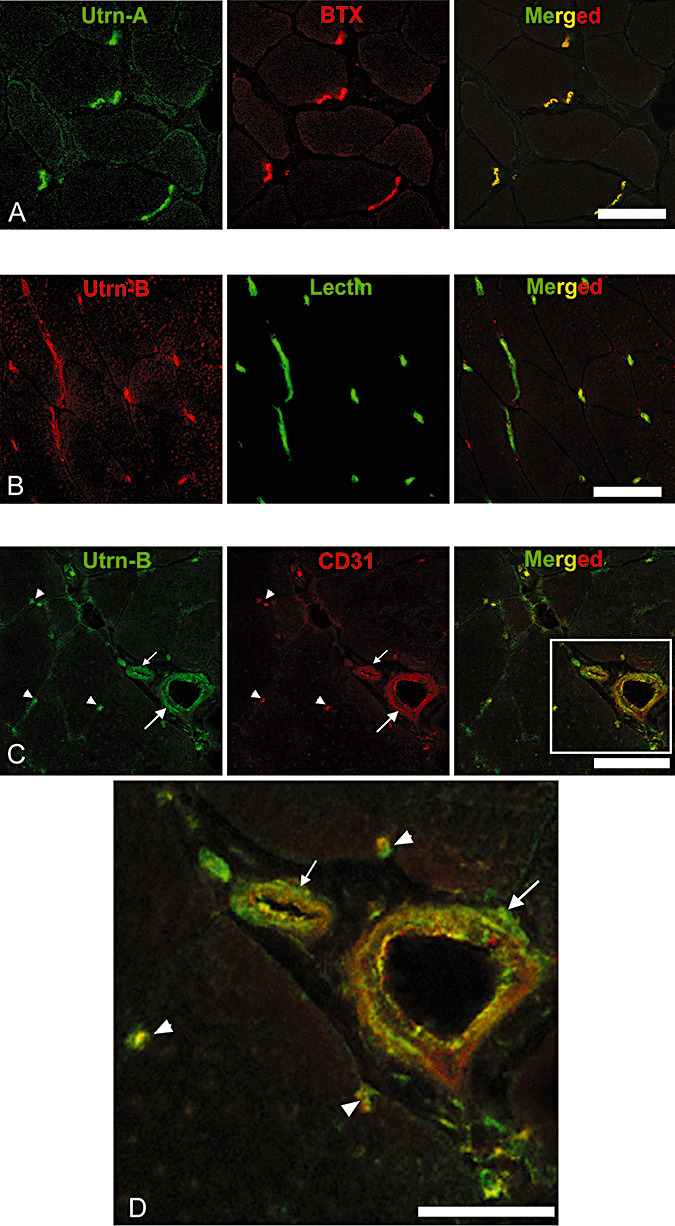
Differential expression pattern of Utrn‐A and Utrn‐B in skeletal muscle. Immunofluorescent labeling of 10‐µm thick frozen sections of mdx mouse tibilais anterior (TA) muscle with A. Utrn‐A antibody (green channel), with neuromuscular junction‐specific marker α‐bungarotoxin (BTX), red channel and co‐localization of Utrn‐A and BTX (merged image). B. Immunolabeling of mdx mouse TA with Utrn‐B antibody (red channel) and co‐labeling with vascular marker, lectin (green channel), and co‐localization of Utrn‐B and lectin labeling at vascular elements (merged image). C. Utrn‐B immunolabeling (green channel) and co‐labeling with endothelial marker CD‐31 (red channel) and co‐localization of Utrn‐B and CD‐31 at the endothelial (luminal) aspects of vascular elements (merged image). Structures marked are a muscle artery (large arrow), arteriole (small arrow) and capillaries (arrow head). D. Higher magnification of rectangular area shown in the merged image of panel C showing co‐labeling of Utrn‐B and CD‐31 along the endothelial cells of the muscular artery (large arrow), arteriole (small arrow) and in the capillaries (arrow head). Scale bar, 50 µm.
Upregulation of Utrn‐A and Utrn‐B in dystrophin‐deficient (mdx) muscles
To further characterize the antibodies, we determined the expression pattern of Utrn‐A and Utrn‐B in normal and mdx tibialis anterior (TA) and diaphragm muscles, where they have been well characterized (54). Both TA and diaphragm muscles in mdx mice showed brighter Utrn‐A immunolabeling compared with muscles from normal mice (Figure 3A, B). The expression pattern of Utrn‐A was altered in mdx mice and extended along the sarcolemmal membrane, whereas in normal mice, the immunolabeling was confined to the NMJ regions (Figure 3A, B). Utrn‐B immunolabeling was observed in vascular elements (Figure 3C, D), and appeared brighter in mdx muscles (Figure 3C, D). Sections incubated with preimmune serum (Figure 3A–D), flow through or antibodies that were preabsorbed with corresponding antigen did not show specific immunolabeling (data not shown). To validate this observation independently, we determined the expression levels of Utrn‐A and Utrn‐B in normal and mdx mice at the mRNA level (Figure 4A, B). We performed absolute qPCR and calculated the mRNA copy number for Utrn‐A and Utrn‐B to ensure the analysis was quantitative and representative of reports that had used western blot analysis. Utrn‐A and Utrn‐B mRNA copy numbers showed significant (P < 0.001) upregulation in mdx skeletal muscles compared with normal (Figure 4A, B). Additionally, both Utrn‐A and ‐B transcripts were significantly (P < 0.001) higher in mdx mice diaphragm, lungs and heart (Figure 4C, D). Western blot analysis revealed that both Utrn‐A (Figure 5A, C) and Utrn‐B (Figure 5B, D) proteins were significantly upregulated in mdx skeletal muscles compared with normal. Utrn‐A protein was significantly upregulated in mdx diaphragm and heart, but not in lungs (Figure 5E, G). Interestingly, we observed a reciprocal pattern of Utrn‐B protein expression, where upregulation of Utrn‐B protein in mdx lungs, and, to a lesser extent in the diaphragm, was seen, but not in the heart of mdx mice (Figure 5F, H).
Figure 3.
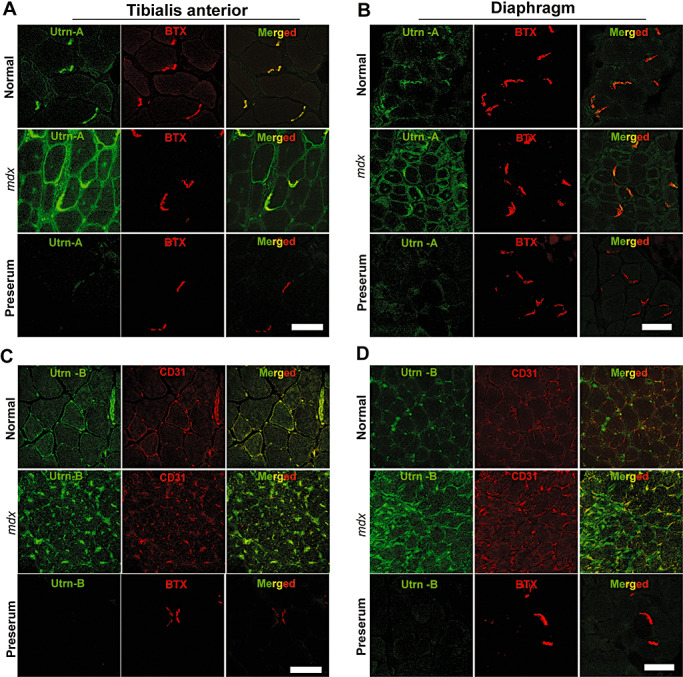
Utrn‐A and ‐B are upregulated in dystrophin‐deficient mdx muscles. Confocal immunofluorescent images from 10 µm thick frozen sections of normal and mdx mouse tibialis anterior (TA) muscle and respiratory muscle and diaphragm. Sections were immunolabeled with anti‐Utrn‐A antibody (A,B) and neuromuscular junction‐specific marker α‐BTX (red channel), and merged to reveal areas of co‐localization (merged image). Similarly, TA and diaphragm sections were immunolabeled with anti‐Utrn‐B antibody (C,D) (green channel) and endothelial marker, CD‐31 (BTX, red channel) to reveal co‐labeling. In normal TA and diaphragm muscles, Utrn‐A immunostaining was mainly confined to NMJs, whereas in mdx muscles, immunolabeling was stronger, and it extended along the periphery of the sarcolemma to overtake the missing dystrophin. In normal TA and diaphragm muscles, Utrn‐B immunolabeling was mainly localized in the vascular elements (green channel). Surprisingly, in mdx muscles, Utrn‐B immunolabeling intensity appeared stronger than in normal muscles. Merged image show Utrn‐B immunostaining mainly confined to the endothelial cells of the vascular elements. No significant labeling was noted in sections incubated with corresponding preimmune serum for Utrn‐A and Utrn‐B antibodies. Scale bar, 50 µm.
Figure 4.
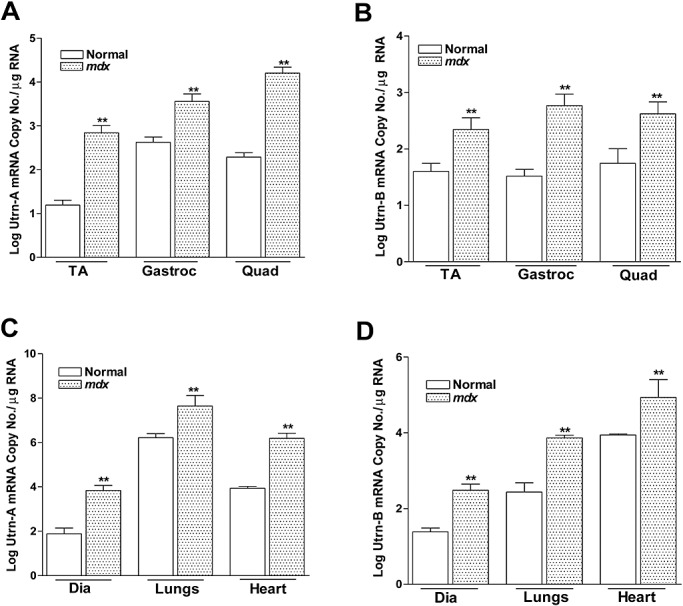
Quantitation of utrophin transcripts expression in normal and mdx mouse. Utrn‐A and Utrn‐B expression levels in normal and dystrophin‐deficient skeletal muscles (A,B), diaphragm, lungs and heart (C,D) were determined at transcriptional level by an absolute TaqMan‐based qPCR (Polymerase chain reaction) assay for steady‐state mRNA expression. A,B. Comparison of Utrn‐A and ‐B mRNA (log mRNA copy number/µg of total RNA) reveled significantly higher Utrn‐A and ‐B mRNA levels in mdx skeletal muscles (n = 6; **P < 0.001). Similarly, Utrn‐A and ‐B mRNA levels were significantly higher (n = 6; **P < 0.001) in diaphragm, lungs and heart tissues in mdx than normal mouse. Means ± standard deviation (SD) are shown. Among all tissues studied, mouse lung showed the highest level of Utrn‐A mRNA.
Figure 5.
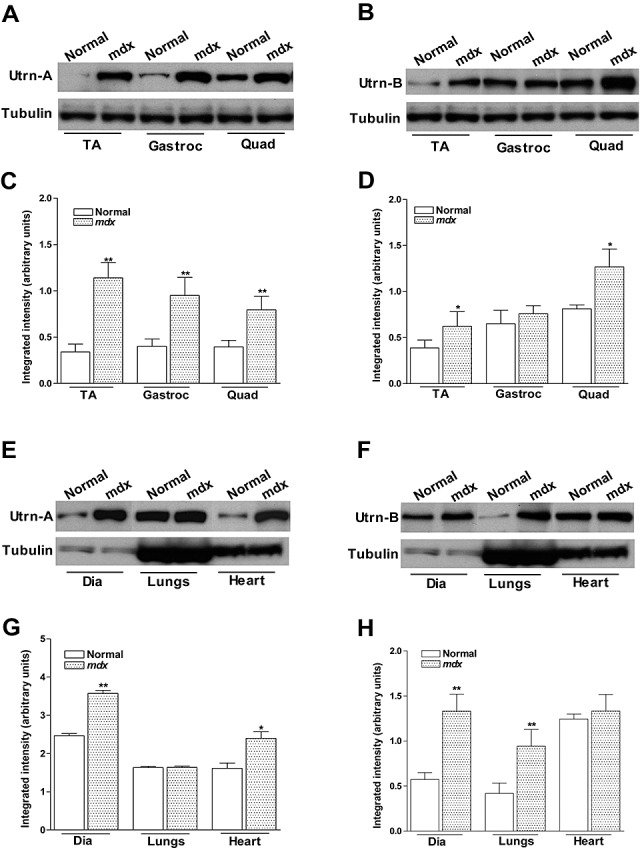
Quantitation of utrophin protein expression in normal and mdx mouse. Utrn‐A and Utrn‐B expression levels in normal and dystrophin‐deficient skeletal muscles (A–D), diaphragm, lungs and heart (E,H) were determined at translational level by immunoblotting. Western blot analysis of lysates containing 50 µg of total protein probed with Utrn‐A and ‐B antibodies. Utrn‐A protein was upregulated in mdx skeletal muscles, as shown (A,C). Quantification of Utrn‐A protein levels in normal and mdx muscles, expressed as normalized value of Utrn‐A/tubulin, revealed significant upregulation in tibialis anterior (TA), gastrocnemius (Gastroc) and quadriceps (Quad) muscles of mdx mice (C). Utrn‐B protein upregulation in the Gastroc was equivocal; however, tibialis anterior (TA) and Quad showed significantly higher expression than normal muscles (B). Lower lanes show blots probed with tubulin antibodies. Further, densitometric analysis confirmed significant upregulation of Utrn‐B in TA and Quad (D). Similarly, Utrn‐A and Utrn‐B expression levels in normal and mdx diaphragm (Dia), lungs and heart were determined at the translational levels (E–H). At the protein level, there was strong upregulation of Utrn‐A protein in mdx mouse Dia and heart, while in mouse lung, there was no upregulation of Utrn‐A as expected (E). Quantification of repeated blots of Utrn‐A, expressed as normalized value of Utrn‐A/tubulin, further confirmed significant upregulation of Utrn‐A in mdx Dia and heart (G). Among these tissues studied, Utrn‐B protein was significantly upregulated in lungs and diaphragm, but not in the heart (F). Densitometric analysis confirmed significant upregulation of Utrn‐B in Dia and lungs (H). Lower lanes show blots probed with tubulin antibodies. Histograms show means ± SD. Statistical analysis was conducted using Student's t‐tests. Each blot is a representative immunoblot from minimum of four experiments. *P < 0.05; **P < 0.001.
Differential expression of Utrn‐A and ‐B in normal and mdx brain
Having validated the sensitivity and specificity of the Utrn‐A and Utrn‐B reagents we had generated for this study, we studied the expression pattern of Utrn‐A and Utrn‐B mRNA and protein in the brain of normal and mdx mice, as little is known about the cellular and/or subcellular distribution of Utrn‐A and ‐B isoforms in the brain of normal and mdx mice 18, 55. We microdissected different regions of normal and mdx brain and evaluated the expression level of Utrn‐A and Utrn‐B transcripts and proteins. Quantitative analysis revealed Utrn‐A was expressed at 4.98 ± 0.64 copy number/µg of RNA, while Utrn‐B was expressed at 3.43 ± 0.45 copy number/µg of RNA in whole brain. Both Utrn‐A and ‐B mRNAs were expressed in all the regions of the brain studied, and the expression levels did not change significantly either among different regions or between mdx and normal mice in across the entire brain (Figure 6A, B). However, regional differences in Utrn‐A and Utrn‐B protein expression levels were observed. Utrn‐A was upregulated in the olfactory bulb, hypothalamus and cerebellum of mdx mice compared with normal mice (Figure 6C, E), while Utrn‐B was upregulated only in the olfactory bulb and cerebellum (Figure 6D, F). Transcriptional–translational mismatch for Utrn‐B was observed in the brain stem and the spinal cord, while the spinal cord showed lower Utrn‐B protein levels compared with other regions of the brain (Figure 6D, F).
Figure 6.
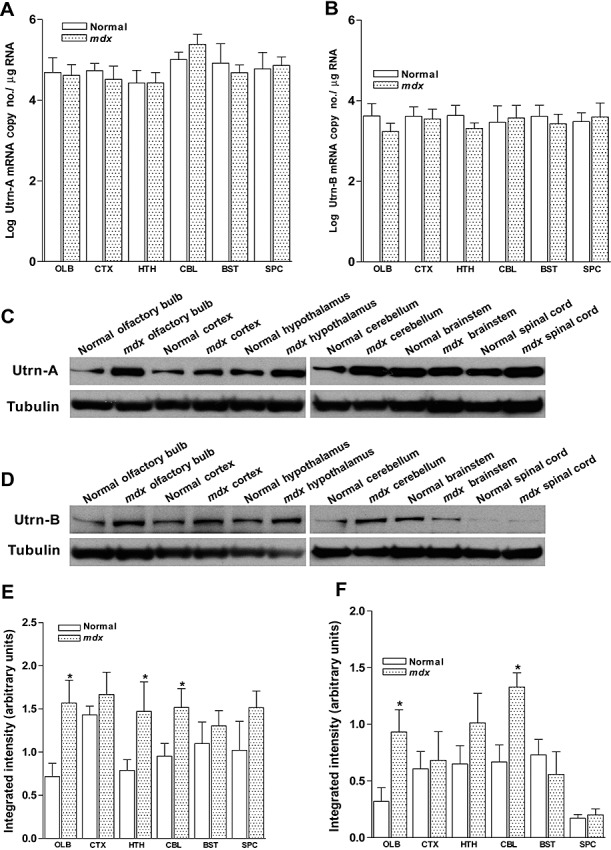
Quantitation of utrophin expression in normal and mdx mouse central nervous system (CNS). A,B. Expression levels of Utrn‐A and Utrn‐B mRNAs in olfactory bulb (OLB), cortex (CTX), hypothalamus (HTH), cerebellum (CBL), brainstem (BST) and the spinal cord (SPC) of normal and mdx mice did not show any significant differences in mdx mice compared with normal mice. Mean ± SD are shown. C,D. Western blot analysis of brain lysates of normal and mdx mouse containing 50 µg of total protein probed with Utrn‐A and Utrn‐B antibodies. Different regions of the CNS showed mild to moderate degree of upregulation in regions studied except for the brain stem (for Utrn‐A) and spinal cord (for Utrn‐B), were levels were similar in normal and mdx mice. Further, densitometric analysis of Utrn‐A (E) and Utrn‐B (F), expressed as normalized value of Utrn‐A/tubulin and Utrn‐B/tubulin respectively, revealed significant upregulation of Utrn‐A in the olfactory bulb, hypothalamus and cerebellum of mdx mouse, while Utrn‐B protein was upregulated only in the olfactory bulb and cerebellum. Histograms show means ± standard deviation. Statistical analysis were conducted using Student's t‐tests. Lower lanes show blots probed with tubulin antibodies. Each blot is a representative immunoblot from minimum of four experiments. *P < 0.05.
Immunolabeling of Utrn‐A and ‐B and their differential expression in the mdx brain
Having determined the areas of brain that were enriched in Utrn‐A and ‐B proteins, and also the upregulation of these proteins in dystrophin‐deficient mice by western blotting, we further investigated these results using immunofluorescent techniques to refine the spatial distribution. Overall, strong immunolabeling of Utrn‐A was observed in neurons, astrocytes and blood capillaries, while strong Utrn‐B immunolabeling was observed in blood vessels and capillaries. Systemic analysis of brain sections revealed strong Utrn‐A immunolabeling in the main olfactory bulb (Figure 7A), accessory olfactory bulb, cerebral cortex (Figure 7B), basal forebrain, medial septum, ventro‐medial (Figure 7C) and lateral hypothalamic nuclei, median eminence (Figure 6D), midbrain nuclei, different layers of hippocampus (Figure 7E), cerebellum (Figure 7F), brainstem nuclei, including the ventro‐lateral reticular nuclei (Figure 7G), and the spinal cord (Figure 7H). Pia mater of the meninges, choroid plexus, ependymal lining, gial cells in the brain, vascular structures such as smaller arterioles, and capillaries were also labeled with Utrn‐A antibodies. Utrn‐B immunolabeling was noted in vascular elements, such as arteries, smaller arterioles and capillaries in the brain (Figure 7A′–G′). Moderate labeling of Utrn‐B was observed in pia mater and glial cells, neuronal populations in the olfactory bulb (Figure 7A′), cerebral cortex (Figure 7B′), forebrain, ventro‐lateral and median hypothalamus (Figure 7C′), median eminence (Figure 7D′) midbrain, and medullary nuclei (Figure 7G′). Weak Utrn‐B labeling was noticed in neurons and epithelial cells of the choroid plexus, cerebellum (Figure 7F′) and the spinal cord (Figure 7H′).
Figure 7.
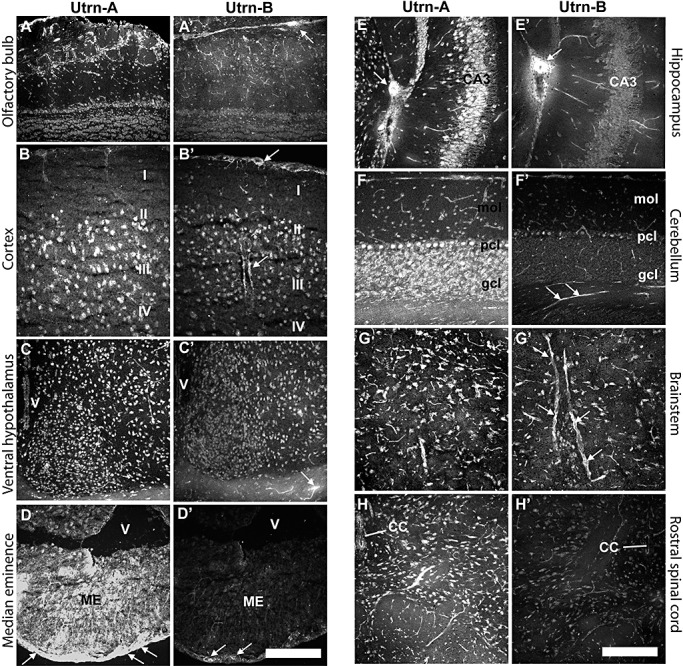
Differential expression of Utrn‐A and Utrn‐B in the central nervous system. A. Utrn‐A immunolabeling in the olfactory bulb of mdx mice. Strong staining of Utrn‐A in the neurons of olfactory nerve layer, glomerular layer and isolated neurons in external plexiform layer. Neurons in the mitral cell layer and granule cell layer showed moderate staining of Utrn‐A. Note that apart from neuronal population, fine capillaries also showed Utrn‐A staining in the olfactory bulb. A'. The vascular elements in the olfactory bulb showed strong Utrn‐B immunolabeling (arrows), whereas neurons at different layers showed weak staining of Utrn‐B. B. Utrn‐A immunolabeling profiles in the parietal cortex, primarily pyramidal neurons in layers II, III and IV. B'. Similar region from adjacent section show moderate Utrn‐B immunolabeling in the cortical neurons in layers II, III and IV. Note small muscular arteries showing Utrn‐B staining along the pia and in the brain parenchyma (arrow). Such vascular elements unavoidably contribute to Utrn‐B derived from various brain regions. C. Rostral hypothalamus expressed strong Utrn‐A immunolabeling in neurons. C'. Utrn‐B staining was moderate in neurons in the rostral hypothalamus; however, vascular elements were strongly positive. Note strongly positive fine blood vessel along the optic nerve (arrow). D. Median eminence (ME) shows strong Utrn‐A immunolabeling. Note strong staining along outer layer of the ME (arrows). D'. Utrn‐B immunolabeling was only restricted to the outer surface of the ME (arrows). E. Intense Utrn‐A labeling in hippocampus at CA3 region. Also note that intermediate neurons, muscular artery (arrow) and fine capillaries are positive for Utrn‐A. E'. Adjacent section reacted with Utrn‐B antibody showing strong labeling in muscular artery (arrow) and moderate labeling in fine capillaries. Neurons were weakly positive for Utrn‐B. F. Utrn‐A immunolabeling in Purkinje cell bodies, and granular cells in the cerebellum. In the molecular layer of cerebellum, vascular elements were moderately positive for Utrn‐A. F'. Utrn‐B immunolabeling was limited to the vascular elements in the cerebellum (arrows). G. In the medullary region, neurons and capillaries showed strong Utrn‐A immunolabeling. G'. Adjacent section that reacted for Utrn‐B showed strong immunolabeling in capillaries (arrows) and moderately positive neurons. H. Rostral spinal cord showing strong Utrn‐A immunolabeling in neurons and vascular elements. H'. A weak labeling of Utrn‐B was observed in neurons and blood vessels at the rostral spinal cord. Scale bar, 50 µm. Abbreviations: CC = central canal; gcl = granular cell layer; mol = molecular cell layer; pcl = Purkinje cell layer.
To further characterize cell populations that showed Utrn‐A and Utrn‐B immunolabeling, we used a neuronal marker, NeuN, for co‐localization and examined sections using a confocal microscope. Neuronal populations in the olfactory bulb, cortex, hippocampal regions, caudal diencephalon and the spinal cord could be labeled with Utrn‐A, as well as NeuN (Figure 8A). Similarly, Utrn‐B, which was expressed at low abundance, also showed co‐localization with NeuN in these regions (Figure 8B). Interestingly, the secretory subcommissural organ (SCO) situated ventral to the posterior commissure showed differential expression pattern of Utrn‐A and ‐B. In the SCO, strong labeling of Utrn‐A was observed only in the secretory ependymal cells lining the ventricle that would secrete and directly contact the cerebrospinal fluid (CSF) (Figure 8A), while weak labeling of Utrn‐B emanating from vascular elements rather than ependymal cells was observed (Figure 8B). Sections incubated with preimmune sera or antisera preabsorbed with the corresponding peptide did not show specific labeling (data not shown).
Figure 8.
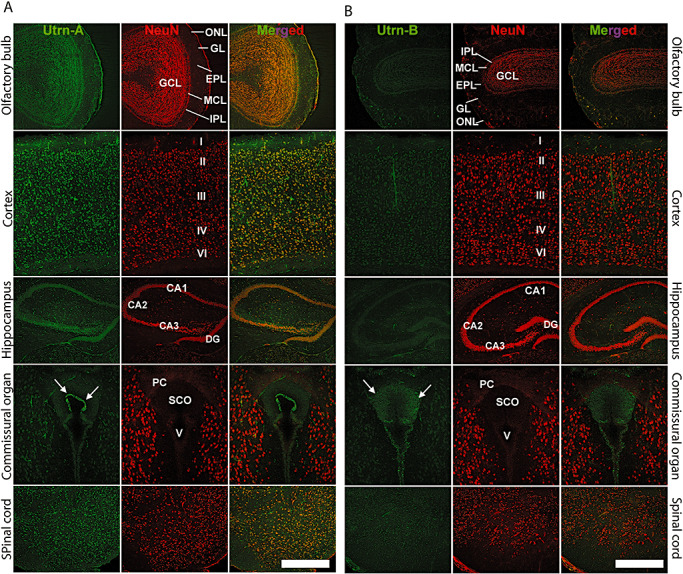
Immunolocalization of Utrn‐A and ‐B in mdx mouse brain. Using confocal miscroscopy, double‐labeled sections of the central nervous system, passing through the olfactory bulb, cerebral cortex, hippocampus, caudal diencephalon at the level of subcommissural organ (SCO) and the spinal cord, were studied for understanding the cellular distribution of Utrn‐A (column A) and Utrn‐B (column B) (green channel). A neuronal marker, antimouse NeuN, was used to counter stain neurons (red channel). Merged channels show extent of colocalization. A. Utrn‐A labeling was noted in the olfactory bulb. In cerebral cortex, strong staining of Utrn‐A was found in neurons of II–VI layers. The hippocampal pyramidal cell layer of CA1–CA3 areas and dentate gyrus (DG) showed strong Utrn‐A staining. The epithelial cells in the SCO express strong Utrn‐A labeling (arrows). Strong Utrn‐A immunolabeling was observed in neurons of the spinal cord. B. Utrn‐B immunolabeling was weak in neurons of the olfactory bulb, cerebral cortex, hippocampus, caudal diencephalon and the spinal cord; only the vascular elements showed strong Utrn‐B immunolabeling. A moderate degree of Utrn‐B labeling was observed in the SCO (arrows). Scale bar, 50 µm. Abbreviations: ONL = olfactory nerve layer; GL = glomerular layer; EPL = external plexiform layer; MCL = mitral cell layer; IPL = internal plexiform layer; GCL = granule layer; DG = dentate gyrus; PCO = posterior commissure; V = ventricle.
Differential expression of Utrn‐A and ‐B in brain blood vessels and choroid plexus
Having demonstrated the differential expression patterns of Utrn‐A and Utrn‐B in the CNS of normal and mdx mice, we further addressed differences in Utrn‐A and Utrn‐B transcripts and protein expressions, if any, in the brain blood vessels, blood capillaries and choroid plexus. We microdissected large blood vessels from the CNS, the choroid plexus and fractionated brain capillaries from cortices of mdx mice, and studied Utrn‐A and Utrn‐B transcript and protein expression. The choroid plexus showed the highest level of Utrn‐A mRNA compared with capillaries and blood vessels (Figure 9A). However, among these structures studied, Utrn‐B mRNA was higher in brain capillaries compared with blood vessels and the choroid plexus (Figure 9B). Immunohistochemical analysis revealed stronger Utrn‐A immunolabeling in the choroid plexus (Figure 9C, D) than Utrn‐B (Figure 9C′, D′). Further, higher magnification of the choroid plexus showed Utrn‐A along the basal lamina of the choroid plexus epithelial cells (Figure 9D). However, strong Utrn‐B immunolabeling was limited an/or restricted to the ependymal lining of the ventricle (Figure 9C′). The choroid plexus showed weak immunolabeling of Utrn‐B (Figure 9D′); this staining may result from high vascular content of the choroid plexus. The choroid epithelial cells and/or basal lamina of the epithelial cells did not show Utrn‐B immunolabeling (Figure 9D′). The blood vessels and capillaries themselves were strongly immunolabled for Utrn‐B (Figure 9E′, F′), whereas Utrn‐A immunolabeling was weaker in blood vessels and capillaries (Figure 9E, F). The pia mater and perivascular astrocytes showed strong Utrn‐A immunolabeling (Figure 9E, F). These results were further confirmed by determining the protein levels by western blotting. As demonstrated, a remarkably higher level of Utrn‐A protein was detected in the choroid plexus than in capillaries and blood vessels (Figure 9G,I), whereas Utrn‐B protein levels were higher in capillaries compared with larger blood vessels and the choroid plexus (Figure 9H,J). These results further confirm the differential expression pattern of Utrn‐A and Utrn‐B in the choroid plexus, blood vessels and capillaries in the brain.
Figure 9.
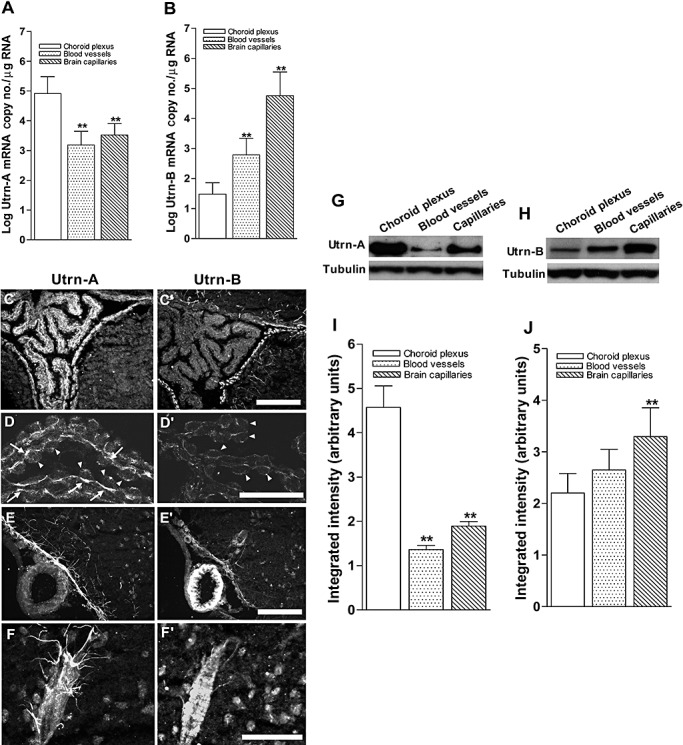
Differential expression of Utrn‐A and ‐B in choroid plexus and vascular elements. A. Expression pattern of Utrn‐A transcript was quantified in microdissected choroid plexus, central nervous system (CNS) blood vessels and fractionated capillaries. Utrn‐A transcript expression was significantly higher in choroid plexus than in blood vessels and capillaries (n = 6; **P < 0.001). Compared with blood vessels, transcript level was significantly higher in capillaries (n = 6; *P < 0.01). B. CNS capillaries showed significantly higher Utrn‐B mRNA (n = 6; **P < 0.001) than choroid plexus and blood vessels. Mean ± standard deviation (SD) are shown. C,C'. Immunolabeling of transverse section of mdx brain at the level of choroid plexus showed strong Utrn‐A immunolabeling; however, adjacent section labeled with Utrn‐B shows weak labeling in the choroid plexus. The ependymal lining and vascular elements show strong immunolabeling with both antibodies. D,D'. Higher magnification of the choroid plexus from dystrophic mouse immunolabeled with anti‐Utrn‐A (D) and anti‐Utrn‐B antibodies (D'). Strong immunolabeling of Utrn‐A along the basal membrane (arrows) and weak staining at the epithelial cells (arrow heads). Choroid plexus show weak Utrn‐B immunolabeling, which may contribute to the high vascular contents, whereas choroid epithelial cells (arrowheads) did not show Utrn‐B immunolabeling in dystrophic mice. E,E'. A blood vessel along ventral region of brain demonstrates no significant Utrn‐A labeling, whereas ependymal lining, perivascular astrocytes and neurons show moderate Utrn‐A labeling. Adjacent section reacted with Utrn‐B antibodies, showing strong immunolabeling in the blood vessels. Also note moderate staining along the ependymal lining and vascular elements. F,F'. Higher magnification of a blood vessel show Utrn‐A labeling of perivascular astrocytes making close contact with blood vessels; however, adjacent section reacted with Utrn‐B label the blood vessels rather than perivascular astrocytes. Note that moderate labeling of neurons is also visualized. G,H. Western blot analysis of lysates containing 50 µg of total protein probed with Utrn‐A and ‐B antibodies. G. Consistent with immunolabeling, Utrn‐A is expressed at high levels in choroid plexus compared with capillaries and blood vessels. H. Differential expression of Utrn‐B protein in choroid plexus, blood vessels and capillaries. Among these structures studied, Utrn‐B protein was abundant in brain capillaries as compared with blood vessels and choroid plexus. Histograms show means ± SD. Representative blots from a minimum of five experiments. Lower lanes show blots probed with tubulin antibodies. I,J. Histogram of densitometric quantification of Utrn‐A and Utrn‐B proteins in choroid plexus, blood vessels and brain capillaries normalized by corresponding tubulin bands, respectively showing significantly higher amount of Utrn‐A in choroid plexus than brain vascular elements, whereas Utrn‐B was significantly higher in brain capillaries compared with choroid plexus and blood vessels. Compared with Utrn‐A and Utrn‐B protein levels in the choroid plexus; statistical analysis was performed by one‐way analysis of variance (n = 6; *P < 0.05, **P < 0.001). Scale bar, 50 µm.
Utrn‐A and Utrn‐B promoters are differentially expressed in the CNS
To determine whether the level of Utrn‐A and Utrn‐B expression is correlated to the regional difference of Utrn‐A and Utrn‐B observed in the brain, as well as to investigate endogenous promoter activity, we analyzed Utrn‐A and Utrn‐B expression in different cellular components of the CNS using immunohistochemistry, western blotting, qPCR and promoter–reporter constructs in cultured primary cell lines. We generated primary neuronal and astrocyte cultures from prenatal and neonatal mdx mice pups respectively, and cultured the brain‐derived endothelial cell line (bEnd.3); the C2C12 muscle cell line was used as a reference. Using the antibodies we generated, the expression patterns of Utrn‐A and Utrn‐B in primary neurons, astrocytes, bEnd.3 and C2C12 cells were studied immunohistochemically (Figure 10A). Consistent with previous findings, C2C12 cells showed strong Utrn‐A and moderate Utrn‐B immunolabeling; desmin was used for identifying muscle cells. In bEnd.3 cells, Utrn‐B staining was higher than Utrn‐A; CD31 was used as an endothelial marker (Figure 10A). Primary neuronal cultures showed strong Utrn‐A immunolabeling in their perikarya, whereas Utrn‐B staining was weak; Neu‐N was used for co‐labeling. Cultured primary astrocytes revealed strong Utrn‐A immunolabeling compared with Utrn‐B; S‐100 was used for co‐labeling (Figure 10A). Temporal and spatial changes in the subcellular distribution of Utrn‐A and ‐B immunolabeling in astrocytes cultured on glass plates for different time points were also noted (Supporting Figure S2A–C). Both Utrn‐A and ‐B immunolabeling seemed to originate from focal‐adhesion points, regions where astrocytic cellular membranes were in close proximity to the substratum, rather than the cytoplasm that overlies the region (Supporting Figure S2A–C). We validated these observations by using antibodies generated against paxillin, a specific focal‐adhesion marker, and found that both Utrn‐A and Utrn‐B co‐localize with paxillin‐positive structures (Supporting Figure S2C). To independently validate immunohistochemical findings in cultured cells, we performed western blotting to determine Utrn‐A and ‐B protein levels in the present cell types. As demonstrated. Utrn‐A levels were higher in primary neurons than bEnd.3 cells, astrocytes and C2C12 cells (Figure 10B,C), while Utrn‐B protein level was higher in bEnd.3 cells than in neurons, astrocytes or C2C12 cells (Figure 10D,E).
Figure 10.
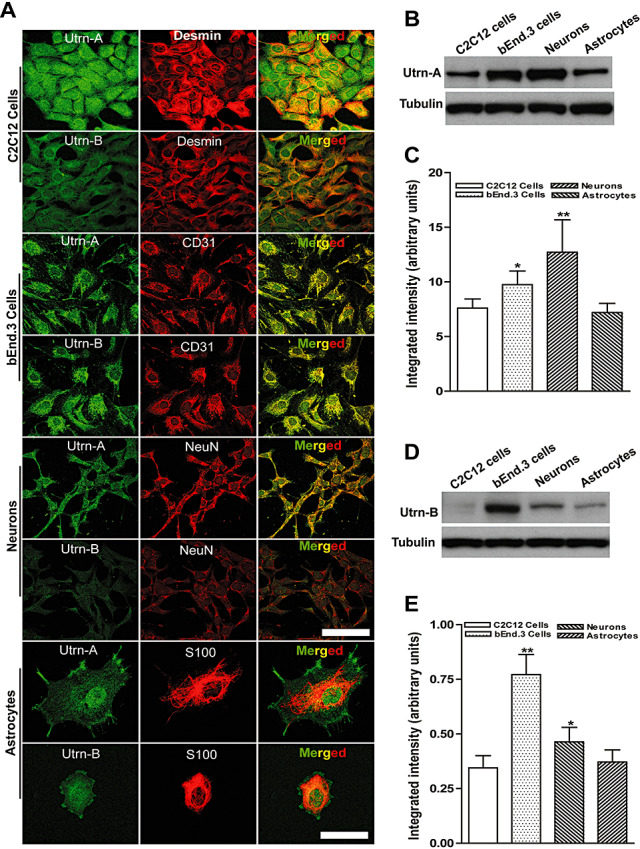
Utrn‐A and ‐B expression in different cellular components of the central nervous system. C2C12 cells, bEnd.3 cells, primary neurons and astrocytes cultures were used to study differential expression of Utrn‐A and ‐B proteins. A. C2C12 cells, primary mdx neurons and astrocytes showed greater Utrn‐A immunolabeling than Utrn‐B. C2C12 cells were colabeled with desmin, bEnd.3 cells, endothelial cell marker, CD31, neurons co‐labeled with the neuronal cell marker, NeuN, astrocytes colabeled with S100. B,D. Western blot analysis of lysates containing 50 µg of total protein probed with Utrn‐A and ‐B antibodies. Consistent with immunolabeling, Utrn‐A expression was higher in neurons and bEnd.3 cells compared with C2C12 cells and astrocytes. However, Utrn‐B protein expression was greater in bEnd.3 cells compared with other cell types. Expression of Utrn‐B in C2C12 cells was extremely low. Representative blots from a minimum of 5 experiments. Lower lanes show blots probed with tubulin antibodies. C,E. Histogram of densitometric quantification of Utrn‐A and Utrn‐B proteins in various cell types corrected by the corresponding tubulin bands, respectively. Compared with Utrn‐A and Utrn‐B protein levels in the C2C12 cells; statistical analysis was performed by one‐way analysis of variance (n = 6; *P < 0.05, **P < 0.001). Means are presented as ± SD. Scale bar, 100 µm.
Having determined that Utrn‐A and ‐B proteins are expressed and distributed differently in these cell types, we further investigated the differences in expressions of Utrn‐A and Utrn‐B transcripts in these cells. Compared with C2C12 cells, Utrn‐A transcript level was significantly higher in astrocytes, whereas bEnd.3 cells showed a significantly lower level (Figure 11A). No significant difference in Utrn‐A mRNA level was observed between C2C12 cells and primary neuronal cultures (Figure 11A). Among the cell types studied, the Utrn‐B mRNA level was significantly higher in bEnd.3 cells compared to C2C12 cells. Primary neurons and astrocytes showed relatively low abundance of Utrn‐B mRNA (Figure 11B).
Figure 11.
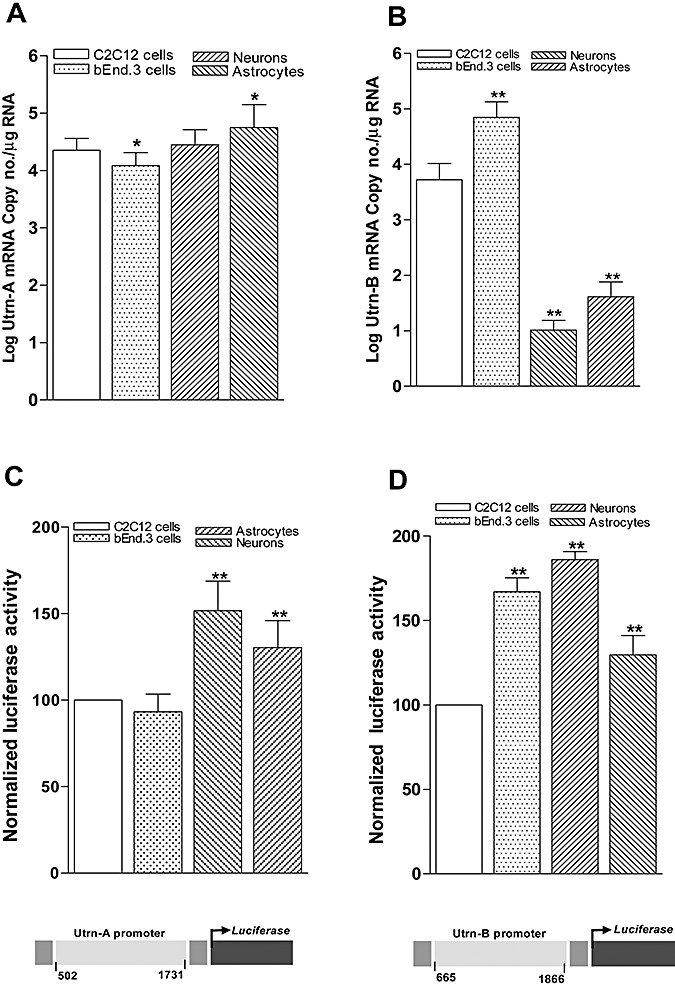
Differential regulation of Utrn‐A and Utrn‐B promoters in the central nervous system. Expression pattern of Utrn‐A and Utrn‐B transcripts (A,B) and endogenous promoter activity (C,D) was studied in primary cultures of neurons and astroglia isolated from mdx mouse brain, C2C12 and bEnd.3 cell lines. A,B. Utrn‐A transcript level was significantly higher (n = 6; *P < 0.05) in astrocytes and neurons compared with C2C12, whereas in bEnd.3 cells Utrn‐A mRNA was significantly lower (n = 6; *P < 0.05). Utrn‐B mRNA expression was significantly (n = 6; **P < 0.001) higher in bEnd.3 cells, whereas neurons and astrocytes showed significantly (n = 6; **P < 0.001) lower amount of Utrn‐B mRNA compared with C2C12 cells. Mean ± SD are shown. Statistical analysis was conducted using Student's t‐tests. C,D. Differential expression of endogenous Utrn‐A and Utrn‐B promoter activity. Primary neurons, astrocytes, C2C12 cell and bEnd.3 cell cultures were transfected with utrophin‐A (mUtrn‐A‐luc) and/or Utrn‐B (mUtrn‐B‐luc) reporter constructs, along with transfection control pRL‐TK. Promoter activity was assayed 24 h after trasnfection. Endogenous Utrn‐A promoter activity was the greatest in neurons and significantly higher than astrocytes compared with C2C12 cells or bEnd.3 cells. Endogenous Utrn‐B promoter activity was highest in bEnd.3 cells, and significantly high in neurons and astrocytes compared with C2C12 cells. Utrn‐A or Utrn‐B‐derived firefly luciferase activities were normalized to pRL‐TK‐derived renilla luciferase activity (internal control) and expressed as 100% to C2C12 cells. Normalized luciferase values are mean values of 6 wells in three separate experiments. Mean ± SD is shown. Statistical analysis was conducted using Student's t‐tests. Schematic representations of mouse utrophin promoters are shown. Schematic representation of regions of mouse Utrn‐A and Utrn‐B promoter cloned to generate luciferase reporter constructs is given further.
Having demonstrated the differential mRNA and protein expressions in neurons and astrocytes, we further evaluated endogenous Utrn‐A and ‐B promoter activity in these cell‐types by transfecting these cell types with mouse Utrn‐A (mUtrn‐A‐luc) and Utrn‐B (mUtrn‐B‐luc) luciferase reporter constructs that we generated by molecular cloning (Figure 11C, D). Compared with C2C12 and bEnd.3 cells, the normalized Utrn‐A promoter activity was significantly higher in primary neurons (151.67 ± 17.14) and astrocytes (134.35 ± 15.66; Figure 11C). Compared with C2C12 cells, normalized Utrn‐B promoter activity was significantly higher in bEnd.3 cells (360.35 ± 25.7), primary neurons (186.12 ± 40.02) and astrocytes (129.76 ± 11.42). The level of Utrn‐B endogenous promoter activity observed in bEnd.3 cells was markedly higher than in C2C12 cells (Figure 11D).
DISCUSSION
In this study, we generated Utrn‐A‐ and Utrn‐B‐specific reagents and used a variety of immunological, cell biological and molecular techniques to comprehensively analyze the expression of Utrn‐A and Utrn‐B transcripts, proteins and promoter activity in the CNS of normal and mdx mice. The differential expression of Utrn‐A and Utrn‐B transcripts and proteins reported here suggest that these two isoforms may have different functional roles in the CNS.
In agreement with previous studies in muscles 46, 54, we observed localization of Utrn‐A at the NMJ and Utrn‐B at the vascular elements of skeletal muscles (1, 2, 3), demonstrating that both Utrn‐A and Utrn‐B antibodies that were generated were sensitive and specific. Utrn‐A is expressed abundantly and uniformly throughout the sarcolemma of the myofiber during the prenatal period; however, the mechanisms controlling increased expression at the synapse and concurrent extrasynaptic downregulation or repression that occur to ultimately restrict expression to the NMJ in adults remain yet to be fully addressed (9). We and others have shown that the N‐box/EBS motif of the Utrn‐A promoter play a critical role in regulating expression at the NMJ 16, 20, 25, 45, and, more importantly, in restricting expression to the NMJ (42). In mdx muscles both Utrn‐A transcript and protein were upregulated as has been reported previously (54). We also observed upregulation of both Utrn‐B mRNA and protein in mdx skeletal muscles, diaphragm and lungs, which may be caused by the higher blood vessel density in mdx muscles. Indeed, it has been well established that DMD patients and mdx mice have higher blood vessel densities than age‐matched controls 2, 36, 41. However, significantly higher amount of Utrn expressed in the heart seems to be exclusively caused by increases in Utrn‐A rather than Utrn‐B expression (4, 5). In general, Utrn‐A and Utrn‐B transcript and proteins were expressed at matching levels in muscle and CNS. However, similar to what has been noted in specific muscle groups (15) and during development (42), we found differences in the degree of upregulation of protein and transcript levels of Utrn‐A and ‐B in the spinal cord and brain stem of mdx CNS. This may reflect differences in post‐translational regulatory mechanisms or turnover similar to those reported in regenerating skeletal muscles (37).
In the CNS, we demonstrate that both Utrn‐A and ‐B are differentially expressed in normal and mdx mice. At the cellular level, Utrn‐A was found to be enriched in neurons, astrocytes, ependymal cells, the vascular endothelium of small blood vessels and the basal lamina of the choroid plexus, whereas Utrn‐B was expressed mainly in vascular endothelium, ependymal cells and, to a far lesser amount, in neurons (6, 7, 8). Therefore, the subcellular distribution of Utrn in CNS described previously using antibodies that did not discriminate between Utrn‐A and Utrn‐B isoforms 26, 27 was caused by the composite labeling of Utrn‐A and ‐B rather than exclusive to either isoform. The presence of Utrn in the vascular endothelium of muscle, neuronal and non‐neuronal tissues has been previously reported 26, 28, 35, 46; however, it was unclear which isoform was expressed in the vasculature of tissues other than muscle. In contrast to the situation in muscle where Utrn‐B rather than Utrn‐A is expressed in vascular elements 54, 55, small vasculature in the CNS showed both Utrn‐A and Utrn‐B (Figure 9). The presence of Utrn‐A and ‐B isoforms was also independently validated by studying the expression levels of transcript, protein and endogenous promoter activity in microdissected brain vasculature and fractionated capillaries, as well as in cells (7, 8, 9, 10, 11). It has been well established that blood–brain barrier (BBB) in mdx mice is severely altered because of the lack of dystrophin (39). Therefore, intense labeling of Utrn‐B in brain vasculature, ependymal cells and perivascular astrocytes, which contributes to formation of BBB, suggests functional roles for Utrn‐B at the BBB. The endothelial cells of CNS microvessels form the physiological BBB in mammals that prevents the entry of many blood‐borne molecules into the brain parenchyma, thus helping to maintain the milieu necessary for appropriate neuronal function (43). Astrocytes are known to carry out numerous functions critical for the CNS, such as preventing neural excitotoxity by buffering extracellular potassium (8) and modulating or initiating neuronal signaling (12). Additionally, they contribute to BBB formation during development by inducing tight junctions between endothelial cells 22, 38, 49. Abundance of Utrn and associated components of the dystrophin‐associated protein complex at this interface 3, 26, 27, 28 suggest that Utrn may function by influencing the spatial localization of transmembranous proteins via binding to other components of DPC.
Immunoelectron microscopic studies have demonstrated that the water channel, aquaporin‐4 (40) and the inwardly rectifying K+ channel, Kir4.1 (7), are localized selectively at the astrocytic membrane in direct contact with the basal lamina facing the blood vessels. In utrn−/− or mdx 3Cv mice, the association of auqaporin‐4 and Kir4.1 with the glial DAPC was shown to be disrupted, causing a delay in clearance of extracellular K+ after neuronal activation and an increase in seizure susceptibility (1). Utrn‐A and ‐B were also expressed in the choroid plexus, with the level of Utrn‐B mRNA and protein being significantly lower than Utrn‐A (Figure 9). Interestingly, Utrn‐B labeling emanated from vascular elements of the choroid plexus rather than subcellular regions associated with CSF production (Figure 9). Utrn isoforms was found to be differentially distributed (Figure 8) in the SCO—a region known to regulate CSF formation and secrete negatively charged glycoproteins, such as SCO‐spodins and Reissner's fiber glycoprotein‐I that are critical for maintaining an open aqueduct (48). In contrast to the situation in mdx mice (8, 9), in the choroid plexus of utrn−/− mice, the DAPC complex is disrupted because of lack of compensation by Utrn, β1‐ and β2‐syntrophins are undetectable, and β‐dystrobrevin mislocalized to an intracellular compartment (19), suggesting that these proteins are differentially dependent on Utrn for proper membrane targeting. Collectively, these results suggest a role of Utrn in the formation and functioning of the CSF and BBB to regulate essential brain homeostasis.
We also established a heterogeneous distribution of Utrn‐A and ‐B protein expressing neurons in the brain (7, 8). Utrn‐A was abundantly present in the CA1, CA2, CA3 pyramidal cells and dentate gyrus of the hippocampus (Figure 8)—a distribution similar to that noted for dystrophin. This is consistent with the finding that kainite‐induced excitotoxicity caused profound neuronal death at the hippocampus in utrn−/− mice (29). The absence of Utrn at the BBB would also be predicted to contribute to the profound neurodegeneration of kainite‐induced excitotoxicity in utrn−/− animals. Analogous to the manner in which Utrn upregulation achieved by transgenic or viral means has been shown to functionally rescue the dystrophic phenotype in muscle of mdx mice, it has been suggested that Utrn upregulation in the hippocampus limits the extent of neuronal damage in the CA1 neurons subjected to hypoxia‐induced injury in the mdx mouse (29). Our demonstration that Utrn‐A rather than Utrn‐B is expressed in the hippocampal neurons (Figure 8) suggests that Utrn‐A, rather than Utrn‐B, would be the appropriate target for pharmacological strategies, such as promoter activation, in order to test this hypothesis. Upregulation of Utrn‐A and ‐B proteins observed in mdx brain without corresponding increase in their transcript levels provides further support for post‐transcriptional control of Utrn expression (37). Interestingly, brain areas of mdx mice where Utrn‐A was found upregulated are the major areas of dystrophin expression 28, 32. Previous studies have shown that the cerebral cortex and brainstem regions of mdx has 50% decrease in neuronal number and neural shrinkage (44), and hippocampal neurons in mdx mice are known to be more susceptible to hypoxia‐induced damage (14). Therefore, Utrn upregulation observed in mdx CNS suggests a potential neuroprotective effect from neuropathological insults.
In conclusion, we have demonstrated differential expression pattern of Utrn‐A and ‐B in the CNS. Localization of Utrn isoforms in vascular endothelium, the choroid plexus and SCO suggests the potential role of Utrn‐A and ‐B in CSF formation and maintaining the BBB. Coupled with previous studies on Utrn expression and our demonstration of Utrn‐A expression in hippocampal neurons (14), it supports a structural and/or protective role for Utrn. The resources generated here, including the Utrn‐A‐ and Utrn‐B‐specific q‐PCR TaqMan assay, promoter constructs and antibodies, will provide useful reagents to be employed in subsequent investigations to test these hypotheses and further understand regulatory mechanism(s) of Utrn‐A and ‐B in normal and dystrophin‐deficient tissues including CNS, as well and facilitate developing Utrn upregulation strategies for DMD.
Supporting information
Figure S1. Validation of Utrn‐A and Utrn‐B antibody specificity using western blots and microdisceted brain capillaries. A. Western blot analysis of lysates containing 50 μg of total protein from mdx brain capillaries were probed with preimmune serum (lane 1), Utrn‐A affinity purified antibody (lane 2), and affinity purified antibody preadsorbed with excess Utrn‐A peptide (lane 3). Only blot incubated with Utrn‐A affinity purified antibody resulted in sharp band for Utrn‐A protein. B. Similarly, western blot probed with Utrn‐B affinity purified antibody showed sharp Utrn‐B protein band (lane 5). Bolts incubated with preimmune serum (lane 4) and affinity purified antibody preadsorbed with excess Utrn‐B peptide (lane 6) did not show Utrn‐B protein band. C. Validation of microdissection of brain capillaries. Merged image showing isolated brain capillaries immunolabeled with FITC‐conjugated lectin antibody (green channel) and co‐stained with DAPI (blue channel) as a positive control for brain capillary microdissection. For details of the procedure, see Materials and Methods. Scale bar, 25 μm.
Figure S2. Spatial and temporal changes in Utrn‐A and Utrn‐B immunolabeling in cultured astrocytes. Astrocytes isolated from mdx mouse were cultured on coverslips coated with poly‐L‐lysine for 24 and 72 h. They were immunolabeled with Utrn‐A and Urn‐B antibodies for the spatial and temporal changes in Utrn‐A and Utrn‐B expression (green channel). A. Astrocytes cultured for 24 h showed distinct Utrn‐A immunolabeling in astrocytes end‐feet (arrows) and weak staining in the cytoplasm. After 72 h of culture, Utrn‐A immunolabeling increased robustly in the astrocytes end‐feet, as well as in the cytoplasm. B. Astrocytes cultured for 24 h showed weak Utrn‐B immunolabeling in astrocytes end‐feet (arrows) and in the cytoplasm; however, after 72 h of culture, there was moderate increase in Utrn‐B labeling. Astrocytes were identified by S100‐positive labeling (red channel). C. Paxillin, a focal adhesion marker (red channel), was used to double label Utrn‐A and Utrn‐B in astrocytes focal adhesion points. A well‐established co‐localization was observed in Utrn‐A with paxillin (arrows) in the astrocytes and moderately with Utrn‐B (arrows). Scale bar, 100 μm.
Supporting data. Copy number calculation for Utrn‐A and ‐B.
Please note: Wiley‐Blackwell are not responsible for the content or functionality of any supporting materials supplied by the authors. Any queries (other than missing material) should be directed to the corresponding author for the article.
Supporting info item
Supporting info item
Supporting info item
ACKNOWLEDGMENTS
We thank Dr. S. Lahiri, Dr. N. Rubinstein, Dr. V. Abraham and members of the Khurana laboratory for the constructive criticism and encouragement. We also extend our special thanks to Dr. A. Stout and Dr. M. Muniuswamy for the technical assistance with the confocal microscopy. This work was supported by grants from the National Institutes of Health (R01AR 48871, R01 EY 013862) and Muscular Dystrophy Association, USA (MDA 4164) to T.S.K.
REFERENCES
- 1. Amiry‐Moghaddam M, Williamson A, Palomba M, Eid T, De Lanerolle NC, Nagelhus EA et al (2003) Delayed k+ clearance associated with aquaporin‐4 mislocalization: phenotypic defects in brains of alpha‐syntrophin‐null mice. Proc Natl Acad Sci U S A 100:13615–13620. [DOI] [PMC free article] [PubMed] [Google Scholar]
- 2. Atherton GW, Cabric M, James NT (1982) Stereological analyses of capillaries in muscles of dystrophic mice. Virchows Arch A Pathol Anat Histol 397:347–354. [DOI] [PubMed] [Google Scholar]
- 3. Blake DJ, Hawkes R, Benson MA, Beesley PW (1999) Different dystrophin‐like complexes are expressed in neurons and glia. J Cell Biol 147:645–658. [DOI] [PMC free article] [PubMed] [Google Scholar]
- 4. Burton EA, Tinsley JM, Holzfeind PJ, Rodrigues NR, Davies KE (1999) A second promoter provides an alternative target for therapeutic up‐regulation of utrophin in Duchenne muscular dystrophy. Proc Natl Acad Sci USA 96:14025–14030. [DOI] [PMC free article] [PubMed] [Google Scholar]
- 5. Campbell KP (1995) Three muscular dystrophies: loss of cytoskeleton‐extracellular matrix linkage. Cell 80:675–679. [DOI] [PubMed] [Google Scholar]
- 6. Cohen HJ, Molnar GE, Taft LT (1968) The genetic relationship of progressive muscular dystrophy (Duchenne type) and mental retardation. Dev Med Child Neurol 10:754–765. [DOI] [PubMed] [Google Scholar]
- 7. Connors NC, Adams ME, Froehner SC, Kofuji P (2004) The potassium channel Kir4.1 associates with the dystrophin‐glycoprotein complex via alpha‐syntrophin in glia. J Biol Chem 279:28387–28392. [DOI] [PubMed] [Google Scholar]
- 8. D'Ambrosio R (2004) The role of glial membrane ion channels in seizures and epileptogenesis. Pharmacol Ther 103:95–108. [DOI] [PubMed] [Google Scholar]
- 9. Davies KE, Khurana TS (2007) A new way to regulate the NMJ. Nat Med 13:538–539. [DOI] [PubMed] [Google Scholar]
- 10. Dennis CL, Tinsley JM, Deconinck AE, Davies KE (1996) Molecular and functional analysis of the utrophin promoter. Nucl Acid Res 24:1646–1652. [DOI] [PMC free article] [PubMed] [Google Scholar]
- 11. Ervasti JM, Campbell KP (1991) Membrane organization of the dystrophin‐glycoprotein complex. Cell 66:1121–1131. [DOI] [PubMed] [Google Scholar]
- 12. Fiacco TA, McCarthy KD (2004) Intracellular astrocyte calcium waves in situ increase the frequency of spontaneous AMPA receptor currents in CA1 pyramidal neurons. J Neurosci 24:722–732. [DOI] [PMC free article] [PubMed] [Google Scholar]
- 13. Freshney RI (1985) Induction of differentiation in neoplastic cells. Anticancer Res 5:111–130. [PubMed] [Google Scholar]
- 14. Godfraind JM, Tekkok SB, Krnjevic K (2000) Hypoxia on hippocampal slices from mice deficient in dystrophin (mdx) and isoforms (mdx3cv). J Cereb Blood Flow Metab 20:145–152. [DOI] [PubMed] [Google Scholar]
- 15. Gramolini AO, Belanger G, Thompson JM, Chakkalakal JV, Jasmin BJ (2001) Increased expression of utrophin in a slow vs. a fast muscle involves posttranscriptional events. Am J Physiol Cell Physiol 281:C1300–C1309. [DOI] [PubMed] [Google Scholar]
- 16. Gramolini AO, Jasmin BJ (1999) Expression of the utrophin gene during myogenic differentiation. Nucl Acids Res 27:3603–3609. [DOI] [PMC free article] [PubMed] [Google Scholar]
- 17. Haenggi T, Fritschy JM (2006) Role of dystrophin and utrophin for assembly and function of the dystrophin glycoprotein complex in non‐muscle tissue. Cell Mol Life Sci 63:1614–1631. [DOI] [PMC free article] [PubMed] [Google Scholar]
- 18. Haenggi T, Schaub MC, Fritschy JM (2005) Molecular heterogeneity of the dystrophin‐associated protein complex in the mouse kidney nephron: differential alterations in the absence of utrophin and dystrophin. Cell Tissue Res 319:299–313. [DOI] [PubMed] [Google Scholar]
- 19. Haenggi T, Soontornmalai A, Schaub MC, Fritschy JM (2004) The role of utrophin and Dp71 for assembly of different dystrophin‐associated protein complexes (DPCs) in the choroid plexus and microvasculature of the brain. Neuroscience 129:403–413. [DOI] [PubMed] [Google Scholar]
- 20. Handschin C, Kobayashi YM, Chin S, Seale P, Campbell KP, Spiegelman BM (2007) PGC‐1alpha regulates the neuromuscular junction program and ameliorates Duchenne muscular dystrophy. Genes Dev 21:770–783. [DOI] [PMC free article] [PubMed] [Google Scholar]
- 21. Hoffman EP, Brown RH Jr, Kunkel, LM (1987) Dystrophin: the protein product of the Duchenne muscular dystrophy locus. Cell 51:919–928. [DOI] [PubMed] [Google Scholar]
- 22. Janzer RC, Raff MC (1987) Astrocytes induce blood‐brain barrier properties in endothelial cells. Nature 325:253–257. [DOI] [PubMed] [Google Scholar]
- 23. Khurana TS, Davies KE (2003) Pharmacological strategies for muscular dystrophy. Nat Rev Drug Discov 2:379–390. [DOI] [PubMed] [Google Scholar]
- 24. Khurana TS, Hoffman EP, Kunkel LM (1990) Identification of a chromosome 6‐encoded dystrophin‐related protein. J Biol Chem 265:16717–16720. [PubMed] [Google Scholar]
- 25. Khurana TS, Watkins SC, Kunkel LM (1992) The subcellular distribution of chromosome 6‐encoded dystrophin‐related protein in the brain. J Cell Biol 119:357–366. [DOI] [PMC free article] [PubMed] [Google Scholar]
- 26. Khurana TS, Kunkel LM, Frederickson AD, Carbonetto S, Watkins SC (1995) Interaction of chromosome‐6‐encoded dystrophin related protein with the extracellular matrix. J Cell Sci 108(Pt 1):173–185. [DOI] [PubMed] [Google Scholar]
- 27. Khurana TS, Rosmarin AG, Shang J, Krag TO, Das S, Gammeltoft S (1999) Activation of utrophin promoter by heregulin via the ets‐related transcription factor complex GA‐binding protein alpha/beta. Mol Biol Cell 10:2075–2086. [DOI] [PMC free article] [PubMed] [Google Scholar]
- 28. Knuesel I, Bornhauser BC, Zuellig RA, Heller F, Schaub MC, Fritschy JM (2000) Differential expression of utrophin and dystrophin in CNS neurons: an in situ hybridization and immunohistochemical study. J Comp Neurol 422:594–611. [DOI] [PubMed] [Google Scholar]
- 29. Knuesel I, Riban V, Zuellig RA, Schaub MC, Grady RM, Sanes JR, Fritschy JM (2002) Increased vulnerability to kainate‐induced seizures in utrophin‐knockout mice. Eur J Neurosci 15:1474–1484. [DOI] [PubMed] [Google Scholar]
- 30. Koenig M, Hoffman EP, Bertelson CJ, Monaco AP, Feener C, Kunkel LM (1987) Complete cloning of the Duchenne muscular dystrophy (DMD) cDNA and preliminary genomic organization of the DMD gene in normal and affected individuals. Cell 50:509–517. [DOI] [PubMed] [Google Scholar]
- 31. Krag TO, Bogdanovich S, Jensen CJ, Fischer MD, Hansen‐Schwartz J, Javazon EH et al (2004) Heregulin ameliorates the dystrophic phenotype in mdx mice. Proc Natl Acad Sci U S A 101:13856–13860. [DOI] [PMC free article] [PubMed] [Google Scholar]
- 32. Lidov HG, Byers TJ, Kunkel LM (1993) The distribution of dystrophin in the murine central nervous system: an immunocytochemical study. Neuroscience 54:167–187. [DOI] [PubMed] [Google Scholar]
- 33. Love DR, Flint TJ, Genet SA, Middleton‐Price HR, Davies KE (1991) Becker muscular dystrophy patient with a large intragenic dystrophin deletion: implications for functional minigenes and gene therapy. J Med Genet 28:860–864. [DOI] [PMC free article] [PubMed] [Google Scholar]
- 34. Love DR, Hill DF, Dickson G, Spurr NK, Byth BC, Marsden RF et al (1989) An autosomal transcript in skeletal muscle with homology to dystrophin. Nature 339:55–58. [DOI] [PubMed] [Google Scholar]
- 35. Matsumura K, Ervasti JM, Ohlendieck K, Kahl SD, Campbell KP (1992) Association of dystrophin‐related protein with dystrophin‐associated proteins in mdx mouse muscle. Nature 360:588–591. [DOI] [PubMed] [Google Scholar]
- 36. Miike T, Sugino S, Ohtani Y, Taku K, Yoshioka K (1987) Vascular endothelial cell injury and platelet embolism in Duchenne muscular dystrophy at the preclinical stage. J Neurol Sci 82:67–80. [DOI] [PubMed] [Google Scholar]
- 37. Miura P, Thompson J, Chakkalakal JV, Holcik M, Jasmin BJ (2005) The utrophin A 5′‐untranslated region confers internal ribosome entry site‐mediated translational control during regeneration of skeletal muscle fibers. J Biol Chem 280:32997–33005. [DOI] [PubMed] [Google Scholar]
- 38. Neuwelt EA (2004) Mechanisms of disease: the blood‐brain barrier. Neurosurgery 54:131–140; discussion 141–132. [DOI] [PubMed] [Google Scholar]
- 39. Nico B, Frigeri A, Nicchia GP, Corsi P, Ribatti D, Quondamatteo F et al (2003) Severe alterations of endothelial and glial cells in the blood‐brain barrier of dystrophic mdx mice. Glia 42:235–251. [DOI] [PubMed] [Google Scholar]
- 40. Nielsen S, Nagelhus EA, Amiry‐Moghaddam M, Bourque C, Agre P, Ottersen OP (1997) Specialized membrane domains for water transport in glial cells: high‐resolution immunogold cytochemistry of aquaporin‐4 in rat brain. J Neurosci 17:171–180. [DOI] [PMC free article] [PubMed] [Google Scholar]
- 41. Norton WL, Hurd ER, Lewis DC, Ziff M (1968) Evidence of microvascular injury in scleroderma and systemic lupus erythematosus: quantitative study of the microvascular bed. J Lab Clin Med 71:919–933. [PubMed] [Google Scholar]
- 42. Perkins KJ, Basu U, Budak MT, Ketterer C, Baby SM, Lozynska O et al (2007) Ets‐2 repressor factor silences extrasynaptic utrophin by N‐box mediated repression in skeletal muscle. Mol Biol Cell 18:2864–2872. [DOI] [PMC free article] [PubMed] [Google Scholar]
- 43. Rubin LL, Staddon JM (1999) The cell biology of the blood‐brain barrier. Annu Rev Neurosci 22:11–28. [DOI] [PubMed] [Google Scholar]
- 44. Sbriccoli A, Santarelli M, Carretta D, Pinto F, Granato A, Minciacchi D (1995) Architectural changes of the cortico‐spinal system in the dystrophin defective mdx mouse. Neurosci Lett 200:53–56. [DOI] [PubMed] [Google Scholar]
- 45. Schaeffer L, De Kerchove d'Exaerde A, Changeux JP (2001) Targeting transcription to the neuromuscular synapse. Neuron 31:15–22. [DOI] [PubMed] [Google Scholar]
- 46. Sewry CA, Nowak KJ, Ehmsen JT, Davies KE (2005) A and B utrophin in human muscle and sarcolemmal A‐utrophin associated with tumours. Neuromuscul Disord 15:779–785. [DOI] [PubMed] [Google Scholar]
- 47. Sogos V, Curto M, Reali C, Gremo F (2002) Developmentally regulated expression and localization of dystrophin and utrophin in the human fetal brain. Mech Ageing Dev 123:455–462. [DOI] [PubMed] [Google Scholar]
- 48. Sweger EJ, Casper KB, Scearce‐Levie K, Conklin BR, McCarthy KD (2007) Development of hydrocephalus in mice expressing the G(i)‐coupled GPCR Ro1 RASSL receptor in astrocytes. J Neurosci 27:2309–2317. [DOI] [PMC free article] [PubMed] [Google Scholar]
- 49. Tao‐Cheng JH, Nagy Z, Brightman MW (1987) Tight junctions of brain endothelium in vitro are enhanced by astroglia. J Neurosci 7:3293–3299. [DOI] [PMC free article] [PubMed] [Google Scholar]
- 50. Tinsley J, Deconinck N, Fisher R, Kahn D, Phelps S, Gillis JM, Davies K (1998) Expression of full‐length utrophin prevents muscular dystrophy in mdx mice. Nat Med 4:1441–1444. [DOI] [PubMed] [Google Scholar]
- 51. Tinsley JM, Davies KE (1993) Utrophin: a potential replacement for dystrophin? Neuromuscul Disord 3:537–539. [DOI] [PubMed] [Google Scholar]
- 52. Tinsley JM, Potter AC, Phelps SR, Fisher R, Trickett JI, Davies KE (1996) Amelioration of the dystrophic phenotype of mdx mice using a truncated utrophin transgene. Nature 384:349–353. [DOI] [PubMed] [Google Scholar]
- 53. Deutekom JC, Janson AA, Ginjaar IB, Frankhuizen WS, Aartsma‐Rus A, Bremmer‐Bout M et al (2007) Local dystrophin restoration with antisense oligonucleotide PRO051. N Engl J Med 357:2677–2686. [DOI] [PubMed] [Google Scholar]
- 54. Weir AP, Burton EA, Harrod G, Davies KE (2002) A‐ and B‐utrophin have different expression patterns and are differentially up‐regulated in mdx muscle. J Biol Chem 277:45285–45290. [DOI] [PubMed] [Google Scholar]
- 55. Weir AP, Morgan JE, Davies KE (2004) A‐utrophin up‐regulation in mdx skeletal muscle is independent of regeneration. Neuromuscul Disord 14:19–23. [DOI] [PubMed] [Google Scholar]
Associated Data
This section collects any data citations, data availability statements, or supplementary materials included in this article.
Supplementary Materials
Figure S1. Validation of Utrn‐A and Utrn‐B antibody specificity using western blots and microdisceted brain capillaries. A. Western blot analysis of lysates containing 50 μg of total protein from mdx brain capillaries were probed with preimmune serum (lane 1), Utrn‐A affinity purified antibody (lane 2), and affinity purified antibody preadsorbed with excess Utrn‐A peptide (lane 3). Only blot incubated with Utrn‐A affinity purified antibody resulted in sharp band for Utrn‐A protein. B. Similarly, western blot probed with Utrn‐B affinity purified antibody showed sharp Utrn‐B protein band (lane 5). Bolts incubated with preimmune serum (lane 4) and affinity purified antibody preadsorbed with excess Utrn‐B peptide (lane 6) did not show Utrn‐B protein band. C. Validation of microdissection of brain capillaries. Merged image showing isolated brain capillaries immunolabeled with FITC‐conjugated lectin antibody (green channel) and co‐stained with DAPI (blue channel) as a positive control for brain capillary microdissection. For details of the procedure, see Materials and Methods. Scale bar, 25 μm.
Figure S2. Spatial and temporal changes in Utrn‐A and Utrn‐B immunolabeling in cultured astrocytes. Astrocytes isolated from mdx mouse were cultured on coverslips coated with poly‐L‐lysine for 24 and 72 h. They were immunolabeled with Utrn‐A and Urn‐B antibodies for the spatial and temporal changes in Utrn‐A and Utrn‐B expression (green channel). A. Astrocytes cultured for 24 h showed distinct Utrn‐A immunolabeling in astrocytes end‐feet (arrows) and weak staining in the cytoplasm. After 72 h of culture, Utrn‐A immunolabeling increased robustly in the astrocytes end‐feet, as well as in the cytoplasm. B. Astrocytes cultured for 24 h showed weak Utrn‐B immunolabeling in astrocytes end‐feet (arrows) and in the cytoplasm; however, after 72 h of culture, there was moderate increase in Utrn‐B labeling. Astrocytes were identified by S100‐positive labeling (red channel). C. Paxillin, a focal adhesion marker (red channel), was used to double label Utrn‐A and Utrn‐B in astrocytes focal adhesion points. A well‐established co‐localization was observed in Utrn‐A with paxillin (arrows) in the astrocytes and moderately with Utrn‐B (arrows). Scale bar, 100 μm.
Supporting data. Copy number calculation for Utrn‐A and ‐B.
Please note: Wiley‐Blackwell are not responsible for the content or functionality of any supporting materials supplied by the authors. Any queries (other than missing material) should be directed to the corresponding author for the article.
Supporting info item
Supporting info item
Supporting info item


