

Abstract
Recent studies revealed prominent cortical demyelination in patients with chronic multiple sclerosis (MS). Demyelination in white matter lesions is frequently accompanied by remyelination. This repair process, however, often remains incomplete and restricted to the lesion border. In the present study, we examined the frequency and extent of remyelination in cortical and white matter lesions in autopsy brain tissue of 33 patients with chronic MS. The majority of patients (29 of 33) harbored cortical demyelination. Remyelination of cortical lesions was identified light microscopically by the presence of thin and irregularly arranged myelin sheaths, and confirmed by electron microscopy. Extensive remyelination was found in 18%, remyelination restricted to the lesion border in 54%, and no remyelination in 28% of cortical lesions. A direct comparison of the extent of remyelination in white matter and cortical lesions of the same patients revealed that remyelination of cortical lesions was consistently more extensive. In addition, g‐ratios of fibers in areas of “normal appearing cortex” yielded values consistent with remyelination. Our data confirm the high prevalence of cortical demyelination in chronic MS and imply that the propensity to remyelinate is high in cortical MS lesions.
INTRODUCTION
Multiple sclerosis (MS) is the most common chronic disabling neurological disease of young adulthood. The characteristic pathological and radiological features of MS include multiple demyelinated lesions disseminated throughout the central nervous system (CNS). Histopathologically, MS lesions are characterized by demyelination, inflammation, relative axon preservation and gliosis (1, 24, 35). MS has traditionally been considered a disease of the white matter, and it is the pathology of white matter lesions that has been extensively studied (26, 35). However, the presence of MS lesions involving the gray matter has been shown in both pathologic (9, 15, 16, 28, 39, 40, 42, 46) and imaging studies (11, 13, 31). Nevertheless, primarily because of biased tissue sampling and insensitive staining techniques, the extent of cortical involvement in MS has been underestimated in the past.
Recent neuropathological studies revealed an important involvement of the cerebral cortex in MS patients when applying immunohistochemistry for myelin proteins to autopsy brain tissue (7, 22, 34). Different types of cortical lesions were proposed according to lesion topography including extensive subpial demyelination involving many adjacent gyri (7, 22, 34). Cortical lesions were found to be less inflammatory than white matter lesions (6). Axonal and dendritic transections as well as dying neurons were identified in cortical MS lesions (34). Recently, cortical lesions have been suggested to contribute to disease progression in MS (23).
Evidence for remyelination has been found in around 40% of chronic MS lesions in the white matter. However, remyelination mostly remains incomplete and restricted to the lesion edge (3, 10, 36). Remyelination already takes place during early stages of lesion formation, even when demyelination is still ongoing (25, 37, 38). In a proportion of patients, oligodendrocyte precursor cells seem to efficiently repopulate the lesion, differentiate and initiate remyelination (27). However, only few oligodendroglial cells are detected in chronic MS lesions (27, 33, 47). Recently, premyelinating oligodendrocytes that failed to establish contact with and to myelinate nearby axons have been described in chronic lesions (12). In the present study, we aimed at determining whether the localization of a demyelinated MS lesion in the gray vs. the white matter influenced its propensity to remyelinate.
MATERIAL AND METHODS
Brain tissue.
Brain autopsy samples of 33 MS patients and 10 controls without neurological disease and no neuropathological findings at brain autopsy were evaluated. Paraffin embedded MS and control tissue blocks were from the Institute of Neurology, McGill University, Montreal, Canada and the Institute of Neuropathology, University of Goettingen, Germany. At autopsy, brain samples from patients with a clinical diagnosis of MS were collected on the basis of macroscopically visible white matter lesions. The present study was approved by the ethics committee of the University of Goettingen, Germany.
Thirty‐three MS patients with long‐standing MS were studied to assess the frequency and extent of cortical and white matter demyelination and remyelination. A subset of 17 patients with frontal lobe tissue available was chosen to study cortical lesion topography and oligodendroglia density in detail (Table 1). The age of the 33 MS patients at the time of death ranged from 28 to 81 years (mean ± SD: 59.2 ± 11.5; median: 60 years) with a female to male ratio of 1:1.2. The mean disease duration was 17 years (mean ± SD: 17.8 ± 6.4, median: 20.5 years). Two patients harbored demyelinated lesions as an incidental finding at autopsy. No information on disease duration was available for four patients; in one patient, it remained uncertain. The clinical disease course was determined by a blinded chart review by one of the authors (JA), who was not involved in the morphological study, with an attempt to determine if a patient ever had a recorded clinical relapse. One patient was diagnosed with relapsing remitting, 11 patients with primary progressive, and 14 patients with secondary progressive disease. In seven patients with chronic MS, the disease course could not be determined (Table 1).
Table 1.
Clinical data and extent of cortical demyelination. Seventeen MS patients with frontal lobe blocks (*) were selected for detailed morphological studies. Abbreviations: F = female; M = male;? = questionable; PP = primary progressive; RR = relapsing remitting; SP = secondary progressive.
| Case | Age | Sex | Disease course | Disease duration (years) | Total cortical area examined (mm2) | Demyelinated cortical lesion area (mm2) | Remyelinated cortical lesion area (%) |
|---|---|---|---|---|---|---|---|
| 1 | 74 | F | ? | Incidental | 387.8 | 11.4 | 2.9 |
| 2* | 71 | F | ? | 20 | 319.6 | 109.9 | 34.4 |
| 3* | 49 | M | ? | ? | 115.9 | 15.7 | 13.6 |
| 4* | 66 | M | ? | ? | 683.0 | 29 | 4.2 |
| 5 | 38 | M | ? | ? | 152.7 | 3.1 | 2.0 |
| 6 | 63 | M | ? | Incidental | 395.5 | 117.1 | 29.6 |
| 7* | 66 | F | ? | 30 | 148.8 | 11.9 | 8 |
| 8 | 74 | M | PP | 10 | 110.7 | 29.6 | 26.8 |
| 9* | 57 | M | PP | 15 | 2335.4 | 171.5 | 7.4 |
| 10 | 45 | F | PP | 14 | 374.8 | 60.4 | 16.1 |
| 11 | 70 | F | PP | 7 | 713.1 | 40.5 | 5.7 |
| 12 | 57 | M | PP | 11 | 208.4 | 85.6 | 41.1 |
| 13* | 61 | F | PP | 19 | 979.1 | 87.2 | 8.9 |
| 14 | 51 | M | PP | 8 | 390.9 | 31.3 | 8.0 |
| 15* | 60 | F | PP | 14 | 459.7 | 130.6 | 28.4 |
| 16* | 59 | F | PP(?) | 9 | 247.7 | 25.6 | 10.3 |
| 17* | 60 | M | PP(?) | 10 | 664.5 | 148.2 | 22.3 |
| 18* | 52 | F | PP(?) | 8 | 454.3 | 0 | 0 |
| 19 | 35 | F | RR | 23 | 567.3 | 0 | 0 |
| 20 | 28 | F | SP | 4 | 301.5 | 14.1 | 4.7 |
| 21 | 69 | M | SP | 7 | 911.4 | 0 | 0 |
| 22* | 54 | M | SP | 11 | 359.6 | 1.7 | 0.5 |
| 23* | 70 | M | SP | 32 | 601.4 | 199.4 | 33.2 |
| 24* | 52 | M | SP | 16 | 310.1 | 16.7 | 5.4 |
| 25* | 63 | M | SP | 19 | 715.1 | 308.5 | 43.1 |
| 26 | 57 | M | SP | 12 | 129.4 | 31.0 | 24 |
| 27 | 53 | F | SP | 25(?) | 91.7 | 7.9 | 8.7 |
| 28 | 81 | F | SP | 36 | 234.7 | 0 | 0 |
| 29* | 61 | M | SP(?) | 36 | 668.5 | 222.8 | 33.3 |
| 30* | 66 | M | SP(?) | 44 | 303.5 | 13.9 | 4.6 |
| 31 | 71 | M | SP(?) | ? | 204.6 | 18.4 | 9 |
| 32* | 59 | F | SP(?) | 16 | 279.7 | 56.2 | 20.1 |
| 33 | 60 | F | SP(?) | 25 | 291.7 | 163.1 | 55.9 |
| Mean ± SD | 59.2 ± 11.5 | 17.8 ± 6.4 | 457.9 ± 409.7 | 65.5 ± 77.7 | 15.5 ± 14.9 |
The age of the selected subset of 17 MS patients at time of death was between 49 and 71 years (mean ± SD: 60.4 ± 6.3; median: 60 years; female to male ratio 1:1.4). Mean disease duration was 19.9 years (SD: ±10.7; median: 16 years; range: 8–44 years). Six patients had a primary progressive and seven patients a secondary progressive disease course. In four chronic cases, the disease course could not be deduced from the clinical files. Each of the 17 MS cases had up to three frontal lobe blocks. The 10 controls were age matched and between 40 and 73 years old at the time of death (mean ± SD: 59.3 ± 9.7 years; female to male ratio 1:2.3).
Neuropathological techniques and immunohistochemistry.
3–5 µm paraffin sections were stained with haematoxylin‐eosin, luxol fast blue/periodic‐acid Schiff and Bielschowsky’s silver impregnation for the assessment of inflammation, demyelination and axonal density, respectively. Myelination and oligodendroglia density was assessed by immunostaining with antibodies against myelin basic protein (MBP) and 2′, 3′‐cyclic nucleotide 3′‐phosphodiesterase (CNP). At least one tissue section with cortical lesions per case was immunostained for phosphorylated neurofilament (SMI31) to confirm axonal preservation in areas of cortical demyelination (for antibodies used see Table 2).
Table 2.
Antibodies used for immunohistochemistry. Abbreviations: MBP = myelin basic protein; CNP = 2′, 3′‐cyclic nucleotide 3′‐phosphodiesterase; PLP = proteolipid protein.
| Antigen | Antibody/clone | Dilution | Source |
|---|---|---|---|
| MBP | Cat. No. 1 118 099 | 1:500 | Boehringer Mannheim GmbH, Mannheim, Germany |
| CNP | SMI91 | 1:200 | Sternberger Monoclonals, Inc., Lutherville, MD, USA |
| PLP | plpc1 | 1:500 | Serotec, Oxford, England, UK |
| phosphorylated neurofilament | SMI31 | 1:10 000 | Sternberger Monoclonals, Inc. |
For immunohistochemistry, sections were deparaffinized, pretreated with microwaving (3 × 5 minutes at 800 W) in citric acid buffer (10 mM, pH 6.0) and blocked with 10% FCS/PBS (45). Primary antibodies were applied at the dilutions indicated (see Table 2) and incubated overnight at 4°C. After application of the biotinylated secondary antibody, avidin‐peroxidase (Dako, Glostrup, Denmark) was added and developed with 3, 3′‐diaminobenzidine hydrochloride (DAB, Sigma, St. Louis, MO, USA). Alternatively, an alkaline phosphatase/anti‐alkaline‐phosphatase‐based technique (APAAP, Dako) with Fast Red (Sigma) was used to visualise bound primary antibody. Sections from controls and MS patients were handled identically and simultaneously. Negative controls were performed by omitting the primary antibody and applying nonimmune sera or isotype control antibodies.
In situ hybridization.
In situ hybridization for proteolipid protein (PLP) mRNA was performed as described in detail earlier (8). Briefly, hybridization was performed using digoxigenin‐labeled riboprobes detected by AP‐conjugated anti‐digoxigenin Fab‐fragments. NBT/BCIP was used as chromogen. For immunohistochemistry after in situ hybridization, sections were incubated with anti‐PLP antibody and processed as described above. Sections were counterstained with hematoxylin.
Electron Microscopy.
Formalin fixed and paraffin embedded archival autopsy brain tissue was processed for electron microscopy. Areas identified on corresponding MBP‐immunostained sections were cut out of the paraffin blocks, deparaffinized and post‐fixed in glutaraldehyde followed by osmification and embedding in araldite. Quantitative analysis was performed on ultrathin sections of eight individuals [two controls, two MS patients with extensive cortical remyelination (RM), two MS patients with predominant cortical demyelination, and two MS patients with normal appearing cortex (NAC)]. Fiber thickness was measured at the lesser diameter, and the g‐ratio calculated [g‐ratio = axon diameter/axon diameter plus two times myelin sheath thickness (axon/fiber ratio)]. G‐ratios of consecutively photographed myelinated axons with axon diameters above 0.2 µm were obtained for each individual. A total of 200 fibers were measured in the control group (control 1: n = 100, control 2: n = 100), 196 in the RM group (RM 1: n = 152; RM 2: n = 44), and 246 in the NAC group (NAC 1:179; NAC 2:67). In demyelinated cortex, only single myelinated fibers were observed, and no g‐ratios were calculated. The Kruskal–Wallis analysis of variance followed by Dunn’s multiple comparison test was applied to compare g‐ratios between control cortex, remyelinated cortex and NAC. P < 0.05 was considered significant.
Image analysis.
To determine the extent of cortical demyelination, the cortical areas of a total of 91 MBP‐stained brain sections from the 29 MS patients with cortical lesions were scanned with a Color View digital camera (Soft Imaging System, Münster, Germany) mounted on an Olympus BX51 microcope (Olympus, Tokyo, Japan). The total cortical area and the area of cortical demyelination were measured using Analysis® software (Soft Imaging System GmbH, Münster, Germany). The Kruskal–Wallis analysis of variance was used to compare the extent of demyelination in the frontal, temporal, parietal and occipital lobes. P < 0.05 was considered significant.
Morphometry of immuolabeled cells.
MBP and CNP positive cells were counted in frontal lobe blocks of 10 control individuals, seven MS patients with remyelinated cortical lesions (RM), six MS patients with demyelinated cortical lesions (DM) and four MS patients with no apparent cortical pathology (NAC) using an ocular morphometric grid at a magnification of 400× (grid area: 62 500 µm2). The grid was randomly placed 10 times in the lesion center and 10 times at regular intervals at the lesion border. The mean oligodendroglial cell density of three lesions was determined in all patients except for one patient, where only one lesion was available. In total, 37 cortical MS lesions were analyzed. In control sections and sections without apparent cortical demyelination (“normal appearing cortex”), immunopositive cells were counted in 10 visual fields in cortical layers II–III and V–VI. A one‐way analysis of variance (ANOVA) with Bonferroni’s multiple comparison post‐test was used to compare densities of immunolabeled cells between the different groups; P < 0.05 was considered significant.
Extent of remyelination.
The extent of remyelination of white matter and cortical MS lesions was assessed on MBP‐immunostained sections applying the following semiquantitative score: (0) no remyelination (0% of lesion area remyelinated), (1) little remyelination restricted to the lesion border (up to 20% of lesion area remyelinated), (2) substantial remyelination, either confluent or patches of remyelination (21%–60% of lesion area remyelinated), and (3) nearly complete remyelination (61%–99% of lesion area remyelinated). An average score value was calculated per patient. Remyelination at the light microscopical level was judged by the irregular arrangement, often in patches, and lower density of MBP‐positive fibers compared with control gray matter (10, 19). All lesions were readily identifiable by low magnification light microscopy. Areas of NAC were not included in the analysis. The Mann–Whitney‐U test was applied to compare remyelination scores of cortex and white matter.
Statistical analysis.
Statistica 6.0 (StatSoft, Inc. Tulsa, OK, USA) software was used for all statistical calculations.
RESULTS
Extent and topography of cortical demyelination in chronic MS.
Immunohistochemistry for MBP revealed well‐delineated demyelinated cortical gray matter lesions (Figure 1A). In 180 tissue blocks of 33 MS cases, more than 200 cortical lesions were identified. 29/33 patients (88%) harbored cortical lesions. On average, 15.5% of the cortical gray matter area was demyelinated, ranging from 0% to 56% (Table 1). Cortical demyelination was slightly more extensive in the frontal and temporal lobes (frontal lobe: on average 17% of cortical area demyelinated; temporal lobe: 19%) compared with the parietal and occipital lobes (parietal lobe: 12%; occipital lobe: 8%). On average, 26% of the insular cortex was found to be demyelinated. However, these differences did not reach statistical significance.
Figure 1.
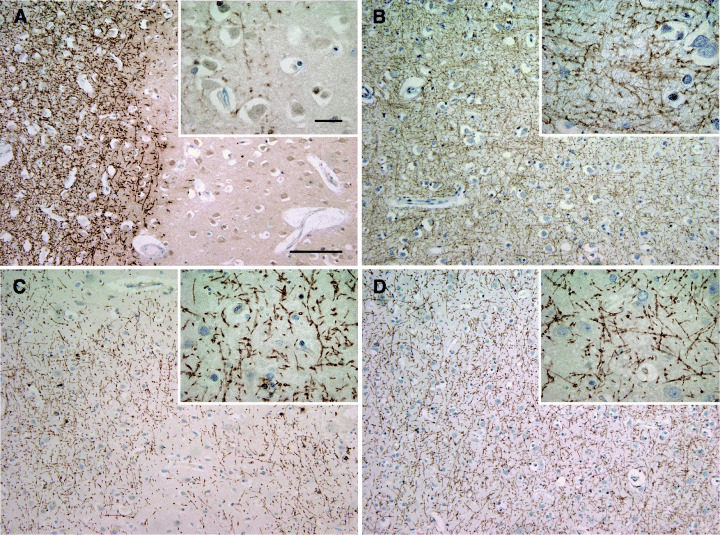
Demyelinated and remyelinated multiple sclerosis (MS) cortex. Demyelinated cortical MS lesion. A sharp border separates well‐preserved myelin from demyelinated cortex (A). Control cortex with intact myelin (B). Cortical demyelinated lesion with patches of irregular myelin incompletely covering the lesion area (C). Normal appearing MS cortex. The myelin forms a dense mesh and is indistinguishable from non‐MS cortex (D). A–D: immunohistochemistry for myelin basic protein; blue nuclear staining: hematoxylin; scale bars: A–D: 200 µm, A–D inset: 20 µm.
The topography of cortical lesions was examined in 13/17 patients with frontal cortical lesions (Table 1) and classified according to Peterson et al (34). Leukocortical junction lesions (type 1 lesions) encompassed 10% (7/72) of all cortical lesions identified. Intracortical type 2 lesions constituted 26% (19/72) of the cortical lesions in our study. Subpial type 3 lesions extending from the subpial brain surface to the external pyramidal layer or even the multiform layer were by far the most common in our study (64%; 46/72). In a subset of patients (3/13), general subpial demyelination characterized by ribbon‐like subpial demyelination without definite lesion borders at the margins of the sections was observed (7). The extent of cortical demyelination was significantly higher in patients with a disease duration of more than 10 years (% of demyelinated cortical area, disease duration >10 years (n = 21): 20.1 ± 16.1 (mean ± D); disease duration <10 years (n = 6): 4.8 ± 4.2; P = 0.006) (Table 1).
Remyelination of cortical MS lesions.
Frontal lobe sections of 17 MS cases (see Table 1) were evaluated in detail to assess remyelination in the cortex. 13/17 MS patients revealed cortical demyelination as described above, the remaining four did not reveal cortical demyelination in the frontal lobe; however, they harbored cortical lesions in other brain regions. Control brains did not show any cortical demyelination (Figure 1B). Some cortical demyelinated lesions had very sharp lesion borders (Figure 1A), whereas others showed a small rim or patches of loosely arranged myelin in MBP immunohistochemistry at the lesion border (Figure 1C). These cortical areas with irregular, punctuate, less densely and less orderly arranged myelin were judged remyelinated by light microscopical appearance (10, 19) (Figure 1C).
For electron microscopy and oligodendroglia counts, the subset of 17 MS patients with frontal lobe tissue available was divided into three groups according to the presence or absence of remyelinated cortical lesions as assessed by light microscopy. The first group (DM; n = 6) consisted of patients with demyelinated cortical lesions without apparent remyelination (Figure 1A). The second group harbored patients where most of the lesions showed thinly myelinated fibers at the lesion border or patches of irregular myelin throughout the lesion suggestive of remyelination (RM, n = 7) (Figure 1C). The third group contained MS patients without apparent cortical demyelination (“normal appearing cortex”; NAC, n = 4; Figure 1D). Results were compared with 10 age matched control individuals.
Electron microscopy reveals thin myelin sheaths in remyelinated cortical lesions.
Ultrastructural investigations were performed on two cases each of the above defined groups (2 DM, 2 RM, 2 NAC and 2 controls). The quotient axon/fiber diameter known as g‐ratio is frequently used to assess remyelination in human and experimental tissue (14, 18, 20, 41). Remyelinated fibers are characterized by thinner myelin sheaths; thus, an increased g‐ratio is indicative of remyelination. In control cortex, we observed abundant fibers with intact myelin sheaths [g‐ratio (control): mean ± SD: 0.65 ± 0.09; Figure 2A,D]. Demyelinated cortex (DM) showed only occasional axons with myelin sheaths (g‐ratio not calculated). In cortical areas judged remyelinated by light microscopy (RM) we found thinly myelinated axons [g‐ratio (RM): mean ± SD: 0.76 ± 0.07; Figure 2B,D] indicating remyelination on the electron microscopical level. G‐ratios between control cortex and remyelinated cortex (RM) were significantly different (Kruskal–Wallis; P < 0.001). Unexpectedly, myelin sheaths in areas of NAC in MS also appeared thin by electron microscopy (Figure 2C), and g‐ratios were significantly higher compared with controls (g‐ratio (NAC): 0.72 ± 0.09; control vs. NAC: P < 0.001; NAC vs. RM: P < 0.001; Figure 2D). These electron microscopic data confirm the presence of remyelination in cortical lesions and suggest that part of the NAC in MS may in fact be remyelinated.
Figure 2.
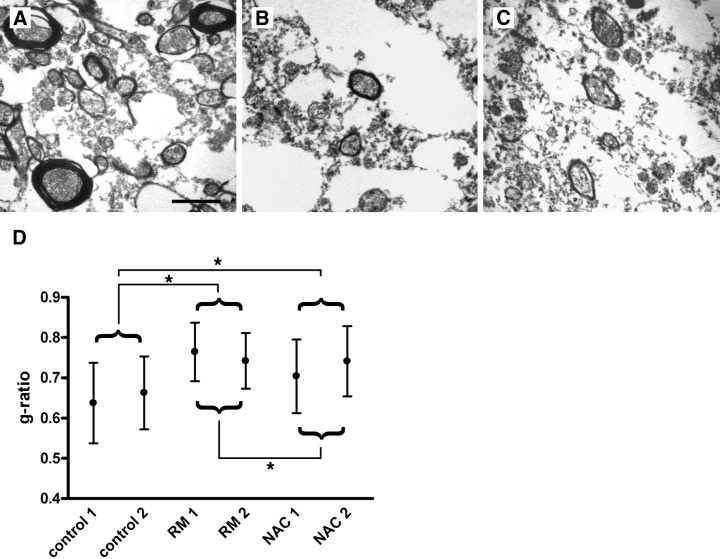
Ultrastructural evidence for cortical remyelination in multiple sclerosis (MS). Representative electron micrographs of control cortex (A), a cortical lesion with light microscopical evidence for remyelination (B), and normal appearing MS cortex (C). In control cortex, myelin sheaths of regular thickness enwrap the axons (A). Thin myelin sheaths indicative of remyelination are detected in (B). Myelin sheaths of cortical fibers from areas of NAC show a thickness similar to that observed in remyelinated lesions (C). Axon to fiber (= g‐) ratios were determined in cortical lesions judged remyelinated by light microscopy [remyelination (RM); n = 2 MS patients] and normal appearing cortex (NAC; n = 2 MS patients), and compared with control cortex (n = 2). In RM and NAC cases, thinly myelinated fibers yielded higher g‐ratios as quantitative evidence for remyelination (RM vs. control: P < 0.001; NAC vs. control: P < 0.001; RM vs. NAC: P < 0.001; Kruskal–Wallis). Formalin‐fixed, paraffin‐embedded human brain tissue embedded for electron microscopy; scale bars: A–C: 2 µm.
Oligodendroglial cells are abundant in remyelinated cortical lesions.
Myelin protein expression in oligodendroglial cells was examined by immunohistochemistry for MBP and CNP and in situ hybridization for PLP mRNA (Figure 3A–D) in 37 cortical lesions, NAC, and control cortex in 17 MS patients and 10 controls. No significant differences in cell densities were found between control cortex and NAC (MBP: control: 22.8 ± 15 cells/mm2 (mean ± SD); NAC: 20.8 ± 14.8 cells/mm2; CNP: control: 38.5 ± 11.5 cells/mm2; NAC: 29 ± 19.5 cells/mm2). Centers and borders of cortical lesions were evaluated separately (see Materials and methods). Oligodendroglia numbers were very low in the demyelinated centers of lesions with or without remyelinated lesion borders, and cell counts were pooled (Figure 3E,F). Remyelinated cortical lesions harbored an increased number of both MBP and CNP positive cells at the lesion border (Figure 3A,B,E,F) (MBP: RM border: 62.2 ± 37.5 cells/mm2 (control vs. RM border: P < 0.01; NAC vs. RM border: P < 0.05; ANOVA); CNP: RM border: 79.6 ± 29.3 cells/mm2 (control and NAC vs. RM border: P < 0.01)). In situ hybridization for PLP mRNA confirmed higher numbers of myelinating cells at the border of remyelinated lesions (Figure 3C) compared with NAC (Figure 3D). In contrast, cortical lesions without evidence for remyelination showed low numbers of MPB positive oligodendrocytes at the lesion border (DM border: 12.9 ± 15.5 cells/mm2; control and NAC vs. DM border: NS). However, at the border of these demyelinated cortical lesions and similar to remyelinated lesions, numerous CNP‐positive cells were detectable, indicating the presence of cells of the oligodendrocyte lineage (CNP: DM border: 62.9 ± 24.5; RM border: 79.6 ± 29.3; DM border vs. RM border: NS; control and NAC vs. DM border: NS; control and NAC vs. RM border: P < 0.01).
Figure 3.
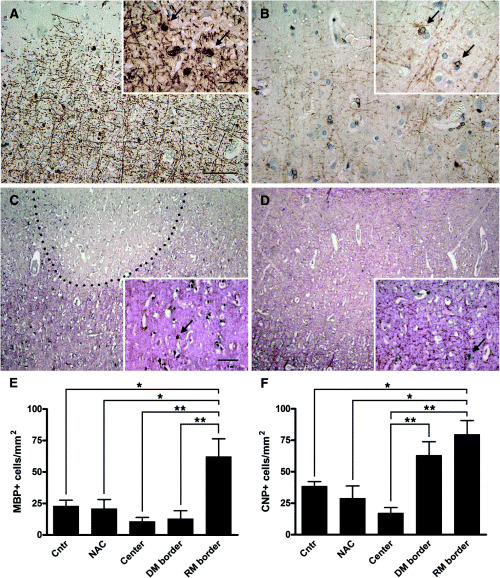
Oligodendroglia in cortical multiple sclerosis (MS) lesions. Myelin basic protein (MBP) expressing oligodendroglia at the border of a cortical lesion (A; arrows). 2′, 3′‐cyclic nucleotide 3′‐phosphodiesterase (CNP) expressing cells in an adjacent section (B; arrows). In situ hybridization for proteolipid protein (PLP) of a cortical lesion (C) and adjacent normal appearing cortex (NAC) (D) in the same patient. Numerous PLP mRNA‐positive cells line the remyelinated border of a cortical MS lesion (C; arrow). In the NAC, only few PLP mRNA‐positive cells are detected (D; arrow). Quantitation of MBP (E) and CNP (F) positive oligodendroglial cells in demyelinated and remyelinated cortical lesions. The density of MBP‐positive oligodendrocytes is significantly higher at the remyelinated lesion border of cortical lesions compared with control cortex (P < 0.01), normal appearing cortex (P < 0.05), lesion center (P < 0.001), and border of cortical lesions without signs of remyelination (P < 0.001). Similarly, the density of CNP positive cells is significantly higher at the remyelinated lesion border of cortical lesions compared with control cortex (P < 0.01), normal appearing cortex (P < 0.01), and the lesion center (P < 0.001). Of note, many CNP‐positive cells were observed at the border of demyelinated lesions without evidence for remyelination (F). C,D: in situ hybridization for PLP mRNA (black) with immunohistochemistry for PLP protein (red); scale bars: A–D: 200 µm, A,B inset: 20 µm; C,D inset: 100 µm. Abbreviations: center = demyelinated center of lesions with and without remyelinated lesion border; cntr = control cortex; DM border = border of demyelinated lesions without evidence for remyelination; RM border = remyelinated lesion border. Statistical analysis: one‐way ANOVA with Bonferroni’s multiple comparison test.
Comparison of white matter and cortical remyelination.
The extent of remyelination of lesions in the cortical gray and the white matter was compared using the same semiquantitative score for both gray and white matter lesions: (0) no remyelination: demyelinated cortical or white matter lesions with sharp lesion borders (Figure 4A,B); (1) remyelination restricted to the border of the lesions (up to 20% of lesion area remyelinated; Figure 4C,D); (2) substantial, but patchy remyelination throughout the lesion (21%–60% of lesion area remyelinated; Figure 4E,F); (3) almost complete remyelination (61%–99% of lesion area remyelinated; Figure 4G,H). In total, 246 white matter and 217 cortical lesions were scored in 33 MS patients. An average score for remyelination of cortical and white matter lesions was calculated per patient. Applying the above described scoring system, cortical lesions yielded a significantly higher degree of remyelination than white matter lesions (WM lesions: n = 31, median: 1.3; interquartile range: 1.26; cortical lesions: n = 29; median: 2.0; interquartile range: 0.85; Mann–Whitney‐U: P = 0.0013; Figure 5A). On a case per case basis, cortical remyelination was found to be more extensive than white matter remyelination in 27/29 MS patients (Figure 5B). No difference in the extent of cortical gray and white matter remyelination was observed between secondary progressive and primary progressive MS patients.
Figure 4.

Remyelination in white and cortical gray matter. White matter lesions (A, C, E, G) without remyelination (A), a thin rim of remyelination at the lesion border (C), substantial remyelination (E), and nearly complete remyelination (G). Cortical gray matter (B, D, F, H) with complete demyelination (B), thin remyelination at the edge of the cortical plaque (D), substantial remyelination (F) and nearly complete remyelination (H). Immunohistochemistry for myelin basic protein; blue nuclear staining: hematoxylin; scale bars: A–H: 500 µm, A–H inset: 100 µm.
Figure 5.
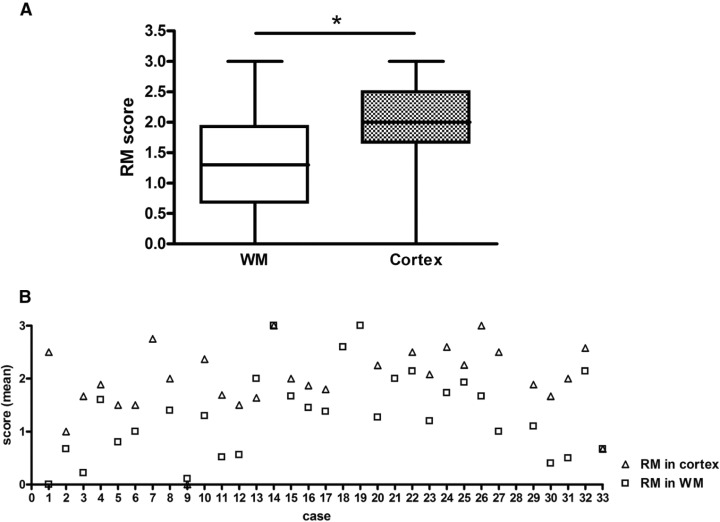
Extent of cortical and white matter (WM) remyelination. The extent of cortical and WM remyelination is assessed using the semiquantitative score illustrated in Figure 4: (0) no remyelination, (1) little remyelination at the lesion border, (2) substantial remyelination, either confluent or patches of remyelination, and (3) nearly complete remyelination. 246 white and 217 gray matter lesions in the same patients were examined. Remyelination was found to be more extensive in cortical than WM lesions (A; Mann–Whitney‐U; P = 0.0013). On an individual basis, remyelination of cortical lesions was judged more extensive in 27/29 patients (open squares: WM; open triangles: cortex). Values on the y‐axis represent average scores of remyelination obtained by assessing all WM and cortical lesions of an individual patient (B). Patient 7 had no WM lesions, patients 18, 19, and 21 had no apparent cortical lesions (NAC), and patient 28 with spinal cord involvement had no lesions in the brain tissue samples available.
DISCUSSION
In the present study on patients with long standing MS, we found evidence for remyelination in cortical MS lesions on the light and electron microscopical levels. Our ultrastructural results on the normal appearing MS cortex furthermore generated evidence for remyelination even in areas judged normal by light microscopy. Comparing the extent of remyelination in a large set of lesions from 29 MS patients, a higher propensity towards remyelination was observed in cortical than white matter lesions. Our data thus imply that the remyelinative capacity is high in cortical MS lesions.
We found cortical lesions with signs of remyelination in more than 95% (28/29) of patients with long standing MS. Remyelination was assessed by two independent methods: on the light microscopical level, MBP immunohistochemistry revealed irregularly arranged myelin sheaths of reduced density (10, 19). On electron micrographs of cortical areas judged remyelinated by light microscopy, thin myelin sheaths indicative of remyelination were found, thus yielding g‐ratios (axon/fiber diameter) above normal (5, 14, 20). Unexpectedly, electron microscopy of MS cortical gray matter judged normal by light microscopy similarly yielded higher g‐ratios than control gray matter. Thus, a proportion of normal appearing cortical gray matter in MS patients may in fact be remyelinated.
We detected cortical demyelination in 88% (29/33) of our patients with chronic MS and could thus confirm and extend previous findings (7, 22, 34). The majority of lesions were located subpially suggesting the presence of demyelinating mediators in the cerebrospinal fluid. In accordance with previous studies, no consistent association between subpial cortical demyelination and meningeal infiltrations of T‐ and B‐lymphocytes, plasma cells and macrophages could be established (data not shown) (6). Interestingly, cortical demyelination was more extensive in patients with long disease duration. This might be explained by an accumulation of demyelinating activity in the cerebrospinal fluid or an increased susceptibility of subpial tissue to demyelination with longer disease duration. Alternatively and supported by our electron microscopic findings, remyelination of cortical lesions in early disease stages may be extremely fast and efficient, and thus escape routine light microscopic analysis. This hypothesis is also supported by experimental studies indicating a decreased remyelinative potential of oligodendroglia after several attacks of demyelination and with increasing age (21, 43, 44). In addition, a new EAE model of focal cortical demyelination that was recently established in our group, confirmed the rapid and effective myelin repair in the cortex (29).
Studying more than 200 white matter and cortical lesions from 33 MS patients, we show that the extent of remyelination is consistently higher in cortical than in white matter lesions. The reasons for the pronounced cortical remyelination observed in our study are not clear. Around 40% of white matter lesions showed signs of remyelination in a series of autopsy cases, albeit incomplete and often restricted to the lesion edge (3). Similarly, we found remyelination of cortical lesions to be more pronounced at the lesion edge. A smaller diameter of cortical lesions might thus favor their repopulation with myelinating cells and contribute to the higher remyelination scores observed in cortical as compared with white matter lesions.
In the present study, the majority (23/28) of patients with cortical remyelination showed increased numbers of MBP and CNP positive cells at the lesion borders compared with control and NAC. MBP protein is only rarely observed in the perinuclear cytoplasm of nonmyelinating oligodendroglia in the white matter, but is regularly found during myelination and remyelination (33). The presence of high numbers of MBP‐positive oligodendrocytes in areas of irregularly arranged myelin sheaths of low density thus serves as further evidence for ongoing remyelination. However, in this study, we detected low numbers of MBP‐positive cells also in control cortex, suggesting that myelin protein synthesis in cortical and white matter oligodendroglia may be differentially regulated.
At the borders of demyelinated cortical lesions, relatively high numbers of CNP, but not MBP‐positive cells were detected. This implies that cells of the oligodendrocyte lineage are present, but apparently do not progress to remyelination. Recently, the presence of abundant “premyelinating oligodendrocytes” in MS lesions and their inability to remyelinate these lesions have been documented (12). In chronic cortical lesions, little axonal loss, gliosis and microglia activation are observed suggesting that other, as yet unknown factors are responsible for impeding oligodendrocytic remyelination. In our study, densities of MBP and CNP positive cells are low in the centers of lesions both with and without remyelinated border indicating that in addition to oligodendrocytic differentiation, also migration may be impaired. Our finding that oligodendroglia numbers are not elevated in the normal appearing compared with control cortex does not argue against late stages of remyelination, given that completely remyelinated white matter “shadow plaques” harbor oligodendroglia densities at or below the level of control white matter (27, 30).
A lack of appropriate growth factors, a depletion of oligodendrocyte progenitor cells, impaired progenitor differentiation, extensive gliosis and a lack of axon permissiveness have been brought forward as factors impeding remyelination (17). In the gray matter, the distinct microenvironment could modulate the response of oligodendrocyte precursor cells to inflammatory demyelination (2). Alternatively, oligodendrocyte precursor populations with distinct physiological properties may reside in the cortex (32). Furthermore, neuronal activity has been reported to enhance oligodendrocyte precursor proliferation (4). Last but not least, the less destructive lesion pathology observed in cortical gray matter demyelination could lead to a higher number of preserved axons, more preserved oligodendrocyte precursor cells and a greater propensity towards remyelination.
In summary, we found evidence for widespread demyelination in the cortex of chronic MS patients with long‐standing disease. Remyelination was frequently observed and more pronounced in cortical than white matter lesions. Oligodendroglia numbers were high in areas of cortical remyelination. Further studies directed at elucidating the interactions between neurons/axons and oligodendroglia may lead to an improved understanding of the mechanisms favoring remyelination in the cortex.
ACKNOWLEDGMENTS
The authors wish to thank Doris Bode, Jutta Laufenberg and Brigitte Maruschak for expert technical assistance. WB and CS are supported by the Gemeinnützige Hertie‐Stiftung. CS is supported by the medical faculty of the University of Goettingen (junior research group).
REFERENCES
- 1. Allen IV (1991) Pathology of multiple sclerosis. In: Mcalpine’s Multiple Sclerosis. Matthews WB (ed.), pp. 341–378. Churchill Livingstone: Edinburgh. [Google Scholar]
- 2. Baracskay KL, Duchala CS, Miller RH, Macklin WB, Trapp BD (2002) Oligodendrogenesis is differentially regulated in gray and white matter of jimpy mice. J Neurosci Res 70:645–654. [DOI] [PubMed] [Google Scholar]
- 3. Barkhof F, Bruck W, De Groot CJ, Bergers E, Hulshof S, Geurts J, Polman CH, Van Der Valk P (2003) Remyelinated lesions in multiple sclerosis: magnetic resonance image appearance. Arch Neurol 60:1073–1081. [DOI] [PubMed] [Google Scholar]
- 4. Barres BA, Raff MC (1993) Proliferation of oligodendrocyte precursor cells depends on electrical activity in axons. Nature 361:258–260. [DOI] [PubMed] [Google Scholar]
- 5. Blakemore WF (1973) Remyelination of the superior cerebellar peduncle in the mouse following demyelination induced by feeding cuprizone. J Neurol Sci 20:73–83. [DOI] [PubMed] [Google Scholar]
- 6. Bo L, Vedeler CA, Nyland H, Trapp BD, Mork SJ (2003) Intracortical multiple sclerosis lesions are not associated with increased lymphocyte infiltration. Mult Scler 9:323–331. [DOI] [PubMed] [Google Scholar]
- 7. Bo L, Vedeler CA, Nyland HI, Trapp BD, Mork SJ (2003) Subpial demyelination in the cerebral cortex of multiple sclerosis patients. J Neuropathol Exp Neurol 62:723–732. [DOI] [PubMed] [Google Scholar]
- 8. Breitschopf H, Suchanek G, Gould RM, Colman DR, Lassmann H (1992) In situ hybridization with digoxigenin‐labeled probes: sensitive and reliable detection method applied to myelinating rat brain. Acta Neuropathol 84:581–587. [DOI] [PubMed] [Google Scholar]
- 9. Brownell B, Hughes JT (1962) Distribution of plaques in the cerebrum in multiple sclerosis. J Neurol Neurosurg Psychiatry 25:315–320. [DOI] [PMC free article] [PubMed] [Google Scholar]
- 10. Bruck W, Kuhlmann T, Stadelmann C (2003) Remyelination in multiple sclerosis. J Neurol Sci 206:181–185. [DOI] [PubMed] [Google Scholar]
- 11. Catalaa I, Fulton JC, Zhang X, Udupa JK, Kolson D, Grossman M, Wei L, McGowan JC, Polansky M, Grossman RI (1999) MR imaging quantitation of gray matter involvement in multiple sclerosis and its correlation with disability measures and neurocognitive testing. AJNR Am J Neuroradiol 20:1613–1618. [PMC free article] [PubMed] [Google Scholar]
- 12. Chang A, Tourtellotte WW, Rudick R, Trapp BD (2002) Premyelinating oligodendrocytes in chronic lesions of multiple sclerosis. N Engl J Med 346:165–173. [DOI] [PubMed] [Google Scholar]
- 13. Chen JT, Narayanan S, Collins DL, Smith SM, Matthews PM, Arnold DL (2004) Relating neocortical pathology to disability progression in multiple sclerosis using MRI. Neuroimage 23: 1168–1175. [DOI] [PubMed] [Google Scholar]
- 14. Coetzee T, Fujita N, Dupree J, Shi R, Blight A, Suzuki K, Suzuki K, Popko B (1996) Myelination in the absence of galactocerebroside and sulfatide: normal structure with abnormal function and regional instability. Cell 86:209–219. [DOI] [PubMed] [Google Scholar]
- 15. Dawson JW (1916) The histology of multiple sclerosis. Trans Roy Soc Edinburgh 50:517–740. [Google Scholar]
- 16. Dinkler (1904) Zur Kasuistik der multiplen Herdsklerose des Gehirns und Rückenmarks. Deutsche Zeitschrift für Nervenheilkunde 3:233–247. [Google Scholar]
- 17. Franklin RJ (2002) Why does remyelination fail in multiple sclerosis? Nat Rev Neurosci 3:705–714. [DOI] [PubMed] [Google Scholar]
- 18. Friede RL, Beuche W (1985) A new approach toward analyzing peripheral nerve fiber populations. I. Variance in sheath thickness corresponds to different geometric proportions of the internodes. J Neuropathol Exp Neurol 44:60–72. [DOI] [PubMed] [Google Scholar]
- 19. Gledhill RF, Harrison BM, McDonald WI (1973) Pattern of remyelination in the CNS. Nature 244:443–444. [DOI] [PubMed] [Google Scholar]
- 20. Hildebrand C, Remahl S, Persson H, Bjartmar C (1993) Myelinated nerve fibres in the CNS. Prog Neurobiol 40:319–384. [DOI] [PubMed] [Google Scholar]
- 21. Johnson ES, Ludwin SK (1981) The demonstration of recurrent demyelination and remyelination of axons in the central nervous system. Acta Neuropathol (Berl) 53:93–98. [DOI] [PubMed] [Google Scholar]
- 22. Kidd D, Barkhof F, McConnell R, Algra PR, Allen IV, Revesz T (1999) Cortical lesions in multiple sclerosis. Brain 122:17–26. [DOI] [PubMed] [Google Scholar]
- 23. Kutzelnigg A, Lucchinetti CF, Stadelmann C, Bruck W, Rauschka H, Bergmann M, Schmidbauer M, Parisi JE, Lassmann H (2005) Cortical demyelination and diffuse white matter injury in multiple sclerosis. Brain 128:2705–2712. [DOI] [PubMed] [Google Scholar]
- 24. Lassmann H (1998) Pathology of multiple sclerosis. In: McAlpine’s Multiple Sclerosis. Compston A (ed.), pp. 323–358. Churchill Livingstone: London. [Google Scholar]
- 25. Lassmann H, Bruck W, Lucchinetti C, Rodriguez M (1997) Remyelination in multiple sclerosis. Mult Scler 3:133–136. [DOI] [PubMed] [Google Scholar]
- 26. Lassmann H, Bruck W, Lucchinetti C (2001) Heterogeneity of multiple sclerosis pathogenesis: implications for diagnosis and therapy. Trends Mol Med 7:115–121. [DOI] [PubMed] [Google Scholar]
- 27. Lucchinetti C, Bruck W, Parisi J, Scheithauer B, Rodriguez M, Lassmann H (1999) A quantitative analysis of oligodendrocytes in multiple sclerosis lesions. A study of 113 cases. Brain 122:2279–2295. [DOI] [PubMed] [Google Scholar]
- 28. Lumsden CE (1970) The neuropathology of multiple sclerosis. In: Multiple Sclerosis and Other Demyelinating Diseases. Vinken PJ, Bruyn GW (eds), pp. 217–309. North‐Holland Publishing Company: Amsterdam. [Google Scholar]
- 29. Merkler D, Ernsting T, Kerschensteiner M, Bruck W, Stadelmann C (2006) A new focal EAE model of cortical demyelination: multiple sclerosis‐like lesions with rapid resolution of inflammation and extensive remyelination. Brain May 19 [Epub ahead of print. [DOI] [PubMed]
- 30. Mews I, Bergmann M, Bunkowski S, Gullotta F, Bruck W (1998) Oligodendrocyte and axon pathology in clinically silent multiple sclerosis lesions. Mult Scler 4:55–62. [DOI] [PubMed] [Google Scholar]
- 31. Newcombe J, Hawkins CP, Henderson CL, Patel HA, Woodroofe MN, Hayes GM, Cuzner ML, MacManus D, Du Boulay EP, McDonald WI (1991) Histopathology of multiple sclerosis lesions detected by magnetic resonance imaging in unfixed postmortem central nervous system tissue. Brain 114:1013–1023. [DOI] [PubMed] [Google Scholar]
- 32. Noble M, Arhin A, Gass D, Mayer‐Proschel M (2003) The cortical ancestry of oligodendrocytes: common principles and novel features. Dev Neurosci 25:217–233. [DOI] [PubMed] [Google Scholar]
- 33. Ozawa K, Suchanek G, Breitschopf H, Bruck W, Budka H, Jellinger K, Lassmann H (1994) Patterns of oligodendroglia pathology in multiple sclerosis. Brain 117:1311–1322. [DOI] [PubMed] [Google Scholar]
- 34. Peterson JW, Bo L, Mork S, Chang A, Trapp BD (2001) Transected neurites, apoptotic neurons, and reduced inflammation in cortical multiple sclerosis lesions. Ann Neurol 50:389–400. [DOI] [PubMed] [Google Scholar]
- 35. Prineas JW (1985) The neuropathology of multiple sclerosis. In: Demyelinating Diseases. JC Koetsier (ed.), pp. 337–398. Elsevier Science Publishers: Amsterdam. [Google Scholar]
- 36. Prineas JW, Connell F (1979) Remyelination in multiple sclerosis. Ann Neurol 5:22–31. [DOI] [PubMed] [Google Scholar]
- 37. Prineas JW, Barnard RO, Kwon EE, Sharer LR, Cho ES (1993) Multiple sclerosis: remyelination of nascent lesions. Ann Neurol 33:137–151. [DOI] [PubMed] [Google Scholar]
- 38. Raine CS, Wu E (1993) Multiple sclerosis: remyelination in acute lesions. J Neuropathol Exp Neurol 52:199–204. [PubMed] [Google Scholar]
- 39. Rossolimo G (1897) Zur Frage über die Multiple Sklerose und Gliose. Deutsche Zeitschrift für Nervenheilkunde XI:88–121. [Google Scholar]
- 40. Sander M (1898) Hirnrindenbefunde bei multipler Sklerose. Monatschrift Psychiatrie Neurol IV:429–436. [Google Scholar]
- 41. Schmitt FO, Bear RS (1937) The optical properties of vertebrate nerve axons as related to fibre size. J Cell Comp Physiol 9:261–273. [Google Scholar]
- 42. Schwab C, McGeer PL (2002) Complement activated C4d immunoreactive oligodendrocytes delineate small cortical plaques in multiple sclerosis. Exp Neurol 174:81–88. [DOI] [PubMed] [Google Scholar]
- 43. Shields SA, Gilson JM, Blakemore WF, Franklin RJ (1999) Remyelination occurs as extensively but more slowly in old rats compared to young rats following gliotoxin‐induced CNS demyelination. Glia 28:77–83. [DOI] [PubMed] [Google Scholar]
- 44. Sim FJ, Zhao C, Penderis J, Franklin RJ (2002) The age‐related decrease in CNS remyelination efficiency is attributable to an impairment of both oligodendrocyte progenitor recruitment and differentiation. J Neurosci 22:2451–2459. [DOI] [PMC free article] [PubMed] [Google Scholar]
- 45. Stadelmann C, Kerschensteiner M, Misgeld T, Bruck W, Hohlfeld R, Lassmann H (2002) BDNF and gp145trkB in multiple sclerosis brain lesions: neuroprotective interactions between immune and neuronal cells? Brain 125:75–85. [DOI] [PubMed] [Google Scholar]
- 46. Taylor EW (1892) Zur pathologischen Anatomie der multiplen Sklerose. Deutsche Zeitschrift für Nervenheilkunde 5:1–26. [Google Scholar]
- 47. Wolswijk G (1994) Chronic stage multiple sclerosis lesions contain a relatively quiescent population of oligodendrocyte precursor cells. J Neurosci 18:601–609. [DOI] [PMC free article] [PubMed] [Google Scholar]