

Abstract
Hypobaric hypoxia can produce neuropsychological disorders such as insomnia, dizziness, memory deficiencies, headache and nausea. Here we report the changes in adrenomedullin (AM) expression observed in rats exposed to hypobaric hypoxia and different times of reoxygenation. AM immunoreactivity was transiently elevated in the cerebral cortex after 7 h of exposure to a simulated altitude of 8325 m (27 000 ft). This higher expression was seen in all pyramidal cells and in a subset of small interneurons. AM‐positive nonpyramidal neurons contained also calbindin and calretinin, but no parvalbumin immunoreactivity, thus identifying them as bipolar and double bouquet cells. Small blood vessels and related astroglia also became immunoreactive following the hypobaric insult. AM up‐regulation decreased progressively with the time of reoxygenation, reaching almost control levels after 5 days. Real‐time PCR quantification of AM mRNA and Western blotting confirmed the up‐regulation of AM expression following hypobaria. In addition, hypobaria modulates alternative splicing of the AM gene resulting in a higher production of AM. Our data show that AM expression regulation constitutes a cortical response to hypobaria, suggesting that AM modulation may provide new therapeutic avenues to prevent and/or treat the symptoms produced by hypobaria.
Keywords: adrenomedullin, alternative splicing, cerebral cortex, hypobaric hypoxia, neuroprotection, real‐time PCR
INTRODUCTION
Alterations in psychological mood, personality, behavior and cognitive functioning associated with altitude have been recognized for many years. After rapid ascent to high altitude, an individual can develop acute high‐altitude illness. This includes acute mountain sickness, a frequently occurring syndrome of transitory symptoms, high‐altitude cerebral edema and high‐altitude pulmonary edema, two infrequent but potentially life‐threatening conditions (2). Psychological and behavioral changes resulting from the effects of hypobaric hypoxia often include increases in euphoria, irritability, hostility, lassitude or fatigue and neuropsychological disorders such as insomnia, dizziness, memory deficiencies, headache and nausea. In general, the severity and duration of the symptoms vary depending on the altitude and rate of ascent, sometimes persisting after returning to lower altitudes (3). Despite its relevance for human health, little is known about the neural mechanisms underlying high‐altitude physiopathology and how the brain protects itself against damage induced by low‐pressure environments.
Adrenomedullin (AM) is a 52‐amino‐acid peptide with structural homology to calcitonin gene‐related peptide and amylin. AM was initially isolated from a human pheochromocytoma by its capability to increase cyclic adenosine monophosphate production and to induce vasodilatation (17). Further studies described AM as bronchodilator (16), hormone regulator (21), neurotransmitter (1) and growth regulator (7), among others. This peptide is highly expressed in several tissues, including adrenal gland, heart, lung and kidney (26). In the central nervous system (CNS) of the rat, AM was first found in the hypothalamus (35) but later its distribution was reported in the whole CNS (29). AM binds to plasma membrane receptors composed of calcitonin receptor‐like receptor, a member of the seven transmembrane domain receptor superfamily, and receptor activity modifying protein type 2 or 3 (24). The response of the AM system to ischemic insults in the brain has been described, and consists of a progressive overexpression of the peptide as the reperfusion time augments (30). This response of the brain has been interpreted as a neuroprotective mechanism as external addition of AM prevents ischemic damage to the brain 38, 40. Several studies have linked AM expression and hypobaric hypoxia 6, 28, 37, but to the best of our knowledge the impact of hypobaria on brain AM expression has not been addressed.
In this study, we investigate whether hypobaric hypoxia produces a similar response of the cerebral AM neuroprotective system. Interestingly, we found a transient elevation of AM following the hypobaric insult that was progressively reduced as the animals recovered over a period of 5 days.
METHODS
Experimental model
Fifty male adult albino Wistar rats (Harlan Iberica, Barcelona, Spain) aged 2 months or 230–250 g body weight were used in this study. A group of 40 animals was exposed to a simulated altitude of 8325 m (27 000 ft), with atmospheric barometric pressure of 260 mmHg and oxygen partial pressure of 54 mmHg, for 7 h and were sacrificed following 0, 1, 3 or 5 days (n = 10 animals per time point) of reoxygenation in normobaric and normoxic conditions. These groups were named Hb 7/0, Hb 7/1, Hb 7/3 and Hb 7/5, respectively. The 10 additional animals were used as a normobaric control Group C. Four rats from each group were used for immunohistochemical staining, three more for mRNA extraction and expression studies and the remaining three for Western blotting (see below). Animals were allowed free access to food and water throughout the experiment. Altitude simulation was performed with a hypobaric chamber (Enviromental Tectonics International) type 10 M which allows reduction of the barometric pressure and control of the temperature and relative humidity. The chamber was continuously supplied with fresh air, replacing oxygen consumed by the rats and removing carbon dioxide. The ascent and descent rate was maintained below 1000 ft/minute. All procedures were carried out in accordance with the European Communities Council Directive (86/609/EEC) and reviewed by the Ethics Committee of the Spanish Council for Scientific Research. The simulated altitude and time of exposure were selected after preliminary studies and our previous experience with hypobaric hypoxia effects on the CNS 10, 11, 32.
AM antibody
The polyclonal rabbit anti‐AM antiserum used in this study was originally characterized by binding assays and Western blot analysis in human tumor cell lines (19) and used in many previous immunohistochemical studies of the nervous system 20, 26, 27, 29, 31. Western blotting and extensive pre‐absorption controls with the original antigen and related peptides have been performed in the CNS of the rat (29), demonstrating the specificity of the antibody.
Immunohistochemistry
Four rats from each group were used for immunohistochemical studies. Animals were fixed by transcardial perfusion with 500 mL 4% (w/v) paraformaldehyde (Panreac, Barcelona, Spain) in 0.1 M phosphate buffer, pH 7.4. The brains were removed, cut into blocks and post‐fixed for 3 h at room temperature. Serial coronal sections, 40 µm thick, were cut with a vibratome (Leica VT 1000 M, Madrid, Spain). Free‐floating sections were processed by the avidin–biotin peroxidase complex (ABC) technique following standard methods (29). Briefly, sections were incubated for 30 minutes in phosphate‐buffered saline (PBS), pH 7.4, containing 3% (v/v) normal goat serum (ICN Biochemicals, Barcelona, Spain) and 0.2% (v/v) Triton X‐100, and then with the polyclonal antibody to AM diluted 1:1000. The sections were then incubated with biotinylated goat anti‐rabbit immunoglobulin. After washing, the sections were incubated with peroxidase‐linked ABC (Vector Laboratories, Burlingame, CA, USA). Peroxidase activity was demonstrated by the nickel‐enhanced diaminobenzidine glucose oxidase procedure (34). Photomicrographs were captured with a digital camera (Polaroid DMC Ie, Cambridge, MA, USA) attached to a bright field microscope (Zeiss, Jena, Germany).
Quantification of immunoreactive structures
Random pictures (n = 6 per specific layer on each animal) were taken from different layers of the fronto‐parietal cortex of each animal with the 40× objective, and the number of AM‐immunoreactive structures (neurons or blood vessels) was determined by two independent investigators following a blind protocol.
Quantitative data were analyzed using a one‐way ANOVA followed by post‐hoc Bonferroni's test to compare the experimental points vs. control and between different experimental points using Graphpad Prism 4.0 software. P < 0.05 was considered statistically significant.
Immunofluorescence and confocal microscopy
Brain sections were double stained with the AM antibody (obtained in rabbit) and a battery of mouse monoclonal antibodies against GFAP (Sigma‐Aldrich, Alcobendas, Spain), β‐III tubulin clone TUJ1 (Covance, Princeton, NJ, USA), the oligodendrocyte marker O4 (Neuromics, Edina, MN, USA), calbindin (Swant, Bellinzona, Switzerland) and parvalbumin (Chemicon, Temecula, CA, USA). We also used a goat anti‐calretinin (Chemicon) and a biotinylated Lycopersicon esculentum lectin (Sigma). Briefly, sections were incubated in a mixture of the AM antibody and one of the other markers at the recommended concentration overnight at 4°C. After three washes in PBS, the sections were incubated in a solution containing a fluorescent antibody against rabbit IgGs (either Cy3‐donkey anti‐rabbit or FITC‐mouse anti‐rabbit, both from Jackson Immunoresearch, West Grove, PA, USA), a fluorescent moiety to label the second marker (Cy2‐donkey anti‐mouse IgG, FITC‐mouse anti‐goat IgG, FITC‐goat anti‐mouse IgM, or Lissamine‐rhodamine streptavidin, all of them from Jackson Immunoresearch) and DAPI (Molecular Probes, Eugene, OR) as a nuclear counterstain. Following additional washes, the sections were mounted and visualized with a Leica TCS SP5 confocal microscope.
Real‐time reverse transcription polymerase chain reaction (RT‐PCR) determinations
Three animals from each group were used for expression studies. Total mRNA was extracted from the cortices of control animals and from rats exposed to hypobaria and different times of reoxygenation using the CsCl method (13). The mRNA was reverse transcribed using SuperScript reverse transcriptase (Invitrogen, Carlsbad, CA). Polymerase chain reaction (PCR) was performed using the Chromo4 (MJ Research, Hercules, CA, USA) thermocycler and software. Amplification was carried out in a final volume of 25 µL, containing 2 µL cDNA (diluted 1:10), 2 µL of primer mixture (at 10 nM) and 12.5 µL of 2xSYBR Green Master Mix (Applied Biosystems, Foster City, CA, USA). Values were determined by interpolation within a standard curve. At the end of the PCR, a melting curve was generated to ascertain amplicon quality. Primers for AM (GenBank accession number NM_012715) amplification were:
AM forward, 5′‐CAA‐GCA‐GAG‐CAC‐GTC‐TAG‐CA‐3′
AM reverse, 5′‐GGT‐GAG‐CCA‐GTT‐TCT‐GCA‐TT‐3′
The forward primer hybridizes in the third exon whereas the reverse primer binds to the fourth exon, thus surrounding the third intron of the gene.
All AM expression values were normalized according to the β‐tubulin (GenBank accession number BC133064) concentration of each sample using as primers:
Tubulin forward, 5′‐GTC‐CTG‐GAC‐GTG‐GTA‐AGG‐AA‐3′
Tubulin reverse, 5′‐TGC‐GGT‐CTG‐GGT‐ACT‐CTT‐CT‐3′
Following real‐time PCR, samples were run in agarose gels to visualize double bands. Relative intensity of the bands was determined by densitometry.
Western blotting
Fresh cortices from control and hypobaria‐treated rats (n = 3 for each group) were homogenized in lysis buffer [50 mM Tris/HCl pH 7.5, 150 mM NaCl, 1% Triton X‐100, 1% deoxycholate, 0.1% (w/v) NaN3, 1 mM EGTA, 0.4 mM EDTA, 1 mM PMSF, 0.2 mM Na3VO4 and protease inhibitor cocktail] and sonicated. Lysates were clarified by centrifugation at 15 000 g for 10 minutes and protein concentration was estimated in the supernatant using a ND‐1000 spectrophotometer (Nanodrop, Wilmington, DE, USA). Equal amounts of total protein (50 µg) were loaded into 4–12% NuPage Bis‐Tris gels (Invitrogen), electrophoresed in MES buffer and transferred to nitrocellulose membranes (Invitrogen). The same rabbit anti‐AM antibody used for immunohistochemistry was employed to detect the AM immunoreactive bands at a concentration 1:5000. The ECL Advance Western Blotting Detection Kit from Amersham Biosciences (Piscataway, NJ, USA) was used to develop the blots. Detection of β‐III tubulin was accomplished with a monoclonal antibody (Promega, Madison, WI, USA) in the same membranes at a concentration 1:60 000. Relative intensity of the bands was determined by densitometry.
RESULTS
The distribution of AM‐immunoreactivity was similar in all cortical areas. The following description focuses mainly on the frontoparietal cortex, but most observations could be extrapolated to other cortical regions.
Untreated controls
The distribution pattern of AM‐immunoreactivity in control animals coincided with our previous description (29). In brief, immunoreactive neurons and processes were found in the cingulate, frontal, parietal and temporal regions of the cerebral cortex (Figure 1A). Large immunoreactive pyramidal cells were found in layers IV and V ( Figure 2A). These cells show intense immunoreactivity in their apical dendrites, which cross the cortical mantle to form an immunoreactive plexus in layer I. Layers II and III contained some small immunoreactive multipolar neurons and some pyramidal neurons. The piriform cortex showed numerous medium‐size immunoreactive neurons in layer III, with short processes and an occasional long apical dendrite. The number of immunoreactive neurons in layer III clearly decreased at the transition from the piriform cortex to the entorhinal cortical area. Only scattered immunoreactive neurons were found in layer VI, close to the corpus callosum (Figure 2D). Some large blood vessels were immunoreactive for AM but very few of the small vessels showed immunoreactivity (Figure 2J).
Figure 1.

Panoramic view of the frontoparietal cortex of rats exposed to normobaric conditions (A), 7 h of hypobaric hypoxia and no reoxygenation (B), or 7 h of hypobaric hypoxia followed by 5 days of reoxygenation (C), stained with antibodies against adrenomedullin (AM). A clear increase in AM‐immunoreactivity is seen in animals exposed to hypobaria that decreases to almost control levels after 5 days of recovery. Scale bars: A–C = 100 µm.
Figure 2.

Details of adrenomedullin (AM)‐immunoreactive structures in the cerebral cortex of rats exposed to normobaric conditions (first column: A,D,G,J), 7 h of hypobaria and no reoxygenation (second column: B,E,H,K), or 7 h of hypobaria followed by 5 days of recovery (third column: C,F,I,L). Rows represent pyramidal cells of layers IV–V (first row: A–C), immunoreactive cells of layer VI (second row: D–F), small arachniform neurons (third row, G–I) and small blood vessels (fourth row, J–L). As in figure 1, a clear increase in AM‐immunoreactive structures is seen following the hypobaric insult, that comes back to almost normal levels after 5 days. Scale bars: A–F = 50 µm; G–L = 10 µm.
Hypobaric animals
After 7 h of hypobaric hypoxia and no recovery (Hb 7/0), a strong increment of AM immunoreactivity took place in all cortical layers (Figure 1B). The number and intensity of AM‐positive pyramidal cells increased greatly in all cortical layers, but this increase was more intense in layers II–III and IV–V (Figures 1B and 2B). In these neurons, AM immunoreactivity increased especially in the perinuclear cytoplasm and in the apical dendrite (Figure 2B). There was also a strong increment in the number and intensity of immunoreactive neurons in layer VI (Figure 2E).
When the animals were subjected to hypobaric hypoxia, a new immunoreactive cell type (Figure 2H) appeared in the cortex that was not found in control animals. These cells were scattered across the whole cortical mantle and were characterized by a thin immunoreactive cytoplasmic ring surrounding a large nucleus. Short cytoplasmic processes gave these cells an arachnoid morphology that identifies them as the “small neurons” described by Ramón y Cajal.
The wall of the small blood vessels and their accompanying astroglia became immunoreactive for AM following exposure to hypobaric hypoxia (arrows in Figure 2K). These structures were non‐immunoreactive in the normobaric controls (arrowheads in Figure 2J).
After 1 day of reoxygenation (Hb 7/1), the immunoreactive pattern for AM did not change when compared with hypobaric animals without recovery (results not shown). In the cerebral cortex of rats sacrificed after 3 days of reoxygenation (Hb 7/3), AM immunoreactivity decreased when compared with previous experimental points, although it was still higher than normobaric controls (results not shown). After 5 days of reoxygenation (Hb 7/5), the intensity of the immunoreactivity and the number of immunostained pyramidal cells and cells of layer VI decreased to the levels observed in normobaric controls (Figure 2C,F). The number of the small neurons expressing AM throughout the cortical mantle decreased when compared with previous points but a few scattered cells were still found in the cortex (Figure 2I). The number and the intensity of immunoreactive small blood vessels decreased back to control levels (Figure 2L).
Quantification of AM‐immunoreactive structures
The number of AM‐immunopositive pyramidal neurons in layers IV and V of control animals was 7.7 ± 1.6 cells/microscopic field. After 7 h of hypobaric hypoxia without reoxygenation (Hb 7/0) the number of this cellular type increased to 18.0 ± 2.7 cells/field (P < 0.001). The number of immunoreactive pyramidal neurons decreased progressively, reaching control values after 5 days of reoxygenation (Hb 7/5; 7.0 ± 1.9 cells/field; Figure 3A).
Figure 3.

Quantification of adrenomedullin (AM)‐immunoreactive structures in the frontoparietal cerebral cortex of normobaric and hypobaric animals.“Control” represents normobaric control animals, “7/0”, “7/1”, “7/3” and “7/5” represent animals exposed to 7 h of hypobaric hypoxia followed by 0 h, 1, 3 and 5 days of reoxygenation, respectively. Bars are mean ± standard error of the mean of four animals and six independent measurements per animal. The different panels show changes in the number of AM‐immunoreactive pyramidal cells (A), cells of layer VI (B), small arachniform neurons (C) and small blood vessels (D). Statistical analysis was performed by one‐way ANOVA followed by post‐hoc Bonferroni's test. *P < 0.001 and **P < 0.01 vs. controls. ***P < 0.001 vs. hypobaric animals (7/0).
A similar pattern was found in the number of cells in layer VI. There is a basal value of 15.5 ± 3.0 immunoreactive cells/microscopic field in control animals that increased significantly after hypobaric hypoxia without reoxygenation (Hb 7/0; 44.0 ± 5.5 cells/field, P < 0.001). The number of immunoreactive cells of layer VI went back to control values after 5 days of reoxygenation (Hb 7/5; 13.8 ± 3.7 cells/field; Figure 3B).
In control animals, no immunoreactive small arachniform cells were found, but after hypobaric hypoxia without reoxygenation (Hb 7/0), numerous immunoreactive small cells appeared (6.3 ± 1.6 cells/ microscopic field, P < 0.001 comparing with normobaric controls). After 5 days of reoxygenation (Hb 7/5) the number of these cells decreased significantly (2.2 ± 1.5 cells/field, P < 0.001 comparing with no reoxygenation), but was still higher than in normobaric controls (P < 0.05; Figure 3C).
The number of immunoreactive small blood vessels was very low in normobaric animals (0.17 ± 0.4 vessels/microscopic field). After hypobaric hypoxia (Hb 7/0), the number of small vessels increased sharply with respect to controls (2.5 ± 1.0 vessels/field, P < 0.001). After 5 days of reoxygenation (Hb 7/5), the number of immunoreactive small blood vessels decreased to values close to controls (1.0 ± 0.9 vessels/field, P < 0.05 compared with no reoxygenation; Figure 3D).
Identification of AM‐immunoreactive structures by double immunofluorescence
With the exception of the vascular astrocytes that were positive for both AM and GFAP in animals of the Hb 7/0 and Hb 7/1 groups, all other AM‐immunoreactive cells were positive for TUJ1 and negative for all other markers (results not shown). To further characterize these AM‐positive cortical neurons, we studied the colocalization pattern of AM with the Ca2+‐binding proteins parvalbumin, calbindin and calretinin. Parvalbumin labeled cortical interneurons which did not contain AM‐immunoreactivity, but numerous parvalbumin‐positive synaptic buttons were closely related with the plasma membrane of AM‐immunoreactive cells, especially the large pyramidal cells of layers IV and V ( Figure 4A). In sharp contrast, calbindin (Figure 4B) and calretinin (Figure 4C) presented a granular immunoreactive pattern in the cytoplasm of AM‐positive cells, corresponding both to pyramidal cells and to smooth nonpyramidal neurons. The L. esculentum lectin labeled the glycocalix of blood vessels, identifying clearly the AM‐immunoreactive endothelial cells of the small cortical capillaries (Figure 4D).
Figure 4.

Double immunofluorescence labeling for adrenomedullin (AM; red in A–C, green in D) and parvalbumin (green in A), calbindin (green in B), calretinin (green in C) and the L. esculentum lectin (red in D) in Hb 7/1 animals. Parvalbumin does not colocalize with AM, whereas calbindin and calretinin do. DAPI was used as a nuclear counterstain (blue) in all sections. Scale bars: A = 25 µm; B,C = 15 µm; D = 20 µm.
Quantification of AM mRNA expression
Total RNA was obtained from the cortices of animals belonging to the different hypobaric treatments. After reverse transcription, the AM expression levels were quantified by real‐time PCR. In agreement with our immunohistochemical results, animals that had been subjected to 7 h of hypobaric hypoxia and no reoxygenation exhibited a ninefold increase in AM expression when compared with normobaric controls (P < 0.05). After 24 h of reoxygenation the mRNA levels for AM were back to normal and remained indistinguishable from the controls after 5 days of recovery ( Figure 5).
Figure 5.

Quantification of adrenomedullin (AM) mRNA levels through real‐time polymerase chain reaction in the cortices of control animals and of rats exposed to 7 h of hypobaria followed by different times of recovery.“Control” represents normobaric control animals, “7/0”, “7/1” and “7/5” represent animals exposed to 7 h of hypobaric hypoxia followed by 0, 1 and 5 days of reoxygenation, respectively. Bars represent mean ± standard deviation of three different animals. Statistical analysis was performed by Student's t‐test. *P < 0.05 vs. control.
When the PCR products amplified with the AM primers were run in agarose gels, two bands of different sizes were observed (Figure 6). These two bands represent alternative splicing of the immature mRNA, with the shorter form coding for a longer prohormone and the longer form, that retains the 196 bp third intron, producing a shorter prohormone containing the open reading frame for pro‐adrenomedullin N‐terminal 20 peptide (PAMP) but not for AM (22). Interestingly, mRNA obtained from rats subjected to 7 h of hypobaria and no reoxygenation (Hb 7/0) exhibited a slight decrease in the upper band and an important increase in the intensity of the lower band. As the reoxygenation time increased, the band pattern came back to normal (Figure 6). Densitometry analysis of the PCR bands revealed a 342 bp/146 bp band ratio of 0.31 ± 0.08 for the controls that became 0.08 ± 0.03 for the Hb 7/0 animals (P = 0.013). The densitometry ratio for the Hb 7/5 rats was 0.47 ± 0.18 (not significantly different from normobaric controls).
Figure 6.
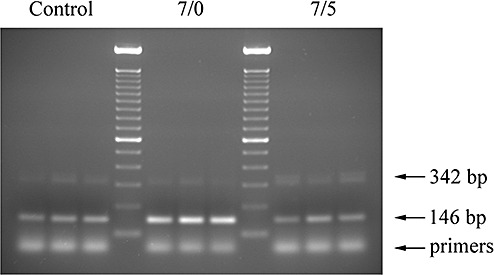
Gel analysis of polymerase chain reaction (PCR) products. A representative photograph of a gel containing PCR products generated with adrenomedullin primers bridging the third intron of the gene. Three normobaric animals (control), three rats subjected to 7 h of hypobaria and no reoxygenation (7/0) and three animals subjected to 7 h of hypobaric hypoxia followed by 5 days of reoxygenation (7/5) are represented. A 100 bp DNA ladder was used as a size reference. Theoretical band sizes are indicated by arrows.
Western blotting
Two immunoreactive bands of approximately 18 and 14 kDa were obtained for AM in all samples of the rat cortex (Figure 7). The immunoreactive bands were quantified by densitometry and the values obtained were added and corrected by the density of the corresponding tubulin‐immunoreactive band to account for loading errors. There was a significant increase in Hb 7/0 (P < 0.05), Hb 7/1 (P < 0.001) and Hb 7/3 (P < 0.05) when compared with control animals, whereas Hb 7/5 was indistinguishable from controls (Figure 7, lower panel).
Figure 7.

Representative Western blots for adrenomedullin (AM) and tubulin in tissue homogenates from the cortex of rats belonging to the five experimental groups (labeled as in previous figures). Synthetic AM (10 ng) was added in the first lane as a control. The lower panel represents the addition of the density values for both AM bands corrected by the density of the corresponding tubulin band, expressed as a percentage of the control group. The bars represent the mean and standard deviation of three different animals. Statistical analysis was performed by Student's t‐test. *P < 0.05, **P < 0.001 vs. control.
DISCUSSION
We have shown that exposing rats to hypobaric hypoxia (27 000 ft) for 7 h results in an increase on the immunoreactivity for AM and its mRNA expression in the cerebral cortex. This elevation decreases progressively after the first day of reoxygenation to reach almost control levels after 5 days of recovery.
Pyramidal neurons and cells of layer VI express AM in normobaric animals. After the hypobaric insult, both the number of immunoreactive cells and the intensity of the immunoreaction increased sharply to decrease progressively during the recuperation period. In our study, we found that some small arachniform neurons that did not express AM in normobaria became positive after exposure to hypobaria. Although the number of these cells decreased over time, they were still present at day 5, suggesting that they may be a good sign of recent exposure to hypobaria in forensic medicine and similar applications. Small blood vessels and associated astroglia were either immunonegative or very slightly positive for AM under normobaric conditions. As with the other structures, there was an increase in immunoreactivity following hypobaric treatment that was corrected over time. The cell types that increase their AM staining during hypobaria coincide with those whose AM expression raises in situations of ischemia reperfusion (30).
A detailed colocalization study demonstrated that most of the AM‐positive cells in the rat cortex were indeed neurons. The characteristic morphology of pyramidal cells identified them without a doubt, but the nonpyramidal cells required a deeper study. We found that AM‐immunoreactivity colocalized with calbindin and calretinin, but not with parvalbumin. In general, calbindin‐positive neurons of the cortex correspond with double bouquet cells, whereas calretinin‐immunoreactivity appears in bipolar cells, double bouquet cells and Cajal‐Retzius cells (15). Parvalbumin is related to chandelier cells and large basket cells (15), which coincides with our observation of their terminal synaptic buttons covering completely the soma and dendrites of the pyramidal cells.
General immunoreactivity for AM, as revealed by Western blotting, showed a double band of about 18 and 14 kDa. These bands correspond to the precursor molecule, pro‐adrenomedullin and an intermediate, as previously shown (19). The lack of a 6 kDa band, representing the mature AM peptide, has been previously reported in the brain cortex and interpreted as a result of the quick release of the mature peptide from the nervous structures and a short half life (29). The only area of the brain where a 6 kDa band can be found is the cerebellum (29). Coinciding with the immunohistochemical and mRNA expression data, quantification of the bands density showed a slight increase in the brain of Hb 7/0 animals that became very significant in those of Hb 7/1 rats. After that, there was a progressive attenuation until reaching values indistinguishable from controls in Hb 7/5.
At the cellular level, the elevation on AM expression elicited by hypoxia seems to depend on two different mechanisms. On the one hand, the AM gene responds to hypoxia through binding of the transcription factor, hypoxia inducible factor‐1 to specific hypoxia response elements present in several regions of the gene; in addition, under hypoxic conditions there is a prolongation on the half‐life of the AM mRNA (13). Here we have shown that there is yet another mechanism implicated in the up‐regulation of AM expression. Under normobaric conditions, PCR amplification with the proper primers renders two bands corresponding to both alternative splice forms of the AM mRNA, as previously described (22). In the mRNA of the brain of animals exposed to hypobaria there was an increase in the intensity of the 146 bp band corresponding to the shorter splice species (form A). This shorter form codes for both AM and PAMP whereas the longer splice form (form B) codes exclusively for PAMP, because of the introduction of a premature stop codon (22). Thus, under hypobaric conditions there is an increase in the AM/PAMP ratio produced by the AM gene. The existence of this alternative splicing process has been illustrated in humans (22), monkeys (41) and birds (42), but had not been shown in rodents until now. This is the first time that regulation of AM splicing is demonstrated in an in vivo model.
Interestingly, AM mRNA expression came back to control levels 24 h after the hypobaric insult whereas protein up‐regulation was still present after 5 days of recovery in specific cell types. This difference suggests a short half‐life for the message and a higher stability for the mature peptide, especially when stored in particular cortical neurons.
In situations of cerebral hypoxia, such as those suffered during ischemia and stroke, brain AM has been shown to increase 9, 30. This elevation was also found when genome‐wide screening had been performed comparing hypoxic animals with normoxic controls by either differential display (12) or microarray technology (4). In all cases, up‐regulation of AM expression has been correlated with increased brain protection. The neuroprotective action of AM has been demonstrated by infusion of the peptide 8, 38, 40, by gene delivery (39), or following transgenic overexpression of the peptide (25). There is only one exception in the literature, where injection of AM in pial vessels resulted in aggravated ischemic insult (36). The neuroprotective action of AM may be because of a series of mechanisms; these include vasodilatation (33), suppression of apoptosis and induction of angiogenesis (40), promotion of astrocyte migration and survival (39) and protection from oxidative damage (5). Therefore, it seems that the elevation on AM levels that occurs during brain hypoxia is intended as an adaptive response of the brain to avoid the damage caused by the lack of oxygen and the high oxidative stress elicited by subsequent reoxygenation.
The reaction of the CNS following hypobaric hypoxia includes also a steep rise on AM levels. This is no surprising as hypobaric hypoxia eventually provokes brain ischemia. Curiously, in a hyperbaric test there was also an increase on AM levels following 41 h of submersion at a depth of 2.5 m (18). The fact that both hypobaria and hyperbaria result in the same response indicates that AM up‐regulation may be a general mechanism to preserve brain integrity.
We have recently described a number of small molecule modulators of AM 14, 23 that could be used to boost AM's physiological activities. Positive modulators of AM may be used to prevent and/or treat the symptoms associated with hypobaric exposure.
ACKNOWLEDGEMENTS
We thank Mr Etelvino Sánchez for excellent technical assistance. This work was supported by the Spanish Ministry of Science and Education (Grants BFU2004/02838 and SAF2007‐60010), the Instituto de Salud Carlos III (Grant RD06/0026/1001) and by the CSIC/Community of Madrid (Grant 200620M001).
REFERENCES
- 1. Allen MA, Ferguson AV (1996) In vitro recordings from area postrema neurons demonstrate responsiveness to adrenomedullin. Am J Physiol 270:R920–R925. [DOI] [PubMed] [Google Scholar]
- 2. Angerer P, Nowak D (2003) Working in permanent hypoxia for fire protection‐impact on health. Int Arch Occup Environ Health 76:87–102. [DOI] [PubMed] [Google Scholar]
- 3. Bahrke MS, Shukitt‐Hale B (1993) Effects of altitude on mood, behaviour and cognitive functioning. A review. Sports Med 16:97–125. [DOI] [PubMed] [Google Scholar]
- 4. Bernaudin M, Tang Y, Reilly M, Petit E, Sharp FR (2002) Brain genomic response following hypoxia and re‐oxygenation in the neonatal rat. Identification of genes that might contribute to hypoxia‐induced ischemic tolerance. J Biol Chem 277:39728–39738. [DOI] [PubMed] [Google Scholar]
- 5. Chen L, Kis B, Busija DW, Yamashita H, Ueta Y (2005) Adrenomedullin protects rat cerebral endothelial cells from oxidant damage in vitro. Regul Pept 130:27–34. [DOI] [PubMed] [Google Scholar]
- 6. Cueille C, Birot O, Bigard X, Hagner S, Garel JM (2005) Post‐transcriptional regulation of CRLR expression during hypoxia. Biochem Biophys Res Commun 326:23–29. [DOI] [PubMed] [Google Scholar]
- 7. Cuttitta F, Pio R, Garayoa M, Zudaire E, Julian M, Elsasser TH, Montuenga LM, Martinez A (2002) Adrenomedullin functions as an important tumor survival factor in human carcinogenesis. Microsc Res Tech 57:110–119. [DOI] [PubMed] [Google Scholar]
- 8. Dogan A, Suzuki Y, Koketsu N, Osuka K, Saito K, Takayasu M, Shibuya M, Yoshida J (1997) Intravenous infusion of adrenomedullin and increase in regional cerebral blood flow and prevention of ischemic brain injury after middle cerebral artery occlusion in rats. J Cereb Blood Flow Metab 17:19–25. [DOI] [PubMed] [Google Scholar]
- 9. Encinas JM, Serrano J, Alonso D, Fernandez AP, Rodrigo J (2002) Adrenomedullin over‐expression in the caudate‐putamen of the adult rat brain after ischaemia‐reperfusion injury. Neurosci Lett 329:197–200. [DOI] [PubMed] [Google Scholar]
- 10. Encinas JM, Serrano J, Bentura ML, Castro‐Blanco S, Fernandez AP, Rodrigo J (2003) Nitric oxide system and protein nitration are modified by an acute hypobaric hypoxia in the adult rat hippocampus. J Neuropathol Exp Neurol 62:863–877. [DOI] [PubMed] [Google Scholar]
- 11. Encinas JM, Fernandez AP, Salas E, Castro‐Blanco S, Munoz P, Rodrigo J, Serrano J (2004) Nitric oxide synthase and NADPH‐diaphorase after acute hypobaric hypoxia in the rat caudate putamen. Exp Neurol 186:33–45. [DOI] [PubMed] [Google Scholar]
- 12. Feuerstein GZ, Wang X (1997) Use of differential display reverse transcription–polymerase chain reaction for discovery of induced adrenomedullin gene expression in focal stroke. Can J Physiol Pharmacol 75:731–734. [PubMed] [Google Scholar]
- 13. Garayoa M, Martinez A, Lee S, Pio R, An WG, Neckers L et al (2000) Hypoxia‐inducible factor‐1 (HIF‐1) up‐regulates adrenomedullin expression in human tumor cell lines during oxygen deprivation: a possible promotion mechanism of carcinogenesis. Mol Endocrinol 14:848–862. [DOI] [PubMed] [Google Scholar]
- 14. Garcia MA, Martin‐Santamaria S, Cacho M, De La Llave FM, Julian M, Martinez A et al (2005) Synthesis biological evaluation, and three‐dimensional quantitative structure‐activity relationship study of small‐molecule positive modulators of adrenomedullin. J Med Chem 48:4068–4075. [DOI] [PubMed] [Google Scholar]
- 15. Hof PR, Glezer II, Conde F, Flagg RA, Rubin MB, Nimchinsky EA, Vogt Weisenhorn DM (1999) Cellular distribution of the calcium‐binding proteins parvalbumin, calbindin, and calretinin in the neocortex of mammals: phylogenetic and developmental patterns. J Chem Neuroanat 16:77–116. [DOI] [PubMed] [Google Scholar]
- 16. Kanazawa H, Kurihara N, Hirata K, Kudoh S, Kawaguchi T, Takeda T (1994) Adrenomedullin, a newly discovered hypotensive peptide, is a potent bronchodilator. Biochem Biophys Res Commun 205:251–254. [DOI] [PubMed] [Google Scholar]
- 17. Kitamura K, Kangawa K, Kawamoto M, Ichiki Y, Nakamura S, Matsuo H, Eto T (1993) Adrenomedullin: a novel hypotensive peptide isolated from human pheochromocytoma. Biochem Biophys Res Commun 192:553–560. [DOI] [PubMed] [Google Scholar]
- 18. Loder I, Rossler A, Wurzinger G, Duncko R, Jezova D, Hinghofer‐Szalkay H (2006) Adrenomedullin and elements of orthostatic competence after 41 h of voluntary submersion in water as measured in four healthy males. Eur J Appl Physiol 96:644–650. [DOI] [PubMed] [Google Scholar]
- 19. Martinez A, Miller MJ, Unsworth EJ, Siegfried JM, Cuttitta F (1995) Expression of adrenomedullin in normal human lung and in pulmonary tumors. Endocrinology 136:4099–4105. [DOI] [PubMed] [Google Scholar]
- 20. Martinez A, Unsworth EJ, Cuttitta F (1996) Adrenomedullin‐like immunoreactivity in the nervous system of the starfish Marthasterias glacialis. Cell Tissue Res 283:169–172. [DOI] [PubMed] [Google Scholar]
- 21. Martinez A, Weaver C, Lopez J, Bhathena SJ, Elsasser TH, Miller MJ, Moody TW, Unsworth EJ, Cuttitta F (1996) Regulation of insulin secretion and blood glucose metabolism by adrenomedullin. Endocrinology 137:2626–2632. [DOI] [PubMed] [Google Scholar]
- 22. Martinez A, Hodge DL, Garayoa M, Young HA, Cuttitta F (2001) Alternative splicing of the proadrenomedullin gene results in differential expression of gene products. J Mol Endocrinol 27:31–41. [DOI] [PubMed] [Google Scholar]
- 23. Martinez A, Julian M, Bregonzio C, Notari L, Moody TW, Cuttitta F (2004) Identification of vasoactive nonpeptidic positive and negative modulators of adrenomedullin using a neutralizing antibody‐based screening strategy. Endocrinology 145:3858–3865. [DOI] [PubMed] [Google Scholar]
- 24. McLatchie LM, Fraser NJ, Main MJ, Wise A, Brown J, Thompson N et al (1998) RAMPs regulate the transport and ligand specificity of the calcitonin‐receptor‐like receptor. Nature 393:333–339. [DOI] [PubMed] [Google Scholar]
- 25. Miyashita K, Itoh H, Arai H, Suganami T, Sawada N, Fukunaga Y et al (2006) The neuroprotective and vasculo‐neuro‐regenerative roles of adrenomedullin in ischemic brain and its therapeutic potential. Endocrinology 147:1642–1653. [DOI] [PubMed] [Google Scholar]
- 26. Montuenga LM, Martinez A, Miller MJ, Unsworth EJ, Cuttitta F (1997) Expression of adrenomedullin and its receptor during embryogenesis suggests autocrine or paracrine modes of action. Endocrinology 138:440–451. [DOI] [PubMed] [Google Scholar]
- 27. Munoz M, Martinez A, Cuttitta F, Gonzalez A (2001) Distribution of adrenomedullin‐like immunoreactivity in the central nervous system of the frog. J Chem Neuroanat 21:105–123. [DOI] [PubMed] [Google Scholar]
- 28. Nakanishi K, Osada H, Uenoyama M, Kanazawa F, Ohrui N, Masaki Y et al (2004) Expressions of adrenomedullin mRNA and protein in rats with hypobaric hypoxia‐induced pulmonary hypertension. Am J Physiol Heart Circ Physiol 286:H2159–H2168. [DOI] [PubMed] [Google Scholar]
- 29. Serrano J, Uttenthal LO, Martinez A, Fernandez AP, Martinez de Velasco J, Alonso D et al (2000) Distribution of adrenomedullin‐like immunoreactivity in the rat central nervous system by light and electron microscopy. Brain Res 853:245–268. [DOI] [PubMed] [Google Scholar]
- 30. Serrano J, Alonso D, Encinas JM, Lopez JC, Fernandez AP, Castro‐Blanco S et al (2002) Adrenomedullin expression is up‐regulated by ischemia‐reperfusion in the cerebral cortex of the adult rat. Neuroscience 109:717–731. [DOI] [PubMed] [Google Scholar]
- 31. Serrano J, Alonso D, Fernandez AP, Encinas JM, Lopez JC, Castro‐Blanco S et al (2002) Adrenomedullin in the central nervous system. Microsc Res Tech 57:76–90. [DOI] [PubMed] [Google Scholar]
- 32. Serrano J, Encinas JM, Salas E, Fernandez AP, Castro‐Blanco S, Fernandez‐Vizarra P et al (2003) Hypobaric hypoxia modifies constitutive nitric oxide synthase activity and protein nitration in the rat cerebellum. Brain Res 976:109–119. [DOI] [PubMed] [Google Scholar]
- 33. Shimosawa T, Matsui H, Xing G, Itakura K, Ando K, Fujita T (2003) Organ‐protective effects of adrenomedullin. Hypertens Res 26(Suppl.):S109–S112. [DOI] [PubMed] [Google Scholar]
- 34. Shu SY, Ju G, Fan LZ (1988) The glucose oxidase‐DAB‐nickel method in peroxidase histochemistry of the nervous system. Neurosci Lett 85:169–171. [DOI] [PubMed] [Google Scholar]
- 35. Ueta Y, Kitamura K, Isse T, Shibuya I, Kabashima N, Yamamoto S et al (1995) Adrenomedullin‐immunoreactive neurons in the paraventricular and supraoptic nuclei of the rat. Neurosci Lett 202:37–40. [DOI] [PubMed] [Google Scholar]
- 36. Wang X, Yue TL, Barone FC, White RF, Clark RK, Willette RN et al (1995) Discovery of adrenomedullin in rat ischemic cortex and evidence for its role in exacerbating focal brain ischemic damage. Proc Natl Acad Sci USA 92:11480–11484. [DOI] [PMC free article] [PubMed] [Google Scholar]
- 37. Wang S, Yu Z, Liu K (2001) [Synthesis and release of pulmonary tissue adrenomedullin on hypoxic pulmonary hypertension in rats and its significance. Zhonghua Jie He He Hu Xi Za Zhi 24:725–727. [PubMed] [Google Scholar]
- 38. Watanabe K, Takayasu M, Noda A, Hara M, Takagi T, Suzuki Y, Yoshia JW (2001) Adrenomedullin reduces ischemic brain injury after transient middle cerebral artery occlusion in rats. Acta Neurochir (Wien) 143:1157–1161. [DOI] [PubMed] [Google Scholar]
- 39. Xia CF, Yin H, Borlongan CV, Chao J, Chao L (2004) Adrenomedullin gene delivery protects against cerebral ischemic injury by promoting astrocyte migration and survival. Hum Gene Ther 15:1243–1254. [DOI] [PubMed] [Google Scholar]
- 40. Xia CF, Yin H, Borlongan CV, Chao J, Chao L (2006) Postischemic infusion of adrenomedullin protects against ischemic stroke by inhibiting apoptosis and promoting angiogenesis. Exp Neurol 197:521–530. [DOI] [PubMed] [Google Scholar]
- 41. Zudaire E, Martinez A, Ozbun LL, Cuttitta F (2004) Characterization of adrenomedullin in non‐human primates. Biochem Biophys Res Commun 321:859–869. [DOI] [PubMed] [Google Scholar]
- 42. Zudaire E, Cuesta N, Martinez A, Cuttitta F (2005) Characterization of adrenomedullin in birds. Gen Comp Endocrinol 143:10–20. [DOI] [PubMed] [Google Scholar]