

Abstract
The latent persistence of herpes simplex virus type 1 (HSV‐1) in human trigeminal ganglia (TG) is accompanied by a chronic CD8 T‐cell infiltrate. The focus of the current work was to look for HSV‐1 transcription activity as a potential trigger of the immune response and to characterize the immune cell infiltrates by this feature. We combined in situ hybridization, laser cutting microscopy, and single cell RT‐PCR to demonstrate the expression of the HSV‐1 immediate early (IE) genes ICP0 and ICP4 in human trigeminal neurons. Using CDR3 spectratyping, we showed that the infiltrating T‐cells are clonally expanded, indicating an antigen‐driven immune response. Moreover, the persisting CD8+ T‐cells had features of the memory effector phenotype. The voltage‐gated potassium channel Kv1.3, a marker of chronic activated memory effector cells, and the chemokines CCL5 and CXCL10 were expressed by a subpopulation of infiltrating cells. The corresponding chemokine receptors CCR5 and CXCR3 were co‐expressed on virtually all CD8 T‐cells. In addition, T‐cells expressed granzymes and perforin. In contrast to animal models of HSV‐1 latency, hardly any FoxP3‐positive regulatory T‐cells were detected in human TG. Thus, HSV‐1 IE genes are expressed in human TG and the infiltrating T‐cells bear several characteristics that suggest viral antigenic stimulation.
INTRODUCTION
Following primary infection with herpes simplex virus type‐1 (HSV‐1) at the mucosal site, the virus enters the sensory neurons of the trigeminal ganglia (TG) and establishes a lifelong latent infection within these cells. At various times throughout the life of the infected individual, the virus can reactivate, return to the original peripheral site, and cause recurrent disease. During latency viral gene expression is silent, except for the synthesis of latency‐associated transcripts (LAT) 6, 40. A protein translated by LAT has not yet been found, although abundant infiltration with T‐cells and persistent expression of cytokine/chemokine in the HSV‐1‐infected TG indicate that an antigenic stimulus might be present 1, 3, 15, 25, 38, 44. So far, no other transcripts or proteins have been detected in the latently infected human TG, but studies in the HSV‐1 mouse model have demonstrated low levels of expression of other transcripts than LAT 2, 22, 23, 27. Feldman et al found that exceptionally rare neurons in the latently infected mouse TG reveal an abundant expression of viral transcripts, viral proteins and viral DNA replication (12). Furthermore, each of these neurons was also surrounded by inflammatory cells and the term “spontaneous molecular reactivation” was proposed to describe this.
Unlike the situation in the HSV‐1 mouse model, the accompanying immune response in latently infected human TG is more prominent. In addition, human TG are often latently co‐infected with VZV 5, 44, 45. By comparing viral (HSV‐1/VZV) latency and the immune infiltration in the dorsal root ganglia and TG from the same individual, we recently showed that prominent T‐cell infiltration correlates with latent HSV‐1 and not VZV infection (17). Also previous data from our laboratory revealed that CD8+ T‐cells encircle a few neurons that harbor LAT and many neurons that lack LAT (44). This specific morphological pattern may suggest that some latently infected neurons express low levels of viral RNAs other than LAT, and that gene products of these low level viral transcripts act as target antigens for the infiltrating T‐cells.
An abundant infiltration of CD8+ T‐cells and a persistent expression of chemokines in the human TG infected with HSV‐1 imply that the adaptive immune system plays a crucial role in maintaining the virus in a latent state. This agrees with the findings of Khanna et al, who proved that T‐cells in latently infected mouse ganglia are indeed specific for HSV‐1 (20). Using in situ tetramer staining, they observed T‐cell receptor (TCR) polarization on the surface of many CD8+ T‐cells near the T‐cell neuron junction. More recent data from the HSV‐1 animal model underline that only persistent T‐cells bearing an activated phenotype are HSV‐1 specific (47). So far, there are no data on the phenotype of the infiltrating T‐cells in humans, and no study has yet examined whether the chronic immune infiltration can be linked to expression of any other viral transcripts besides LAT.
Hence, the main aim of the present study was to determine whether the immediate early (IE) genes ICP0 and ICP4, which are ordinarily expressed during productive infection, are also expressed during latency and thus might be associated with a chronic immune cell infiltration in the human TG. Even if the products of these genes are not the direct antigen stimulus, their presence would provide useful information about viral activity during latency, as ICP0 and ICP4 act as transactivators, which stimulate the expression of other IE and early genes 9, 11. Further objectives of the study were to determine (i) whether the chronic immune response is antigen driven by characterizing the TCR profile, and (ii) whether the infiltrating T‐cells have a phenotype that is compatible with effector memory cells.
MATERIAL AND METHODS
The use of autopsy samples for the present study was approved by the Ethics Committee of the Medical Faculty of the Ludwig‐Maximilians University of Munich. For testing the expression of HSV‐1 IE genes, a total of 22 TG from 11 individuals (8 men, 3 women) were removed 6 to 24 h after death. A reactivation of latent HSV‐1 during this time seems unlikely, especially when the tissue was not dissociated and not kept under culture conditions 14, 19. The ages of the subjects ranged from 25 to 85 years. The cause of death was related to pulmonary embolism, myocardial infarction, aneurysma dissecans, electric shock, liver cirrhosis, or trauma. For quantitative reverse transcription polymerase chain reaction (RT‐PCR) (CD8, granzyme B, perforin), the TGs from additional seven subjects were included. The subjects had no lesions suggestive of an active orolabial herpes infection. Brain tissue from two patients who died of HSV‐1 encephalitis was used as a positive control for establishing the ICP0 in situ hybridization. Tonsil tissue was used as a positive control for the immunohistochemistry (IHC) stainings. Ganglia were embedded in Tissue tek® compound (Sakura, Zoeterwoude, The Netherlands) and stored at −70°C until use. For paraffin processing the tissue was fixed in formaldehyde or 10% buffered formalin for 24 h. Frozen sections were made of 8‐µm thickness, and paraffin sections, of 4‐µm thickness. The sections were mounted on positively charged slides (SuperFrost*/Plus®, Menzel, Braunschweig, Germany).
In situ hybridization. The probe for the HSV‐1 LAT was generated from the ATD19 plasmid provided by T. Margolis (10), and the CXCL10 probes were generated from a plasmid provided by G. Niedobitek (42). The LAT oligonucleotide probe was synthesized and labeled with digoxigenin (MWG‐ Biotech AG, Ebersberg, Germany) (43). The in situ protocol used was described in detail in a previous work (43). The probes were detected by using the alkaline phosphate conjugated anti‐digoxigenin antibodies included in the DIG Nucleic Acid Detection Kit (Roche Molecular Biochemicals, Mannheim, Germany). A 157‐bp fragment of the IE gene ICP0, which was generated by RT‐PCR from HSV‐1 virus stock with ICP0 outer primers (Table 1), was cloned into transcription vector pGEM®‐Teasy (Promega, Mannheim, Germany) from which biotin labeled run‐off transcripts were obtained as antisense and sense nucleotide probes. The probes were detected using a tyramide signal amplification system (Genpoint, DAKO).
Table 1.
Primer and probe sequences used for RT‐PCR and in situ hybridization. Nucleotide position relates to human herpesvirus 1 complete genome (gi:1944536). Abbreviation: RT‐PCR = reverse transcription polymerase chain reaction.
| Primer | Sequence | Nucleotide position |
|---|---|---|
| 5′ ICP0 outer | ttc ggt ctc cgc ctc aga gt | 123.214–123.233 |
| 3′ ICP0 outer | gac cct cca gcc gca tac ga | 124.116–124.135 |
| 5′ ICP0 inner | ctg ctg tcc ggc agg t | 123.236–123.251 |
| 3′ ICP0 inner | gcc ccg gag cga gta | 124.086–124.100 |
| 5′ ICP4 outer | ctg ctt gtt ctc cga cgc cat | 131.108–131.128 |
| 3′ ICP4 outer | cgg ccg tcc ctg tcc ttt tt | 131.291–131.310 |
| 5′ ICP4 inner | agg tca cct acg gac tct cg | 131.185–131.204 |
| 3′ ICP4 inner | ctt ttt ccc acc caa gca t | 131.278–131.296 |
| 5′ Glycoprotein B outer | acg tac agc tcc gcg agc | 54.401–54.418 |
| 3′ Glycoprotein B outer | tct gca cca tga cca agt gg | 54.688–54.707 |
| 5′ Glycoprotein B inner | ggg tac tcg gtc agg ttg gt | 54.587–54.606 |
| 3′ Glycoprotein B inner | agg agg tgg acg aga tgc t | 54.668–54.686 |
| 5′ LAT outer | gac agc aaa aat ccc ctg ag | 120.704–120.723 |
| 3′ LAT outer | acg agg gaa aac aat aag gg | 120.879–120.898 |
| 5′ LAT inner | tag ggc caa cac aaa aga cc | 120.735–120.754 |
| 5′ Dig‐LAT Probe | cat aga gag cca ggc aca aaa aca c | 119.783–119.759 |
Nested RT‐PCR for viral genes ICP0, ICP4, glycoprotein B and LAT. Total RNA was isolated from human TG as described below. Messenger RNA was purified from total RNA using the oligotex mRNA kit (Qiagen, Hilden, Germany). The cDNA from total RNA and mRNA was checked by nested PCR for the presence of IE genes ICP0 and ICP4 and the late gene glycoprotein B (Table 1). The primers designed for ICP0 were intron spanning. The open reading frames of ICP4 and glycoprotein B do not contain an intron. Therefore, additional controls were included to check for possible contamination with genomic viral DNA. For these viral genes non‐transcribed mRNA was run in parallel with cDNA to exclude genomic remnants in the mRNA preparation. The specificity of ICP4 and ICP0 PCR amplification products has been verified by sequencing. In addition, a set of negative controls was tested to exclude co‐amplification of cellular genes. As nearly all TGs from adults show latent infection with HSV‐1, a TG from a child (4 months old) was tested for expression of HSV‐1 genes. The cDNA was negative for LAT, glycoprotein B, ICP0 and ICP4. Moreover, LAT, glycoprotein B, ICP0 and ICP4 expression was not detected in cDNA from different organs (brain, liver, muscle and lung) of four adult subjects (data not shown). A semi‐nested RT‐PCR has been established for the sensitive detection of LAT (Table 1). To quantify ICP0 transcripts, the outer primers were used in a QuantiTect SYBR® green RT‐PCR (Qiagen) on a GeneAmp 5700 Sequence Detection System (Applied Biosystems, Foster City, CA, USA). The results were normalized to the housekeeping gene GAPDH. The stability of the housekeeping gene GAPDH in HSV‐1‐infected TG was tested by comparing it to b‐actin and cyclophillin D (data not shown).
Laser‐cutting microdissection (LCM) and single cell RT‐PCR. For LCM, frozen tissue of human TG (Table 2, subjects 5 and 7) was cut into 12 µm‐thick slices and mounted on membrane slides (PALM, Bernried, Germany). These sections were stained with LAT‐specific oligoprobes. LAT positive and negative cells were isolated using LCM (Axiovert 25, Molecular Machines, Zürich, Switzerland; Axiovert 200, Palm, Microbeam Z, Palm). For each PCR reaction, pools of three to five neurons were used. Dissected cells were laser‐catapulted into caps with an adhesive filling (PALM). With a one‐step RT‐PCR kit (Qiagen), the RNA was transcribed into cDNA, and subsequently the RT‐PCR was performed in the same tube. Because of the principle of one‐step RT‐PCR a control omitting reverse transcription to exclude possible DNA contamination in case of ICP4 could not be included in these experiments. Expression of ICP0, ICP4 and LAT was analyzed at the single cell level by nested RT‐PCR with the primers described above.
Table 2.
Subjects included in the study. The abundance of CD8+ T‐cells in the TG was assessed by IHC, the IE by nested RT‐PCR, and the LAT‐positive neurons by ISH. Abbreviations: IE = immediate early; IHC = immunohistochemistry; ISH = in situ hybridization; LAT = latency‐associated transcripts; ND = not done; RT‐PCR = reverse transcription polymerase chain reaction; TG = trigeminal ganglia.
| Case | CD8 IHC | ICP0 nRT‐PCR | ICP4 nRT‐PCR | LAT ISH |
|---|---|---|---|---|
| 1* | 41 | Positive | Negative | 26 |
| 2 | 59 | Positive | Positive† | 68 |
| 3 | 32 | Negative | Negative | 18 |
| 4* | 34 | Positive | Positive | 39 |
| 5‡ | 41 | Negative | Positive | 10 |
| 6 | 45 | Positive | ND | 30 |
| 7‡ | 16 | Positive | Positive | 26 |
| 8 | 34 | Positive | Negative | 3 |
| 9 | 5 | Positive | Negative | 0§ |
| 10 | 100 | Negative | Negative | 46 |
| 11 | 38 | Positive¶ | Negative | 20 |
These subjects were used for CDR3 spectratyping.
DNA contamination cannot be excluded.
These subjects were selected for single cell RT‐PCR.
This subject tested positive only by LAT RT‐PCR.
This subject was tested by quantitative RT‐PCR for ICP0. A signal became discernible after 35 PCR cycles.
The infiltrating CD8+ T‐cells were counted at a magnification of ×400 in three fields of view that showed T‐cell clustering or accumulation. The mean number of CD8+ T‐cells is shown in column 2. For quantification of LAT, all neurons that were LAT‐positive in ISH were counted at a magnification of ×100. The number of LAT‐positive neurons is given in the last column.
CDR3 spectratyping. CDR3 spectratyping was used to characterize the TCR of the infiltrating T‐cells. The TGs of two individuals with abundant CD8+ T‐cell infiltration were tested (Table 2, subjects 1 and 4). Briefly, RNA from human TG was isolated with Trizol® (Invitrogen, Karlsruhe, Germany) and subsequently purified with the RNeasy kit (Qiagen). The cDNA was transcribed using oligo‐dT and random hexamers and was amplified using 26 different sense primers for the variable region of the TCR beta chain (Vb) and an anti‐sense primer for the constant region of the TCR (Cb) (31). The PCR products were then processed in a run‐off reaction with 13 fluorescent labeled primers for the J‐region of the TCR (Jb) (33). Transcripts were resolved on a sequencing gel, and fluorescence intensities were measured with an automated DNA sequencer (ABI377, Applied Biosystems). Clonal expansions appeared as distinct peaks of a given CDR3 length above the Gaussian‐like background of polyclonal cells. Expanded candidate Vb‐Jb subpopulations were subamplified from the initial Vb‐Cb amplification product by using Vb‐ and Jb‐specific primers and were directly sequenced. If the population of TCR‐β‐chain mRNA molecules amplified by the Vb/Jb primer combination was dominated by a single clonal transcript, the CDR3 sequence could be read by direct sequencing.
Immunohistochemistry. The following antibodies were used: rabbit anti‐human CD3; mouse anti‐human CD8; mouse anti‐human CD4 (DAKO, Hamburg, Germany); mouse anti‐human‐Vb2 (Serotec, Düsseldorf, Germany); goat anti‐rhCCL5/RANTES (R&D Systems, Wiesbaden‐Nordenstadt, Germany); goat anti‐FoxP3 (Novus Biologicals, Littleton, CO, USA); mouse anti‐human Granzyme A; mouse anti‐FoxP3 (BioLegend, San Diego, CA, USA); mouse anti‐human Granzyme B (Labvision, Fremont, CA, USA); mouse anti‐CXCR3 (clone 1C6, BD Biosciences, Heidelberg, Germany); mouse anti‐CCR5 [MC5, provided by M. Mack, University of Regensburg (36)]; rabbit anti‐Kv1.3 [provided by H.‐G. Knaus, Medical University of Innsbruck (21)]; rabbit anti‐HSV‐1 (DAKO).
Frozen tissue sections were fixed in 2% formalin or acetone and sequentially incubated with hydrogen peroxidase and 5% normal rabbit serum or normal goat serum. The primary antibodies were left to incubate on the sections overnight at 4°C. Afterwards tissue sections were incubated depending on the primary antibody either with biotinylated goat anti‐rabbit (DAKO), rabbit anti‐mouse (DAKO), or rabbit anti‐goat IgG (Jackson Immunoresearch Laboratories Inc., West Grove, PA, USA) antibodies and with peroxidase‐conjugated streptavidin (DAKO), followed by incubation with diaminobenzidine (DAKO). To detect Vb2, aminoethylcarbazole (AEC, DAKO) was used. For each antibody tested, positive and negative control sections were added. As positive controls tonsil sections were used; for negative controls, the primary antibody was replaced by the preimmune sera (in case of Kv1.3) or sera from which the respective secondary antibodies were obtained. The protocols for the staining of the chemokine receptors CCR5 and CXCR3 and double fluorescence have been described in detail elsewhere (37). To combine CCR5 with CD3, the incubation with the monoclonal anti‐CCR5 antibody was followed by a biotinylated anti‐mouse IgG 2a (Caltag Laboratories, Burlingame, CA, USA) and by Streptavidin‐FITC (DAKO). Consecutively, slides were exposed to a monoclonal rat anti‐CD3 (Serotec) and an anti‐rat Cy3 antibody (Jackson Immunoresearch Laboratories Inc.). To combine CCR5 with CD8 staining, the CCR5 staining was performed as described above and followed by microwave treatment. The anti‐CD8 antibody (DAKO) was detected by an anti‐mouse IgG labeled with Texas Red® (Vector Laboratories Inc, Burlingame, CA, USA). Identical protocols were used for double staining of CXCR3 with CD3 and CD8. As controls each staining series consisted of four consecutive sections that replaced each primary antibody with the isotype IgG control. This results in single staining (when one antibody is replaced) or negative staining (after replacement of both antibodies).
TaqmanTM RT‐PCR. RNA was extracted and reverse transcribed as mentioned above and previously described (44). Primer and TaqMan(tm)‐probes for granzyme B and perforin were taken from the literature (39). All primers were intron‐spanning. Cyclophillin D primers and TaqMan(tm)‐probe were purchased from Applied Biosystems. The TaqMan PCR was performed using the GeneAmp(tm) 5700 Sequence Detection System. Data were analyzed with GeneAmp(tm) 5700 SDS software. Each measurement was done in triplicate. The relative transcript number was calculated from the formula 2−DCt × 105, where ΔCt stands for the difference between the threshold cycle number of the housekeeping gene and the respective gene of interest. Correlation analysis was statistically assessed using Spearman’s rank order test.
RESULTS
IE genes are expressed in human TG latently infected with HSV‐1. A positive hybridization signal for LAT was detected in TG from both sides in ten out of 11 examined individuals (Table 2). When the RNA derived from frozen TG was tested for LAT by RT‐PCR, a positive LAT amplicon was found in every individual.
ICP0 transcripts were amplified from the cDNA of the TG of 8/11 individuals who were positive for LAT by in situ hybridization and/or RT‐PCR (Table 2). Quantification of the ICP0 transcript in Subject 11 showed a detectable signal after 35 cycles of RT‐PCR. ICP4, detected in cDNA from mRNA, showed a similar distribution pattern as ICP0 but was less frequent (4/10; Table 2, Figure 1A). In contrast, no transcripts of the late gene glycoprotein B were detected when nested RT‐PCR was used. When IHC was used HSV‐1 proteins were not detected in the TG that were positive for the IE genes.
Figure 1.
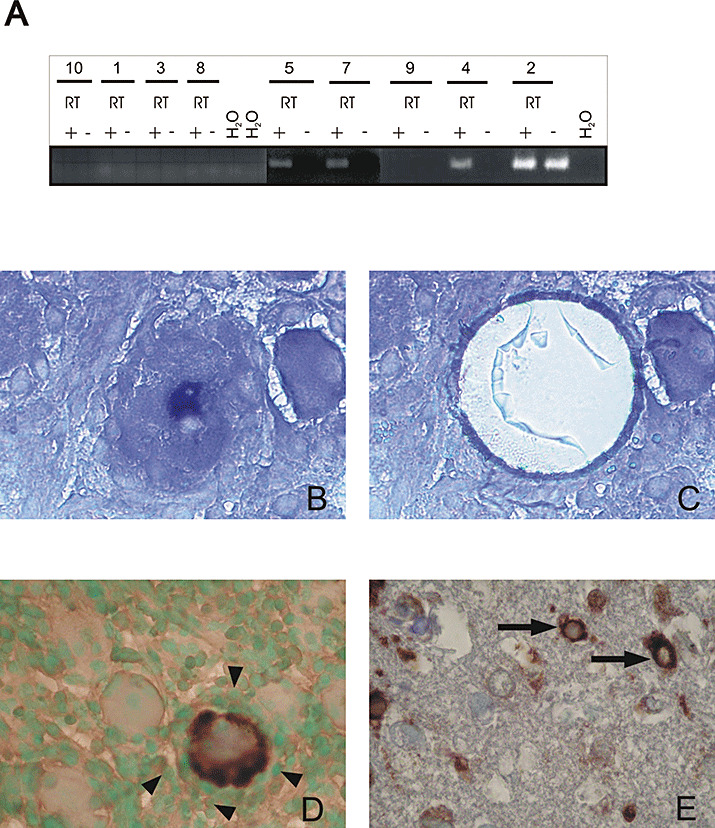
A. ICP4 nested RT‐PCR. The subjects shown were tested with and without reverse transcriptase (RT). A clear amplicon can be seen in the samples of subjects 4, 5 and 7 (no amplification could be seen in the corresponding samples without RT). The possibility of DNA contamination in Subject 2 cannot be excluded, as a signal is also seen in the sample without RT. B–E. Laser‐cutting microdissection (LCM) and detection of ICP0 and LAT by in situ hybridization in human TG latently infected with HSV‐1; (B) LAT ISH: positive neuron shows dark blue nucleus (before LCM). C demonstrates the same section as in B after LCM; the LAT‐positive neuron has been excised. (D) ICP0 ISH: positive neuron shows dark brown cytoplasm and is surrounded by mononuclear cells (arrowheads) in the TG, counterstained with methylgreen. (E) Positive ICP0 signal in neurons of an HSV‐1 encephalitis control case (arrows). ISH = in situ hybridization; LAT = latency‐associated transcripts; RT‐PCR = reverse transcription polymerase chain reaction.
These findings were confirmed at the single cell level by applying LCM. For this methodology, tissue sections from the TG of two individuals (subjects 5 and 7) were used. Before the LCM a formamide‐free LAT in situ hybridization was performed. Subsequently, pools of neurons that were LAT positive or negative by in situ hybridization (ISH) were laser cut and tested using a single cell RT‐PCR (Figure 1B,C). Around half of the neuron pools that were positive by LAT ISH tested also positive by nested RT‐PCR for ICP0 (Table 3). The frequency of neurons that contained both LAT and ICP4 was slightly higher. The possibility that such an increased frequency of ICP4‐positive neurons might be caused by DNA contamination could not be excluded in this set of experiments. Furthermore, single cell RT‐PCR also detected LAT in neurons that were negative by in situ hybridization (Table 3).
Table 3.
Single cell RT‐PCR on the TG of two subjects who showed a positive amplicon in the nested ICP0 or ICP4 RT‐PCR. Abbreviations: ND = not done; RT‐PCR = reverse transcription polymerase chain reaction; TG = trigeminal ganglia.
| Subjects | LAT(ISH)+/− neurons | LAT nRT‐PCR | ICP0 nRT‐PCR | ICP4 nRT‐PCR |
|---|---|---|---|---|
| 5 | + | 5/6 | 1/3 | 4/4 |
| − | 1/2 | ND | ND | |
| 7 | + | 2/2 | 3/5 | 3/5 |
| − | 0/1 | 0/1 | 1/1 |
5/6=indicates that 5 of 6 neuron pools were positive. One neuron pool consists of 3 to 5 laser cut neurons.
To further substantiate that IE genes are expressed in situ, all individuals who tested positive by nested RT‐PCR were also tested by ICP0 in situ hybridization. In Subject 4 a positive hybridization signal for ICP0 was detected using the sensitive tyramide amplification system. The ICP0 hybridization signal was localized to the cytoplasm and the positive neuron was surrounded by inflammatory cells (Figure 1D). A similar staining pattern was found in the neurons of two herpes simplex encephalitis control cases (Figure 1E).
Clonal expansion of infiltrating T‐cells. The TG of two representative individuals who showed abundant T‐cell infiltration (subjects 1 and 4, Table 2) was further examined to look for clonal expansion of infiltrating T‐cells. CDR3 spectratyping revealed single peaks of distinct length in some of the Vb chains in both individuals (Figure 2A). Fifteen out of 238 possible Vb/Jb combinations and two out of 26 possible Vb/Cb combinations showed evidence of clonal expansion in the CDR3 spectratyping of the TG of Subject 1. In the other tested individual, six out of 238 possible Vb/Jb combinations and one out of 26 possible Vb/Cb combinations showed a clonal distribution. The difference between the individuals reflects the heterogeneous major histocompatibility complex background, which influences the TCR usage.
Figure 2.
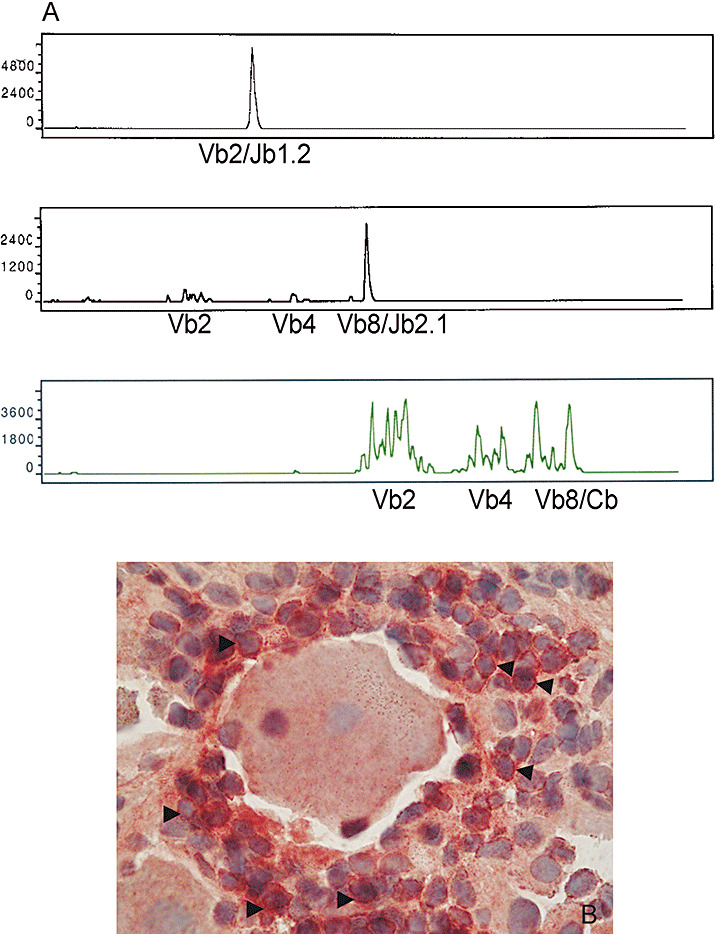
Examples of CDR3 spectratyping (A) and Vb2 IHC (B) on the same TG of Subject 1. A. In the first panel, the expansion of T‐cells with Vb2 and Jb1.2 is shown. In the second panel the expansion of T‐cells with Vb8 and Jb2.1 is provided. The sequences of these peaks are shown in Table 4A. In the third panel a polyclonal Gaussian‐like distribution of TCR lengths for Vb2, 4, 8 and Cb is shown. B. IHC with an antibody specific for Vb2 in the TG section of Subject 1 is shown. Vb2‐positive T‐cells (red cytoplasm, AEC, some labeled with arrowheads) around a neuron (×1000; counterstained with hematoxylin). CDR3 spectratyping showed an expansion of T‐cells with Vb2 in the same individual (see first panel). IHC = immunohistochemistry; TCR = T‐cell receptor; TG = trigeminal ganglia.
The peaks in CDR3 spectratyping were subamplified and sequenced. A readable sequence was identified in 8/17 TCRs of Subject 1 and 4/7 TCRs of Subject 4 (Table 4). The nucleotide sequence was translated into the amino acid sequence. Between the V‐ and J‐regions is the hypervariable N(D)N region which interacts directly with specific antigenic peptides. Single peaks in spectratyping (Figure 2A) which reveal readable sequences (Table 4) confirm a clonal T‐cell expansion (32). The end of the V region and the beginning of the J region are underlined. The Vb2‐clonally expanded T‐cells were stained in the TG of Subject 1 with the corresponding antibody. A surface staining was discernible in numerous infiltrating T‐cells in close proximity to the neurons (Figure 2B).
Table 4.
Clonally expanded TCR and the predicted amino acid sequences of the oligoclonal peaks from two individuals latently infected with HSV‐1. Abbreviations: HSV‐1 = herpes simplex virus type 1; TCR = T‐cell receptor; TG = trigeminal ganglia.
| (A) Vb‐Jb combination of the TCR in TG of Subject 1 | ||||||||||||||||||||
| Vb1 Jb1.6 | C | A | S | R | G | S | G | S | S | P | L | H | ||||||||
| Vb10 Jb2.6 | C | A | S | S | K | V | Y | ? | V | G | G | S | ||||||||
| Vb17 Jb2.5 | C | A | S | S | F | Q | E | T | Q | Y | ||||||||||
| Vb13.1 Jb2.5 | C | A | S | K | Q | Q | ? | ? | Q | ? | ? | ? | Y | |||||||
| Vb2 Jb1.2 | C | S | S | H | T | ? | P | I | L | ? | ? | Y | T | F | ||||||
| Vb16 Jb2.3 | C | A | S | S | Q | E | L | A | R | G | D | T | Q | Y | F | |||||
| Vb5.2 Jb1.2 | C | A | S | S | L | R | T | G | P | Y | Y | ? | ? | Y | T | F | ||||
| Vb8 Jb2.1 | C | A | S | S | N | P | S | R | A | G | G | L | S | S | Y | N | E | Q | F | F |
| (B) Vb‐Jb combination of the TCR in TG of Subject 4 | |||||||||||||||||
| Vb13.2 Jb2.3 | C | A | S | K | M | L | K | T | S | G | S | T | D | T | Q | Y | F |
| Vb17 Jb2.3 | C | A | S | R | S | G | G | G | S | T | D | T | Q | Y | F | ||
| Vb23 Jb2.7 | C | A | S | R | ? | R | ? | L | I | S | Y | E | Q | Y | F | ||
| Vb7 Jb1.2 | C | A | S | S | S | R | T | G | E | G | ? | Y | G | Y | T | F | |
Infiltrating CD8+ T‐cells express a chemokine receptor profile congruent with effector memory T‐cells. Abundant infiltration with CD8+ T‐cells was detected in the TG of ten individuals who were positive by LAT in situ hybridization (Table 2). The T‐cells were mainly found in clusters around neurons and rarely around LAT‐positive neurons (Figure 3A).
Figure 3.
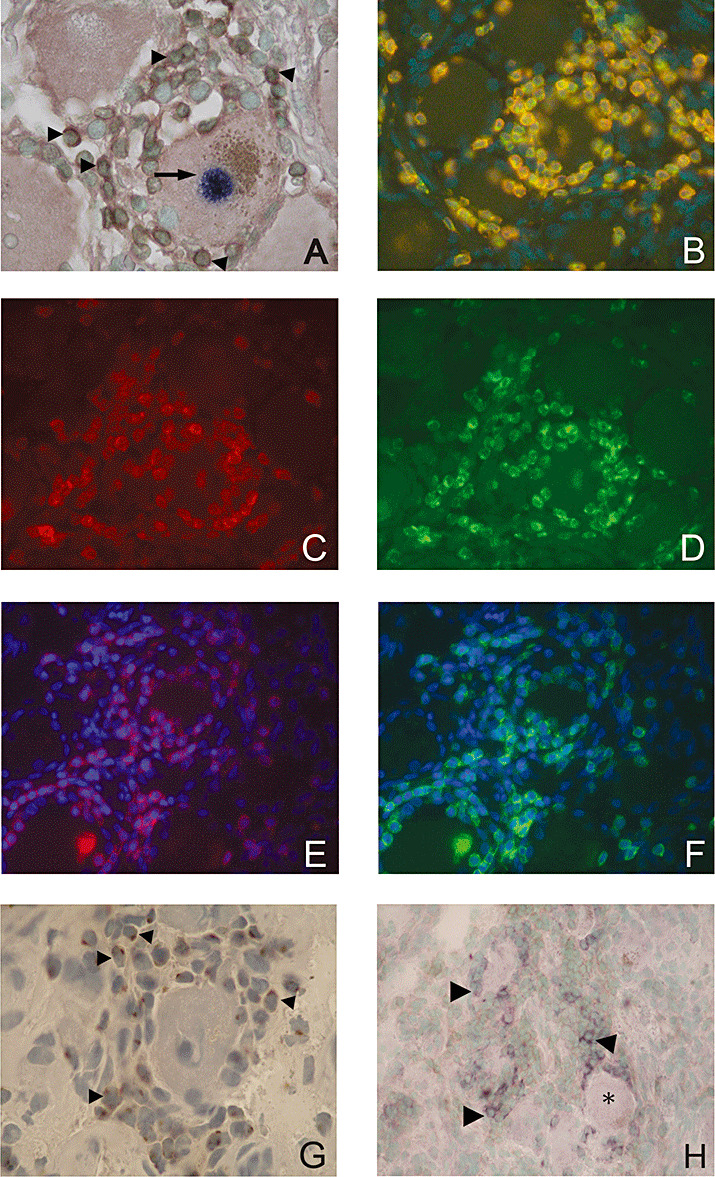
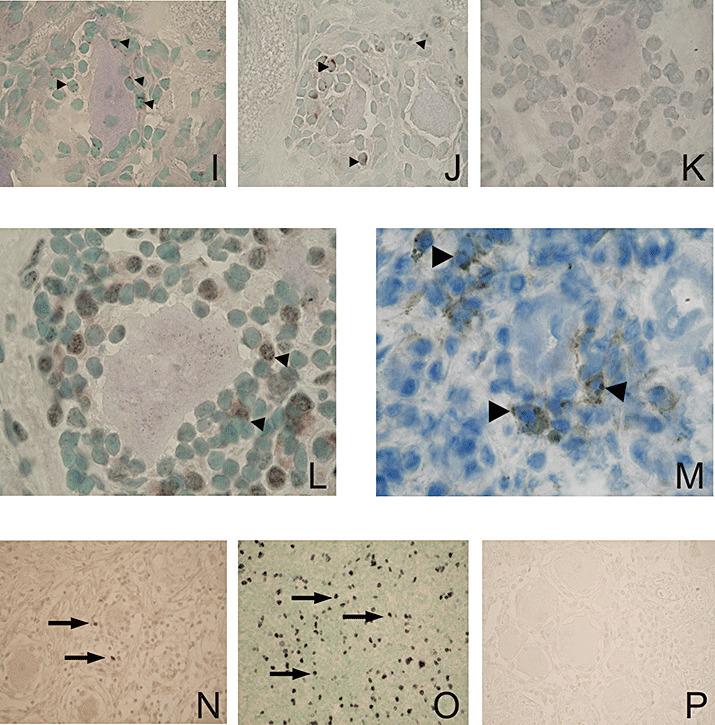
Characterization of the T‐cell phenotype in human TG latently infected with HSV‐1. A. Combination of LAT ISH and CD3 IHC: a LAT‐positive neuron with a dark blue nucleus (arrow) encircled by brown (diaminobenzidine) stained CD3+ T‐cells (arrowheads), counterstained with methyl green (×1000). B. Fluorescence double staining for CXCR3 and CD3: Double positive CXCR3 and CD3 T‐cells (yellow) using FITC‐labeled antibody (green) for CXCR3 and Cy3‐labeled antibody (red) for CD3, counterstained with DAPI (one‐channel image, ×400). C,D. Fluorescence double staining of CD8 (red) using Texas Red®‐labeled antibody (C) and CXCR3 (green) using FITC‐labeled antibody (D) (two‐channel image, ×400). E,F. Fluorescence double staining of CD8 (red) using Texas Red®‐labeled antibody (E) and CCR5 (green) using FITC‐labeled antibody (F), counterstained with DAPI (two‐channel image ×400). G. CCL5/RANTES producing cells (brown, arrowheads) around a sensory neuron, counterstained with hematoxylin (×1000). H. CXL10/IP‐10 producing cells (dark blue) among CD3+ infiltrates (arrowheads) and within the close vicinity of the sensory neurons (asterisk), counterstained with methyl green (×400). I. Granules containing granzyme B in the cytoplasm of T cells (brown, arrowheads) in close proximity to the neuron (×1000). J. Granules containing granzyme A in the cytoplasm of T cells (brown, arrowheads) around neurons (×1000). K. Negative control section applied in parallel to the granzyme A and B stainings (TG section incubated with 5% normal rabbit serum instead of the primary antibody), (×1000). L. Kv1.3 positive T‐cells (brown, arrowheads) among the infiltrates around a neuron (×1000). M. CD4 positive T‐cells among the infiltrates (brown, arrowheads), (×1000). N. Rare Foxp3 + T‐cells (brown, arrows) in the vicinity of the infiltrates (×400). O. Numerous Foxp3 + T‐cells (brown, arrows) in a human tonsil (positive control tissue), (×400). P. Negative control section applied in parallel to the FoxP3 staining (TG section incubated with 5% normal rabbit serum), (×400). DAPI = 4’,6‐Diamidino‐2‐phenylindole; HSV‐1 = herpes simplex virus type 1; IHC = immunohistochemistry; ISH = in situ hybridization; LAT = latency‐associated transcripts; TG = trigeminal ganglia.
A prominent part of the infiltrating inflammatory cells demonstrated CCR5 and CXCR3 positivity on IHC (Figure 3B–F). The pattern of chemokine receptor‐positive cells corresponded to the distribution of CD8+ T‐cells (Figure 3C–F).
CCL5/RANTES and CXCL10/IP‐10 expression on infiltrating cells. A subpopulation of the infiltrating cells showed cytoplasmic staining with the CCL5/RANTES antibody (Figure 3G). The sparse cytoplasm and the round shape of these cells were typical for T‐cells. In general, a large number of positive CCL5/RANTES cells were found within prominent infiltrates around some neurons in the TG with an abundant T‐cell infiltration.
Like the CCL5/RANTES immunohistochemical staining, a distinct hybridization signal was detected with the antisense CXCL10/IP‐10 probe. As expected, the signal was confined to the cytoplasm. Positive cells were found in the infiltrates around the neurons (Figure 3H).
Infiltrating CD8+ T‐cells express markers of recent activation. Granzymes A and B were expressed by a subpopulation of infiltrating cells (Figure 3I,J). Besides their cytolytic functions, granzyme B is also considered to be a marker of activation (47). The pattern of distribution of the cells expressing cytolytic proteases is similar to that seen for the chemokines RANTES and CXCL10. Expression of granzyme B was verified on the transcript level by quantitative RT‐PCR. In addition, expression of perforin was also shown on the RNA level by quantitative RT‐PCR. For comparison CD8, granzyme B, and perforin expression in human unstimulated peripheral blood mononuclear cells (PBMCs) was included. Expression of granzyme B and perforin in the TG correlated with the amount of CD8 transcripts (P < 0.001 for perforin/CD8 correlation; P < 0.03 for granzyme B/CD8 correlation). Spearman’s rank order test was used to evaluate the data (Figure 4).
Figure 4.
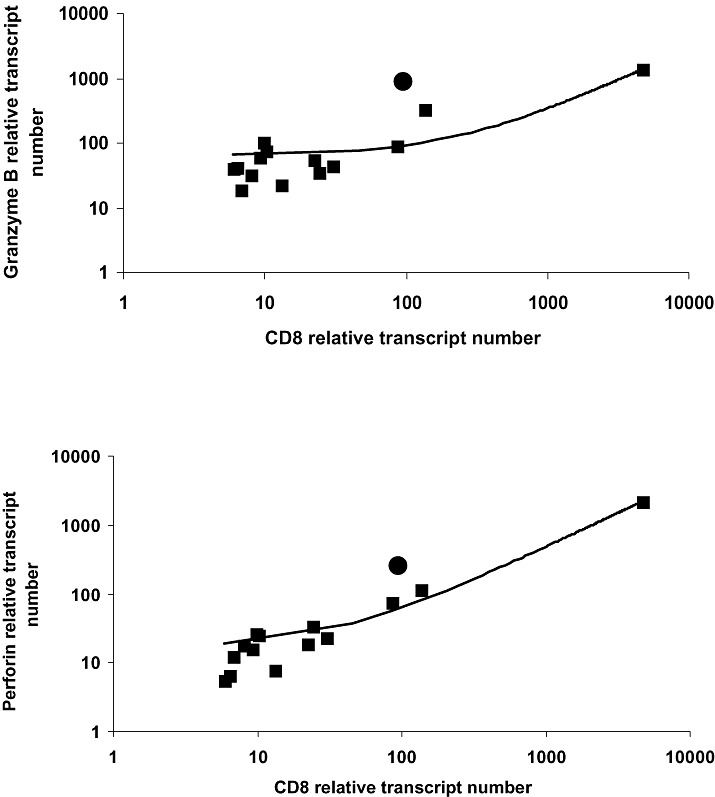
Correlation of Granzyme B and Perforin transcripts with CD8 transcripts in human TG. Quantitative RT‐PCRs for granzyme B, perforin, and CD8 were performed in 14 human TGs. The relative transcript number for each gene was calculated as described. Values of granzyme B and perforin were plotted for each TG against CD8 (shown as filled squares). For comparison, the respective expression values in PBMCs are shown as filled circles. In TG, a clear correlation can be detected between CD8 and granzyme B and perforin expression, respectively. The correlation coefficient for granzyme B/CD8 was 0.6 (P < 0.03) and the correlation coefficient for perforin/CD8 was 0.9 (P < 0.001). PBMC = ••; RT‐PCR = reverse transcription polymerase chain reaction; TG = trigeminal ganglia.
A subpopulation of the infiltrating cells expressed the voltage gated potassium channel Kv1.3. T‐cells positive for Kv1.3 were found in the near vicinity of neurons or in the outer layers of the clusters (Figure 3L). More recently, it was shown that T‐cells expressing this type of potassium channel are chronically activated memory effector cells. It has been demonstrated that T‐cells, which are chronically stimulated, up‐regulate the Kv1.3 channel by up to fivefold (49). This is in contrast to resting T‐cells that express only up to 400 Kv1.3 channels, a level that is below the detection limits of IHC (50). The amount of Kv1.3 positive cells was slightly higher than the cells positive for chemokines and granzymes.
Scarce CD4+ T‐cells and no regulatory T‐cells expressing FoxP3 were present in the infiltrates. CD4+ T‐cells were mainly distributed among the nerve fibers (data not shown). Only a small number was found in the agglomerates around the neurons (Figure 3M). As CD4 is also present on monocytes/macrophages and dendritic cells, some of the positive staining might be attributed to the binding of the anti‐CD4 antibody to other than helper/inducer T‐cells.
FoxP3 is a surrogate marker for regulatory CD4+ T‐cells which is crucial for their functional characteristics (16). No FoxP3‐positive T‐cells were found among the infiltrates when using goat and mouse anti‐FoxP3 antibodies on frozen or paraffin sections. Very few FoxP3‐positive cells were detected among the nerve fibers and close to small vessels (Figure 3N). They were, however, abundant in the control tonsil section (Figure 3O).
DISCUSSION
In the present study we found that besides LAT, the viral IE genes ICP0 and ICP4 are expressed in human TG during latent infection with HSV‐1. Transcripts of IE were localized to LAT‐positive neurons at the single cell level. In addition, we showed that neurons that were negative for LAT by ISH express low levels of LAT transcripts by single cell RT‐PCR. This argues for a higher frequency of HSV‐1‐infected neurons in human TG than suggested by ISH. A recent study by Wang et al further corroborates our observation (48). By combining ISH/LCM/PCR, they found that the majority of latently infected neurons do not accumulate LAT to detectable levels. This would further explain why so many neurons, usually negative by LAT ISH, are also surrounded by T‐cells. One may speculate that the neurons with low levels of LAT express higher levels of IE genes. This hypothesis is in accordance with HSV‐1 in vitro experiments that clearly demonstrated that LAT can reduce the steady‐state mRNA levels of ICP0, ICP4 and ICP27 (26).
Expression of HSV‐1 IE genes in human TG can be interpreted in three different ways: IE gene expression (i) is part of the HSV‐1 latent infection analogous to VZV, (ii) is the result of spontaneous reactivation of HSV‐1 during latency, and (iii) reflects reactivation induced by tissue processing. The fact that IE genes are not uniformly found in all TG and that IE genes do not correlate with the cause of death or the post‐mortem time argues against the hypothesis that HSV‐1 reactivates because of tissue processing. In addition, we did not find HSV‐1 late transcript or protein expression which would indicate full‐blown reactivation. Thus, we suggest that the presence of IE genes is linked to HSV‐1 latency and may represent the antigenic trigger that sustains the chronic inflammation in the TG.
Our findings are analogous to those from the HSV‐1 mouse model, except that in the HSV‐1 mouse model, late gene transcripts in addition to IE were demonstrated in latently infected TG (12). In the HSV‐1 mouse model with a C57BL/6 background, the majority of CD8+ T‐cells recognized an epitope of the late gene glycoprotein B (20). In our study, we were not able to detect glycoprotein B, but it could well be that small amounts of this antigen sustain the abundant chronic immune infiltration in human TG. It is also conceivable that protein products of the IE suffice to attract T‐cells to the site of latent infection in human TG. The fact that the IE could not be detected in all samples in which T‐cells were present might be caused by the very small amount of antigen or an intermittent production of antigen. The amount of T‐cell response does not have to correspond to the quantity of antigen. T‐cell stimulation requires very low levels of epitope expression, and brief exposure to the antigen is sufficient for expansion and differentiation of T‐cells 18, 34. As a matter of fact, earlier studies on the HSV‐1 specific CD8+ CTL have shown that a significant fraction is specific for non‐structural viral proteins 28, 46. This is in accordance with the results from studies of other herpesviruses (CMV), in which non‐structural viral proteins appear to be preferentially recognized by CD8+ T‐cells 8, 35. Moreover, in vitro studies by Melchjorsen et al showed that accumulation of CCL5/RANTES mRNA expression in HSV‐1‐infected macrophages was preceded by viral IE mRNA and protein, but not early and late gene products (30). Decman et al demonstrated that mouse neurons express ICP0 and ICP4 when they are prevented from reactivation by CD8+ T‐cells (7).
Although the triggering antigen for the local immune response remains unidentified, we provide evidence for an antigen‐driven immune cell infiltration. In our study we show an oligoclonal expansion of T‐cells with certain TCR Vb chains in the TG of two individuals latently infected with HSV‐1. An immunohistochemical staining of the corresponding TCR showed that the clonally expanded T‐cells were clustered around neurons.
It is well established that both specific and nonspecific T‐cells can migrate into the central nervous system (CNS) or peripheral nervous system (PNS) after viral infection 47, 51. A great proportion of the infiltrating T‐cells may therefore be non‐specific for HSV‐1. A recent study of van Lint et al demonstrated in the mouse model that only HSV‐1‐specific CD8+ T‐cells in dorsal root ganglia express high levels of preformed granzyme B (47). The authors showed that the elevated granzyme levels were totally dependent on antigen presentation by parenchymal cells within the ganglia. The question of whether infiltrating T‐cells in the human system show similar features needs to be further elucidated.
We showed that granzyme B, granzyme A and perforin are expressed in human TG. Although granzyme B and perforin expression did not exceed the levels of purified PBMCs in quantitative RT‐PCR, we believe that a local accumulation of these proteins within inflammatory infiltrates as shown by IHC can have an impact on viral latency. Therefore, CD8+ T‐cells are fully equipped with cytolytic machinery. Nevertheless, these T‐cells do not seem to damage the tissue. A possible mechanism of protection could be an inhibition of degranulation by CD95/CD95L interaction at the T‐cell/neuron junction (29).
The chemokine receptor profile expressed by the infiltrating T‐cells suggests that the T‐cells were stimulated and acquired a memory effector phenotype. The vast majority of infiltrating cells co‐express CCR5 and CXCR3. In addition, their ligands CCL5/RANTES protein and CXCL10/IP‐10 mRNA were also expressed by a subpopulation of the T‐cells. The chemokine receptors CXCR3 and CCR5 are thought to be key receptors for accumulation of T‐cells at sites of inflammation inside the CNS. CXCR3 signaling plays an important role in controlling the migration of effector CD8+ T‐cells to the site of viral replication within the CNS 4, 24. The CCR5 receptor is expressed on a phenotype of T‐cells after recent activation, and its expression is restricted to memory effector CD8+ T‐cells but not to naive CD8+ T‐cells (13). Likewise the ligand CCL5/RANTES is also found on memory T‐cells. Despite high levels of mRNA for CCL5/RANTES, memory T‐cells made no CCL5/RANTES on the protein level unless the cells had been stimulated via their TCR (41).
Further substantiation of the theory that the CD8+ T‐cells are activated by antigen is furnished by the expression of Kv1.3high in a large proportion of T‐cells. It is assumed that enhanced Kv1.3 expression is necessary for activated memory cells to perform their effector functions. Inhibition of the Kv1.3 channels suppresses the antigen‐driven proliferation and cytokine production by memory T‐cells (49).
Although fully equipped with cytotoxic effector proteins, the infiltrating T‐cells neither harm the host cells nor eradicate the latent virus. It is not clear what mechanisms are involved in counteracting the adverse effects of the immune response. In contrast to the animal model, hardly any FoxP3‐positive regulatory T‐cells were detected. Further studies will be needed to decipher the regulatory mechanisms that control the infiltrating CD8 T‐cells.
In summary, we showed for the first time the expression of IE genes of HSV‐1 in human TG. Moreover, the local T‐cell response is clonally expanded and shows an activated memory‐effector phenotype. Our data emphasize that cytotoxic T‐cells do not always need to have a detrimental effector function. It depends on the interplay among virus, host cells and immune system. If there is latent HSV‐1 infection in the sensory neurons, the expression of effector molecules by CD8+ T‐cells might help maintain a balance between virus and host cell by preventing the virus from reactivating and thus protecting the neuron from damage.
ACKNOWLEDGMENTS
We thank Judy Benson for carefully revising the manuscript. We also thank Igor Paripovic, Ingrid Eiglmeier, Ulrike Brandt, and Dan Draganovici for their excellent technical support. S. Segerer is supported by the Else Kröner‐Fresenius Stiftung. This work was supported by the Deutsche Forschungsgemeinschaft, grant TH 894 (to DT and TD) and grant SFB571‐A1 (to KD).
REFERENCES
- 1. Cantin EM, Hinton DR, Chen J, Openshaw H (1995) Gamma interferon expression during acute and latent nervous system infection by herpes simplex virus type 1. J Virol 69:4898–4905. [DOI] [PMC free article] [PubMed] [Google Scholar]
- 2. Chen SH, Kramer MF, Schaffer PA, Coen DM (1997) A viral function represses accumulation of transcripts from productive‐cycle genes in mouse ganglia latently infected with herpes simplex virus. J Virol 71:5878–5884. [DOI] [PMC free article] [PubMed] [Google Scholar]
- 3. Chen SH, Garber DA, Schaffer PA, Knipe DM, Coen DM (2000) Persistent elevated expression of cytokine transcripts in ganglia latently infected with herpes simplex virus in the absence of ganglionic replication or reactivation. Virology 278:207–216. [DOI] [PubMed] [Google Scholar]
- 4. Christensen JE, Nansen A, Moos T, Lu B, Gerard C, Christensen JP, Thomsen AR (2004) Efficient T‐cell surveillance of the CNS requires expression of the CXC chemokine receptor 3. J Neurosci 24:4849–4858. [DOI] [PMC free article] [PubMed] [Google Scholar]
- 5. Cohrs RJ, Laguardia JJ, Gilden D (2005) Distribution of latent herpes simplex virus type‐1 and varicella zoster virus DNA in human trigeminal Ganglia. Virus Genes 31:223–227. [DOI] [PubMed] [Google Scholar]
- 6. Croen KD, Ostrove JM, Dragovic LJ, Smialek JE, Straus SE (1987) Latent herpes simplex virus in human trigeminal ganglia. Detection of an immediate early gene “anti‐sense” transcript by in situ hybridization. N Engl J Med 317:1427–1432. [DOI] [PubMed] [Google Scholar]
- 7. Decman V, Kinchington PR, Harvey SA, Hendricks RL (2005) Gamma interferon can block herpes simplex virus type 1 reactivation from latency, even in the presence of late gene expression. J Virol 79:10339–10347. [DOI] [PMC free article] [PubMed] [Google Scholar]
- 8. Del VM, Munch K, Reddehase MJ, Koszinowski UH (1989) Presentation of CMV immediate‐early antigen to cytolytic T lymphocytes is selectively prevented by viral genes expressed in the early phase. Cell 58:305–315. [DOI] [PubMed] [Google Scholar]
- 9. DeLuca NA, Schaffer PA (1985) Activation of immediate‐early, early, and late promoters by temperature‐sensitive and wild‐type forms of herpes simplex virus type 1 protein ICP4. Mol Cell Biol 5:1997–2008. [DOI] [PMC free article] [PubMed] [Google Scholar]
- 10. Ellison AR, Yang L, Voytek C, Margolis TP (2000) Establishment of latent herpes simplex virus type 1 infection in resistant, sensitive, and immunodeficient mouse strains. Virology 268:17–28. [DOI] [PubMed] [Google Scholar]
- 11. Everett RD (2000) ICP0, a regulator of herpes simplex virus during lytic and latent infection. Bioessays 22:761–770. [DOI] [PubMed] [Google Scholar]
- 12. Feldman LT, Ellison AR, Voytek CC, Yang L, Krause P, Margolis TP (2002) Spontaneous molecular reactivation of herpes simplex virus type 1 latency in mice. Proc Natl Acad Sci USA 99:978–983. [DOI] [PMC free article] [PubMed] [Google Scholar]
- 13. Fukada K, Sobao Y, Tomiyama H, Oka S, Takiguchi M (2002) Functional expression of the chemokine receptor CCR5 on virus epitope‐specific memory and effector CD8+ T cells. J Immunol 168:2225–2232. [DOI] [PubMed] [Google Scholar]
- 14. Grinfeld E, Goodwin R, Kennedy PG (2007) Varicella‐Zoster virus gene expression at variable periods following death in a rat model of ganglionic infection. Virus Genes 35:29–32. [DOI] [PubMed] [Google Scholar]
- 15. Halford WP, Gebhardt BM, Carr DJ (1996) Persistent cytokine expression in trigeminal ganglion latently infected with herpes simplex virus type 1. J Immunol 157:3542–3549. [PubMed] [Google Scholar]
- 16. Hori S, Nomura T, Sakaguchi S (2003) Control of regulatory T cell development by the transcription factor Foxp3. Science 299:1057–1061. [DOI] [PubMed] [Google Scholar]
- 17. Hufner K, Derfuss T, Herberger S, Sunami K, Russell S, Sinicina I, Arbusow V, Strupp M, Brandt T, Theil D (2006) Latency of alpha‐herpes viruses is accompanied by a chronic inflammation in human trigeminal ganglia but not in dorsal root ganglia. J Neuropathol Exp Neurol 65:1022–1030. [DOI] [PubMed] [Google Scholar]
- 18. Kaech SM, Ahmed R (2001) Memory CD8+ T cell differentiation: initial antigen encounter triggers a developmental program in naive cells. Nat Immunol 2:415–422. [DOI] [PMC free article] [PubMed] [Google Scholar]
- 19. Kennedy PG, Grinfeld E, Bell JE (2000) Varicella‐zoster virus gene expression in latently infected and explanted human ganglia. J Virol 74:11893–11898. [DOI] [PMC free article] [PubMed] [Google Scholar]
- 20. Khanna KM, Bonneau RH, Kinchington PR, Hendricks RL (2003) Herpes simplex virus‐specific memory CD8+ T cells are selectively activated and retained in latently infected sensory ganglia. Immunity 18:593–603. [DOI] [PMC free article] [PubMed] [Google Scholar]
- 21. Koch RO, Wanner SG, Koschak A, Hanner M, Schwarzer C, Kaczorowski GJ, Slaughter RS, Garcia ML, Knaus HG (1997) Complex subunit assembly of neuronal voltage‐gated K+ channels. Basis for high‐affinity toxin interactions and pharmacology. J Biol Chem 272:27577–27581. [DOI] [PubMed] [Google Scholar]
- 22. Kramer MF, Coen DM (1995) Quantification of transcripts from the ICP4 and thymidine kinase genes in mouse ganglia latently infected with herpes simplex virus. J Virol 69:1389–1399. [DOI] [PMC free article] [PubMed] [Google Scholar]
- 23. Kramer MF, Chen SH, Knipe DM, Coen DM (1998) Accumulation of viral transcripts and DNA during establishment of latency by herpes simplex virus. J Virol 72:1177–1185. [DOI] [PMC free article] [PubMed] [Google Scholar]
- 24. Liu MT, Chen BP, Oertel P, Buchmeier MJ, Armstrong D, Hamilton TA, Lane TE (2000) The T cell chemoattractant IFN‐inducible protein 10 is essential in host defense against viral‐induced neurologic disease. J Immunol 165:2327–2330. [DOI] [PubMed] [Google Scholar]
- 25. Liu T, Tang Q, Hendricks RL (1996) Inflammatory infiltration of the trigeminal ganglion after herpes simplex virus type 1 corneal infection. J Virol 70:264–271. [DOI] [PMC free article] [PubMed] [Google Scholar]
- 26. Mador N, Goldenberg D, Cohen O, Panet A, Steiner I (1998) Herpes simplex virus type 1 latency‐associated transcripts suppress viral replication and reduce immediate‐early gene mRNA levels in a neuronal cell line. J Virol 72:5067–5075. [DOI] [PMC free article] [PubMed] [Google Scholar]
- 27. Maillet S, Naas T, Crepin S, Roque‐Afonso AM, Lafay F, Efstathiou S, Labetoulle M (2006) Herpes simplex virus type 1 latently infected neurons differentially express latency‐associated and ICP0 transcripts. J Virol 80:9310–9321. [DOI] [PMC free article] [PubMed] [Google Scholar]
- 28. Martin S, Courtney RJ, Fowler G, Rouse BT (1988) Herpes simplex virus type 1‐specific cytotoxic T lymphocytes recognize virus nonstructural proteins. J Virol 62:2265–2273. [DOI] [PMC free article] [PubMed] [Google Scholar]
- 29. Medana I, Li Z, Flugel A, Tschopp J, Wekerle H, Neumann H (2001) Fas ligand (CD95L) protects neurons against perforin‐mediated T lymphocyte cytotoxicity. J Immunol 167:674–681. [DOI] [PubMed] [Google Scholar]
- 30. Melchjorsen J, Pedersen FS, Mogensen SC, Paludan SR (2002) Herpes simplex virus selectively induces expression of the CC chemokine RANTES/CCL5 in macrophages through a mechanism dependent on PKR and ICP0. J Virol 76:2780–2788. [DOI] [PMC free article] [PubMed] [Google Scholar]
- 31. Monteiro J, Hingorani R, Peroglizzi R, Apatoff B, Gregersen PK (1996) Oligoclonality of CD8+ T cells in multiple sclerosis. Autoimmunity 23:127–138. [DOI] [PubMed] [Google Scholar]
- 32. Pannetier C, Even J, Kourilsky P (1995) T‐cell repertoire diversity and clonal expansions in normal and clinical samples. Immunol Today 16:176–181. [DOI] [PubMed] [Google Scholar]
- 33. Puisieux I, Even J, Pannetier C, Jotereau F, Favrot M, Kourilsky P (1994) Oligoclonality of tumor‐infiltrating lymphocytes from human melanomas. J Immunol 153:2807–2818. [PubMed] [Google Scholar]
- 34. Purbhoo MA, Irvine DJ, Huppa JB, Davis MM (2004) T cell killing does not require the formation of a stable mature immunological synapse. Nat Immunol 5:524–530. [DOI] [PubMed] [Google Scholar]
- 35. Reddehase MJ, Mutter W, Munch K, Buhring HJ, Koszinowski UH (1987) CD8‐positive T lymphocytes specific for murine cytomegalovirus immediate‐early antigens mediate protective immunity. J Virol 61:3102–3108. [DOI] [PMC free article] [PubMed] [Google Scholar]
- 36. Segerer S, Mack M, Regele H, Kerjaschki D, Schlondorff D (1999) Expression of the C‐C chemokine receptor 5 in human kidney diseases. Kidney Int 56:52–64. [DOI] [PubMed] [Google Scholar]
- 37. Segerer S, Banas B, Wornle M, Schmid H, Cohen CD, Kretzler M, Mack M, Kiss E, Nelson PJ, Schlondorff D, Grone HJ (2004) CXCR3 is involved in tubulointerstitial injury in human glomerulonephritis. Am J Pathol 164:635–649. [DOI] [PMC free article] [PubMed] [Google Scholar]
- 38. Shimeld C, Whiteland JL, Nicholls SM, Grinfeld E, Easty DL, Gao H, Hill TJ (1995) Immune cell infiltration and persistence in the mouse trigeminal ganglion after infection of the cornea with herpes simplex virus type 1. J Neuroimmunol 61:7–16. [DOI] [PubMed] [Google Scholar]
- 39. Simon T, Opelz G, Weimer R, Wiesel M, Feustel A, Ott RC, Susal C (2003) The effect of ATG on cytokine and cytotoxic T‐lymphocyte gene expression in renal allograft recipients during the early post‐transplant period. Clin Transplant 17:217–224. [DOI] [PubMed] [Google Scholar]
- 40. Stevens JG, Wagner EK, Vi‐Rao GB, Cook ML, Feldman LT (1987) RNA complementary to a herpesvirus alpha gene mRNA is prominent in latently infected neurons. Science 235:1056–1059. [DOI] [PubMed] [Google Scholar]
- 41. Swanson BJ, Murakami M, Mitchell TC, Kappler J, Marrack P (2002) RANTES production by memory phenotype T cells is controlled by a posttranscriptional, TCR‐dependent process. Immunity 17:605–615. [DOI] [PubMed] [Google Scholar]
- 42. Teichmann M, Meyer B, Beck A, Niedobitek G (2005) Expression of the interferon‐inducible chemokine IP‐10 (CXCL10), a chemokine with proposed anti‐neoplastic functions, in Hodgkin lymphoma and nasopharyngeal carcinoma. J Pathol 206:68–75. [DOI] [PubMed] [Google Scholar]
- 43. Theil D, Arbusow V, Derfuss T, Strupp M, Pfeiffer M, Mascolo A, Brandt T (2001) Prevalence of HSV‐1 LAT in human trigeminal, geniculate, and vestibular ganglia and its implication for cranial nerve syndromes. Brain Pathol 11:408–413. [DOI] [PMC free article] [PubMed] [Google Scholar]
- 44. Theil D, Derfuss T, Paripovic I, Herberger S, Meinl E, Schueler O, Strupp M, Arbusow V, Brandt T (2003) Latent herpesvirus infection in human trigeminal ganglia causes chronic immune response. Am J Pathol 163:2179–2184. [DOI] [PMC free article] [PubMed] [Google Scholar]
- 45. Theil D, Paripovic I, Derfuss T, Herberger S, Strupp M, Arbusow V, Brandt T (2003) Dually infected (HSV‐1/VZV) single neurons in human trigeminal ganglia. Ann Neurol 54:678–682. [DOI] [PubMed] [Google Scholar]
- 46. Tigges MA, Koelle D, Hartog K, Sekulovich RE, Corey L, Burke RL (1992) Human CD8+ herpes simplex virus‐specific cytotoxic T‐lymphocyte clones recognize diverse virion protein antigens. J Virol 66:1622–1634. [DOI] [PMC free article] [PubMed] [Google Scholar]
- 47. Van Lint AL, Kleinert L, Clarke SR, Stock A, Heath WR, Carbone FR (2005) Latent infection with herpes simplex virus is associated with ongoing CD8+ T‐cell stimulation by parenchymal cells within sensory ganglia. J Virol 79:14843–14851. [DOI] [PMC free article] [PubMed] [Google Scholar]
- 48. Wang K, Lau TY, Morales M, Mont EK, Straus SE (2005) Laser‐capture microdissection: refining estimates of the quantity and distribution of latent herpes simplex virus 1 and varicella‐zoster virus DNA in human trigeminal Ganglia at the single‐cell level. J Virol 79:14079–14087. [DOI] [PMC free article] [PubMed] [Google Scholar]
- 49. Wulff H, Calabresi PA, Allie R, Yun S, Pennington M, Beeton C, Chandy KG (2003) The voltage‐gated Kv1.3 K(+) channel in effector memory T cells as new target for MS. J Clin Invest 111:1703–1713. [DOI] [PMC free article] [PubMed] [Google Scholar]
- 50. Wulff H, Knaus HG, Pennington M, Chandy KG (2004) K+ channel expression during B cell differentiation: implications for immunomodulation and autoimmunity. J Immunol 173:776–786. [DOI] [PubMed] [Google Scholar]
- 51. Zafiropoulos A, Barnes E, Piggott C, Klenerman P (2004) Analysis of “driver” and “passenger” CD8+ T‐cell responses against variable viruses. Proc Biol Sci 271(Suppl. 3):S53–S56. [DOI] [PMC free article] [PubMed] [Google Scholar]