

Abstract
To evaluate whether hypocretin‐1 (orexin‐A) and melanin‐concentrating hormone (MCH) neurotransmission are affected in patients with Huntington disease (HD), we immunohistochemically stained hypocretin and MCH neurons and estimated their total numbers in the lateral hypothalamus of both HD patients and matched controls. In addition, hypocretin‐1 levels were determined in prefrontal cortical tissue and post‐mortem ventricular cerebrospinal fluid (CSF) using a radioimmunoassay. The total number of hypocretin‐1 neurons was significantly reduced by 30% in HD brains (P = 0.015), while the total number of MCH neurons was not significantly altered (P = 0.100). Levels of hypocretin‐1 were 33% lower in the prefrontal cortex of the HD patients (P = 0.025), but ventricular CSF levels were similar to the control values (P = 0.306). Neuronal intranuclear and cytoplasmic inclusions of mutant huntingtin were present in all HD hypothalami, although with a variable distribution across different hypothalamic structures. We found a specific reduction in hypocretin signaling in patients with HD as MCH cell number was not significantly affected. It remains to be shown whether the moderate decrease in hypocretin neurotransmission could contribute to clinical symptoms. As the number of MCH‐expressing neurons was not affected, alterations in MCH signaling are unlikely to have clinical effects in HD patients.
Keywords: Huntington, hypocretin, hypothalamus, melanin‐concentrating hormone, orexin
INTRODUCTION
Huntington disease (HD) is an autosomal dominant progressive neurodegenerative disorder caused by an expanded CAG trinucleotide repeat in the IT15 gene on chromosome 4. Choreiform movements, psychiatric and behavioral problems and cognitive impairment characterize HD (16). Other debilitating but less well‐known features of the disease are weight loss, sleep disturbances and autonomic nervous system dysfunction (2), the causes of which are poorly understood. HD is neuropathologically characterized by generalized atrophy and cell death in the striatum and cerebral cortex and the presence of neuronal intranuclear and cytoplasmic inclusions of mutant huntingtin, particularly in the neocortex and neostriatum 8, 41. Substantial hypothalamic atrophy and cell death have also been reported 18, 20, 21, however, the presence of HD inclusions has not been investigated so far in different hypothalamic structures.
Hypocretin/orexin and melanin‐concentrating hormone (MCH) are neuropeptides that are synthesized in the lateral hypothalamus by two distinct neuronal populations 30, 31, 36. These neuropeptides both play a key role in the regulation of body energy metabolism, sleep–wake cycles and autonomic functions 17, 30, 33, 43. Moreover, recent animal studies implicate the MCH system in the modulation of several behavioral modalities, most notably stress, depression and sexual behavior 30, 34. A relation has also been demonstrated between hypocretin release and some psychiatric symptoms 5, 32. Potential alterations in hypocretin and/or MCH signaling might thus contribute to some symptoms in HD patients, particularly weight loss, sleep disturbances and autonomic dysfunction as well as some behavioral disorders like increased rates of depression and anxiety in these subjects (16).
Recently, it was demonstrated that the R6/2 mouse, the most widely used model of HD that expresses the first exon of the HD gene with ∼150 CAG repeats, exhibits a progressive and massive loss of hypocretin‐1 immunopositive neurons in the lateral hypothalamic area (27). This loss amounted to 71% at the end stage (12 weeks) and was accompanied by loss of neuronal nuclear antigen (NeuN)‐immunopositive neurons (27). On the other hand, the YAC128 mouse model of HD with the full‐length mutant HD gene with ∼120 CAG repeats, shows a 10% loss of hypocretin‐1 immunopositive neurons at 12 months (4). Furthermore, MCH cell number was reported to be decreased by 38% in the hypothalamus of 12‐week‐old R6/2 mice, while MCH peptide levels were reduced by 57% (39). Atrophy and a decreased density of hypocretin‐1 expressing neurons in single coronal sections from the lateral hypothalamus have also been observed in HD patients (27). Nevertheless, four recent papers reported normal hypocretin‐1 concentrations in the cerebrospinal fluid (CSF) of HD patients 3, 4, 11, 24.
In order to validate and extend the above findings in patients with HD, we applied a four‐way approach. First, we estimated the total numbers of both hypocretin‐1 and MCH‐expressing neurons in the lateral hypothalamus of HD patients and matched controls. This allowed the testing for the specificity of potential changes in the neuronal numbers. Second, we measured hypocretin‐1 levels in post‐mortem ventricular CSF because this could better reflect hypocretin‐1 production than spinal measurements 7, 10. Third, hypocretin‐1 contents in peptide extracts from the cerebral cortex were assessed, as this has been shown to be a more sensitive technique compared with the CSF measurements 10, 29. Finally, we also investigated various hypothalamic regions, including the lateral hypothalamus, for the presence of neuronal intranuclear and cytoplasmic inclusions.
MATERIALS AND METHODS
Post‐mortem material
Autopsy hypothalami from eight HD patients and eight controls (matched for age, sex, post‐mortem delay and fixation time) were obtained through the Netherlands Brain Bank (NBB). Ventricular CSF was available in seven of these HD patients and one of the controls; therefore, the CSF from six additional controls (matched for age, sex and post‐mortem delay) was used for comparison (Table 1). Frozen prefrontal cortical tissue from a second group of 19 HD patients and 16 controls was obtained through the Leiden University Medical Centre HD pathology archives (Table 2). HD brains were graded according to the scheme of Vonsattel et al for neuropathologic disease severity (41). All HD patients had clinical features and a positive family history of the disease; one patient (#1; Table 2) had infantile HD and was studied separately as there are indications that infantile and classical HD may differ neuropathologically (35). The diagnosis of HD was genetically confirmed (ie, CAG repeat lengths ≥40) in all but one of these patients (#HD‐8, Table 1). However, the latter patient's brain showed an HD pathology grade II and the presence of neuronal intranuclear and cytoplasmic inclusions combined with a positive family history of the disease further supported the diagnosis. Exclusion criteria for the control subjects were primary neurologic and/or psychiatric disorders and glucocorticoid therapy during the final premortal illness period, except for two controls who had suffered strokes and were used for prefrontal cortex hypocretin‐1 measurements (#C‐4 and #C‐14; Table 2).
Table 1.
Clinicopathologic details of the Huntington disease patients and the control subjects used for neuronal cell counts and Hcrt‐1 measurements in ventricular CSF. Abbreviations: Fix = fixation time; PMD = post‐mortem delay; grade = Vonsattel et al's grade; MCH = melanin‐concentrating hormone; Hcrt‐1 = hypocretin‐1; CSF = cerebrospinal fluid; N.A. = not available.
| Sex | Age (years) | Age of onset (years) | PMD (h) | Fix (d) | Brain weight (g) | Grade | CAG repeat length | Cause of death | MCH cell no. | Hcrt‐1 cell no. | Hcrt‐1 levels in CSF (pg/mL) | ||
|---|---|---|---|---|---|---|---|---|---|---|---|---|---|
| Patients | HD‐1 | M | 57 | 42 | 07:30 | 53 | 1162 | 3–4 | 46 | Cachexia | 76 987 | 42 088 | 536 |
| HD‐2 | F | 50 | 35 | 05:40 | 55 | 1292 | 2–3 | 47 | Pneumonia | N.A. | 24 022 | 595 | |
| HD‐3 | M | 79 | 54 | 06:15 | 34 | 1001 | 4 | 44 | Pneumonia and sepsis | 75 652 | 29 890 | 422 | |
| HD‐4 | F | 67 | 56 | 06:05 | 41 | 1289 | 1 | 45 | Unknown | 102 436 | 50 863 | 531 | |
| HD‐5 | M | 49 | 40 | 05:45 | 49 | 1122 | 3 | 54 | Cachexia secondary to pneumonia | N.A. | 20 448 | 468 | |
| HD‐6 | F | 80 | 58 | 07:15 | 49 | 906 | 2 | 41 | Pneumonia | 76 620 | 36 023 | 404 | |
| HD‐7 | M | 61 | 39 | 10:25 | 48 | 1380 | 3 | 43 | Pneumonia | 77 846 | 27 880 | 481 | |
| HD‐8 | M | 54 | 41 | 03:50 | 80 | 1212 | 2 | — | Sudden death | N.A. | 42 569 | N.A. | |
| Median | 59.0 | 41.5 | 6:10 | 49.0 | 1187.0 | — | 45.0 | 76 987 | 32 957 | ||||
| Percentile | |||||||||||||
| 25th | 51.0 | 39.3 | 5:41 | 42.8 | 1031.3 | 43.0 | 76 136 | 24 987 | |||||
| 75th | 76.0 | 55.5 | 7:26 | 54.5 | 1291.3 | 47.0 | 90 141 | 42 449 | |||||
| Controls | C‐1* | M | 58 | — | <17:00 | 96 | 1408 | — | — | Aorta dissection | 77 237 | 49 105 | N.A. |
| C‐2* | F | 49 | — | <13:30 | 165 | 1437 | — | — | Metastasized cervix carcinoma | 89 347 | 56 250 | N.A. | |
| C‐3* | M | 79 | — | <3:00 | 53 | 1435 | — | — | Hemorrhage from leaking aorta prosthesis | 84 652 | 36 231 | N.A. | |
| C‐4* | F | 68 | — | 05:45 | 32 | 1153 | — | — | Unknown | N.A. | 52 900 | N.A. | |
| C‐5* | M | 49 | — | <12:40 | 40 | 1404 | — | — | Sudden death | 118 604 | 54 638 | N.A. | |
| C‐6*, † | F | 82 | — | 05:30 | 36 | 1280 | — | — | Myocardial infarction | N.A. | 60 972 | 409 | |
| C‐7* | M | 61 | — | 13:50 | 52 | 2220 | — | — | Carcinoma of the esophagus | 94 776 | 27 912 | N.A. | |
| C‐8* | M | 54 | — | <08:00 | 59 | 1350 | — | — | Hepatocellular carcinoma | 86 792 | 53 216 | N.A. | |
| C‐9† | M | 56 | — | 5:25 | — | 1522 | — | — | Cardiac infarction | N.A. | N.A. | 536 | |
| C‐10† | F | 51 | — | 7:40 | — | 1156 | — | — | Sepsis | N.A. | N.A. | 640 | |
| C‐11† | M | 79 | — | 6:00 | — | 1392 | — | — | Metastasized adenocarcinoma | N.A. | N.A. | 631 | |
| C‐12† | F | 69 | — | 4:20 | — | 1186 | — | — | Heart failure | N.A. | N.A. | 549 | |
| C‐13† | M | 53 | — | 14:25 | — | 1341 | — | — | Heart failure | N.A. | N.A. | 581 | |
| C‐14† | M | 61 | — | 12:05 | — | 1460 | — | — | Heart failure | N.A. | N.A. | 336 | |
| Group a* | — | ||||||||||||
| Median | 59.5 | 10:20 | 52.5 | 1406.0 | 88 070 | 53 058 | |||||||
| Percentiles | |||||||||||||
| 25th | 50.3 | 5:33 | 37.0 | 1297.5 | 82 798 | 39 450 | |||||||
| 75th | 76.3 | 13:45 | 86.8 | 1436.5 | 100 733 | 55 847 | |||||||
| Group b† | — | — | |||||||||||
| Median | 61.0 | 6:00 | — | 1341.0 | 549.0 | ||||||||
| Percentiles | |||||||||||||
| 25th | 53.0 | 5:25 | 1186.0 | 409.0 | |||||||||
| 75th | 79.0 | 12:05 | 1460.0 | 631.0 | |||||||||
Hypothalamic material from these controls was available for Hcrt‐1 and/or MCH immunohistochemistry.
Ventricular CSF from these controls was available for Hcrt‐1 radioimmunoassay.
Table 2.
Clinicopathologic data of subjects used for hypocretin brain tissue measurement. Abbreviations: Grade = Vonsattel et al's grade; CAG = CAG repeat length; Hcrt‐1 = hypocretin‐1; HD = Huntington disease; N.A. = not available.
| Subject no. | Age at death | Sex | Grade | CAG | Cause of death | Hcrt‐1 tissue content (pg/g) | |
|---|---|---|---|---|---|---|---|
| Infantile HD | 1* | 19 | F | 3 | 86 | Cachexia | 1097 |
| Adult HD | 2 | 34 | M | 3 | 52 | Unknown | 389 |
| 3 | 40 | F | 3 | 41 | Suicide | 530 | |
| 4 | 44 | M | N.A. | 50 | Pneumonia | 343 | |
| 5 | 45 | M | 4 | 53 | Recurrent aspiration pneumonia | 198 | |
| 6 | 49 | M | 3 | 47 | Respiratory insufficiency | 743 | |
| 7 | 51 | M | 3 | 46 | Bronchopneumonia | 360 | |
| 8 | 51 | M | 3 | 45 | Unknown | 584 | |
| 9 | 53 | F | 2 | 47 | Pulmonary embolism | 511 | |
| 10 | 54 | M | 3 | 43 | Pneumonia | 198 | |
| 11 | 55 | F | 3 | 47 | Metastasized Grawitz tumor | 617 | |
| 12 | 57 | F | 3 | 43 | Pulmonary embolism | 278 | |
| 13 | 57 | M | 4 | 49 | Bronchopneumonia | 275 | |
| 14 | 57 | M | 3 | 47 | Unknown | 665 | |
| 15 | 63 | F | 3 | 43 | Basilar artery thrombosis | 1066 | |
| 16 | 66 | F | 3 | 41 | Squamous cell lung carcinoma | 443 | |
| 17 | 69 | F | 2 | 42 | Aspiration pneumonia | 725 | |
| 18 | 75 | M | 3 | 43 | Unknown | 302 | |
| 19 | 77 | M | 3 | 39 | Bronchopneumonia | 376 | |
| Median | 54.5 | 3.0 | 45.5 | 416.4 | |||
| Percentiles (25th–75th) | 48.0–63.8 | 2.5–3.0 | 42.8–47.5 | 295.8–629.4 | |||
| Controls | 1 | 37 | M | — | — | Myocardial infarction | 996 |
| 2 | 46 | M | — | — | Cardiac arhythmia | 364 | |
| 3 | 48 | M | — | — | Myocardial infarction | 665 | |
| 4 | 52 | M | — | — | Stroke | 688 | |
| 5 | 60 | F | — | — | Pneumonia | 433 | |
| 6 | 63 | F | — | — | Leptomeningeal metastasis | 737 | |
| 7 | 64 | M | — | — | Myocardial infarction | 1368 | |
| 8 | 67 | F | — | — | Aortic dissection | 858 | |
| 9 | 68 | M | — | — | Pneumonia | 697 | |
| 10 | 70 | M | — | — | Metastasized carcinoma | 1282 | |
| 11 | 71 | M | — | — | Cardiomyopathy | 573 | |
| 12 | 74 | M | — | — | Metastasized carcinoma | 243 | |
| 13 | 76 | M | — | — | Aortic dissection | 638 | |
| 14 | 79 | F | — | — | Stroke | 892 | |
| 15 | 83 | M | — | — | Leptomeningeal metastasis | 358 | |
| 16 | 86 | M | — | — | Myocardial infarction | 570 | |
| Median | 67.5 | 676.6 | |||||
| Percentiles (25th–75th) | 54.0–75.5 | 467.5–883.9 |
This patient had juvenile HD and was therefore studied separately.
Hypocretin‐1 and MCH immunohistochemistry
The hypothalami were fixed in 10% PBS (pH 7.4) formalin at room temperature and were paraffin embedded and serially sectioned at 6 µm in rostrocaudal direction. Every 100th section was stained with thionin for orientation. The lateral hypothalamus, from the level where the fornix abuts the paraventricular nucleus up to the posterior border of the corpora mammillaria, was stained at 600 µm intervals in every two consecutive sections. One of the sections was stained with a hypocretin‐1 and the other with an MCH monoclonal antibody (Phoenix Pharmaceuticals, Inc., Belmont, CA, USA; catalog no. H‐003‐30 and H‐070‐47, respectively). The sections were visualized according to the avidin–biotin complex method using diaminobenzidine–nickel solution to finish the staining as described previously (13).
N‐terminal huntingtin immunohistochemistry
Using thionin staining for orientation, 9 to 10 sections were chosen so that large parts of the following hypothalamic (and adjacent) structures would be contained in at least two coronal cuts: the suprachiasmatic nucleus, the supraoptic nucleus, the paraventricular nucleus, the infundibular nucleus, the diagonal band of Broca, the nucleus basalis of Meynert, the ventromedial nucleus, the dorsomedial nucleus, the lateral hypothalamus/perifornical area, the tuberomamillary nucleus, the lateral tuberal nucleus and the supramamillary area (the supramamillary area was contained in only one coronal cut). These sections were stained with a monoclonal antibody against the N‐terminus of human huntingtin (Chemicon, Temecula, CA, USA; batch no. 5374) after pretreatment by boiling in citrate buffer (pH 6.0) for 20 minutes. The sections were processed according to the avidin–biotin complex method using the diaminobenzidine–nickel solution and counterstained with Harris's hematoxylin for nuclear staining.
Antibody specificity
The specificity of the hypocretin‐1 antibody has been confirmed previously (9). To test the specificity of the MCH antibody, a dot blot was performed (40), adding a dilution of 1:1000 anti‐MCH onto 2% gelatin‐coated nitrocellulose paper (0.1‐µm pore size) containing different spots with 20 pmol MCH, hypocretin‐1, somatostatin (1–14), somatostatin (1–28), galanin, MCH‐1 receptor, β‐lipotropin, substance‐P, α‐melanocyte‐stimulating hormone, luteinizing hormone‐releasing hormone, adrenocorticotropic hormone (1–39), neurotensin, oxytocin, corticotropin‐releasing hormone, agouti‐related protein (83–132), neuropeptide‐Y, growth hormone‐releasing hormone (1–40), arginine‐vasopressin, desacetylmelanocyte‐stimulating hormone, neuropeptide EI, glycoprotein hormone receptor and cocaine‐ and amphetamine‐regulated transcript. The next day, the nitrocellulose sheet was incubated with secondary antibody, avidin–biotin peroxidase complex and diaminobenzidine–nickel solution to finish the staining. The only spot that showed staining was the one containing MCH. Specificity was further confirmed by the absence of staining in hypothalamic sections using antiserum preadsorbed with the human MCH peptide fixed overnight with 4% formaldehyde onto gelatin‐coated nitrocellulose filter paper, 0.1 µm, and the presence of staining when preadsorbed with α‐melanocyte‐stimulating hormone peptide, which did not differ from unadsorbed serum.
Quantification of hypocretin‐1 and MCH neuronal numbers
An estimate of the total number of hypocretin‐1 and MCH immunoreactive (IR) cells was made using an image analysis system (ImagePro version 4.5, Media Cybernetics, Silver Spring, MD, USA) connected to a camera (JVC KY‐F553CCD) and plain objective microscope (Zeiss Axioskop with Plan‐NEOFLUAR Zeiss objectives, Carl Zeiss GmbH, Jena, Germany). In every section randomly selected fields, covering in total 15% of a manually outlined area containing all the hypocretin‐1 or MCH IR cells, were counted by the same person (NAA) who was blinded to the diagnosis. Each positively stained profile containing a nucleolus was counted (10). The calculation of the total number of hypocretin‐1 IR neurons was performed by a conversion program based upon the multiplication of the neuronal counts by sample frequency of the sections as described previously (14). Mean [± standard deviation (SD)] number of sections quantified per subject was 10.2 ± 1.5 for hypocretin‐1 and 11.5 ± 2.3 for MCH. The coefficient of variation (ie, SD/mean × 100%) of this method was 3.4% for hypocretin‐1 and 4.5% for MCH (calculated by counting one complete control twice).
Hypocretin‐1 measurements in cerebral cortex and CSF
One gram of frozen prefrontal cortex was used for hypocretin‐1 measurements (Table 2). The most rostral part of the prefrontal cortex was chosen, as this cortical region is densely innervated by hypocretin neurons resulting in high hypocretin‐1 concentrations (28). The tissue samples were boiled for 10 minutes in 10.0 mL of MilliQ water, cooled to room temperature, acidified using glacial acetic acid and HCl (final concentration: 1.0 M and 20.0 mM respectively), homogenized and centrifuged. The supernatant was acidified again with an equal volume of 0.1% trifluoracetic acid and vacuum dried. The samples were resuspended in 500 µL of radioimmunoassay buffer and centrifuged at 3000 rpm for 10 minutes before measurements. Immediately after collection, ventricular CSF was centrifuged at 2500 rpm for 10 minutes and the supernatant was stored at −80°C until hypocretin‐1 levels were measured using a commercially available radioimmunoassay (Phoenix Pharmaceuticals, Belmont, CA, USA). All measurements were conducted in duplicate 100‐µL aliquots in a single assay run. The detection limit was 50 pg/mL and intra‐assay variability was less than 5%. We used a validated reference sample to adjust levels to previously reported values 10, 29.
Assessment of neuronal intranuclear and cytoplasmic inclusions
The presence or absence of neuronal intranuclear inclusions and cytoplasmic inclusions (ie, inclusions in dystrophic neurites) in the hypothalamic regions of interest were assessed by one of us (NAA) at ×100 magnification (8). For each region, two coronal sections were investigated. The percentage of HD patients who had either neuronal intranuclear or cytoplasmic inclusions of mutant huntingtin was calculated per structure ( Table 3).
Table 3.
Neuronal inclusions in nuclei of HD hypothalami and adjacent regions. The last row indicates, per structure, the percentage of HD patients who had neuronal inclusions of the specified type. Abbreviations: Type = type of neuronal inclusions; C = cytoplasmic inclusions (ie, inclusions in dystrophic neurites); I = intranuclear inclusions; − = inclusions absent; + = inclusions present; SCN = suprachiasmatic nucleus; SON = supraoptic nucleus; PVN = paraventricular nucleus; INF = infundibular nucleus; DBB = diagonal band of Broca; NBM = nucleus basalis of Meynert; VMN = ventromedial nucleus; DMN = dorsomedial nucleus; LH = lateral hypothalamus; PFA = perifornical area; NTL = lateral tuberal nucleus; TMN = tuberomamillary nucleus; SMA = supramamillary area.
| Type | SCN | SON | PVN | DBB/NBM | INF | VMN | DMN | LH/PFA | NTL | TMN | SMA | |||||||||||
|---|---|---|---|---|---|---|---|---|---|---|---|---|---|---|---|---|---|---|---|---|---|---|
| C | I | C | I | C | I | C | I | C | I | C | I | C | I | C | I | C | I | C | I | C | I | |
| HD‐1 | − | − | + | − | + | − | + | − | + | − | + | − | + | − | + | + | + | − | + | + | + | − |
| HD‐2 | − | − | − | − | − | − | + | − | + | + | + | − | + | − | + | + | + | − | + | − | + | − |
| HD‐3 | + | − | + | − | + | − | + | − | + | − | + | − | + | − | + | − | + | − | + | + | + | − |
| HD‐4 | − | − | − | − | + | − | + | − | + | − | + | − | + | − | + | − | − | − | + | + | + | − |
| HD‐5 | + | − | − | − | − | − | + | − | + | − | + | − | + | − | + | − | + | − | + | + | + | − |
| HD‐6 | − | − | − | − | + | − | + | − | + | − | + | − | + | − | + | − | − | − | + | − | + | − |
| HD‐7 | + | − | + | − | − | − | + | + | + | + | + | + | + | − | + | − | + | + | + | + | + | − |
| HD‐8 | + | − | + | − | + | − | + | + | + | − | + | − | + | − | + | − | + | − | + | + | + | − |
| % patients | 50 | 0 | 50 | 0 | 63 | 0 | 100 | 25 | 100 | 25 | 100 | 13 | 100 | 0 | 100 | 25 | 75 | 13 | 100 | 75 | 100 | 0 |
Statistics
All data are presented as medians (25th–75th percentile). Differences between the groups were statistically evaluated by the Mann–Whitney U‐test (MWU), the Wilcoxon signed rank (WSR) test or the χ2 test. Spearman's ρ correlation test was performed to assess all correlations. Differences in clock time of death (circular parameter) between controls and patients with HD were tested with the Watson's two‐sample test of homogeneity (23). The tests were two‐tailed and values of P < 0.05 were considered to be significant. Local linear regression was used to fit curves to the standardized pooled data (22) (Figure 1).
Figure 1.
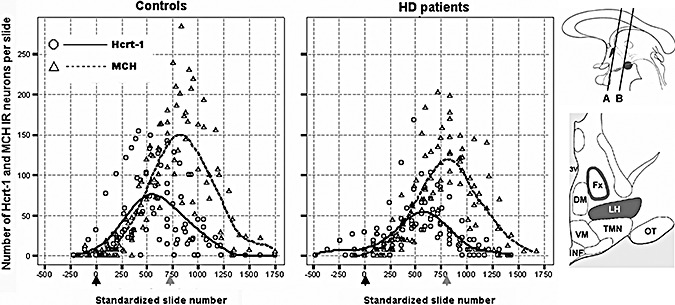
Distribution patterns of hypocretin‐1 (Hcrt‐1) and melanin‐concentrating hormone (MCH) immunoreactive (IR) neurons in the lateral hypothalamus of the controls and the Huntington disease (HD) patients. In order to present data from all subjects in the same diagrams, the individual distribution patterns were standardized in rostrocaudal direction for the anatomic distance between the point where the fornix abuts the paraventricular nucleus (black arrows; at the level of line “A” in the upper cartoon) and the fornicomamillary junction (grey arrows; at the level of line “B” in the upper cartoon). This procedure was performed separately for the control and the HD group. In addition, local linear regression was used to fit curves to the standardized pooled data in order to clarify the underlying distribution patterns (kernel = Gaussian, bandwidth value = 1.0). Note that the overall rostrocaudal dispersion of hypocretin‐1 and MCH IR neurons does not appear to be noticeably different between the control and the HD subjects. Upper cartoon. A schematic sagittal view of the hypothalamus; the paraventricular nucleus and the mamillary bodies are indicated in dark. Lower cartoon. A schematic coronal view of the hypothalamus midway between lines “A” and “B” in the upper cartoon; the perifornical area and the lateral hypothalamus are indicated in dark [adapted from (36)]. 3V = third ventricle; Fx = fornix; LH = lateral hypothalamus; DM = dorsomedial nucleus; VM = ventromedial nucleus; TMN = tuberomamillary nucleus; INF = infundibular nucleus; OT = optic tract.
RESULTS
Hypocretin‐1 and MCH neurons in HD patients and controls
Subject characteristics
There were no significant differences in age, sex, post‐mortem delay, fixation time and clock time of death between the HD and the control group [all P ≥ 0.27 (Table 1)].
Distribution of hypocretin‐1 and MCH neurons
The intensity of hypocretin‐1 and MCH immunostaining showed no obvious differences between the HD and the control group (Figure 2). Hypocretin‐1 IR neurons were restricted to the perifornical region in the lateral hypothalamus as previously described (9). MCH IR neurons were mainly confined to the same areas although they were more widely disseminated than hypocretin‐1 IR neurons. The first hypocretin‐1 IR neurons emerged in the lateral hypothalamus at the junction of the fornix and the paraventricular nucleus and were followed by the first MCH IR neurons. However, the rostrocaudal distance between the location of the first hypocretin‐1 neurons and that of the first MCH neurons did not significantly differ from zero [either in patients (n = 8) or controls (n = 8) or both groups combined (respective P‐values by the WSR test: 0.168, 0.336 and 0.085)] (Figure 1). At subsequent levels, the fornix was surrounded by both hypocretin‐1 and MCH IR cell bodies throughout its entire course up to the mamillary bodies. The number of hypocretin‐1 IR neurons peaked just before the fornicomamillary junction, whereas the peak number of MCH IR neurons was seen after this junction in the supramamillary area (Figure 1); the rostrocaudal distance between the two peaks was calculated in each individual and was significantly larger than zero {all P ≤ 0.011 by the WSR test, either in patients [1200 µm (1200–1800)]} or controls [1500 µm (1200–2250)], or both groups combined [1200 µm (1200–1800)].
Figure 2.
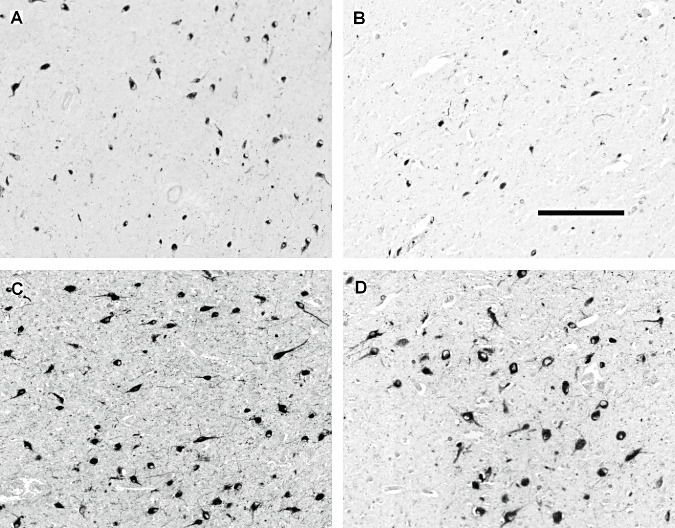
Representative photographs of hypocretin‐1 and melanin‐concentrating hormone (MCH) immunoreactive (IR) neurons in the lateral hypothalamus of two control subjects (A and C, #C‐4 and #C‐2 respectively) and two patients with Huntington disease (HD) (B and D, #HD‐6 and #HD‐1 respectively) with neuronal counts at or around the median (Table 1). The pictures were taken from the slides with the highest numbers of IR neurons. The illustrations show a modest reduction in the number of hypocretin‐1 IR neurons in the HD brain (A,B) while the number of MCH IR neurons is not significantly affected (C,D). Scale bar: 250 µm.
Hypocretin‐1 and MCH cell numbers
The total number of hypocretin‐1 IR neurons in the lateral hypothalamus of HD patients was significantly reduced by 30% compared with values in matched controls [32 957 (24 987–42 449) vs. 53 058 (39 450–55 847); P = 0.015; Figure 3]. As the available hypothalamic material of two controls and three HD patients [#C‐4, #C‐6 and #HD‐2, #HD‐5 and #HD‐8 respectively (Table 1)] did not contain the caudal part of the MCH area, these cases were excluded from the subsequent calculations of the total number of MCH IR neurons. Exclusion of these subjects did not alter group comparability. There was a trend toward a decrease in the total number of MCH IR neurons in HD patients [HD: 76 987 (76 136–90 141); controls: 88 070 (82 798–100 733); P = 0.100; Figure 3].
Figure 3.
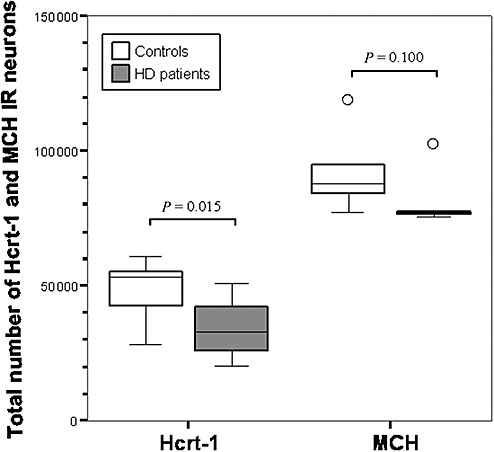
The total numbers of hypocretin‐1 (Hcrt‐1) and melanin‐concentrating hormone (MCH) immunoreactive (IR) neurons in the lateral hypothalamus of control subjects and Huntington disease (HD) patients. The total number of Hcrt‐1 IR neurons is significantly decreased in HD, while there is only a trend toward a reduction in the total number of MCH IR neurons (Mann–Whitney U‐test: n = 16, P = 0.015 for Hcrt‐1 and n = 11, P = 0.100 for MCH). Outliers (defined as data points which lie 1.5 times the interquartile range below the first or above the third quartile) are symbolized by “○.”
Effects of age of onset, CAG repeat length, disease duration and Vonsattel et al's grade on hypocretin‐1 and MCH cell numbers in HD
There was a positive trend for the relation between the age of onset of HD (defined as the age at which the clinical diagnosis was first made) and hypocretin‐1 IR neuronal numbers (r = 0.64, P = 0.086), but not MCH neuronal numbers (r = 0.21, P = 0.645). In HD patients, the total hypocretin‐1 and MCH cell numbers were not significantly associated with either CAG repeat length, duration of illness or Vonsattel et al's grades of neuropathologic disease severity (41) (Table 4).
Table 4.
Spearman's ρ correlations (P‐values) between post‐mortem findings and other (clinical) disease parameters in the Huntington disease patients. The only significant correlation was between the prefrontal cortex hypocretin‐1 (Hcrt‐1) levels and Vonsattel et al's grade of neuropathologic disease severity. Trends were visible for the relations between Hcrt‐1 cell number and age of onset and between melanin‐concentrating hormone (MCH) cell number and disease duration. Abbreviation: CSF = cerebrospinal fluid.
| Age at death | Age of onset | Disease duration | Grade | CAG repeat no. | |
|---|---|---|---|---|---|
| Hcrt‐1 cell no. | 0.452 (0.260) | 0.643 (0.086) | −0.096 (0.820) | −0.482 (0.227) | −0.429 (0.337) |
| MCH cell no. | −0.500 (0.391) | −0.200 (0.747) | −0.821 (0.089) | −0.700 (0.188) | 0.300 (0.624) |
| Ventricular CSF Hcrt‐1 levels | −0.607 (0.148) | −0.607 (0.148) | −0.436 (0.328) | −0.090 (0.848) | 0.571 (0.180) |
| Prefrontal cortex Hcrt‐1 levels | 0.078 (0.760) | −0.417 (0.265) | 0.192 (0.620) | −0.666 (0.004)* | −0.179 (0.476) |
Correlation is significant at the 0.01 level.
Ventricular CSF hypocretin‐1 content
The two groups were well matched for age, sex and post‐mortem delay (all P > 0.80) (Table 2). Furthermore, there were no significant correlations between these variables and hypocretin‐1 CSF contents in the HD patients, the controls or the combined group (all P > 0.11). The CSF contents of hypocretin‐1 was not different between the HD patients and the controls [HD: 481 pg/mL (422–536); controls: 549 pg/mL (409–631); P = 0.306, Figure 4], nor was there a significant correlation between the hypocretin cell counts and CSF levels in the eight subjects (seven HD patients and one control) in whom both measurements were available (r = −0.238; P = 0.570). There were no significant correlations between CSF hypocretin‐1 levels and other (clinical) disease parameters (Table 4).
Figure 4.
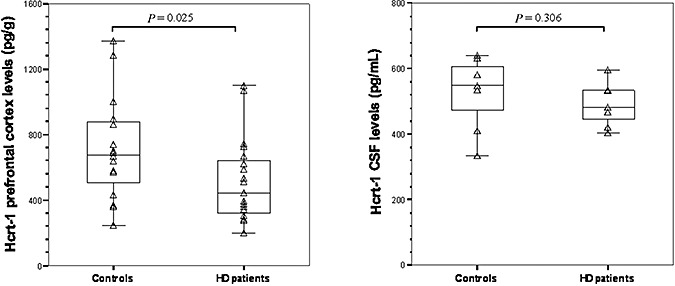
Compared with the controls, hypocretin‐1 (Hcrt‐1) levels were significantly lower in the prefrontal cortex of the Huntington disease (HD) patients (Mann–Whitney U‐test (MWU): P = 0.025, left panel), but not in their cerebrospinal fluid (CSF) (MWU‐test: P = 0.306, right panel).
Hypocretin‐1 concentration in prefrontal cortex
The two groups did not differ with respect to gender, but the HD group was significantly younger (P = 0.034) (Table 2). However, hypocretin‐1 concentrations were not significantly correlated with age [either in HD patients, controls or the combined groups (all P ≥ 0.37)]. The hypocretin‐1 concentration in the controls was 676.6 pg/g (467.5–883.9) of wet brain tissue, which is comparable to previously reported values (29). Compared with the controls, the mean hypocretin‐1 cortical levels were 33% lower in adult HD patients [416.4 pg/g (295.8–629.4); P = 0.025]. Furthermore, the prefrontal hypocretin‐1 levels in these patients were significantly associated with Vonsattel et al's grades (r = −0.666, P = 0.004), but not with other (clinical) disease parameters (Table 4). The patient with infantile HD had the highest levels of cortical hypocretin among all the HD patients studied (Table 2). As the prefrontal tissues belonged to subjects whose hypocretin cell counts were unavailable, we could not relate the prefrontal cortex levels of hypocretin‐1 to the hypocretin cell counts.
Neuronal intranuclear and cytoplasmic inclusions in HD hypothalami
N‐terminal huntingtin‐positive neuronal intranuclear and cytoplasmic inclusions were observed in all HD hypothalami (Figure 5). Cytoplasmic inclusions were far more abundant than intranuclear inclusions, which were seen only sporadically. Intranuclear inclusions were most consistently observed in the neurons of the tuberomamillary nucleus. The HD inclusions were not uniformly distributed among the various hypothalamic and adjacent structures (Table 3). Only in relatively few patients cytoplasmic inclusions were present in the most rostral hypothalamic structures (ie, the suprachiasmatic, the supraoptic and the paraventricular nuclei), while intranuclear inclusions could not be detected at all in these areas.
Figure 5.
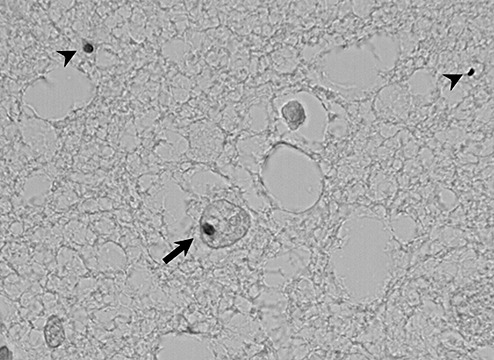
Examples of neuronal intranuclear (arrow) and cytoplasmic (arrowheads) inclusions of mutant huntingtin in the tuberomamillary nucleus of one Huntington disease patient (#HD‐7; obj. ×60 oil).
DISCUSSION
In this study, we demonstrated a significant reduction by about 30% in the total number of hypocretin‐1 neurons in the lateral hypothalamus of HD patients. This decrease appears to be relatively specific as the total number of MCH neurons was not significantly altered. Hypocretin‐1 levels in the prefrontal cortex were reduced to the same extent, but ventricular CSF levels were unchanged. Furthermore, we described the distribution of intranuclear and cytoplasmic inclusions of mutant huntingtin in the lateral hypothalamus and various other hypothalamic and adjacent structures in patients with HD.
Recently, the density of hypocretin‐1 neurons was assessed in single coronal sections from the lateral hypothalamus of HD patients and found to be decreased (27). However, cell density is subject to substantial variation depending on both the rostrocaudal level of the sections (Figure 1) and the cutting direction. Therefore, in this study, we systematically counted the total number of hypocretin‐1 expressing neurons and were able to unequivocally confirm a significant but moderate decrease in the number of these neurons in HD patients. A positive trend was also visible for the relation between hypocretin‐1 cell number and the age of onset in HD patients, paralleling findings by Kremer et al (21) who found an association between the neuronal numbers in the lateral tuberal nucleus and the age of onset in HD.
We corroborated the specificity of the reduction in hypocretin‐1 neuronal numbers by assessing the total number of MCH neurons as well. As the reduction in hypocretin‐1 neuronal numbers was more pronounced than that in MCH neuronal numbers, hypocretin neurons appear to be more vulnerable to the pathogenic mechanisms underlying HD. Interestingly, a recent study in rat hypothalamic slice cultures showed that 24 h of incubation with N‐methyl‐D‐aspartate (NMDA) resulted in a marked decrease in the number of hypocretin‐1 neurons, whereas MCH neurons in the same cultures were relatively spared (19). Moreover, the examinations of the effects of several endogenous glutamate receptor agonists highlighted quinolinic acid as an endogenous excitotoxin that could cause selective loss of hypocretin‐1 neurons as compared with MCH neurons by activating NMDA receptors (19). Therefore, NMDA receptor‐mediated excitotoxicity could be involved in the greater susceptibility of hypocretin‐1 neurons in HD patients, a pathomechanism that has also been proposed for the massive neuronal loss in the lateral tuberal nucleus of these patients (21).
To further assess hypocretin neurotransmission in HD, we also examined hypocretin‐1 contents in the prefrontal cortex and ventricular CSF. Whereas the mean levels of hypocretin‐1 were about 30% lower in the prefrontal cortex of HD subjects and correlated with Vonsattel et al's grades, ventricular CSF hypocretin‐1 contents did not differ between patients and controls. The latter finding is in accordance with four recent papers that reported normal hypocretin‐1 concentrations in the CSF of HD patients 3, 4, 11, 24. The apparent discrepancy between the findings in the CSF and those in the hypothalamus and the prefrontal cortex of HD patients could be accounted for by the fact that a mean reduction of approximately 30% in the number of hypocretin‐1 neurons is probably not large enough to be reflected in the CSF 3, 11, 24. This assumption is supported by the fact that a reduction by half in the number of hypocretin neurons in Parkinson disease patients only causes a 25% decrease in hypocretin‐1 levels in the ventricular CSF (10). Accordingly, rat studies indicate that a 73% decline in hypocretin neuronal numbers is needed to decrease CSF hypocretin‐1 levels by half (12). Yet another possibility is impaired clearance of hypocretin‐1 from the CSF in HD.
So far, hypocretin signaling has been studied in two animal models of HD. The R6/2 mouse model is reported to have a loss of more than 70% in both hypocretin‐1 expressing neurons and hypocretin‐1 CSF levels, whereas the YAC128 mouse model exhibits a reduction of 10% in the number of hypocretin‐1 neurons. Moreover, R6/2 mice are reported to have a loss of almost 40% in the number of MCH‐expressing neurons while their hypothalamic MCH levels are reduced by nearly 60% (39). The discrepancy between our findings and those from these transgenic mice could be accounted for by the existence of several confounding variables. First, these transgenic mouse models have very large CAG repeat expansions (>120 repeats) and resemble juvenile HD more than the adult form of the disease (25). An intriguing possibility is thus that juvenile HD patients might indeed exhibit more extensive pathology of the hypocretin system. In this study, we could measure hypocretin‐1 levels in the prefrontal cortex of only one juvenile HD patient (Table 2). Surprisingly, this case appeared to have the highest levels of cortical hypocretin among all the HD patients studied. This finding may, however, be caused by the stronger cortical atrophy that accompanies the juvenile variant of HD compared with the adult form of the disease (35). Second, the mild reduction in hypocretin in the YAC128 mice may be caused by the fact that these mice, unlike the R6/2 mice and several human patients, were not (close to) end stage at the time of assessment (ie, 12 months). Thus, several variables may confound the comparisons between various animal models and the human condition and should, therefore, be taken into consideration when comparing animal and human data.
Hypocretin deficiency is the primary pathophysiologic cause of narcolepsy, a sleep–wake disorder characterized by excessive daytime sleepiness and REM‐sleep dissociation phenomena such as cataplexy, ie, a sudden weakening of posture muscle tone usually triggered by emotion (26). Although R6/2 mice exhibit episodes of behavioral arrest closely resembling those seen in hypocretin knock‐out mice and transgenic mice with specific ablation of hypocretin‐containing neurons 6, 15, it remains to be shown whether the modest decrease of hypocretin‐1 signaling in adult HD patients could contribute to clinical symptoms, particularly sleep disturbances (42). Unfortunately, because of the retrospective nature of our study, we could not relate our post‐mortem findings to clinical signs and symptoms. This stresses the need for a systematic post‐mortem brain tissue collection of clinically well‐documented patients for future neuropathologic studies.
In this report, we also presented an estimation of the total number of MCH neurons in the human brain and their relative distribution with respect to hypocretin‐1 neurons. Our results confirm those from a recent study (38) and suggest that MCH neurons are indeed more abundant in the human hypothalamus and have a wider rostrocaudal distribution than hypocretin‐1 neurons, which is also in accordance with the findings in rodents 1, 37. Even though MCH and hypocretin‐1 neurons start to appear at about the same level rostrally, MCH neurons are relatively more abundant in the posterior hypothalamus. Whether this finding could be accounted for by the existence of several distinct MCH subpopulations along the rostrocaudal axis as opposed to a more homogenous hypocretin population 1, 37 remains to be elucidated. As we could not find a clear reduction in the number of MCH neurons in HD patients, alterations in MCH levels are unlikely to have clinical implications in HD.
In this study, we have assessed neuronal numbers by counting immunopositive neurons by means of a technique that has been validated and applied previously 9, 10, 38. It should be stressed that it is, in principle, impossible to distinguish the loss of an immunocytochemical neuronal marker from the loss of the neurons in a heterogeneous and anatomically loosely defined brain structure such as the lateral hypothalamus.
Interestingly, neuronal intranuclear and cytoplasmic inclusions were not uniformly present in various hypothalamic and adjacent structures in HD patients. This finding may indicate that various hypothalamic nuclei are differentially affected by inclusion formation despite their close anatomic juxtaposition in the hypothalamus. Elucidation of the underlying mechanisms of this heterogeneity may lead to better understanding of why certain neuronal populations are more susceptible to HD pathology than others.
In conclusion, we found a specific reduction by about 30% in hypocretin signaling in patients with HD. It remains to be shown whether this moderate decrease in hypocretin signaling could contribute to clinical symptoms. As MCH cell number was not clearly affected in HD patients, alterations in MCH neurotransmission are unlikely to have clinical effects in HD.
ACKNOWLEDGMENTS
The authors are greatly indebted to the following persons for their invaluable support: R. Balesar, B. Fisser, M.A. Hofman, J.J. van Heerikhuize, J. van Pelt, I. Huitinga, M. Kooreman, I.M. Hegeman‐Klein, C. Welling‐Graafland, W. Verweij and H. Belier‐Lakeman. N.A. Aziz and S. Overeem were supported by the Netherlands Organisation for Scientific Research (grants #017.003.098 and #916.56.103, respectively).
REFERENCES
- 1. Amiot C, Brischoux F, Colard C, La Roche A, Fellmann D, Risold PY (2005) Hypocretin/orexin‐containing neurons are produced in one sharp peak in the developing ventral diencephalon. Eur J Neurosci 22:531–534. [DOI] [PubMed] [Google Scholar]
- 2. Aziz NA, Swaab DF, Pijl H, Roos RAC (2007) Hypothalamic dysfunction and neuroendocrine and metabolic alterations in Huntington disease: clinical consequences and therapeutic implications. Rev Neurosci 18:223–252. [DOI] [PubMed] [Google Scholar]
- 3. Baumann CR, Hersberger M, Bassetti CL (2006) Hypocretin‐1 (orexin A) levels are normal in Huntington's disease. J Neurol 253:1232–1233. [DOI] [PubMed] [Google Scholar]
- 4. Björkqvist M, Petersen A, Nielsen J, Ecker D, Mulder H, Hayden M et al (2006) Cerebrospinal fluid levels of orexin‐A are not a clinically useful biomarker for Huntington disease. Clin Genet 70:78–79. [DOI] [PubMed] [Google Scholar]
- 5. Brundin L, Petersen A, Björkqvist M, Traskman‐Bendz L (2007) Orexin and psychiatric symptoms in suicide attempters. J Affect Disord 100:259–263. [DOI] [PubMed] [Google Scholar]
- 6. Chemelli RM, Willie JT, Sinton CM, Elmquist JK, Scammell T, Lee C et al (1999) Narcolepsy in orexin knockout mice: molecular genetics of sleep regulation. Cell 98:437–451. [DOI] [PubMed] [Google Scholar]
- 7. Chen CT, Dun SL, Kwok EH, Dun NJ, Chang JK (1999) Orexin A‐like immunoreactivity in the rat brain. Neurosci Lett 260:161–164. [DOI] [PubMed] [Google Scholar]
- 8. Difiglia M, Sapp E, Chase KO, Davies SW, Bates GP, Vonsattel JP et al (1997) Aggregation of huntingtin in neuronal intranuclear inclusions and dystrophic neurites in brain. Science 277:1990–1993. [DOI] [PubMed] [Google Scholar]
- 9. Fronczek R, Lammers GJ, Balesar R, Unmehopa UA, Swaab DF (2005) The number of hypothalamic hypocretin (orexin) neurons is not affected in Prader‐Willi syndrome. J Clin Endocrinol Metab 90:5466–5470. [DOI] [PubMed] [Google Scholar]
- 10. Fronczek R, Overeem S, Lee SY, Hegeman IM, Van Pelt J, Van Duinen SG et al (2007) Hypocretin (orexin) loss in Parkinson's disease. Brain 130:1577–1585. [DOI] [PubMed] [Google Scholar]
- 11. Gaus SE, Lin L, Mignot E (2005) CSF hypocretin levels are normal in Huntington's disease patients. Sleep 28:1607–1608. [DOI] [PubMed] [Google Scholar]
- 12. Gerashchenko D, Murillo‐Rodriguez E, Lin L, Xu M, Hallett L, Nishino S et al (2003) Relationship between CSF hypocretin levels and hypocretin neuronal loss. Exp Neurol 184:1010–1016. [DOI] [PubMed] [Google Scholar]
- 13. Goldstone AP, Unmehopa UA, Bloom SR, Swaab DF (2002) Hypothalamic NPY and agouti‐related protein are increased in human illness but not in Prader‐Willi syndrome and other obese subjects. J Clin Endocrinol Metab 87:927–937. [DOI] [PubMed] [Google Scholar]
- 14. Goldstone AP, Unmehopa UA, Swaab DF (2003) Hypothalamic growth hormone‐releasing hormone (GHRH) cell number is increased in human illness, but is not reduced in Prader‐Willi syndrome or obesity. Clin Endocrinol (Oxf) 58:743–755. [DOI] [PubMed] [Google Scholar]
- 15. Hara J, Beuckmann CT, Nambu T, Willie JT, Chemelli RM, Sinton CM et al (2001) Genetic ablation of orexin neurons in mice results in narcolepsy, hypophagia, and obesity. Neuron 30:345–354. [DOI] [PubMed] [Google Scholar]
- 16. Harper P (1996) Huntington's Disease. W.B. Saunders Company Ltd.: London. [Google Scholar]
- 17. Kalra SP, Dube MG, Pu S, Xu B, Horvath TL, Kalra PS (1999) Interacting appetite‐regulating pathways in the hypothalamic regulation of body weight. Endocr Rev 20:68–100. [DOI] [PubMed] [Google Scholar]
- 18. Kassubek J, Juengling FD, Kioschies T, Henkel K, Karitzky J, Kramer B et al (2004) Topography of cerebral atrophy in early Huntington's disease: a voxel based morphometric MRI study. J Neurol Neurosurg Psychiatry 75:213–220. [PMC free article] [PubMed] [Google Scholar]
- 19. Katsuki H, Akaike A (2004) Excitotoxic degeneration of hypothalamic orexin neurons in slice culture. Neurobiol Dis 15:61–69. [DOI] [PubMed] [Google Scholar]
- 20. Kremer HP, Roos RA, Dingjan G, Marani E, Bots GT (1990) Atrophy of the hypothalamic lateral tuberal nucleus in Huntington's disease. J Neuropathol Exp Neurol 49:371–382. [DOI] [PubMed] [Google Scholar]
- 21. Kremer HP, Roos RA, Dingjan GM, Bots GT, Bruyn GW, Hofman MA (1991) The hypothalamic lateral tuberal nucleus and the characteristics of neuronal loss in Huntington's disease. Neurosci Lett 132:101–104. [DOI] [PubMed] [Google Scholar]
- 22. Loader C (1999) Local Regression and Likelihood. Springer‐Verlag: New York. [Google Scholar]
- 23. Mardia KV (1972) Statistics of Directional Data. Academic Press: New York. [Google Scholar]
- 24. Meier A, Mollenhauer B, Cohrs S, Rodenbeck A, Jordan W, Meller J et al (2005) Normal hypocretin‐1 (orexin‐A) levels in the cerebrospinal fluid of patients with Huntington's disease. Brain Res 1063:201–203. [DOI] [PubMed] [Google Scholar]
- 25. Menalled LB, Chesselet MF (2002) Mouse models of Huntington's disease. Trends Pharmacol Sci 23:32–39. [DOI] [PubMed] [Google Scholar]
- 26. Overeem S, Scammell TE, Lammers GJ (2002) Hypocretin/orexin and sleep: implications for the pathophysiology and diagnosis of narcolepsy. Curr Opin Neurol 15:739–745. [DOI] [PubMed] [Google Scholar]
- 27. Petersen A, Gil J, Maat‐Schieman ML, Björkqvist M, Tanila H, Araujo IM et al (2005) Orexin loss in Huntington's disease. Hum Mol Genet 14:39–47. [DOI] [PubMed] [Google Scholar]
- 28. Peyron C, Tighe DK, Van Den Pol AN, De Lecea L, Heller HC, Sutcliffe JG et al (1998) Neurons containing hypocretin (orexin) project to multiple neuronal systems. J Neurosci 18:9996–10015. [DOI] [PMC free article] [PubMed] [Google Scholar]
- 29. Peyron C, Faraco J, Rogers W, Ripley B, Overeem S, Charnay Y et al (2000) A mutation in a case of early onset narcolepsy and a generalized absence of hypocretin peptides in human narcoleptic brains. Nat Med 6:991–997. [DOI] [PubMed] [Google Scholar]
- 30. Pissios P, Bradley RL, Maratos‐Flier E (2006) Expanding the scales: the multiple roles of MCH in regulating energy balance and other biological functions. Endocr Rev 27:606–620. [DOI] [PubMed] [Google Scholar]
- 31. Sakurai T, Amemiya A, Ishii M, Matsuzaki I, Chemelli RM, Tanaka H et al (1998) Orexins and orexin receptors: a family of hypothalamic neuropeptides and G protein‐coupled receptors that regulate feeding behavior. Cell 92:573–585. [DOI] [PubMed] [Google Scholar]
- 32. Salomon RM, Ripley B, Kennedy JS, Johnson B, Schmidt D, Zeitzer JM et al (2003) Diurnal variation of cerebrospinal fluid hypocretin‐1 (Orexin‐A) levels in control and depressed subjects. Biol Psychiatry 54:96–104. [DOI] [PubMed] [Google Scholar]
- 33. Shimada M, Tritos NA, Lowell BB, Flier JS, Maratos‐Flier E (1998) Mice lacking melanin‐concentrating hormone are hypophagic and lean. Nature 396:670–674. [DOI] [PubMed] [Google Scholar]
- 34. Shimazaki T, Yoshimizu T, Chaki S (2006) Melanin‐concentrating hormone MCH(1) receptor antagonists: a potential new approach to the treatment of depression and anxiety disorders. CNS Drugs 20:801–811. [DOI] [PubMed] [Google Scholar]
- 35. Squitieri F, Frati L, Ciarmiello A, Lastoria S, Quarrell O (2006) Juvenile Huntington's disease: does a dosage‐effect pathogenic mechanism differ from the classical adult disease? Mech Ageing Dev 127:208–212. [DOI] [PubMed] [Google Scholar]
- 36. Swaab DF (2003) The human hypothalamus: basic and clinical aspects, part I: nuclei of the human hypothalamus. In: Handbook of Clinical Neurology, vol. 79. Aminoff MJ, Boller F, Swaab DF (eds). Elsevier: Amsterdam, the Netherlands. [Google Scholar]
- 37. Swanson LW, Sanchez‐Watts G, Watts AG (2005) Comparison of melanin‐concentrating hormone and hypocretin/orexin mRNA expression patterns in a new parceling scheme of the lateral hypothalamic zone. Neurosci Lett 387:80–84. [DOI] [PubMed] [Google Scholar]
- 38. Thannickal TC, Lai YY, Siegel JM (2007) Hypocretin (orexin) cell loss in Parkinson's disease. Brain 130:1586–1595. [DOI] [PMC free article] [PubMed] [Google Scholar]
- 39. Van der Burg JM, Bacos K, Wood NI, Lindqvist A, Wierup N, Woodman B et al (2007) Increased metabolism in the R6/2 mouse model of Huntington's disease. Neurobiol Dis 29:41–51. [DOI] [PubMed] [Google Scholar]
- 40. Van der Sluis PJ, Pool CW, Sluiter AA (1987) Press‐blotting on gelatin‐coated nitrocellulose membranes. A method for sensitive quantitative immunodetection of peptides after gel isoelectric focusing. J Immunol Methods 104:65–71. [DOI] [PubMed] [Google Scholar]
- 41. Vonsattel JP, Myers RH, Stevens TJ, Ferrante RJ, Bird ED, Richardson EP Jr (1985) Neuropathological classification of Huntington's disease. J Neuropathol Exp Neurol 44:559–577. [DOI] [PubMed] [Google Scholar]
- 42. Wiegand M, Moller AA, Lauer CJ, Stolz S, Schreiber W, Dose M et al (1991) Nocturnal sleep in Huntington's disease. J Neurol 238:203–208. [DOI] [PubMed] [Google Scholar]
- 43. Willie JT, Chemelli RM, Sinton CM, Yanagisawa M (2001) To eat or to sleep? Orexin in the regulation of feeding and wakefulness. Annu Rev Neurosci 24:429–458. [DOI] [PubMed] [Google Scholar]