Abstract
Adenosine receptors are G‐protein coupled receptors which modulate neurotransmitter release, mainly glutamate. Adenosine A1 and A2A receptors were studied in post‐mortem human cortex in Alzheimer's disease (AD) and age‐matched controls. Total adenosine A1 receptor number, determined by radioligand binding assay, using [3H]DPCPX, was significantly increased in AD cases in early and advanced stages without differences with the progression of the disease. A significant increase of A1R (37 kDa) levels was also observed by Western blot in early and advanced stages of AD. In addition, increased numbers of adenosine A2A receptors were observed in AD samples as determined by a binding assay using [3H]ZM 241385 as a radioligand and by Western blot. Increased binding and protein expression levels of adenosine receptors were not associated with increased mRNA levels coding A1 and A2A receptors. Finally, increased A1 and A2A receptor‐mediated response was observed. These results show up‐regulation of adenosine A1 and A2A receptors in frontal cortex in AD, associated with sensitization of the corresponding transduction pathways.
Keywords: Alzheimer's disease, adenosine receptors, adenylyl cyclase
INTRODUCTION
Adenosine receptors are G‐protein coupled receptors which have been classified into A1, A2A, A2B and A3 receptors. A1 and A3 receptors inhibit adenylyl cyclase through Gi/o proteins, while A2A and A2B receptors stimulate adenylyl cyclase through Gs proteins 16, 25. The endogenous ligand of these receptors is adenosine, which is widely distributed in both the central and the peripheral nervous systems. Adenosine is a neuromodulator and neuroprotective metabolite (13). Adenosine and drugs with effects on adenosine receptors may help to inhibit the progressive neurodegenerative process in dementia (28). However, the implications of adenosine A1 and A2A receptors in neuroprotection appear to be different. While agonists of A1 receptors have been widely considered as neuroprotectors, it has recently been observed that pharmacological blockade or gene disruption of adenosine A2A receptors confers neuroprotection. Caffeine, a non‐specific antagonist, has shown neuroprotection to β‐amyloid (Aβ) neurotoxicity in cultured neurons of rats (11) and mice 5, 12.
Alzheimer's disease (AD) is the major cause of dementia in the elderly. It is characterized by a progressive deterioration in memory and cognitive functions. The characteristic hallmarks of AD include senile plaques, mainly composed of Aβ peptide, neurofibrillary tangles, and selective synaptic and neuronal loss in several brain regions, including the cerebral cortex 7, 29. Previous studies have shown modifications of Adenosine A1 and A2A receptors in AD. Most of these studies were carried out in the hippocampus and striatum, and they have shown reduced adenosine A1 receptors in these areas 14, 18, 20, 32. However, little is known about adenosine A1, and even less about A2A receptors in the frontal cortex in AD in relation to the progressive stages of AD pathology. Therefore, the aim of the present work was to analyze adenosine A1 and A2 receptors and their inhibitory and stimulatory coupling, respectively, to adenylyl cyclase activity in brains from AD patients. Results have shown up‐regulation and sensitization of A1 and A2A receptors in the frontal cortex in AD as an early event of disease progression.
MATERIALS AND METHODS
Materials
Cyclopentyl‐1,3‐dypropylxanthine,8‐[dipropy‐2,3‐3H(N)] ([3H]DPCPX 120 Ci/mmol) and [3H]adenosine 3′, 5′‐cyclic phosphate ([3H]cAMP 27.4 Ci/mmol) were from PerkinElmer (Madrid, Spain) and [2‐3H](4‐(2‐[7‐amino‐2(2‐furyl)[1,2,4]triazolo[2,3‐a][1,3,5]triazin‐5‐ylamino]ethyl]phenol) ([3H]ZM 241385 27.4 Ci/mmol) from Tocris (Bristol, UK). Anti‐A1 antibody was from Oncogene (Cambridge, MA) and anti‐adenylyl cyclase I (ACI) antibody was from Santa Cruz (Madrid, Spain). Guanosin triphosphate was purchased from Roche (Barcelona, Spain). Calf intestine adenosine deaminase (ADA), forskolin, 2‐[4‐[(2‐carboxyethyl) phenyl]ethylamino]‐5′‐N‐ethylcarboxamidoadenosine (CGS 21680), N6‐cyclohexyladenosine (CHA), theophylline and N6‐cyclopentyladenosine (CPA) were from Sigma (Madrid, Spain). All other reagents were of analytical grade and obtained from commercial sources.
Tissue samples
Brain samples were obtained from the brain banks of the Institute of Neuropathology and the University of Barcelona‐Clinic Hospital following the guidelines of the local ethics committees. The brains of patients with AD and age‐matched controls were obtained from 3 to 24 h after death and were immediately prepared for morphological and biochemical studies. Although agonal state seems not to affect adenylyl cyclase measurements (8), cases with prolonged agonal state were not considered suitable for the present study. At autopsy, half of the brain was fixed in formalin, while the other half was cut in coronal sections 1 cm thick, frozen on dry ice and stored at −80°C until use. The neuropathological study was carried out on formalin‐fixed, de‐waxed 4‐µm thick paraffin sections of the frontal (area 8), primary motor, primary sensory, parietal and temporal superior, temporal inferior, anterior cingulate, anterior insular, and primary and associative visual cortices; entorhinal cortex and hippocampus; caudate, putamen and pallidum; medial and posterior thalamus; subthalamus; Meynert nucleus; amygdala; midbrain (two levels) pons and medulla oblongata; and cerebellar cortex and dentate nucleus. The sections were stained with hematoxylin and eosin, Luxol fast blue‐Klüver Barrera, and for immunohistochemistry to glial fibrillary acidic protein, CD68 and Licopericum esculentum lectin for microglia, Aβ, tau, αB‐crystallin, α‐synuclein and ubiquitin. AD‐related pathology was categorized following the proposal of Braak and Braak (7). The cases from the present study were used for the study of metabotropic glutamate receptors in cerebral cortex in AD (2). The main clinical and neuropathological characteristics are summarized in Table 1. No neurological or neuropathological abnormalities were observed in control cases.
Table 1.
Summary of the main clinical and neuropathological data in the present series. Abbreviations: M = male; F = female.
| Case number | Gender | Age | p‐m delay | Lewy stage | NFT stage | β‐amyloid stage |
|---|---|---|---|---|---|---|
| 1 | M | 82 | 11 | 0 | 0 | 0 |
| 2 | F | 63 | 7 | 0 | 0 | 0 |
| 3 | M | 76 | 10 | 0 | 0 | 0 |
| 4 | M | 80 | 11 | 0 | 0 | 0 |
| 5 | F | 79 | 7 | 0 | 0 | 0 |
| 6 | F | 80 | 3 | 0 | 0 | 0 |
| 7 | F | 65 | 4 | 0 | 0 | 0 |
| 8 | M | 71 | 12 | 0 | 0 | 0 |
| 9 | M | 78 | 2 | 0 | 0 | 0 |
| 10 | M | 80 | 13 | 0 | I | A |
| 11 | F | 85 | 12 | 0 | I | B |
| 12 | M | 59 | 7 | 0 | I | B |
| 13 | F | 73 | 15 | 0 | I | 0 |
| 14 | M | 78 | 6 | 0 | II | B |
| 15 | F | 76 | 9 | 0 | II | B |
| 16 | F | 81 | 6 | 0 | II | B |
| 17 | M | 74 | 24 | 0 | II | B |
| 18 | M | 74 | 4 | 0 | III | B |
| 19 | F | 74 | 5 | 0 | III | 0 |
| 20 | M | 72 | 3 | 0 | III | 0 |
| 21 | F | 81 | 14 | 0 | III | B |
| 22 | M | 85 | 14 | 0 | IV | B |
| 23 | F | 82 | 5 | 0 | IV | C |
| 24 | M | 79 | 5 | 0 | V | B |
| 25 | M | 93 | 7 | 0 | V | C |
| 26 | F | 78 | 19 | 0 | V | C |
| 27 | M | 69 | 6 | 0 | V | C |
| 28 | F | 86 | 10 | 0 | V | C |
| 29 | M | 69 | 20 | 0 | V | C |
| 30 | F | 82 | 10 | 0 | V | C |
| 31 | M | 85 | 8 | 0 | VI | C |
Lewy stage corresponds to staging of brain pathology related to sporadic Parkinson's disease. NFT stage refers to neurofibrillary degeneration staging in Alzheimer's‐disease‐related (AD) pathology, whereas βA‐amyloid stage refers to AD amyloid deposition following the classification of Braak and Braak (7). Stages I–II correspond to entorhinal, III–IV to limbic and V–VI to isocortical NFTs. Stage A indicates amyloid deposition in the basal neocortex, stage B indicates cortical association areas affected, and stage C indicates involvement of the whole isocortex.
Plasma membrane isolation
Plasma membranes from brain samples were isolated as described previously (10). Samples were homogenized in 20 volumes of isolation buffer (50 mM Tris‐HCl, pH 7.4 containing 10 mM MgCl2 and protease inhibitors) in Dounce homogenizer (10 × A, 10 × B). After homogenization, brain preparations were centrifuged for 5 minutes at 1000g in a Beckman JA 21 centrifuge. Supernatant was centrifuged for 20 minutes at 27 000g and the pellet was finally resuspended in isolation buffer. Protein concentration was measured by the method of Lowry et al (23), using bovine serum albumin as a standard.
[3H]DPCPX binding assays to plasma membranes
Binding assays to plasma membranes were performed as described previously (22). Plasma membranes were incubated with 5 U/mg ADA in 50 mM Tris, 2 mM MgCl2, pH 7.4, for 30 minutes at 25°C, in order to eliminate endogenous adenosine from membrane preparations. Then, plasma membranes (50–75 µg of protein) were incubated with [3H]DPCPX for 2 h at 25°C. Saturation assays were carried out at different [3H]DPCPX concentrations (0.1–20 nM) using CPA at a concentration 105 times higher than the radioligand, in order to obtain non‐specific binding. Binding assays were stopped by rapid filtration through Whatman GF/B filters, preincubated with 0.3% polyethylenimine, and then immediately washed three times with 4 mL ice‐cold buffer. Filters were then counted in a Microbeta Trilux (Perkin Elmer) liquid scintillation counter.
[3H]ZM 241385 binding assays to plasma membranes
Binding assays were performed as previously described (3). Plasma membranes were incubated with 5 U/mg ADA in 50 mM Tris, 2 mM MgCl2, 100 mM NaCl, pH 7.4, for 30 minutes at 25°C, in order to eliminate endogenous adenosine from membrane preparations. Then, plasma membranes (100 µg of protein) were incubated with [3H]ZM 241385 for 2 h at 25°C. Saturation assays were carried out at different [3H]ZM 241385 concentrations (0.5–50 nM) using 5 mM theophylline to obtain non‐specific binding. As in the case of A1R, binding assays were stopped by rapid filtration through Whatman GF/B filters, and then immediately washed and transferred to vials to count the radioactivity.
Adenylyl cyclase activity assay and determination of cAMP levels
Adenylyl cyclase activity was determined in brain plasma membranes as previously described (3) with several modifications. The assay was performed with 15–20 µg of protein in a final volume of 0.25 mL of 50 mM Tris‐HCl pH 7.4, 5 mM MgCl2, 1 mM DTT, 1 mg/mL BSA, 1 mg/mL creatine kinase, 10 mM creatine phosphate and 0.1 mM Ro 20‐1724 (specific phosphodiesterase inhibitor). Plasma membranes preincubated with ADA (5 U/mg protein), in order to remove endogenous adenosine, were incubated at 37°C for 15 minutes with 5 µM guanosine‐5′‐O(3‐thiotriphosphate) tetralithium salt (GTP?S), 50 µM forskolin, 1 mM CHA or 1 mM CGS21680. The reaction was started by the addition of 200 µM ATP and incubation at 37°C for 10 minutes. The reaction was stopped by boiling the samples which were then centrifuged at 12 000g for 4 minutes. Twenty microliters of supernatant was used to determine cAMP accumulation. Samples were incubated with 0.25 pmol [3H]cAMP and 6.25 µg PKA in a final volume of 200 µl of buffer assay (50 mM Tris‐HCl pH 7.4, 4 mM EDTA) for 2–8 h at 4°C. Standard samples (0–16 pmol) were prepared in the same buffer. The reaction was stopped by rapid filtration through Whatman GF/B filters, followed by washing with ice‐cold buffer. Filters were then counted in a Microbeta Trilux (Perkin Elmer) liquid scintillation counter.
Western blot assays
For Western blot assays, 30 µg of protein was mixed with loading buffer containing 0.125 M Tris (pH 6.8), 20% glycerol, 10% β‐mercaptoethanol, 4% SDS and 0.002% bromophenol blue, and heated at 95°C for 5 minutes. Sodium dodecylsulphate‐polyacrylamide gel electrophoresis (10% SDS‐PAGE) was carried out using a mini‐protean system (Bio‐Rad, Madrid, Spain) with molecular weight standards (Bio‐Rad) with molecular weight standards. Proteins were transferred to nitrocellulose membranes which were washed with TTBS containing 10 mM Tris‐HCl (pH 7.4), 140 mM NaCl and 0.1% Tween‐20, blocked with TTBS containing 5% skimmed milk, and then incubated with the primary antibodies at 4°C overnight. The rabbit polyclonal anti‐A1R and anti‐A2AR (Oncogene, Barcelona, Spain) were used at a dilution of 1:500. The rabbit polyclonal anti‐ACI (Santa Cruz Biotechnology, Madrid, Spain) was used at a dilution of 1:1000. After rinsing, the membranes were incubated with the corresponding anti‐rabbit secondary antibody (Dako, Madrid, Spain) at a dilution of 1:1000. The immunoreaction was visualized with the enhanced chemiluminescence detection Kit (Amersham, Madrid, Spain), and the specific bands were quantified by densitometry using Total Laboratory v2.01 software (Amersham, Madrid, Spain). The monoclonal antibody to β‐actin (Sigma, Madrid, Spain), at a dilution of 1:30 000, was used as a control of protein loading. Densitometric studies were normalized with β‐actin.
mRNA isolation
mRNA isolation was carried out using the Qiagen RNeasy lipid tissue (Qiagen) mini Kit following the instructions provided by the manufacturer. The concentration of each sample was obtained from A260 measurements. RNA integrity was tested by the Agilent 2100 BioAnalyzer (Agilent). Only RNAs with a RIN number above 6.5 were selected for TaqMan PCR assay.
cDNA synthesis
The retrotranscriptase reaction (100 ng RNA/µL) was carried out by using the high capacity cDNA Archive kit (Applied Biosystems) following the protocol provided by the supplier. Parallel reactions for each RNA sample were run in the absence of MultiScribe Reverse Transcriptase to assess the degree of contaminating genomic DNA.
TaqMan probes
Human β‐glucuronidase (GUS) (Hs99999908_m1, TaqMan probe 5′‐GACTGAACAGTCACCGACGAGAGTG‐3′), human β‐actin (Hs99999903_m1, TaqMan probe 5′‐TCGCCTTTGCCGATCC GCCGCCCGT‐3′), human A1R (Hs00379752_m1, TaqMan probe 5′‐GATCCCTCTCCGGTACAAGATGGTG‐3′) and human A2AR (Hs00169123_m1, TaqMan probe 5′‐CCGCTCCGGTACAATGG CTTGGTGA‐3′) were examined in the present study. The TaqMan assay for GUS is located between 11 and 12 exon boundary, at position 1816 of NM_000181.1 transcript sequence. The predicted amplicon size is about 81 base pairs. The TaqMan assay for β‐actin is located in the 5′ UTR region at position 36 of NM_001101.2 transcript generating an amplicon of 171 base pairs. The TaqMan assay for A1R is located between 5 and 6 exon boundary, at position 752 of NM_000674.1 transcript, generating an amplicon of 111 base pairs. The TaqMan assay for A2AR is located between 1 and 2 exon boundary, at position 614 of NM_000675.3 transcript, generating an amplicon of 66 base pairs.
TaqMan PCR
TaqMan PCR assays for every gene were performed in duplicate on cDNA samples in 384‐well optical plates using an ABI Prism 7900 Sequence Detection system (Applied Biosystems). The plates were capped using optical caps (Applied Biosystems). The ABI Prism 7900 measures the fluorescent accumulation of the PCR product by continuously monitoring cycle threshold (Ct), which is an arbitrary value assigned manually to a level somewhere above the baseline but in the exponential phase of PCR where there are no rate‐limiting components. The Ct value sets the point at which the sample amplification plot crosses the threshold. The Ct values correlate with the initial amount of specific template. For each 20 µL TaqMan reaction, 9 µL cDNA (diluted 1/20, which corresponds approximately to the cDNA from 45 ng of RNA) was mixed with 1 µL 20× TaqMan Gene Expression Assays and 10 µL of 2× TaqMan Universal PCR Master Mix (Applied Biosystems). Parallel assays for each sample were carried out using primers and probes with β‐actin and GUS for normalization. The reactions were carried out using the following parameters: 50°C for 2 minutes, 95°C for 10 minutes, and 40 cycles of 95°C for 15 s and 60°C for 1 minute. Standard curves were prepared for A1R, A2AR, β‐actin and GUS using serial dilutions of control human brain RNA. Finally, all TaqMan PCR data were captured using the Sequence Detector Software (SDS version 1.9, Applied Biosystems, Madrid, Spain).
Statistical and data analysis
The binding data were analyzed with the GraphPad Prism 4.0 program (GraphPad Software, San Diego, CA, USA). The numerical data obtained from diseased cases and the corresponding controls were statistically analyzed using STATGRAPHICS plus 5.0 software from ANOVA and the LSD statistical tests. Differences between mean values were considered statistically significant at P < 0.05.
RESULTS
Adenosine A1 receptors in AD
Adenosine A1 receptors were studied by radioligand binding assay using [3H]DPCPX, a selective A1 receptor antagonist, as radioligand. [3H]DPCPX binding to human brain was saturable and well‐adjusted to a single binding site model in all cases. As shown in Figure 1, the total adenosine A1 receptor number was significantly increased in AD (318.4% of controls, P < 0.001). The increase was observed in the early stages of the disease (stages I‐IV of Braak and Braak) without differences with respect to advanced stages (stages V and VI). However, no significant differences were observed in their corresponding receptor affinity (Kd) value, thus showing that receptor affinity was similar in control and AD cases. Figure 2 illustrates total receptor number values in different AD stages. An increased adenosine A1 receptor number is already observed at stage I, suggesting early involvement of this receptor. These results were confirmed by Western blot using specific A1 receptor antibodies in which a significant increase in the corresponding band of 37 kDa was observed in both early and advanced stages of AD when compared with controls (Figure 3).
Figure 1.
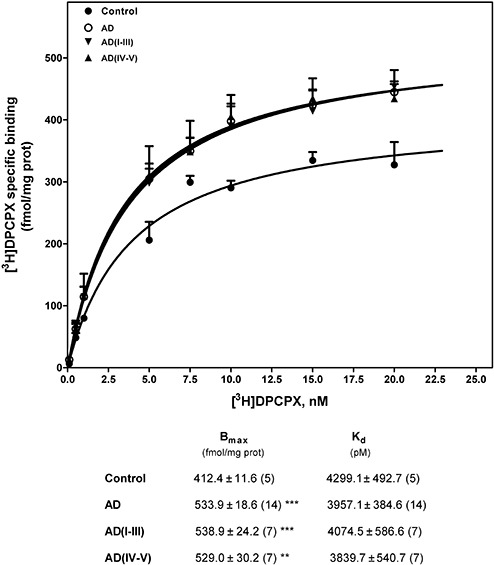
Adenosine A1 receptor detection in frontal cortex brain from Alzheimer's disease (AD). Saturation curves of [3H]DPCPX binding to plasma membranes were performed by incubation of 50–75 µg of membranes from control and AD brains with increasing concentrations of the radioligand, as described in Materials and methods. Total receptor number (Bmax) and receptor affinity (Kd) determined by Scatchard and non‐lineal regression analysis are shown in the inset. Data are mean ± SEM of control and AD cases performed in triplicate using different plasma membrane isolations. **P < 0.01 and ***P < 0.001 significantly different from control value.
Figure 2.
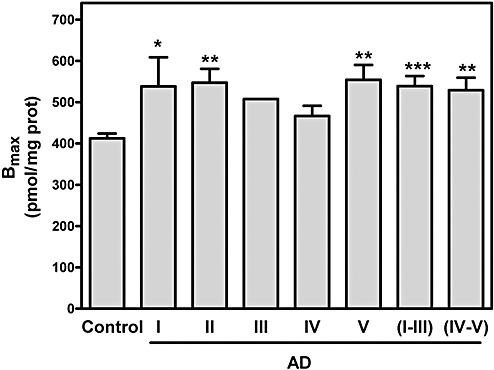
Total receptor number (Bmax) values of control and different stages of Alzheimer's disease (AD). Data were extracted from saturation assays performed at different stage of AD classified in accord with Braak and Braak, 1999. *P < 0.05, **P < 0.01 and ***P < 0.001 significantly different from control value.
Figure 3.
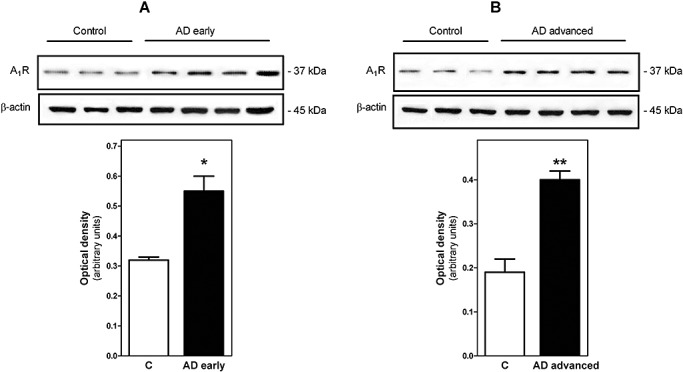
Detection of A1R by Western blot. Thirty micrograms of protein was subjected to SDS/PAGE, transferred electrophoretically to nitrocellulose and probed with antisera anti‐A1, as described in Materials and methods. For the control of protein, loading membranes were incubated with anti‐β‐actin. Panel A represent assays from early stages and Panel B from advanced stages of Alzheimer's disease (AD). Data are means ± SEM of represented cases. Inset shows A1 and β‐actin bands corresponding to a representative experiment. *P < 0.05 and **P < 0.01 significantly different from control value.
Adenosine A2A receptors in AD
Adenosine A2A receptors were determined by binding assay using [3H]ZM 241385, a selective A2A receptor antagonist, as radioligand. [3H]ZM 241385 specific binding was increased in AD. A significant increase in total A2A receptors was observed in early and advanced stages of AD. However, a significant increase in Kd values was observed in association with the increase in A2A receptors, suggesting a lower receptor affinity (Figure 4). The increase in A2A protein level, although not significant, was also detected by Western blot assays (Figure 5).
Figure 4.
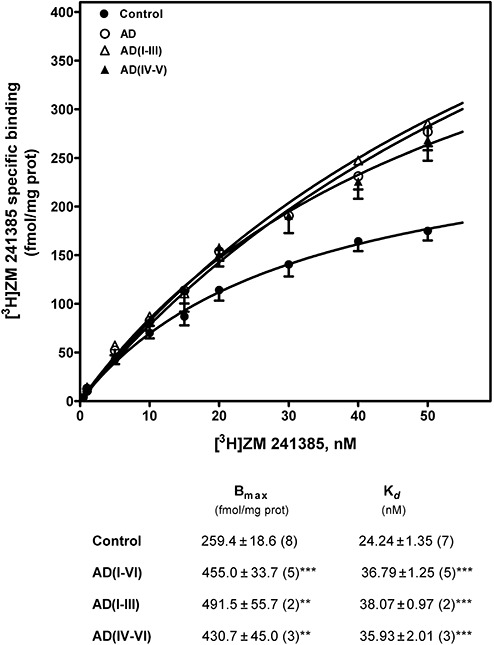
Adenosine A2A receptor detection in frontal cortex brain from Alzheimer's disease (AD). Saturation curves of [3H]ZM 241385 binding to plasma membranes were performed by incubation of 50–75 µg of membranes from control and AD brains as described in Materials and methods. Total receptor number (Bmax) and receptor affinity (Kd) determined by Scatchard and non‐lineal regression analysis are shown in the inset. Data are mean ± SEM of control and AD cases performed in triplicate using different plasma membranes isolations. **P < 0.01 and ***P < 0.001 significantly different from control value.
Figure 5.
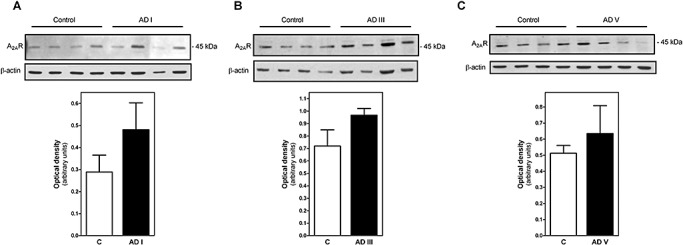
Detection of A2AR by Western blot. Thirty micrograms of protein was subjected to SDS/PAGE, transferred electrophoretically to nitrocellulose and probed with antisera anti‐A2A, as described in Materials and methods. For the control of protein, loading membranes were incubated with anti‐β‐actin. A2A was analyzed separately from Alzheimer's disease (AD) stage I (A), stage III (B) or stage V (C). Data are means ± SEM of represented cases. Inset shows A2A and β‐actin bands corresponding to a representative experiment.
Adenylyl cyclase I in AD
Western blot to ACI did not reveal significant differences in the expression levels of ACI between control and AD cases at any stage of the disease (Figure 6).
Figure 6.
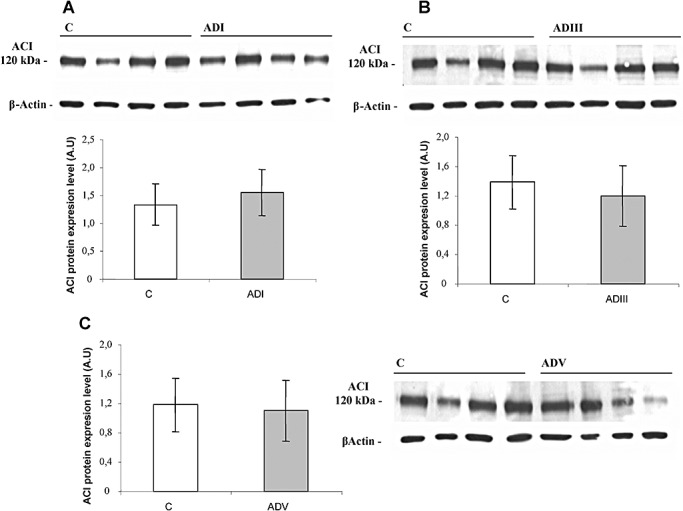
Detection of adenylyl cyclase I (ACI) by Western blot. Assays were performed as described in Methods and in the legend of Figure 3. ACI was analyzed separately from Alzheimer's disease (AD) stage I (A), stage III (B) or stage V (C). Data are means ± SD of represented cases. Inset shows ACI and β‐actin bands corresponding to a representative experiment.
mRNA levels of A1, A2A and ACI determined by real time PCR
We also analyzed adenosine A1R and A2AR mRNA levels by TaqMan PCR using human post‐mortem frontal cortex from patients suffering ADI, ADIII and ADV compared with age‐matched controls. For each experimental sample, the amount of target and endogenous references was determined from the appropriate standard curve which was plotted showing the cycle threshold, Ct (y), vs. the log of ng total control RNA (Figure 7A). Then the amount of each target was divided by the endogenous references β‐glucuronidase (GUSB) and β‐actin amount to obtain a normalized target value which permits determination of the relative mRNA levels of A1R and A2AR in control and diseased samples. The use of both endogenous control genes has been previously established by our group (6). Relative A1R (Figure 7B) and A2AR (Figure 7C) mRNA levels were not modified in the frontal cortex in early and advanced stages of AD when compared with control samples. The same results were obtained when normalization was performed with β‐actin (data not shown). mRNA coding ACI was not different between control (1.00 ± 0.20, n = 5) and diseased cases (1.14 ± 0.48, n = 4).
Figure 7.
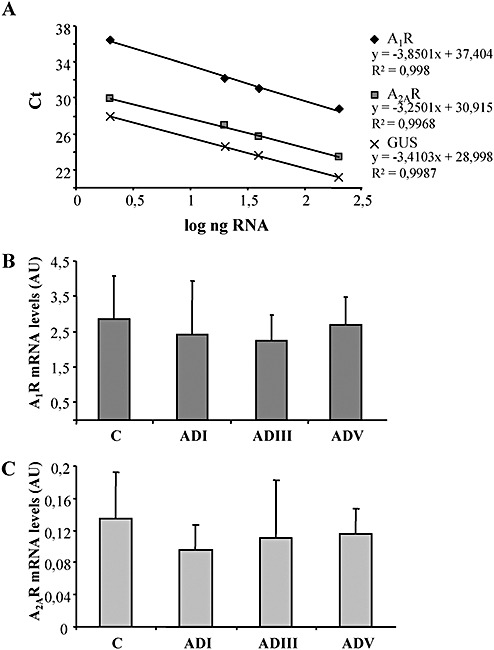
mRNA levels detected by real time PCR. A. Representative standard curves for A1R, A2AR and GUSB constructed from several concentrations of control human brain RNA. Ct values (y‐axis) vs. log of several RNA concentrations of control samples (x‐axis) show a reverse linear correlation. B. Relative A1R and C, A2AR expression levels (mean ± SD) normalized with GUSB in the frontal cortex of controls (C, n = 6) and different stages of Braak and Braak in Alzheimer's disease (AD) samples (ADI, n = 3; ADIII, n = 4; ADV, n = 6).
Adenylyl cyclase activity in AD
Basal, GTPγS‐ and Forskolin‐stimulated adenylyl cyclase activity were not altered, suggesting no differences in the G‐protein coupling to adenylyl cyclase (AC) in frontal cortex in AD (Figure 8). The inhibitory effect of CHA, a selective A1 agonist, on Forskolin‐stimulated activity was increased in frontal cortex AD (Table 2). The stimulatory effect of CGS 21680, a selective A2A agonist, was also enhanced in frontal cortex in AD (Table 2), suggesting a sensitization of adenosine receptors/adenylyl cyclase systems.
Figure 8.
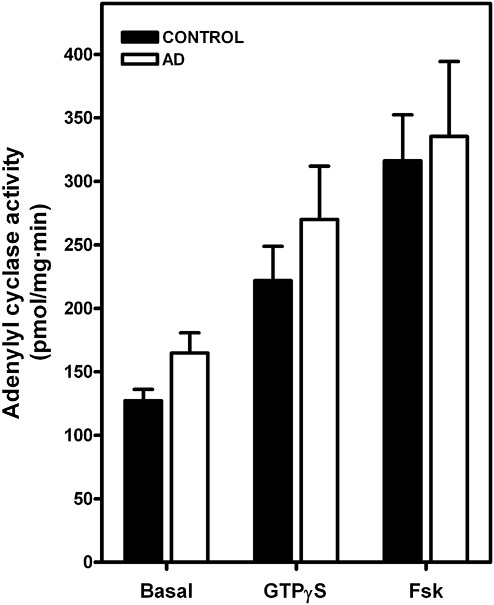
Adenylyl cyclase activity in brain plasma membranes from control and Alzheimer's disease (AD) cases. Fifteen to twenty micrograms of plasma membranes, previously treated with adenosine deaminase, were used to determine basal cAMP level and forskolin‐ or GTPγS‐stimulated in frontal cortex from AD (n = 12) and control (n = 8) cases. Data are means ± SEM of n cases performed in triplicate using different membrane preparations.
Table 2.
Adenosine receptors mediated Adenylyl cyclase activity in Alzheimer's disease (AD).
| Adenylyl cyclase activity | ||||
|---|---|---|---|---|
| A1‐mediated (% of inhibition of Fsk‐stimulated) | A2‐mediated (% of basal) | |||
| Control | 23.3 ± 6.0 | (8) | 179.1 ± 18.9 | (8) |
| AD | 40.1 ± 3.3 | (11)* | 253.7 ± 35.7 | (9)* |
Inhibitory effect of N6‐cyclohexyladenosine, selective A1 receptor agonist, on Forkolin‐stimulated adenylyl cyclase (AC), and stimulatory effect of CGS21680, selective A2A receptor agonist, on basal AC were analyzed in samples from frontal cortex of AD as compared with control. Data are means ± SEM of experiments performed in triplicate with membrane preparations from different cases. *P < 0.05 significantly different from control value.
DISCUSSION
Brain adenosine receptors have been suggested as targets for therapeutic intervention in neurodegenerative diseases. A1 receptor has long been known to mediate neuroprotection, mostly by blockade of calcium influx, which results in inhibition of glutamate release and reduction of its excitatory effects at a postsynaptic level 1, 15, 17, 26, 30. However, the role of A2A receptor in neuroprotection is not so clear, probably because of its lack of abundance in brain regions other than the striatum. Beneficial effects evoked by A2A receptor antagonists may be caused by blockade of presynaptic A2A receptors which are stimulatory on glutamate release (1). Blocking A2A receptor function using antagonists or deleting the A2A receptor gene results in a decrease in the extent of neuronal damage in adult animals. However, the mechanisms of this neuroprotection remain unknown (9).
Adenosine A1 and A2A receptors have been detected in post‐mortem human brain 24, 31. A1 receptors are vulnerable to AD. However, the results are controversial. Previous autoradiography and binding experiments have shown that A1 receptors were significantly reduced, with receptor affinity being higher in the hippocampus of AD patients as compared with controls 14, 32. In contrast, an increase in Adenosine A1 receptor immunoreactivity was found in neurons with neurofibrillary tangles, dystrofic neurites of senile plaques in the hippocampus and the frontal cortex of AD patients (4).
Recently, we described how metabotropic glutamate receptors are significantly decreased in AD and noted that the loss of mGlu receptors was more pronounced with disease progression (2). The results presented herein provide evidence that adenosine A1 and A2A receptors are up‐regulated in the frontal cortex in the same series of cases with AD, thus indicating different responses between metabotropic glutamate receptors and adenosine receptors in the frontal cortex in AD. This up‐regulation is accompanied by the sensitization of inhibitory and stimulatory transduction pathways mediated by adenosine receptors.
Discrepancies between previous studies and the present findings regarding expression of A1 receptors in AD cases can be explained on the basis of the different methods used. Yet the convergence of results, using various approaches such as binding assays, RT‐PCR and gel electrophoresis and Western blotting to analyze binding, mRNA levels and protein levels, respectively, provides a robust combination of techniques in support of the present observations.
In agreement with our results, significantly higher levels of cortical A1 and hippocampal A2A receptors have been found in a transgenic mice model of AD bearing the APP Swedish mutation when compared with non‐transgenic mice (5).
Apart from striatum, adenosine A2A receptors have been detected in other human brain areas such as cortex 3, 19, 31. These receptors are involved in neurodegenerative diseases involving the cerebral cortex, as a significant increase in A2A receptors has been detected in frontal cortex in Pick's disease (3). Moreover, cAMP signaling, as mediated by A2A receptors, increases cellular levels of amyloid precursor protein by stimulating APP gene expression in astrocytes (21). Finally, caffeine, an A2A receptor antagonist, prevents Aβ toxicity in mice (12) and rat cultured cerebellar granule neurons (11).
The possible role of adenosine receptors in processes involved in the pathophysiology of AD is unknown. Location of A1R in neurodegenerative structures of AD has been described. A marked increase in Adenosine A1 receptor immunoreactivity was found in degenerating neurons with neurofibrillary tangles and in dystrophic neurites of senile plaques in frontal cortex and hippocampus of AD. A high degree of co‐localization of A1R and Aβ in senile plaques and of A1R and tau in neurons with tau deposition, but without tangles, has been shown. A1R are involved in APP processing and in tau phosphorylation and in its translocation toward cytoskeleton in a human neuroblastoma cell line (4). Furthermore, increased A1R levels have also been detected in the cerebral cortex in Creutzfeldt‐Jakob disease and in the murine bovine spongiform encephalopathy model at advanced stages of the disease and coincidental with the appearance of PrP expression in brain from CJD (27). Therefore, changes in adenosine receptors seem not to be limited to AD neurodegeneration.
In summary, the present results show that adenosine A1 and A2A receptors are up‐regulated and sensitized in the AD frontal cortex, suggesting involvement of these receptors in the pathogenesis of AD, and opening new perspectives to therapeutic strategies geared to promote A1R and antagonize A2AR in AD.
ACKNOWLEDGMENTS
This work was supported in part by the European Union through the Marie‐Curie Research Training Network PRAIRIES, contract MRTN‐CT‐2006‐035810, FIS grants P102/0004, PI05/1631, G03/167 and C03/06 from the Instituto de Salud Carlos III, grants PAI‐05‐043 and GC05003 from Consejería de Educación y Ciencia and Consejería de Sanidad (Junta de Comunidades de Castilla‐La Mancha), by Brain Net II contract, and grants 04/301‐01 and 04/301‐02 from the Fundació“La Caixa”. We wish to thank T. Yohannan for editorial assistance. We are very grateful to Jesús Moreno and Salvador Juvés for excellent technical support in RNA extraction, BioAnalyzer analysis and TaqMan PCR assays.
REFERENCES
- 1. Abbracchio MP, Cattabeni F (1999) Brain adenosine receptors as targets for therapeutic intervention in neurodegenerative diseases. Ann N Y Acad Sci 890:79–92. [DOI] [PubMed] [Google Scholar]
- 2. Albasanz JL, Dalfo E, Ferrer I, Martin M (2005) Impaired metabotropic glutamate receptor/phospholipase C signaling pathway in the cerebral cortex in Alzheimer's disease and dementia with Lewy bodies correlates with stage of Alzheimer's‐disease‐related changes. Neurobiol Dis 20:685–693. [DOI] [PubMed] [Google Scholar]
- 3. Albasanz JL, Rodriguez A, Ferrer I, Martin M (2006) Adenosine A2A receptors are up‐regulated in Pick's disease frontal cortex. Brain Pathol 16:249–255. [DOI] [PMC free article] [PubMed] [Google Scholar]
- 4. Angulo E, Casado V, Mallol J, Canela EI, Vinals F, Ferrer I et al (2003) A1 adenosine receptors accumulate in neurodegenerative structures in Alzheimer disease and mediate both amyloid precursor protein processing and tau phosphorylation and translocation. Brain Pathol 13:440–451. [DOI] [PMC free article] [PubMed] [Google Scholar]
- 5. Arendash GW, Schleif W, Rezai‐Zadeh K, Jackson EK, Zacharia LC, Cracchiolo JR et al (2006) Caffeine protects Alzheimer's mice against cognitive impairment and reduces brain beta‐amyloid production. Neuroscience 142:941–952. [DOI] [PubMed] [Google Scholar]
- 6. Barrachina M, Castano E, Ferrer I (2006) TaqMan PCR assay in the control of RNA normalization in human post‐mortem brain tissue. Neurochem Int 49:276–284. [DOI] [PubMed] [Google Scholar]
- 7. Braak H, Braak E (1999) Temporal sequence of Alzheimer's disease‐related pathology. In: Cerebral Cortex. Vol. 14: Neurodegenerative and Age‐related Changes in Structure and Function of Cerebral Cortex. Peters A, Morrison JH (eds), pp. 475–512. Kluwer Academic/Plenum Press: New York, Boston, Dordrecht, London, Moscow. [Google Scholar]
- 8. Cowburn RF, O'Neill C, Ravid R, Alafuzoff I, Winblad B, Fowler CJ (1992) Adenylyl cyclase activity in postmortem human brain: evidence of altered G protein mediation in Alzheimer's disease. J Neurochem 58:1409–1419. [DOI] [PubMed] [Google Scholar]
- 9. Cunha RA (2005) Neuroprotection by adenosine in the brain: from A1 receptor activation to A2A receptor blockade. Purinergic Signal 1:111–134. [DOI] [PMC free article] [PubMed] [Google Scholar]
- 10. Dalfo E, Albasanz JL, Martin M, Ferrer I (2004) Abnormal metabotropic glutamate receptor expression and signaling in the cerebral cortex in diffuse Lewy body disease is associated with irregular alpha‐synuclein/phospholipase C (PLCbeta1) interactions. Brain Pathol 14:388–398. [DOI] [PMC free article] [PubMed] [Google Scholar]
- 11. Dall'Igna OP, Porciuncula LO, Souza DO, Cunha RA, Lara DR (2003) Neuroprotection by caffeine and adenosine A2A receptor blockade of beta‐amyloid neurotoxicity. Br J Pharmacol 138:1207–1209. [DOI] [PMC free article] [PubMed] [Google Scholar]
- 12. Dall'Igna OP, Fett P, Gomes MW, Souza DO, Cunha RA, Lara DR (2007) Caffeine and adenosine A(2a) receptor antagonists prevent beta‐amyloid (25–35)‐induced cognitive deficits in mice. Exp Neurol 203:241–245. [DOI] [PubMed] [Google Scholar]
- 13. Deckert J, Gleiter CH (1994) Adenosine—an endogenous neuroprotective metabolite and neuromodulator. J Neural Transm Suppl 43:23–31. [PubMed] [Google Scholar]
- 14. Deckert J, Abel F, Kunig G, Hartmann J, Senitz D, Maier H et al (1998) Loss of human hippocampal adenosine A1 receptors in dementia: evidence for lack of specificity. Neurosci Lett 244:1–4. [DOI] [PubMed] [Google Scholar]
- 15. Dunwiddie TV, Masino SA (2001) The role and regulation of adenosine in the central nervous system. Annu Rev Neurosci 24:31–55. [DOI] [PubMed] [Google Scholar]
- 16. Fredholm BB, IJzerman AP, Jacobson KA, Klotz KN, Linden J (2001) International Union of Pharmacology. XXV. Nomenclature and classification of adenosine receptors. Pharmacol Rev 53:527–552. [PMC free article] [PubMed] [Google Scholar]
- 17. Fredholm BB, Chen JF, Cunha RA, Svenningsson P, Vaugeois JM (2005) Adenosine and brain function. Int Rev Neurobiol 63:191–270. [DOI] [PubMed] [Google Scholar]
- 18. Ikeda M, Mackay KB, Dewar D, McCulloch J (1993) Differential alterations in adenosine A1 and kappa 1 opioid receptors in the striatum in Alzheimer's disease. Brain Res 616:211–217. [DOI] [PubMed] [Google Scholar]
- 19. Ishiwata K, Mishina M, Kimura Y, Oda K, Sasaki T, Ishii K (2005) First visualization of adenosine A(2A) receptors in the human brain by positron emission tomography with [11C]TMSX. Synapse 55:133–136. [DOI] [PubMed] [Google Scholar]
- 20. Kalaria RN, Sromek S, Wilcox BJ, Unnerstall JR (1990) Hippocampal adenosine A1 receptors are decreased in Alzheimer's disease. Neurosci Lett 118:257–260. [DOI] [PubMed] [Google Scholar]
- 21. Lee RK, Araki W, Wurtman RJ (1997) Stimulation of amyloid precursor protein synthesis by adrenergic receptors coupled to cAMP formation. Proc Natl Acad Sci USA 94:5422–5426. [DOI] [PMC free article] [PubMed] [Google Scholar]
- 22. Leon D, Albasanz JL, Ruiz MA, Fernandez M, Martin M (2002) Adenosine A1 receptor down‐regulation in mothers and fetal brain after caffeine and theophylline treatments to pregnant rats. J Neurochem 82:625–634. [DOI] [PubMed] [Google Scholar]
- 23. Lowry OH, Rosebrough NJ, Farr AL, Randall RJ (1951) Protein measurement with the Folin phenol reagent. J Biol Chem 193:265–275. [PubMed] [Google Scholar]
- 24. Nakata H (1992) Biochemical and immunological characterization of A1 adenosine receptors purified from human brain membranes. Eur J Biochem 206:171–177. [DOI] [PubMed] [Google Scholar]
- 25. Ralevic V, Burnstock G (1998) Receptors for purines and pyrimidines. Pharmacol Rev 50:413–492. [PubMed] [Google Scholar]
- 26. Ribeiro JA, Sebastiao AM, De Mendonca A (2003) Participation of adenosine receptors in neuroprotection. Drug News Perspect 16:80–86. [DOI] [PubMed] [Google Scholar]
- 27. Rodriguez A, Martin M, Albasanz JL, Barrachina M, Espinosa JC, Torres JM, Ferrer I (2006) Adenosine A1 receptor protein levels and activity is increased in the cerebral cortex in Creutzfeldt‐Jakob disease and in bovine spongiform encephalopathy‐infected bovine‐PrP mice. J Neuropathol Exp Neurol 65:964–975. [DOI] [PubMed] [Google Scholar]
- 28. Rudolphi KA, Schubert P (1997) Modulation of neuronal and glial cell function by adenosine and neuroprotection in vascular dementia. Behav Brain Res 83:123–128. [DOI] [PubMed] [Google Scholar]
- 29. Selkoe DJ (2002) Alzheimer's disease is a synaptic failure. Science 298:789–791. [DOI] [PubMed] [Google Scholar]
- 30. Stone TW (2005) Adenosine, neurodegeneration and neuroprotection. Neurol Res 27:161–168. [DOI] [PubMed] [Google Scholar]
- 31. Svenningsson P, Hall H, Sedvall G, Fredholm BB (1997) Distribution of adenosine receptors in the postmortem human brain: an extended autoradiographic study. Synapse 27:322–335. [DOI] [PubMed] [Google Scholar]
- 32. Ulas J, Brunner LC, Nguyen L, Cotman CW (1993) Reduced density of adenosine A1 receptors and preserved coupling of adenosine A1 receptors to G proteins in Alzheimer hippocampus: a quantitative autoradiographic study. Neuroscience 52:843–854. [DOI] [PubMed] [Google Scholar]


