Abstract
Hypoxic injury in the perinatal period may be involved in damaging the developing hippocampus. The damage may be mediated by excess production of vascular endothelial growth factor (VEGF) and nitric oxide (NO). We examined the hippocampus of neonatal Wistar rats subjected to hypoxia for VEGF and NO production. The mRNA and protein expression of hypoxia inducible factor‐1α, endothelial, neuronal, inducible nitric oxide synthase and VEGF was found to be up‐regulated significantly after the hypoxic exposure. Tissue VEGF concentration and NO production were also increased. By electron microscopy, swollen dendrites, vacuolated axons and hypertrophic astrocyte end feet associated with blood vessels were observed in hypoxic animals. In hypoxic rats, the passage of rhodamine isothiocyanate (RhIC) and horseradish peroxidase, administered intraperitoneally or intravenously, was observed through vascular walls. Furthermore, immunoglobulin G was localized in the neuropil and neurons. We suggest that increased VEGF and NO production in hypoxia had resulted in increased vascular permeability, leading to structural alteration of the dendrites and axons. Melatonin administration reduced VEGF and NO levels as well as leakage of RhIC, suggesting that it has a therapeutic potential in reducing hypoxia‐associated damage in the developing hippocampus.
Keywords: developing hippocampus, hypoxia, nitric oxide, vascular endothelial growth factor, vascular leakage
INTRODUCTION
Hypoxic injury in the perinatal period is a significant cause of neurodevelopmental impairment and disability (31), the primary cause of pre‐ or postnatal hypoxia being deficient placental or pulmonary gas exchange (2). Perinatal hypoxia induces learning, memory and cognitive dysfunctions 1, 2. Global hypoxia induces seizure activity in the developing rat brain (15) and in the human newborn 5, 32. Hippocampus, the brain region responsible for learning and memory functions, is known to be highly vulnerable to damage following hypoxic–ischemic insults 2, 10. Indeed, the involvement of developing hippocampus in cognitive deficits as a result of hypoxia has also been reported in children with cyanotic congenital heart disease (33).
The pathophysiologic mechanism of hypoxic damage to the hippocampus may involve cumulative effects of multiple factors such as glutamate release, excessive calcium influx, imbalance between excitatory and inhibitory neurotransmitter systems, synthesis of nitric oxide (NO), generation of free radicals and inflammatory reactions. Hypoxia inducible factor‐1α (HIF‐1α), which is expressed in response to hypoxia (37), plays a central role in the transcription of hypoxia‐responsive genes such as the vascular endothelial growth factor (VEGF), which increases the permeability of the blood vessels 26, 36, 43. The induction of inducible nitric oxide synthase (iNOS) mRNA expression and transcription (27) as well as the up‐regulation of neuronal nitric oxide synthase (nNOS) expression 6, 29 has been attributed to hypoxic conditions. The up‐regulation of endothelial nitric oxide synthase (eNOS) in hypoxic–ischemic conditions has also been described to induce vasodilation to increase blood flow (7).
In view of the above, we hypothesized that hypoxic injury in the neonatal period may result in increased production of VEGF and NO, leading to increased vascular permeability and structural damage in the immature hippocampus. Hence, we aimed to investigate the mRNA and protein expression of HIF‐1 α, VEGF, eNOS, nNOS and iNOS along with VEGF concentration, NO production and structural damage in the hippocampus of neonatal rats following a hypoxic exposure. Changes in vascular permeability were investigated by using tracers such as rhodamine isothiocyanate (RhIC) or horseradish peroxidase (HRP) and localizing immunoglobulin G (IgG) in the neuropil. Finally, we also sought to assess the effect of melatonin, an antioxidant and neuroprotective agent 34, 40, on the hypoxic neonatal hippocampus as it has been reported to reduce VEGF and NO production in the adult brain (17).
The hypoxia‐induced increased production of VEGF has also been considered as one of the most important factors stimulating the formation of new blood vessels. In view of this, we also examined the blood vessels in the hippocampus to determine if they showed any change in response to hypoxia by using anti‐rat endothelial cell antigen‐1 (RECA‐1), a specific marker of rat endothelial cells.
MATERIALS AND METHODS
Animals
Ninety‐nine 1‐day‐old Wistar rats were exposed to hypoxia by placing them in a chamber (Model: MCO 18M, Sanyo Biomedical Electrical Co, Ltd, Tokyo, Japan) filled with a gas mixture of 5% oxygen and the remainder 95% nitrogen for 2 h. The rats were then allowed to recover under normoxic conditions for 3 and 24 h, and 3, 7 and 14 days before sacrifice. Another group of 80 rats kept outside the chamber were used as age‐matched controls. The numbers of animals in each experimental and control group are summarized in Table 1. This study was approved by the Institutional Animal Care and Use Committee of the National University of Singapore.
Table 1.
Number of rats sacrificed at various time points after the hypoxic exposure (in brackets) and their age‐matched controls for various methods. Another 19 rats subjected to hypoxia (not included in the table) were administered with melatonin. Abbreviations: RT‐PCR = reverse‐transcription‐polymerase chain reaction; EIA = enzyme immunoassay; NO = nitric oxide.
| Control (hypoxic) | Immunohistochemistry | RT‐PCR | Western blotting | Electron microscopy |
|---|---|---|---|---|
| EIA and NO assay | ||||
| 1 day (3 h) | 3 (3) | 5 (5) | 5 (5) | 3 (3) |
| 2 days (24 h) | 3 (3) | 5 (5) | 5 (5) | 3 (3) |
| 4 days (3 days) | 3 (3) | 5 (5) | 5 (5) | 3 (3) |
| 8 days (7 days) | 3 (3) | 5 (5) | 5 (5) | 3 (3) |
| 15 days (14 days) | 3 (3) | 5 (5) | 5 (5) | 3 (3) |
Melatonin administration
To assess the effect of melatonin on VEGF concentration, NO production, vascular permeability and ultrastructure of cellular components, 19 rats were given intraperitoneal injections of melatonin dissolved in normal saline (10 mg/kg body weight) as described earlier (17). Each rat received the first injection of melatonin immediately before exposure to hypoxia, the second injection immediately after exposure to hypoxia and the third injection at 1 h after exposure to hypoxia. VEGF concentration and NO production were determined at 3 and 24 h (n = 5 rats at each time interval). The values between the hypoxic and hypoxic + melatonin‐administered rats were compared.
Six rats at 24 h treated with melatonin as above were used for the tracer studies as described below to examine the permeability of the blood vessels. Another three hypoxic rats administered with melatonin were used to examine the ultrastructure of the hippocampus.
Real‐time Reverse Transcription‐Polymerase Chain Reaction (Real‐time RT‐PCR)
The hippocampus was dissected and removed from the rat brain, and total RNA was extracted using the RNAesy mini kit (Qiagen, Valencia , CA, USA) according to the manufacturer's protocol. The amount of total RNA was quantified with a biophotometer (Eppendorf, San Jose, CA, USA).
For the reverse transcription, 2 µg of total RNA was combined with 1 µM of Oligo (dT) 15 primer (Invitrogen, Carlsbad, CA, USA), the mixture was heated at 70°C for 5 minutes and then placed on ice. Single‐strand cDNA was synthesized from the RNA by adding the following reagents (final concentrations): 1X first‐strand buffer, 1 U/µL RNAsin, 25 µM of each Deoxyribonucleotide triphosphate (dNTP) and 200 U Moloney Murine Leukemia Virus (M‐MLV) reverse transcriptase (Promega, Madison, WI, USA). The reaction mixture (20 µL) was incubated at 42°C for 50 minutes, and heating the mixture to 95°C for 5 minutes terminated the reaction. The samples were stored at −20°C for PCR analysis.
Quantitative RT‐PCR was carried out on a Light Cycler 3 instrument using a FastStart DNA Master plus SYBR Green I kit (Roche Diagnostics GmbH, Roche Applied Science, Mannheim, Germany) according to the manufacturer's instructions. The amplified PCR products were separated on a 1.5% agarose gel staining with eithidium bromide and photographed (Syngene, Chemi Genius2Bio Imaging System, Cambridge, UK). The expressions of target genes were measured in triplicate and were normalized to β‐actin, as an internal control. Forward and reverse primer sequence for each gene and their corresponding amplicon size are provided in Table 2. Gene expression was quantified using a modification of the 2−ΔΔctmethod as previously described (22).
Table 2.
Sequence of specific primers. Abbreviations: HIF‐1α = hypoxia inducible factor‐1α; VEGF = vascular endothelial growth factor; eNOS = endothelial nitric oxide synthase; iNOS = inducible nitric oxide synthase; nNOS = neuronal nitric oxide synthase.
| Primer | Forward | Reverse | Amplicon size |
|---|---|---|---|
| HIF‐1α | tcaagtcagcaacgtggaag | tatcgaggctgtgtcgactg | 198 bp |
| VEGF | agaaagcccatgaagtggtg | actccagggcttcatcattg | 177 bp |
| eNOS | tggcagccctaagacctatg | agtccgaaaatgtcctcgtg | 243 bp |
| iNOS | ccttgttcagctacgccttc | ggtatgcccgagttctttca | 179 bp |
| nNOS | ccggaattcgaataccagcctgatc | ccgaattcctccaggagggtgtccaccgcatg | 617 bp |
| β‐actin | tcatgaagtgtgacgttgacatccgt | cctagaagcatttgcggtgcaggatg | 285 bp |
Western blotting
The hippocampus tissues were removed and homogenized with tissue protein extraction reagent (Pierce Biotechnology, Inc., Rockford, IL, USA) containing protease inhibitors. All procedures were carried out at 4°C. The homogenates were centrifuged at 15 000 g for 10 minutes, and the supernatant was collected. Protein concentrations were determined by using bovine–serum albumin (Sigma‐Aldrich, St. Louis, MO, USA) as a standard. Samples of supernatants containing 20 µg protein were heated to 95°C for 5 minutes and were separated by sodium dodecyl sulfate polyacrylamide gel electrophoresis in 10% gels, in a Mini‐Protein II apparatus (Bio‐Rad Laboratories, Hercules, CA, USA). Protein bands were electroblotted onto 0.45‐µm polyvinylindene difluoride membranes (Bio‐Rad Laboratories, Inc., Hercules, CA, USA) at 1.5 mA/cm2 of the membrane for 1 h in Towbin buffer, pH 8.3, to which 20% (v/v) methanol had been added. After transfer, the membranes were blocked with 5% (w/v) nonfat dried milk and 0.05% (v/v) Tween‐20 (Bio‐Rad Laboratories, Inc., Hercules, CA, USA) in 20 mM Tris‐HCl buffer, pH 7.6, containing 137 mM sodium chloride. The membranes were then separately incubated with dilutions of the polyclonal VEGF (1:1000) and nNOS (1:500), and monoclonal HIF‐1α (1:500), eNOS (1:2500) and iNOS (1:3000) antibodies in blocking solution overnight at 4°C. They were then incubated with the secondary antibodies, HRP‐conjugated anti‐rabbit, 1:5000 for VEGF and nNOS, and HRP‐conjugated anti‐mouse, 1:5000 (GE Healthcare, Amersham, Bucks, UK) for HIF‐1α, eNOS and iNOS. Specific binding was revealed by an enhanced chemiluminescence kit (GE Healthcare, UK) following the manufacturer's instructions.
Analysis of VEGF concentration by enzyme immunoassay (EIA)
The amount of VEGF (ng/mL) released in the hippocampus samples from the control and following hypoxic exposure was determined using the Chemikine™ VEGF EIA kit (Chemicon International Inc., Temecula, CA, USA). The homogenates as described above for Western blotting were prepared, and EIA measurements were performed according to the manufacturer's protocol.
NO colorimetric assay
The total amount of NO in the hippocampus samples was assessed by the Griess reaction using a colorimetric assay kit (US Biological, Swampscott, MA, USA) that detects nitrite (NO2−), a stable reaction product of NO. The homogenates from the hippocampus were prepared as for Western blotting and nitrite colorimetric assay was performed according to the manufacturer's protocol.
Immunohistochemistry
The rats were anesthetized with 6% pentobarbital and perfused with an aldehyde fixative composed of a mixture of periodate–lysine–paraformaldeyde with a concentration of 2% paraformaldehyde. The brains were removed and kept in a similar fixative as above for 4 h, following which, they were kept at 4°C overnight in 0.1 M phosphate buffer containing 15% sucrose. The frozen coronal sections of the brain containing the hippocampus at 40‐µm thickness were cut with Frigocut cryotome (Leica Instruments GmbH, NuBloch, Germany) and were incubated with VEGF, nNOS, eNOS, iNOS, RECA‐1 and rat IgG antibodies at dilutions shown in Table 3, in phosphate‐buffered saline (PBS), for 16–20 h. Subsequent antibody detection was carried out by using the Vectastain ABC kit (PK4002 or PK 4001, Vector Laboratories, Burlingame, CA, USA) against the mouse or rabbit IgG with 3, 3′‐diaminobenzidine tetrachloride as a peroxidase substrate. For the negative controls, some sections from each group were incubated in a medium omitting the primary antibodies.
Table 3.
Antibodies used for immunohistochemistry and double immunofluorescence. Abbreviations: VEGF = vascular endothelial growth factor; eNOS = endothelial nitric oxide synthase; iNOS = inducible nitric oxide synthase; nNOS = neuronal nitric oxide synthase; RECA‐1 = anti‐rat endothelial cell antigen‐1; IgG = immunoglobulin G; GFAP = glial fibrillary acidic protein.
| Antibody | Host | Source | Dilution |
|---|---|---|---|
| VEGF | Rabbit‐polyclonal | Santa Cruz Biotechnology, Santa Crutz, CA, USA | 1:200 |
| eNOS | Mouse‐monoclonal | BD Transduction, BD Biosciences, San Jose, CA, USA | 1:250 |
| iNOS | Mouse‐monoclonal | BD Transduction, BD Biosciences, San Jose, CA, USA | 1:1000 |
| nNOS | Rabbit‐polyclonal | BD Transduction, BD Biosciences, San Jose, CA, USA | 1:500 |
| RECA‐1 | Mouse‐monoclonal | Abcam, Cambridge, UK | 1:50 |
| IgG | Rabbit‐polyclonal | Pierce Biotechnology, Rockford, IL, USA | 1:100 |
| GFAP | Mouse‐monoclonal | Chemicon International, Temecula, CA, USA | 1:1000 |
Double immunofluorescence
We used double immunofluorescence staining in 7‐day hypoxic rats and their corresponding controls to confirm whether cells expressing VEGF were the astrocytes. The rats were anesthetized and perfused as above for immunohistochemistry. The frozen sections of the brain at 40‐µm thickness containing the hippocampus were cut and rinsed in PBS. Endogenous peroxidase activity was blocked with 0.3% hydrogen peroxide in methanol for 30 minutes and subsequent washing with PBS. The sections were then incubated at room temperature with a cocktail mix of two primary antibodies, VEGF and glial fibrillary acidic protein (GFAP), at dilutions shown in Table 3. Subsequent antibody detection was carried out with a cocktail mix of two secondary antibodies: CY3‐conjugated goat anti‐rabbit IgG and fluorescein isothiocyanate (FITC)‐conjugated sheep anti‐mouse IgG. The sections were then washed in PBS and mounted with a fluorescent mounting medium (DAKO Cytomation, Glostrup, Denmark). Cellular colocalization was then studied in a confocal microscope (FV1000, Olympus Company Pte Ltd., Tokyo, Japan).
Electron microscopy
The rats were perfused with a mixed aldehyde fixative composed of 2% paraformaldehyde and 3% glutaraldehyde in 0.1 M phosphate buffer, pH 7.2. After perfusion, the brain was removed, and coronal slices (approximately 1‐mm thickness) were cut. Blocks of hippocampus from these slices were further cut. Vibratome sections of 80‐ to 100‐µm thickness were prepared from these blocks and rinsed overnight in 0.1 M phosphate buffer. They were then postfixed for 2 h in 1% osmium tetraoxide, dehydrated and embedded in Araldite mixture. Ultrathin sections were cut and viewed in a Philips CM 120 electron microscope (FEI Company, Hillsboro, OR, USA).
Tracer studies
RhIC
Three control rats, three hypoxic rats at 24 h and three hypoxia + melatonin rats were given an intraperitoneal injection of RhIC (5 µL of 1% RhIC/g body weight) dissolved in normal saline. The rats were sacrificed at 6 h after RhIC administration according to our earlier study (17). The rats were perfused with 2% paraformaldehyde in 0.1 M phosphate buffer. The brains were removed and kept in a similar fixative as above for 4 h, following which, they were kept at 4°C overnight in 0.1 M phosphate buffer containing 10% sucrose. The frozen coronal sections of the brains containing the hippocampus were cut and divided in two sets. One set of sections was mounted on gelatinized slides, air‐dried and cover slipped with a nonfluorescent medium, Entellan (Merck, Darmstadt, Germany). The second set of sections was used for immunofluoresence labeling using Lycopersicon esculentum lectin (1:100; Sigma‐Aldrich, St. Louis, MO, USA), a marker for blood vessels and microglia. The procedure followed that described above for double immunofluorescence labeling.
HRP injection
Three control rats, three rats at 24 h after the hypoxic exposure and three hypoxic rats treated with melatonin were given an intravenous injection of HRP (Type VI, Sigma‐Aldrich, St. Louis, MO, USA) via the left external jugular vein (0.3 µL/g body weight; 7.2 mg HRP dissolved in 50 µL of saline). Our earlier study had shown that following intravenous administration, HRP is extravasated from the blood vessels between 30 minutes and 1 h (23). In view of this, the rats in the present study were sacrificed by perfusion at 3 h after the HRP injection using a fixative composed of 1.25% glutaraldehyde and 1% paraformaldehyde in 0.01 M phosphate buffer and processed according to the procedure described earlier (23).
Statistical analysis
For the RT‐PCR, Western blots, EIA and NO colorimetric assay data are reported as mean ± standard deviation. Student's t‐test was used to determine the statistical significance of differences between normal and hypoxic, and between hypoxic and hypoxia + melatonin rats. A value of P < 0.05 was considered statistically significant.
RESULTS
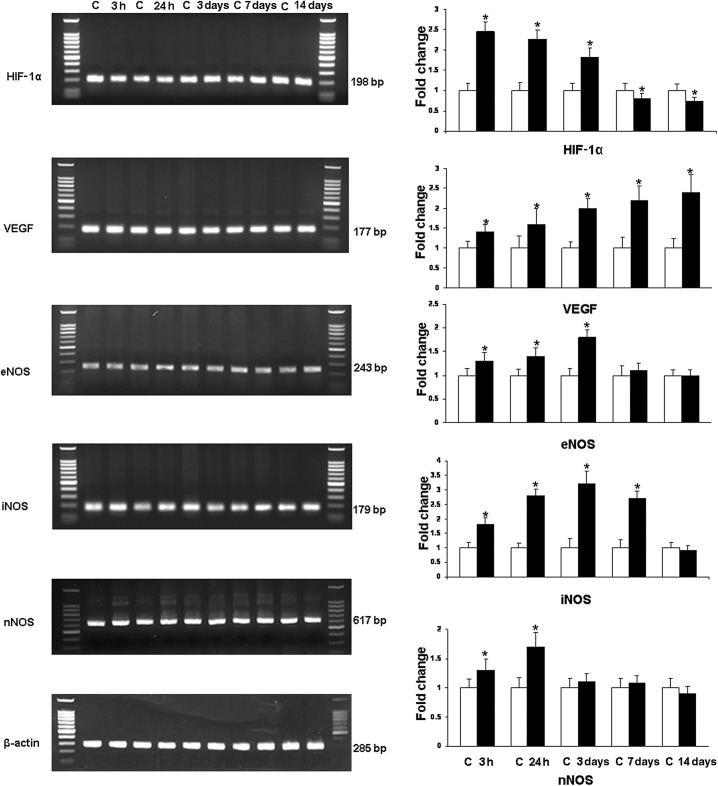
Analysis of HIF‐1α, VEGF, eNOS, nNOS and iNOS mRNA expression (Figure 1)
Figure 1.
RT‐PCR analysis of the hypoxia inducible factor‐1α (HIF‐1α), vascular endothelial growth factor (VEGF), endothelial (eNOS), inducible (iNOS) and neuronal (nNOS) nitric oxide synthase gene expression in the hippocampus of rats subjected to hypoxia. The left panel represents 1.5% agarose gel stained with ethidium bromide of RT‐PCR products of the above mentioned mRNA in the hippocampus of rats at 3 and 24 h, and 3, 7 and 14 days after the hypoxic exposure and their corresponding controls. The right panel shows the graphical representation of fold changes quantified by normalization to the β‐actin as an internal control. Each bar represents the mean ± standard deviation. Differences in the mRNA levels are significant (*P < 0.05) after the hypoxic exposure when compared with the controls.
At 3 h to 3 days after hypoxia, the expression of HIF‐1α mRNA in the hippocampus was increased significantly in comparison to the controls; it was then decreased drastically at 7 and 14 days to levels lower than that of the controls. VEGF mRNA showed a steady and significant increase at all time points after hypoxic exposure in comparison to the control values. Increase in eNOS mRNA was most marked at 3 h to 3 days but subsided at 7 days. The expression of iNOS mRNA showed a significant increase up to 7 days in hypoxic rats. nNOS mRNA was elevated up to 24 h when compared with the controls; it showed no significant change at longer time points.
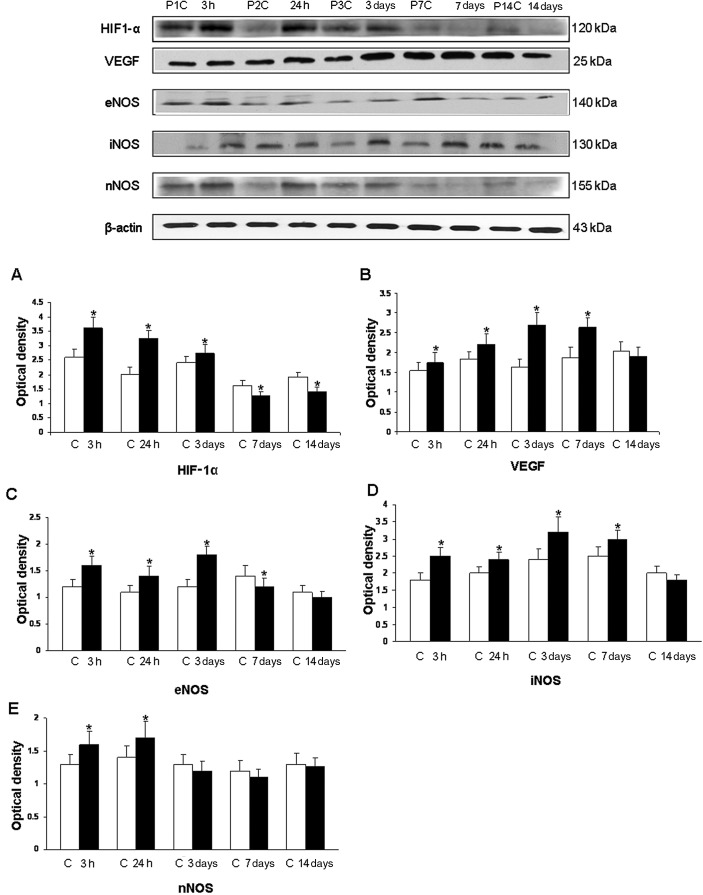
Analysis of HIF‐1α, VEGF, eNOS, iNOS and nNOS protein expression by Western blotting (Figure 2)
Figure 2.
Western blotting of hypoxia inducible factor‐1α (HIF‐1α), vascular endothelial growth factor (VEGF), endothelial (eNOS), inducible (iNOS) and neuronal (nNOS) nitric oxide synthase protein expression in the hippocampus of rats at 3 and 24 h, and 3, 7 and 14 days after the hypoxic exposure and their corresponding controls. The upper panel shows HIF‐1α (120 kDa), VEGF (25 kDa), eNOS (140 kDa), iNOS (130 kDa) and nNOS (155 kDa) immunoreactive bands. The lower panel represents bar graphs (A, HIF‐1α), (B, VEGF), (C, eNOS), (D, iNOS) and (E, nNOS) showing significant changes in the optical density after hypoxic exposure (given as mean ± standard deviation of optical density). Level of significance: *P < 0.05 vs. controls.
The immunoreactive band of HIF‐1α protein levels, approximately at 120 kDa, was increased significantly at 3 h to 3 days after hypoxic exposure. Using the VEGF antibody, an immunoreactive band of approximately 25 kDa was detected. This was significantly increased at 3 h to 7 days but was declined thereafter. The densitometry of eNOS protein band was expressed approximately at 140 kDa and showed a significant increase at 3 h to 3 days after hypoxic exposure; it was decreased thereafter. The immunoreactive bands of iNOS and nNOS were expressed at 130 and 155 kDa, respectively. The densitometry showed a significant increase up to 7 days for iNOS and 24 h for nNOS. No significant change was observed at other time points.
VEGF EIA
The analysis by EIA revealed that VEGF concentration increased significantly in the hippocampus at 3 h to 14 days in hypoxic rats when compared with the controls (Figure 3A). VEGF concentration was suppressed significantly in rats given the melatonin treatment (Figure 3C).
Figure 3.
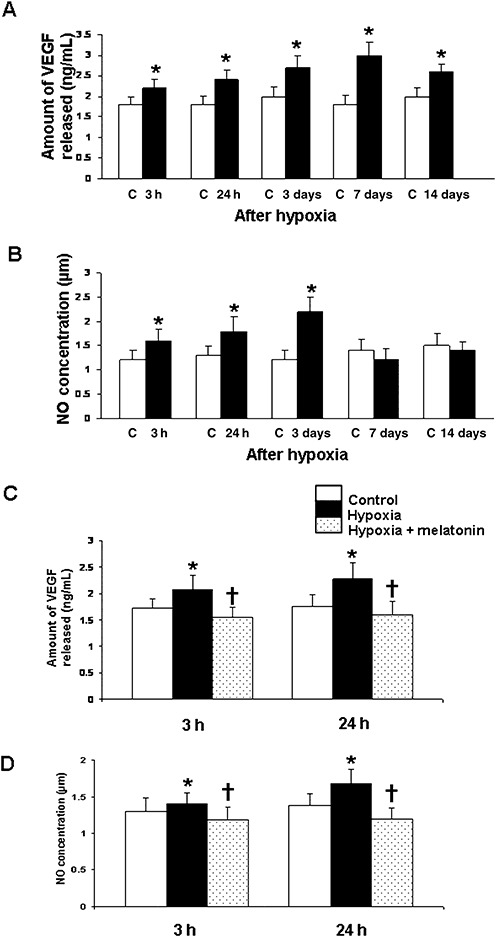
Vascular endothelial growth factor (VEGF) concentration (A) and nitric oxide (NO) production (B) in the hippocampus of the control rats and at 3 and 24 h, and 3, 7 and 14 days after hypoxic exposure. Data represent mean ± standard deviation. Significant differences in VEGF concentration and NO production between control and hypoxic rats are indicated by *P < 0.05. C and D show significant (†P < 0.05) reduction in levels of VEGF (C) and NO (D) at 3 and 24 h in the hippocampus after melatonin administration in hypoxic rats.
Nitrite assay
The NO levels in the hippocampus were significantly increased at 3 h to 3 days after hypoxic exposure when compared with the controls (Figure 3B). At 7–14 days, the difference between the control and hypoxic group was not significant. With melatonin administration, there was a significant decline in NO levels when compared with the hypoxic rats not given melatonin treatment (Figure 3D).
Immunohistochemistry
eNOS
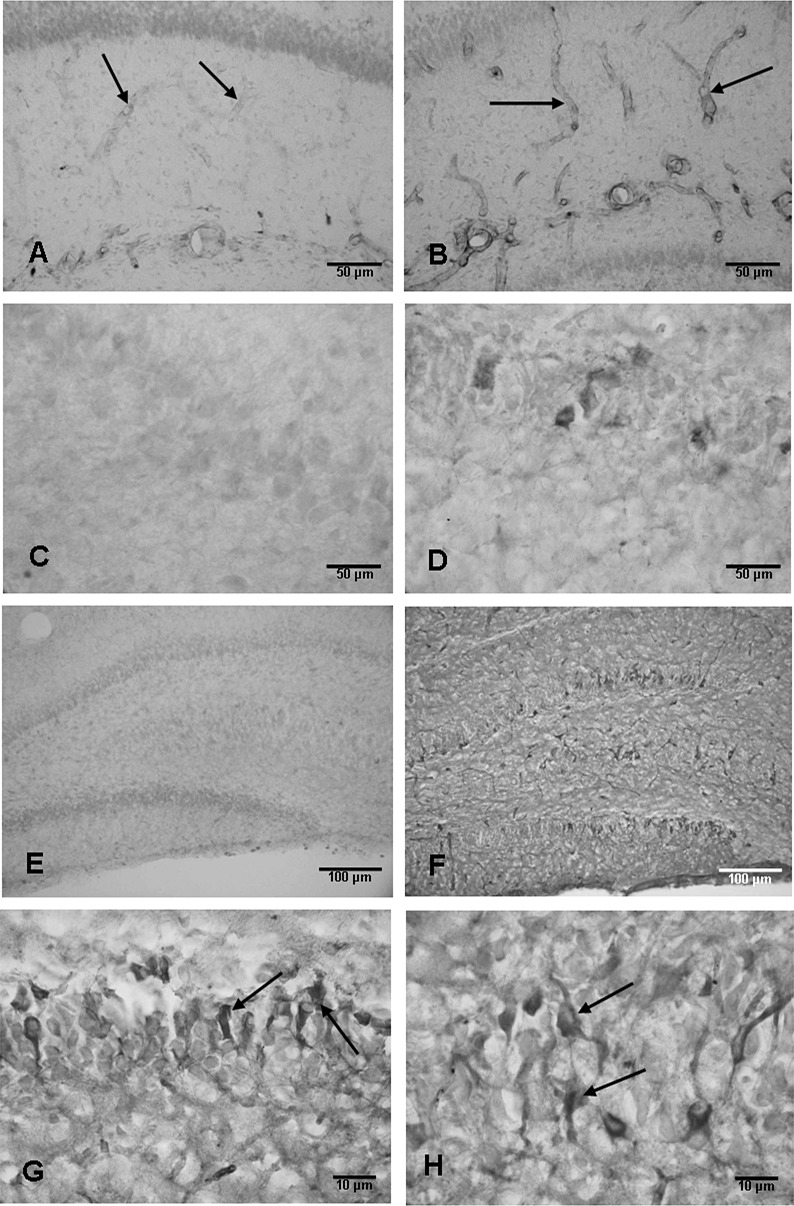
Weak eNOS expression was detected in some blood vessels in the hippocampus in the control rats (Figure 4A). Following hypoxic exposure at 3 h to 3 days, many blood vessels exhibited enhanced eNOS immunoreactivity (Figure 4B). The eNOS immunoreactivity appeared to reduce at 7 and 14 days after the exposure as compared with the earlier time intervals.
Figure 4.
Weak endothelial nitric oxide synthase (eNOS) expression is detected in some blood vessels (arrows) in the hippocampus in a 1‐day‐old control rat (A). The eNOS expression is enhanced drastically in the blood vessels (arrows) at 3 h after the hypoxic exposure (B). Scale bars: A,B = 50 µm. C and D show the neuronal nitric oxide synthase (nNOS) expression in the hippocampus. Weak nNOS expression is detected in the CA1 region of the hippocampus in a 1‐day‐old control rat (C); the expression is enhanced at 24 h after the hypoxic exposure (D). Scale bars: C,D = 50 µm. E and F show the inducible nitric oxide synthase (iNOS) expression in the hippocampus. Weak iNOS expression is present in some neurons in CA3 but not in the dentate gyrus (E). At 24 h after the hypoxic exposure, many neurons in the CA3 and dentate gyrus are expressing intense iNOS immunoexpression (F). Scale bars: E,F = 100 µm. G and H show iNOS immunoexpression in granule cells (arrows, G) and CA3 neurons (arrows, H) at 24 h after the exposure. Scale bars: G,H = 10 µm.
nNOS
Weak nNOS immunoexpression was observed in CA1 (Figure 4C), CA3 and dentate granule cells in the hippocampus in the control rats. The expression was enhanced at 3–24 h after the hypoxic exposure (Figure 4D), but was comparable to the controls in longer surviving rats.
iNOS
Ocassional cells expressing weak iNOS immunoreactivity were observed in the hippocampus in the control rats of all age groups (Figure 4E). The expression was markedly enhanced following the hypoxic exposure (Figure 4F) at 24 h to 7 days. Many pyramidal neurons, especially in the CA3 region and dentate granule cells, (Figure 4G,H) showed intense iNOS immunoreaction. At these time points, iNOS expression was also observed in some of the blood vessels. At 14 days, iNOS expression was attenuated.
VEGF
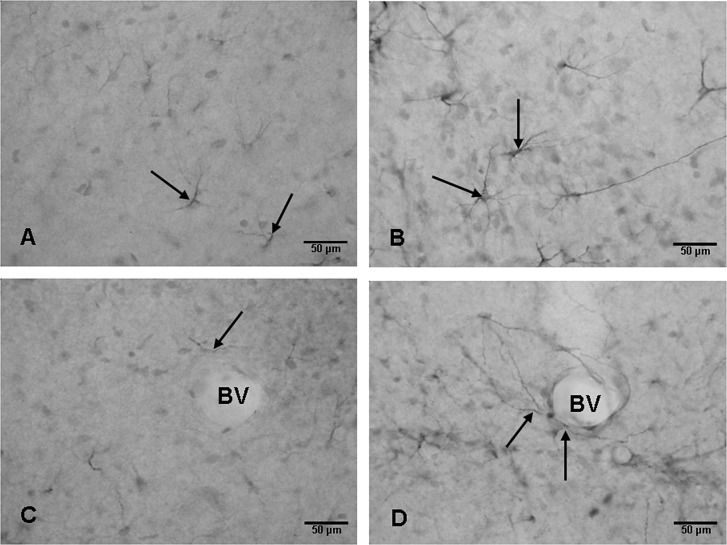
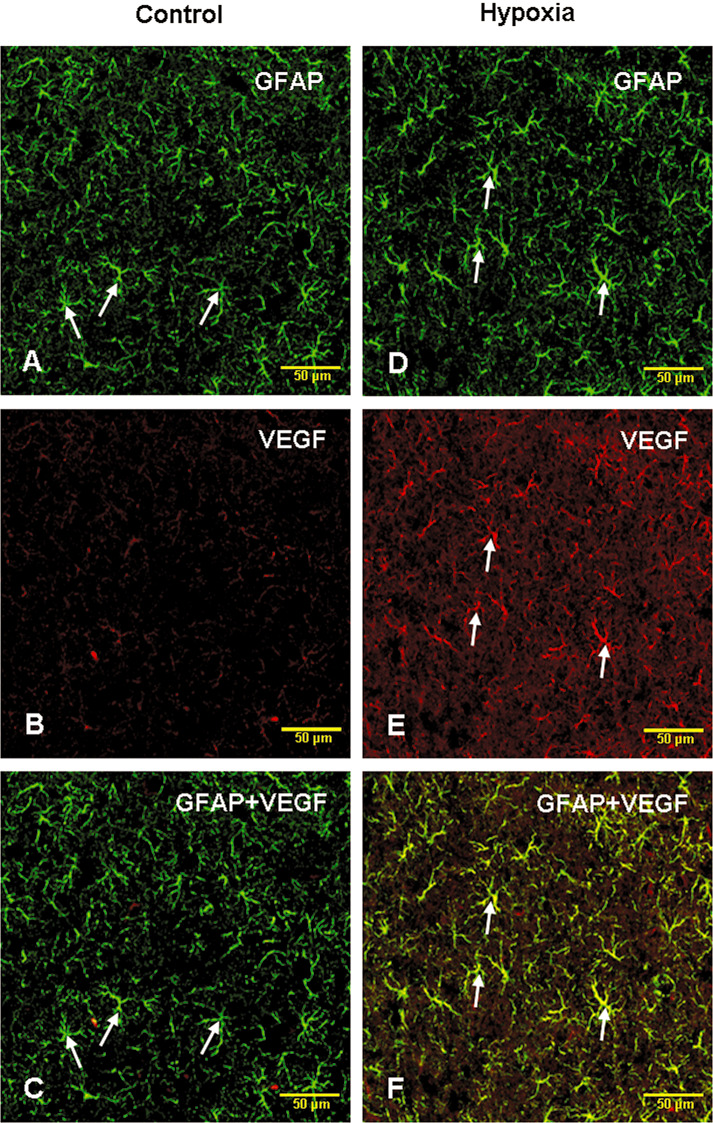
VEGF expression was observed in branched cells in the hippocampus in the control rats at various time points (Figure 5A,C). Following the hypoxic exposure, the immunoexpression was increased up to 14 days (Figure 5B,D). Many blood vessels were surrounded by VEGF positive cell processes. The VEGF expressing cells were identified to be the astrocytes with the double immunofluorescence method (Figure 6A–F).
Figure 5.
Weak expression of vascular endothelial growth factor (VEGF) is detected in astrocytes (arrows) in the hippocampus of an 8‐day‐old control rat (A,C). VEGF expression is enhanced in the cells (arrows) at 7 days (B,D) after the hypoxic exposure when compared with the corresponding controls. In D, VEGF positive processes (arrows) of astrocytes can be seen associated with a blood vessel (BV). In the corresponding control (C), the astrocyte processes (arrows) around a BV express extremely weak VEGF immunoreaction. Scale bars: A–D = 50 µm.
Figure 6.
Confocal images showing the distribution of glial fibrillary acidic protein (GFAP) (A,D; green) and vascular endothelial growth factor (VEGF) (B,E; red) immunoreactive astrocytes (arrows) in the hippocampus of a 7‐day hypoxic rat (D,E) and the corresponding control rat (A,B). The colocalized expression of VEGF with GFAP immunoreactive astrocytes can be seen in C and F. Scale bars: A–F = 50 µm.
RECA‐1
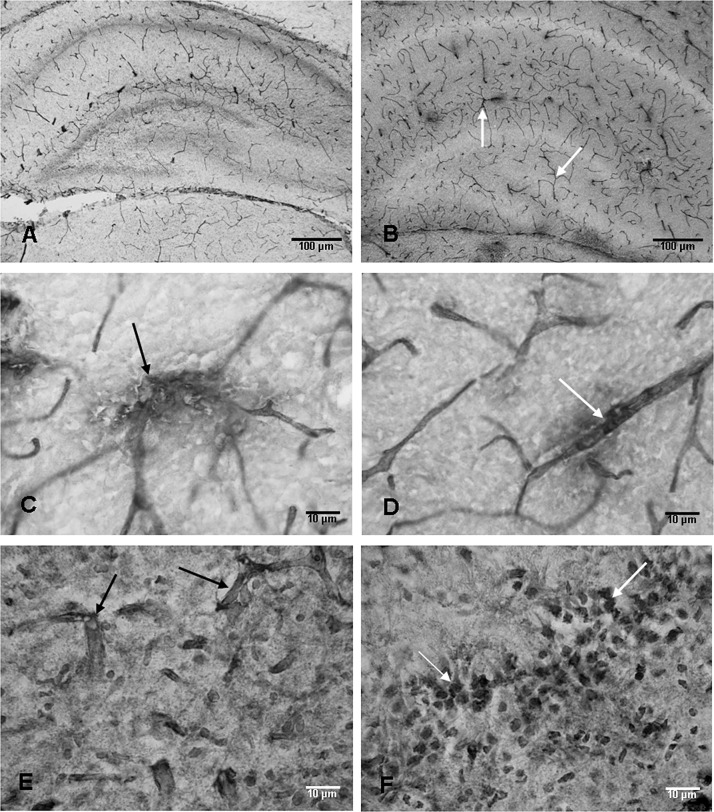
Blood vessels in the hippocampus of the control rats expressed RECA‐1 immunoreactivity (Figure 7A). At 7 and 14 days following the hypoxic exposure, many blood vessels showing extensive branching patterns as compared with the corresponding controls were observed (Figure 7B.). Some of the blood vessels in hypoxic rats appeared to have disrupted walls as evidenced by immunostained materials inundating the neuropil (Figure 7C,D). The blood vessels and neurons were found to be labeled by IgG at the above time points (Figure 7E,F).
Figure 7.
Anti‐rat endothelial cell antigen‐1 (RECA‐1)‐labeled blood vessels are seen in the hippocampus of an 8‐day‐old control rat (A). At 7 days after the hypoxic exposure, increased profiles of RECA‐1‐labeled blood vessels (arrows) are seen (B). The walls of some of the RECA‐1‐labeled blood vessels (arrows) appear to be disrupted in hypoxic rats at 7 days (C,D). Blood vessels (arrows) labeled with immunoglobulin G (IgG) at 7 days after the exposure can be seen in E. Many neurons (arrows) in the CA3 region also show IgG labeling (F). Scale bars: A,B = 100 µm; C–F = 10 µm.
Electron microscopy
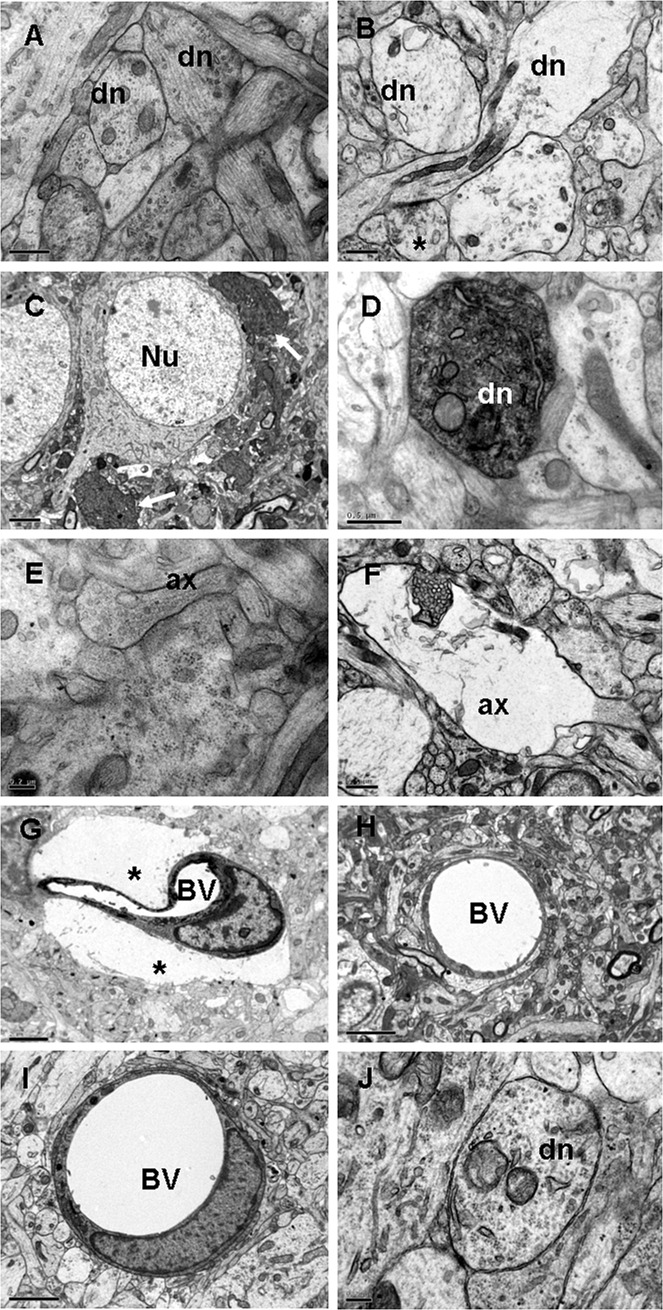
The most conspicuous structural alteration was the widespread occurrence of profiles of swollen dendrites at 3 and 24 h (Figure 8B). This was followed by the enhanced electron density of the dendrites in the CA3 region at 3 days after the hypoxic exposure (Figure 8C,D). Such dendrites were in close proximity to the soma of the pyramidal neurons (Figure 8C) and in the vicinity of the blood vessels. Swollen dendrites were absent in the control rats (Figure 8A). Other salient features in the hypoxic tissue included swelling of the axons from 3 h to 7 days (Figure 8F), many of them appeared to be undergoing degeneration as they were devoid of any organelles. Such features were not observed in the axons from the control rats (Figure 8E). Another remarkable ultrastructural change was the swelling of the astrocyte end feet around the blood vessels (Figure 8G) at all time points, which was not observed in the controls (Figure 8H). Following melatonin administration, the swelling of the astrocyte processes was not observed (Figure 8I). The swelling of the dendrites (Figure 8J) and axons also subsided, and dendrites showing enhanced electron density were not observed.
Figure 8.
Electron micrographs of the hippocampus from a 2‐day‐old control rat showing the dendrites (dn) in A. At 24 h after the hypoxic exposure, swollen dn and an axon terminal (*) are seen in B. At 3 days after the hypoxic exposure, dn with enhanced electron density (arrows) are seen close to some of the pyramidal neurons (Nu) in C and, at higher magnification, a similar dn shows mitochondria and dilated cisternae of endoplasmic reticulum in D. An axon (ax) and its terminal containing synaptic vesicles from a 4‐day‐old control rat are seen in E. A swollen axon (ax) in a hypoxic rat at 24 h after the exposure is seen in F. A blood vessel (BV) at 3 days (G) in a hypoxic rat is surrounded by extremely swollen astrocytic processes (asterisks) when compared with BVs in the corresponding controls (H). The swelling of astrocytic processes associated with a BV in I and of a dn in J is not apparent in a hypoxic rat treated with melatonin. Scale bars: A,B,D,F = 0.5 µm; C,G,H,I = 2 µm; E,J = 0.2 µm.
Tracer studies
RhIC
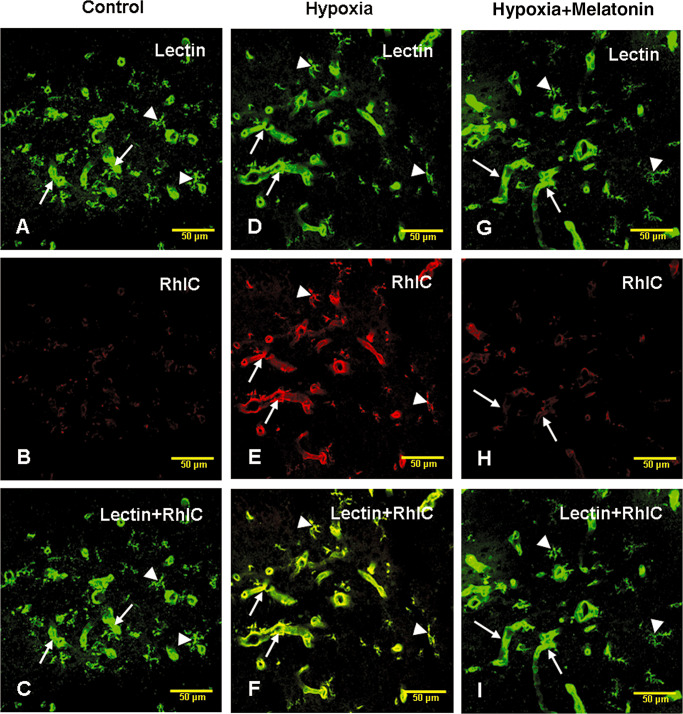
In the control, hypoxic and hypoxia + melatonin rats, lectin‐labeled blood vessels and microglial cells were observed (Figure 9A,D,G). There was evidence of leakage of RhIC as the walls of blood vessels emitted RhIC immunofluorescence in hypoxic rats (Figure 9E) but not in the controls (Figure 9B,C). The leaked RhIC appeared to be internalized by the lectin‐labeled microglial cells (Figure 9E,F). Melatonin administration reduced RhIC leakage as fewer blood vessels were labeled by RhIC in melatonin administered rats (Figure 9H). Lectin‐labeled microglia did not show RhIC labeling as evidenced by lack of colocalization of both markers (Figure 9I).
Figure 9.
Confocal images showing the distribution of lectin (A, green) and rhodamine isothiocyanate (RhIC)‐labeled (B, red) blood vessels (arrows) and microglial cells (arrowheads) in the hippocampus of a control rat. RhIC labeling cannot be visualized in the blood vessels or microglia (B). Colocalized labeling of lectin‐stained blood vessels and microglia with RhIC is hardly detected in C. D, E and F show lectin (D, green), RhIC (E, red) and colocalized labeling of lectin and RhIC (F) in the hippocampus at 6 h after RhIC administration. Note the lectin and RhIC colabeled blood vessels (arrows) and microglia (arrowheads). G, H and I show lectin (G, green), RhIC (H, red) and colocalized labeling of lectin and RhIC (I) in the blood vessels (arrows) and microglia (arrowheads) in the hippocampus in hypoxic rats after melatonin administration. Note the reduced RhIC labeling of the blood vessels after melatonin administration in hypoxic rats. Scale bars: A–I = 50 µm.
HRP
Granular HRP reaction product was localized in the perivascular cells in the hippocampus of hypoxic rats at 3 h after the injection of the tracer (Figure 10A–C). In the control rats and in hypoxia + melatonin rats, HRP‐labeled cells were either absent or labeled extremely weakly (data not shown).
Figure 10.
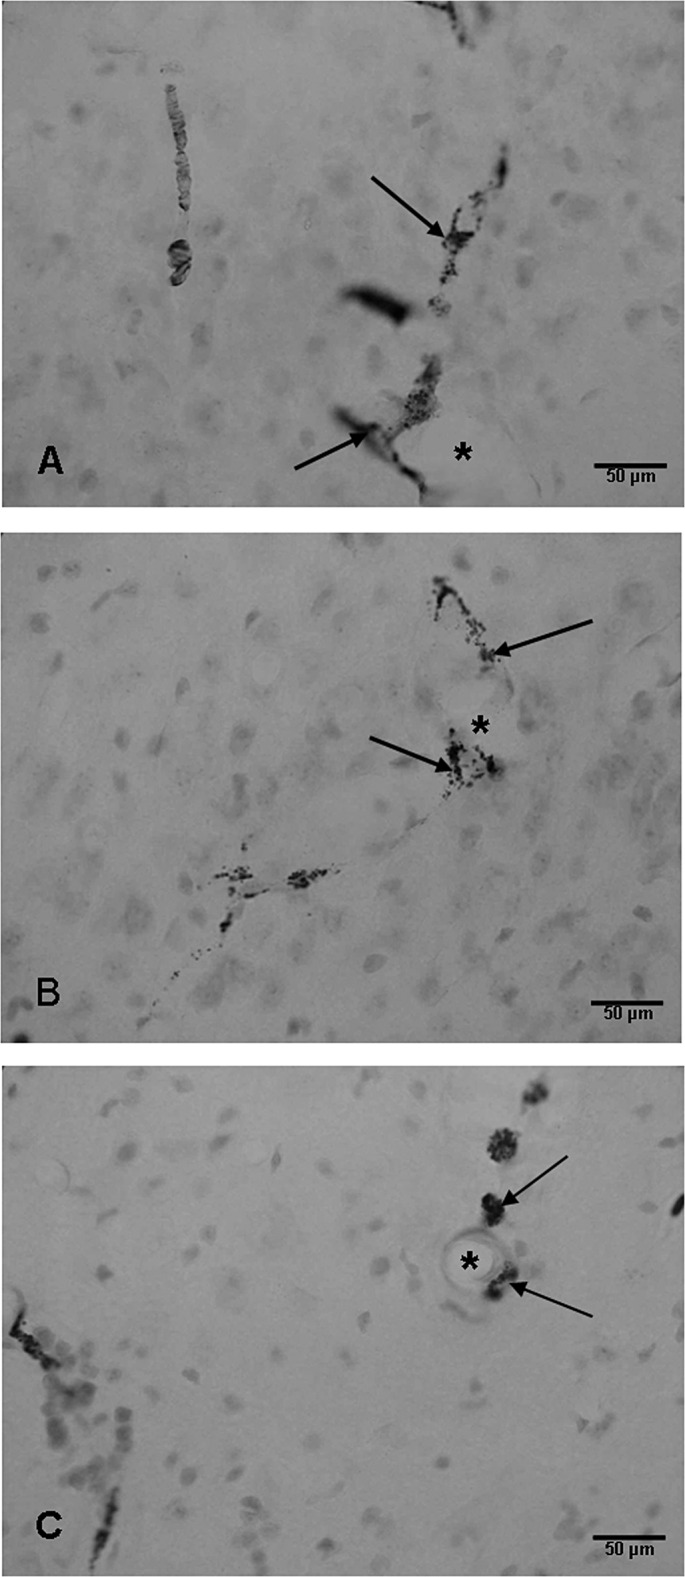
Blood vessels (asterisks) in the CA3 region (A,B) and hilum of the dentate gyrus (C) of the hippocampus of a hypoxic rat at 24 h showing horseradish peroxidase‐labeled perivascular cells (arrows). Scale bars: A–C = 50 µm.
DISCUSSION
Decreased oxygen availability in various tissues evokes the expression of HIF‐1α, which has been described as a master regulator of cellular oxygen homeostasis. HIF‐1α is known to activate the expression of many genes at the transcriptional level (37) including vasoactive substances such as VEGF and enzymes for producing NO. The present study has shown an enhanced mRNA and protein expression of HIF‐1α, VEGF, eNOS, iNOS and nNOS in the neonatal hippocampus as early as 3 h following a hypoxic exposure. The mRNA expression of HIF‐1α remained elevated up to 3 days, whereas VEGF and iNOS was enhanced for longer periods.
Role of VEGF in the hypoxic hippocampus
The actions of the VEGF have been reported to be restricted to the endothelial cells (8). It has been reported to play a central role in the regulation of vasculogenesis (30) and has been suggested to be a key mediator of hypoxia‐induced angiogenesis, promoting the growth of new blood vessels. Besides being a potent angiogenic factor, VEGF has also been characterized as an inducer of vascular leakage (38), promoting the leakage of plasma proteins from blood vessels. Hypoxia has been suggested as an important pathogenic factor for the induction of vascular leakage in the brain (36) through increased production of VEGF. Young et al (43) showed that the intravenous administration of VEGF at birth increased blood brain barrier permeability within 2 h. It increases the fenestration of endothelial cells and extravasation of plasma proteins (35). VEGF has also been reported to stimulate vasodilation and leakage of water and large molecular weight proteins from blood vessels resulting in edema (3). The fenestration of the endothelium reflects an increased permeability of the endothelial cells for low molecular weight substances (20). Vascular permeability was, indeed, increased in the present study as shown by the leakage of RhIC and HRP. This was further supported by the extravasation of IgG, which labeled the neurons. Edema was evidenced by swollen astocytic processes closely associated with the blood vessels in the hypoxic animals.
Role of NO in hypoxic hippocampus
NO is known to play an important role in the pathogenesis of neuronal injury during cerebral hypoxia–ischemia. NO is synthesized from L‐arginine by the enzyme NOS, which exists in three isoforms: nNOS, eNOS and iNOS. The present study has shown a significant increase in the production of NO in response to hypoxia in the hippocampus.
NO has been described to have neuroprotective and neurotoxic roles. The modulation of NO availability by eNOS seems to be a protective response as it is an important determinant to maintain cerebral perfusion in hypoxic conditions. Vasodilation occurring after hypoxic–ischemic episodes is mediated by eNOS (7), leading to increased blood flow. However, besides its beneficial effects of producing vasodilatation and increasing the blood flow, a predominant role for eNOS has been proposed in VEGF‐induced vascular hyperpermeability 12, 26.
A large number of blood vessels were found to express eNOS immunoreactivity in the hippocampus of hypoxic rats in the present study. As vasodilatation and increase in blood flow occur in response to hypoxia, the enhanced expression of eNOS observed up to 3 days may be involved in the dilatation of blood vessels to increase the blood flow. NO generation from eNOS occurring early in response to ischemic injury (41) is considered to be important in decreasing ischemic injury by inducing vasodilation. As NO has also been implicated in the regulation of vascular permeability 12, 14, the leakage of serum‐derived substances through the dilated blood vessels may lead to tissue damage in the hippocampus.
NO production from nNOS and iNOS contributes to cytotoxicity, resulting in cell death and axonal damage 13, 29. Besides HIF‐1α, VEGF has also been reported to induce the expression of iNOS (19). Although no degenerating neurons were observed in the present study, the expression of iNOS and nNOS in the pyramidal neurons may be responsible for producing the alterations observed in the dendrites and axons in the present study. Astrocytes and microglial cells may also have contributed to excess production of NO as these cells are also known to express iNOS under stressful conditions 9, 18. It has been reported that NO derived from nNOS in the developing brain correlates with regions of selective vulnerability to hypoxic–ischemic injury (6). Our earlier study reported evidence of hypoxia‐induced increased NO and alteration in the dendrites in the cerebellum of adult rats (16). Hypoxia‐induced damage to neuronal cells in the CA3 region and dentate gyrus has been reported in hypoxic–ischemic conditions (25). It appears that multiple factors such as enhanced production of VEGF and NO, and increased permeability of blood vessels in the developing hippocampus may be responsible for causing damage to the dendrites and axons.
Neovascularization in the hypoxic hippocampus
Hypoxia is a stimulus for the increased production of VEGF, which has been considered as one of the most important factors stimulating the formation of new blood vessels 4, 28. VEGF is critical for the normal development of the vessels, that is, vasculogenesis in the embryo (3). Proliferation and differentiation of vascular endothelial cells in situ has been reported to be regulated by VEGF 11, 42. However, excess production of VEGF stimulates the formation of new vessels, that is, angiogenesis or neovascularization, which is different from vasculogenesis (3). Neovascularization is the formation of new blood vessels from preexisting blood vessels and involves many steps such as vasodilation, increased vascular permeability, degradation of extracellular matrix, liberation of growth factors and endothelial cell proliferation. Besides VEGF, NO has also been reported as an important modulator of endothelial function pertaining to angiogenesis (24). New vessel formation was evidenced in the present study by extensive branching of the RECA‐1‐stained blood vessels in the hippocampus at 14 days. Our results are supported by earlier studies, which have reported that reduced tissue oxygen tension leads to neovascularization (39). We suggest that neovascularization is an adaptive response to increase the blood flow and meet the oxygen demands of the developing hippocampus, and this response may be helpful in ameliorating damage to the structural components such as the dendrites. The absence of swollen and electron dense dendrites at 14 days after hypoxic exposure supports this notion.
Beneficial effect of melatonin
Melatonin, an antioxidant (34), has been thought to be potentially useful in the treatment of neurodegenerative conditions that may involve free radical production, such as perinatal hypoxia (40). The beneficial effect of melatonin in such conditions, as shown in the present study, is evidenced by the reduction in VEGF concentration and NO production and the concomitant decrease in vascular permeability following melatonin administration in hypoxic rats. This is consistent with a previous study, which reported a decline in serum VEGF levels following melatonin administration (21). It was also helpful in preserving the structural integrity of the dendrites and axons as well as reduced the astrocytic swelling, and hence, the hypoxia‐induced edema.
CONCLUSIONS
We have shown that a hypoxic exposure results in increased production of VEGF and NO in the developing hippocampus, resulting in increased permeability of the immature blood vessels evidenced by the leakage of RhIC and HRP. Melatonin may be beneficial in protecting the neurons and other elements in the developing hippocampus as it reduces VEGF concentration, NO production and, hence, vascular permeability. The structural changes observed in the dendrites and axons were also reversed with melatonin treatment.
ACKNOWLEDGMENTS
This study was supported by research grants (R181‐000‐065‐112 and R‐181‐000‐098‐112) from the National University of Singapore. The technical assistance Ms Y.G. Chan is gratefully acknowledged.
There is no conflict of interest among the authors.
REFERENCES
- 1. Almli CR, Levy TJ, Han BH, Shah AR, Gidday JM, Holtzman DM (2000) BDNF protects against spatial memory deficits following neonatal hypoxia‐ischemia. Exp Neurol 166:99–114. [DOI] [PubMed] [Google Scholar]
- 2. Balduini W, De Angelis V, Mazzoni E, Cimino M (2000) Long‐lasting behavioral alterations following a hypoxic/ischemic brain injury in neonatal rats. Brain Res 859:318–325. [DOI] [PubMed] [Google Scholar]
- 3. Bates DO, Harper SJ (2002) Regulation of vascular permeability by vascular endothelial growth factors. Vascul Pharmacol 39:225–237. [DOI] [PubMed] [Google Scholar]
- 4. Battegay EJ (1995) Angiogenesis: mechanistic insights, neovascular diseases, and therapeutic prospects. J Mol Med 73:333–346. [DOI] [PubMed] [Google Scholar]
- 5. Bergamasco B, Benna P, Ferrero P, Gavinelli R (1984) Neonatal hypoxia and epileptic risk: a clinical prospective study. Epilepsia 25:131–136. [DOI] [PubMed] [Google Scholar]
- 6. Black SM, Bedolli MA, Martinez S, Bristow JD, Ferriero DM, Soifer SJ (1995) Expression of neuronal nitric oxide synthase corresponds to regions of selective vulnerability to hypoxia‐ischaemia in the developing rat brain. Neurobiol Dis 2:145–155. [DOI] [PubMed] [Google Scholar]
- 7. Bolanos JP, Almeida A (1999) Roles of nitric oxide in brain hypoxia‐ischemia. Biochim Biophys Acta 1411:415–436. [DOI] [PubMed] [Google Scholar]
- 8. Breier G, Albrecht U, Sterrer S, Risau W (1992) Expression of vascular endothelial growth factor during embryonic angiogenesis and endothelial cell differentiation. Development 114:521–532. [DOI] [PubMed] [Google Scholar]
- 9. Brown GC, Bolaños JP, Heales SJ, Clark JB (1995) Nitric oxide produced by activated astrocytes rapidly and reversibly inhibits cellular respiration. Neurosci Lett 193:201–214. [DOI] [PubMed] [Google Scholar]
- 10. Colbourne F, Sutherland GR, Auer RN (1999) Electron microscopic evidence against apoptosis as the mechanism of neuronal death in global ischemia. J Neurosci 19:4200–4210. [DOI] [PMC free article] [PubMed] [Google Scholar]
- 11. Connolly DT (1991) Vascular permeability factor: a unique regulator of blood vessel function. J Cell Biochem 47:219–223. [DOI] [PubMed] [Google Scholar]
- 12. Fukumura D, Gohongi T, Kadambi A, Izumi Y, Ang J, Yun CO, et al (2001) Predominant role of endothelial nitric oxide synthase in vascular endothelial growth factor‐induced angiogenesis and vascular permeability. Proc Natl Acad Sci USA 98:2604–2609. [DOI] [PMC free article] [PubMed] [Google Scholar]
- 13. Iadecola C, Zhang F, Casey R, Nagayama M, Ross ME (1997) Delayed reduction of ischemic brain injury and neurological deficits in mice lacking the inducible nitric oxide synthase gene. J Neurosci 17:9157–9164. [DOI] [PMC free article] [PubMed] [Google Scholar]
- 14. Janigro D, West GA, Nguyen TS, Winn HR (1994) Regulation of blood‐brain barrier endothelial cells by nitric oxide. Circ Res 75:528–538. [DOI] [PubMed] [Google Scholar]
- 15. Jensen FE, Wang C, Stafstrom CE, Liu Z, Geary C, Stevens MC (1998) Acute and chronic increases in excitability in rat hippocampal slices after perinatal hypoxia in vivo. J Neurophysiol 79:73–81. [DOI] [PubMed] [Google Scholar]
- 16. Kaur C, Sivakumar V, Singh G, Singh J, Ling EA (2005) Response of Purkinje neurons to hypobaric hypoxic exposure as shown by alteration in expression of glutamate receptors, nitric oxide synthases and calcium binding proteins. Neuroscience 135:1217–1229. [DOI] [PubMed] [Google Scholar]
- 17. Kaur C, Sivakumar V, Zhang Y, Ling EA (2006) Hypoxia‐induced astrocytic reaction and increased vascular permeability in the rat cerebellum. Glia 54:826–839. [DOI] [PubMed] [Google Scholar]
- 18. Kaur C, Sivakumar V, Ang LS, Sunderasan L (2006) Hypoxic damage to the periventricular white matter in neonatal brain: role of vascular endothelial growth factor, nitric oxide and excitotoxicity. J Neurochem 98:1200–1216. [DOI] [PubMed] [Google Scholar]
- 19. Kroll J, Waltenberger J (1998) VEGF‐A induces expression of eNOS and iNOS in endothelial cells via VEGF receptor‐2 (KDR). Biochem Biophys Res Commun 252:743–746. [DOI] [PubMed] [Google Scholar]
- 20. Levick JR, Smaje LH (1987) An analysis of the permeability of a fenestra. Microvasc Res 33:233–256. [DOI] [PubMed] [Google Scholar]
- 21. Lissoni P, Rovelli F, Malugani F, Bucovec R, Conti A, Maestroni GJ (2001) Anti‐angiogenic activity of melatonin in advanced cancer patients. Neuro Endocrinol Lett 22:45–47. [PubMed] [Google Scholar]
- 22. Livak KJ, Schmittgen T (2001) Analysis of relative gene expression data using real‐time quantitative PCR and the 2(‐Delta Delta C(T)) method. Methods 24:402–408. [DOI] [PubMed] [Google Scholar]
- 23. Lu J, Kaur C, Ling EA (1993) Uptake of tracer by the epiplexus cells via the choroid plexus epithelium following an intravenous or intraperitoneal injection of horseradish peroxidase in rats. J Anat 183:609–617. [PMC free article] [PubMed] [Google Scholar]
- 24. Marinos RS, Zhang W, Wu G, Kelly KA, Meininger CJ (2001) Tetrahydrobiopterin levels regulate endothelial cell proliferation. Am J Physiol Heart Circ Physiol 281:H482–H489. [DOI] [PubMed] [Google Scholar]
- 25. Matsuoka Y, Kitamura Y, Fukunaga R, Shimohama S, Nabeshima T, Tooyama I, et al (1997) In vivo hypoxia‐induced neuronal damage in dentate gyrus of rat hippocampus: changes in NMDA receptors and the effect of MK‐801. Neurochem Int 30:533–542. [DOI] [PubMed] [Google Scholar]
- 26. Mayhan WG (1999) VEGF increases permeability of the blood‐brain barrier via a nitric oxide synthase/cGMP‐dependent pathway. Am J Physiol 276:C1148–1153. [DOI] [PubMed] [Google Scholar]
- 27. Melillo G, Musso T, Sica A, Taylor LS, Cox GW, Varesio L (1995) A hypoxia‐responsive element mediates a novel pathway of activation of the inducible nitric oxide synthase promoter. J Exp Med 182:1683–1693. [DOI] [PMC free article] [PubMed] [Google Scholar]
- 28. Milkiewicz M, Ispanovic E, Doyle JL, Haas TL (2006) Regulators of angiogenesis and strategies for their therapeutic manipulation. Int J Biochem Cell Biol 38:333–357. [DOI] [PubMed] [Google Scholar]
- 29. Mishra OP, Mishra R, Ashraf QM, Delivoria‐Papadopoulos M (2006) Nitric oxide‐mediated mechanism of neuronal nitric oxide synthase and inducible nitric oxide synthase expression during hypoxia in the cerebral cortex of newborn piglets. Neuroscience 140:857–863. [DOI] [PubMed] [Google Scholar]
- 30. Neufeld G, Cohen T, Gengrinovitch S, Poltorak Z (1999) Vascular endothelial growth factor (VEGF) and its receptors. FASEB J 13:9–22. [PubMed] [Google Scholar]
- 31. Nyakas C, Buwalda B, Luiten PG (1996) Hypoxia and brain development. Prog Neurobiol 49:1–51. [DOI] [PubMed] [Google Scholar]
- 32. Owens J Jr, Robbins CA, Wenzel HJ, Schwartzkroin PA (1997) Acute and chronic effects of hypoxia on the developing hippocampus. Ann Neurol 41:187–199. [DOI] [PubMed] [Google Scholar]
- 33. Raman L, Tkac I, Ennis K, Georgieff MK, Gruetter R, Rao R (2005) In vivo effect of chronic hypoxia on the neurochemical profile of the developing rat hippocampus. Brain Res Dev Brain Res 156:202–209. [DOI] [PubMed] [Google Scholar]
- 34. Reiter RJ (1997) Antioxidant actions of melatonin. Adv Pharmacol 38:103–117. [DOI] [PubMed] [Google Scholar]
- 35. Roberts WG, Palade GE (1995) Increased microvascular permeability and endothelial fenestration induced by vascular endothelial growth factor. J Cell Sci 108:2369–2379. [DOI] [PubMed] [Google Scholar]
- 36. Schoch HJ, Fischer S, Marti HH (2002) Hypoxia‐induced vascular endothelial growth factor expression causes vascular leakage in the brain. Brain 125:2549–2557. [DOI] [PubMed] [Google Scholar]
- 37. Semenza GL (1998) Hypoxia‐inducible factor 1: master regulator of O2homeostasis. Curr Opin Genet Dev 8:588–594. [DOI] [PubMed] [Google Scholar]
- 38. Senger DR, Galli SJ, Dvorak AM, Perruzzi CA, Harvey VS, Dvorak HF (1983) Tumor cells secrete a vascular permeability factor that promotes accumulation of ascites fluid. Science 219:983–985. [DOI] [PubMed] [Google Scholar]
- 39. Shweiki D, Itin A, Soffer D, Keshet E (1992) Vascular endothelial growth factor induced by hypoxia may mediate hypoxia‐initiated angiogenesis. Nature 359:843–845. [DOI] [PubMed] [Google Scholar]
- 40. Tutunculer F, Eskiocak S, Basaran UN, Ekuklu G, Ayvaz S, Vatansever U (2005) The protective role of melatonin in experimental hypoxic brain damage. Pediatr Int 47:434–439. [DOI] [PubMed] [Google Scholar]
- 41. Wei G, Dawson VL, Zweier JL (1999) Role of neuronal and endothelial nitric oxide synthase in nitric oxide generation in the brain following cerebral ischemia. Biochim Biophys Acta 1455:23–34. [DOI] [PubMed] [Google Scholar]
- 42. Yancopoulos GD, Davis S, Gale NW, Rudge JS, Wiegand SJ, Holash J (2000) Vascular‐specific growth factors and blood vessel formation. Nature 407:242–248. [DOI] [PubMed] [Google Scholar]
- 43. Young PP, Fantz CR, Sands MS (2004) VEGF disrupts the neonatal blood brain barrier and increases life span after non‐ablative BMT in a murine model of congenital neurodegeneration caused by a lysosomal enzyme deficiency. Exp Neurol 188:104–114. [DOI] [PubMed] [Google Scholar]


