Abstract
Array‐based comparative genomic hybridization was used to characterize 22 medulloblastomas in order to precisely define genetic alterations in these malignant childhood brain tumors. The 17p‐/17q+ copy number abnormality (CNA), consistent with the formation of isochromosome 17q, was the most common event (8/22). Amplifications in this series included MYCL, MYCN and MYC previously implicated in medulloblastoma pathogenesis, as well as novel amplicons on chromosomes 2, 4, 11 and 12. Losses involving chromosomes 1, 2, 8, 10, 11, 16 and 19 and gains of chromosomes 4, 7, 8, 9 and 18 were seen in greater than 20% of tumors in this series. A homozygous deletion in 11p15 defines the minimal region of loss on this chromosome arm. In order to map the minimal regions involved in losses, gains and amplifications, we combined aCGH data from this series with that of two others obtained using the same RPCI BAC arrays. As a result of this combined analysis of 72 samples, we have defined specific regions on chromosomes 1, 8p, 10q, 11p and 16q which are frequently involved in CNAs in medulloblastomas. Using high density oligonucleotide expression arrays, candidate genes were identified within these consistently involved regions in a subset of the tumors.
INTRODUCTION
Pediatric tumors tend to show a relatively different spectrum of genetic alterations compared with adult tumors, which may reflect their origin from less‐committed cell types. Medulloblastoma is the most common malignant intracranial tumor in children (35) and is thought to arise from cerebellar stem and precursor cells, including immature granule cells (40). Despite a generally good prognosis with current treatment options the mortality rate still exceeds 30%. Extensive genetic characterization of medulloblastomas has occurred over the past decades using loss of heterozygosity (LOH) studies (13, 17, 18, 55) as well as traditional cytogenetic analyses (5, 42). These studies have revealed consistent genetic events such as chromosome 17p loss, although they have not generally led to the identification of critical genes in tumor development.
Comparative genomic hybridization (CGH) has been one of the main approaches for the identification of loss, gain and amplification of chromosome regions in cancer cells (19), with the advantage that the analysis can be performed using relatively small amounts of DNA and without a need for tumor chromosomes. This approach has been extended to microarray platforms (37, 38), which provide increased resolution for the definition of small cytogenetic events and the positions of the breakpoints involved in abnormalities. Several groups have used this technology for the analysis of medulloblastomas (2, 4, 9, 27, 28, 32), although the rare nature of this tumor type often precludes analysis of large sample sizes in any single series. In addition, as different platforms are often used, it is generally not possible to make specific direct comparisons between individual data sets to define minimal regions that are commonly involved, other than at the cytogenetic band level which has a resolution of only 10–20 Megabase pairs (Mbp).
We have previously used a custom array of bacterial artificial chromosomes (BAC) in two independent studies of medulloblastoma (25, 46), each designed to answer different questions from relatively small cohorts of patients. In these studies the number of tumors analyzed was too small to draw any conclusions about relative frequencies of copy number abnormality (CNA) in this tumor type. We have now extended these studies further in a third cohort of tumors and describe the results from this study. With this current data set we have now performed analysis of 72 different tumors using the same platform, and a compiled analysis of these data provide not only an assessment of the frequency of the involvement of different chromosome arms in CNAs but can also be used to define the minimal consistent regions of losses, gain and amplifications associated with these genetic changes. In the current series of 22 tumors, it was also possible to perform expression profiling of selected samples for which RNA was available to improve our understanding of the relationship between CNAs and the expression of genes located within the affected regions.
MATERIALS AND METHODS
RPCI custom CGH array.
The construction of the Roswell Park Cancer Institute (RPCI) custom CGH arrays using RPCI‐11 BACs, has been described previously (7, 8, 44). Briefly, the array contains ∼6000 RPCI‐11 BAC clones that provide an average resolution across the genome of 420 kilobases. BACs were printed in triplicate on amino‐silanated glass slides (Schott Nexterion, type A) using a MicroGrid ll TAS arrayer (Apogent Discoveries, Hudson, NH). Genomic pooled normal control DNA and tumor DNA were fluorescently labeled by random priming, and hybridized as described previously (8). Hybridizations of normal and tumor DNA were performed as sex‐mismatches to provide an internal hybridization control for chromosome X and Y copy number differences. The hybridized slides were scanned using an Axon 4200a scanner to generate 10 µm resolution images for both Cy3 and Cy5 channels, and image analysis was performed using ImaGene (version 4.1) software (BioDiscovery, Inc, El Segundo, CA). Mapping information was added for each BAC using the NCBI May 2004 build (http://genome.ucsc.edu/cgi‐bin/hgGateway?org=human) and, to the best of our knowledge, clones with ambiguous assignments in the databases were removed. Throughout the text, “amplification” refers to cases where there is a greater than two copy gain as determined on the aCGH profile, involving any particular region. In contrast, “gains” and “losses” refer to events resulting in a single or double copy change of regions along the chromosomes.
Statistical analysis.
For each reference point on the array, background corrections were performed for both test and control channels. The log2 ratios of the background corrected test/control were normalized using a loess correction. For each BAC, a median of the log2 ratios of all its replicates was computed and BACs with less than two successful replicates were excluded. The corrected log2 ratio for each BAC was then used to segment the array using circular binary segmentation using DNAcopy software (34). For each segment, the median absolute deviations (MAD) of the corrected log2 ratios were computed (45). Segments with a corrected log2 ratio greater than 1× the median of the MAD (MMAD) were considered gained, and segments with a corrected log2 ratio less than −1 × MMAD were considered lost. In addition, all single BACs within a segment whose corrected log2 ratios exceed 2× the interquartile range of the segment are marked as outliers. Outliers with corrected log2 ratio exceeding 2× the global interquartile range are outlined as gains or losses accordingly. All BACs were assigned a call of gained (1), lost (−1) or normal (0) based on the call of the segment they are in, and the karyotypes of the tumors generated accordingly. Regional amplifications are defined by an increase in the log2 ratio above the levels of a single copy gain, whereas homozygous deletions are defined as a decrease in the log2 ratio below the levels of a single copy loss.
Nucleic acid extraction and gene expression analysis.
Medulloblastoma specimens were obtained from the Johns Hopkins University Department of Pathology with institutional review board approval. All diagnoses were confirmed by a neuropathologist (CGE) and the degree and extent of anaplasia in each specimen was graded as previously described (11). Tumors were snap‐frozen at the time of surgery, and RNA and DNA were subsequently extracted using Trizol reagent. RNA and DNA were further purified using RNeasy and DNeasy columns according to the manufacturer’s instructions (Qiagen). RNA quality was assessed using the Agilent Bioanalyzer Lab on Chip. Using 5–40 µg of total RNA, double stranded cDNA was synthesized using the Superscript Choice System. A T‐7 (dT24) primer was used to prime the first strand cDNA synthesis. An in vitro transcription reaction, which amplifies and biotinylates the samples, was then performed using a BioArray® IVT kit and the template was labeled by incorporation of biotinylated‐11‐CTP and 16‐UTP ribonucleotides (ENZO Diagnostics, Farmingdale, NY). At each stage of this process the quality of the samples was monitored using both gel electrophoresis and spectrophotometry. The full length cRNAs were then fragmented to 20–200 bp. The intensities of hybridization were also compared with each other as well as to genes which have been spiked into the samples at known concentrations. Once the probes passed this quality control they were hybridized to the U133A chips that are arrayed with sequence specific oligonucleotides representing 22 000 probe sets.
Data analysis.
Affymetrix U133A data were imported as CEL files into R using the “Affy” scripting library. Normalization between the arrays is performed using an adaptation of Robust Multi‐Chip Average (RMA) (15), with specific correction for G‐C biases, known as GC‐RMA (54). GC‐RMA uses only the perfect match (PM) intensity values and ignores the mismatch (MM) intensities which have been shown to introduce variation (30, 58) as many MM probes show higher signal intensities than the corresponding PM probe. Intensity contributed from MM probes, therefore, cannot simply report background hybridization. For this reason, Naef et al (30) suggested that MM values should not be used, as mathematical subtraction between PM probe intensity and MM probe intensity does not translate to biological subtraction. In addition, Irizarry et al (16) suggested that until a better solution is proposed, simply ignoring these values is preferable as RMA demonstrates higher precision in reducing within‐replicate variance, provides more consistent estimates of fold changes, and demonstrates higher sensitivity and specificity when compared with Affymetrix MAS 5.0 or dChip using spike in data sets (16). The normalized PM values are then log transformed and all the probes in a set representing specific genes are summarized using Tukey’s median polishing procedure. Changes in gene expression were graphed using the signal log values for individual genes within specific genomic intervals. All functional annotation and chromosomal locations were obtained using NetAffx (24).
RESULTS
Using the custom RPCI BAC array (7), we analyzed DNA extracted from 22 snap‐frozen medulloblastoma specimens to establish their aCGH profiles. The clinical details from the patients are shown in Table 1. Gains, losses and amplifications were seen throughout the karyotypes of these tumors and the specific details of the CNA are given in Table 2. The strategy for defining the breakpoints associated with these CNAs have been described elsewhere (46), where the maximal extent of the abnormality is reported. The most frequent CNA event in this series of medulloblastomas was a loss of most of 17p, which was usually associated with a coincident 17q gain, which has been frequently described in these tumors (2, 5, 10, 32, 47, 50, 57). In the current series this event was observed in 36% of the tumors, with the gain of a whole copy of chromosome 17 occurring in one additional tumor (J1006). Gains involving all and parts of chromosomes were seen throughout the karyotypes (Table 2), and chromosomes 7 (8/22), 8 (5/22), 9 (6/22) and 18 (5/22) were involved in >20% of cases. Although there were individual subregional gains along most of these chromosomes in different tumors (Table 2), no consistent region of increased copy number was identified. Chromosome losses, on the other hand, revealed more precise delineation of consistently involved regions. On chromosome 1, regions within the short arm were lost in four tumors, where the minimal region of overlap was identified as Chr1:pter‐8902538 in tumor J1016. Chromosome 8 showed losses in 7/22 tumors but involved both the long and short arms. Loss involving chromosome 10 was also a common event (7/22), where the common region of overlap was defined by tumor J1020 involving region Chr10:133471230‐qter. Chromosome 11 showed losses in 8/22 tumors, with a minimal overlapping region derived from four different tumors, involving pter‐47989032 (seen in J1115), and a single region on the long arm (J1016) involving Chr11:65980427‐qter. Loss of chromosome 16 (9/22) involved the whole chromosome in three tumors, and, from the others, a minimal region of loss was defined by tumor J1024 involving region Chr16:53324475‐qter. Chromosome 19 showed losses in 5/22 tumors with a minimal region of loss defined by tumor J1008 involving Chr19:50275933‐60725260.
Table 1.
Summary of clinical details for medulloblastoma patients in the current J‐series of tumors described in this manuscript. Abbreviations: C = Caucasian; B = black; O = oriental. D = Dead of disease; A = Alive; U = unkonown status. Mod = diffuse moderate anaplasia; S = diffuse severe anaplasia; FM = focal moderate anaplasia; F = female; M = male.
| Tumor | DX age (years) | Sex | Race | Follow‐up (months) | Status | Tumor type |
|---|---|---|---|---|---|---|
| J1001 | 4 | M | C | 11.5 | D | Anaplastic medulloblastoma FM |
| J1002 | 12 | F | B | 117 | A | Classic medulloblastoma |
| J1004 | 5 | M | B | 7 | D | Anaplastic medulloblastoma Mod |
| J1005 | 9 | F | B | 123 | A | Anaplastic medulloblastoma FM |
| J1006 | 6 | M | C | 111 | A | Anaplastic medulloblastoma FM |
| J1007 | 24 | M | C | 113 | A | Classic medulloblastoma |
| J1008 | 9 | M | C | 10 | D | Anaplastic medulloblastoma S |
| J1010 | 15 | F | C | 63 | A | Nodular medulloblastoma |
| J1012 | 2 | F | C | 62 | A | Anaplastic medulloblastoma FM |
| J1014 | 5 | F | C | 35 | A | Anaplastic medulloblastoma FM |
| J1016 | 9 | F | O | 48 | A | Anaplastic medulloblastoma FM |
| J1019 | 26 | M | B | 25 | A | Nodular medulloblastoma |
| J1020 | 6 | M | C | 10 | D | Anaplastic medulloblastoma S |
| J1021 | 16 | F | B | 47 | A | Anaplastic medulloblastoma FM |
| J1022 | 8 | M | C | 98 | A | Anaplastic medulloblastoma Mod |
| J1023 | 11 | M | O | 27 | D | Anaplastic medulloblastoma S |
| J1024 | 19 | M | C | 37 | A | Anaplastic medulloblastoma Mod |
| J1025 | 13 | M | B | 37 | A | Classic medulloblastoma |
| J1026 | 10 | M | C | 40 | A | Classic medulloblastoma |
| J1067 | 4 | F | C | U | U | Classic medulloblastoma |
| J1115 | 13 | F | C | 84 | A | Medulloblastoma unknown type |
| J319 | 13 | F | C | 84 | A | Classic medulloblastoma |
Table 2.
Summary of aCGH defined losses gains and amplifications seen in the J‐series of medulloblastomas. Tumors which were used for the gene expression analysis are shown in bold in the left column. *Represents high amplitude single BAC events.******No detectable CNA.
| Sample ID | Small segments | Whole Chr | Amplification | Homozygous deletion | ||
|---|---|---|---|---|---|---|
| Gains | Losses | Gains | Losses | |||
| J1001 | Chr1:107834401‐qter, Chr10:39194926‐42197692 | Chr1:pter‐109185984 | Chr8, Chr13 | Chr2, Chr4, Chr10, Chr11, Chr15, Chr16, Chr21 | ****** | ****** |
| J1002 | ****** | ****** | Chr7, Chr8, Chr9, Chr19 | ****** | Chr4:131221437‐133802360* | ****** |
| J1004 | Chr1:120244511‐qter, Chr12:pter‐34591844 | Chr16:46266316‐qter | Chr8 | ****** | ****** | ****** |
| J1005 | Chr4:752619‐12411625, Chr9:pter‐68203104 | Chr5:16968719‐17806053, Chr9:67566555‐qter, Chr15:90029599‐96519678 | Chr2 | ****** | ****** | ****** |
| J1006 | ****** | Chr8:pter‐28762956, Chr8:61769195‐102107868 | Chr7, Chr17 | ****** | ****** | ****** |
| J1007 | Chr7:pter‐78192971 | Chr8:109441448‐123818629, Chr14:36467869‐43823109 | Chr19 | ****** | ****** | ****** |
| J1008 | Chr1:pter‐50462496, Chr3:136692885‐152413314, Chr9:100327175‐120005880, Chr13:40876134‐46118238, ChrX:43382420‐50860186 | Chr2:193194019‐qter, Chr4:73511981‐qter, Chr6:56381084‐qter, Chr11:pter‐48644474, Chr17:pter‐11132723, Chr18:15367893‐qter, Chr19:50275933‐60725260, ChrX:4032843‐44358192, ChrX:49063091‐154186476 | Chr7, Chr9, Chr19 | ****** | Chr2:9029875‐16529264, Chr2:115093327‐146734712, Chr2:191120018‐195293720, Chr11:67942137‐70756232, Chr11:97534216‐101562543, Chr12:pter‐18599946, Chr12:22210386‐36142961, Chr12:33534861‐42459838, Chr12:53208104‐60917552, Chr12:75456697‐81285086, Chr12:88253032‐89158341, Chr17:9904704‐19626362 | ****** |
| J1010 | Chr17:15223450‐qter | ****** | Chr7 | ****** | ****** | ****** |
| J1012 | ****** | Chr8:7328299‐8837121 | Chr3 | Chr10 | ****** | ****** |
| J1014 | Chr17:21191548‐qter | Chr1:pter‐48215170, Chr17:pter‐22127985 | Chr5, Chr6, Chr9, Chr18, Chr22 | Chr8, Chr10 | ****** | ****** |
| J1016 | Chr2:pter‐16529264, Chr3:59779777‐65182251, Chr10:pter‐30639661, Chr11:pter‐66379947, Chr13:98923852‐103089594, Chr17:15362704‐qter, Chr18:16773951‐qter | Chr1:pter‐8902538, Chr4:48839424‐120282908, Chr8:pter‐39846706, Chr10:30613638‐qter, Chr11:65980427‐qter, Chr12:33076084‐119020229, Chr16:46266316‐qter, Chr17:pter‐15511681, Chr18:pter‐16840697 | Chr7, Chr12 | ****** | ****** | ****** |
| J1019 | ****** | ****** | ****** | ****** | ****** | ****** |
| J1020 | Chr1:148810010‐qter, Chr17:19800213‐78206787 | Chr4:170218065‐qter, Chr8:126626507‐128612329, Chr10:133471230‐qter, Chr17:pter‐19744530, Chr19:pter‐10248852 | Chr18, Chr21 | Chr3, Chr13 | Chr8:127751581‐129784458 | ****** |
| J1021 | Chr9:pter‐68203104, Chr16:31443695‐34476094, Chr21:15043867‐18244635 | Chr1:221304577‐224587821, Chr2:163059060‐183645799, Chr3:pter‐94987544, Chr9:67566555‐qter, Chr11:pter‐48644474 | ****** | Chr19 | Chr1:39046537‐40431821, Chr11:56507045‐58480720 | Chr11:10692195‐13338428 |
| J1022 | Chr6:pter‐61963054, Chr12:97700309‐qter, Chr17:17349840‐qter, Chr20:35152344‐qter, Chr22:14466338‐26007486 | Chr2:40597715‐qter, Chr3:89771786‐qter, Chr5:127176867‐145274925, Chr16:46266316‐qter, Chr17:pter‐16616643, Chr18:73111607‐qter, Chr22:25865941‐qter | Chr4, Chr5, Chr7, Chr13 | Chr9, Chr11 | ****** | ****** |
| J1023 | Chr17:18318880‐qter | Chr17:pter‐19626362 | Chr4 | ****** | Chr2:15242057‐19899402, Chr19:62624158‐qter* | ****** |
| J1024 | Chr17:17349840‐qter | Chr16:53324475‐qter, Chr17:pter‐16616643 | Chr5, Chr7, Chr18 | Chr8, Chr10, Chr20 | Chr2:15242057‐16529264 | ****** |
| J1025 | ****** | ****** | Chr11 | ****** | ****** | Chr4:186788298‐186991592 |
| J1026 | Chr17:15362704‐qter | Chr17:pter‐15511681 | ****** | ****** | ****** | ****** |
| J1067 | Chr21:9954111‐29260484 | Chr3:104771763‐qter, Chr6:pter‐44649064, Chr19:42180358‐qter | Chr4, Chr8, Chr14 | Chr2, Chr5, Chr10, Chr11, Chr16 | ****** | ****** |
| J1115 | Chr2:pter‐24531246, Chr2:32910747‐54121420, Chr6:111424176‐qter, Chr8:pter9‐8837121, Chr15:43812588‐qter, Chr17:17349840‐qter, Chr18:3822165‐11582119, Chr21:9954111‐17336775 | Chr1:pter‐33790776, Chr4:pter‐4538586, Chr5:173821419‐qter, Chr7:pter‐7114750, Chr7:55381999‐76132954, Chr7:96323599‐102435956, Chr9:125854825‐qter, Chr11:pter‐47989032, Chr16:266993‐qter, Chr17:pter‐8338030 | ****** | Chr16, Chr19, Chr20 | ****** | ****** |
| J319 | Chr6:109463437‐qter, Chr15:41935933‐qter, Chr17:17349840‐qter | Chr11:pter‐47277667, Chr16:50943879‐qter | ****** | ****** | ****** | ****** |
Amplification and deletion events in medulloblastoma.
Amplifications were seen in six tumors and involved multiple different chromosomes (Figure 1). A single tumor (J1020) showed amplification on 8q (Chr8:127751581‐129784458) encompassing the MYC gene. Amplification on chromosome 2 was seen in three tumors, where two involved the MYCN locus. In tumor J1023 this amplicon (Table 2) spanned 4.5 Mbp, whereas in tumor J1024 the amplicon was largely confined to a 1.3‐Mbp region including the MYCN locus, as well as the DDX1 and NAG genes. In tumor J1008, there were several amplification events along the length of the chromosome (Figure 1D), including a 2p amplicon that spanned the NAG‐DDX1‐MYCN interval but which was considerably larger than in the other two tumors. Tumor J1008 also showed extensive amplification events along the remainder of chromosome 2q (Chr2:115093327‐146734712 and Chr2:191120018‐195293720) (Figure 1D) with amplicons that were ∼30 Mbp and ∼5 Mbp, respectively (Table 2). Interestingly, tumor J1008 also showed extensive amplification events involving chromosomes 11 and 12 (Figure 1C,E). On chromosome 11, the amplicon was located in the proximal 11q13.2 region (Chr11:67942137‐70756232) (Figure 1C) and the more distal amplicon was in 11q22 (Chr11:97534216‐101562543). Tumor J1021 also showed amplification on chromosome 11, but this amplicon did not overlap with those seen in J1008 and included the CTNND1 member of the catenin family. The chromosome 12 amplicons seen in J1008 involved large numbers of genes. The only other two amplification events occurred in tumors J1002 and J1021 and involved chromosomes 4 and 1, respectively. There were apparently no genes involved in the chromosome 4 amplicon and the chromosome 1 amplicon included the MYCL member of the MYC family. At the time these data were generated, there had been no reports of MYCL amplification in medulloblastomas, but recently McCabe et al (27) also described a single tumor with an amplicon spanning the MYCL locus.
Figure 1.
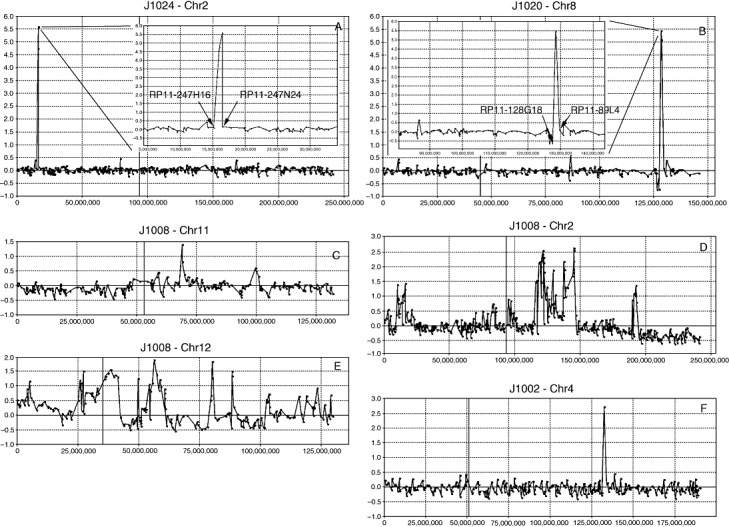
Amplification events seen in the J‐series of medulloblastomas. In tumor J1024 (A) and J1020 (B) well defined (arrows) amplification events are seen on chromosomes 2 (MYCN) and 8 (MYC), respectively. These events are defined by the flanking BACs not involved in the amplicon (insert). Smaller amplicons are seen on 11q in J1008 (C). Much more extensive amplification is seen on 2p involving the MYCN locus (D) in J1008 as well as at two distinct locations on 2q. This more distal amplicon is seen on a background of a single copy loss of distal 2q. More extensive amplification events are seen throughout chromosome 12 in J1008 (E). The single‐BAC amplicon on chromosome 4 (F) in J1002 apparently does not contain annotated genes.
Gene expression changes associated with CNAs.
From the series of 22 tumors described in Table 2 using aCGH, gene expression data derived from the Affymetrix U133A arrays was available from five (Table 2). Despite the limited number of specimens with both gene dosage and RNA expression data available, we were able to investigate potential drivers for some of the consistent CNAs seen in this series. In this analysis we used the convention described by Lo et al (25), where, in the absence of a suitable normal control for these studies, gene expression levels in tumors showing a specific CNA, were compared with the remainder of the tumors in the series for which expression data were available and where that CNA was not present. In this way we are defining consistent gene expression changes related to loss, gain or amplification of a region of the genome which takes into account the inherent variability in gene expression levels between tumors. In all of the descriptions of genetic events given below, the full gene content of the regions, as defined by their nucleotide positions can be obtained by entering the maximal extent of the CNAs as defined in Table 2 into the UCSC genome browser (http://genome.ucsc.edu/cgi‐bin/hgGateway).
The amplicon on 2p seen in J1023, for example, showed up‐regulation of MYCN as expected (Figure 2), as well as a series of other more proximally located genes. Many of the increases in gene expression levels are consistent with our previous observations (25) although, interestingly, the DDX1 gene in this case did not show a significant change compared with the mean of the expression level for the other five tumors which did not show this 2p amplicon.
Figure 2.
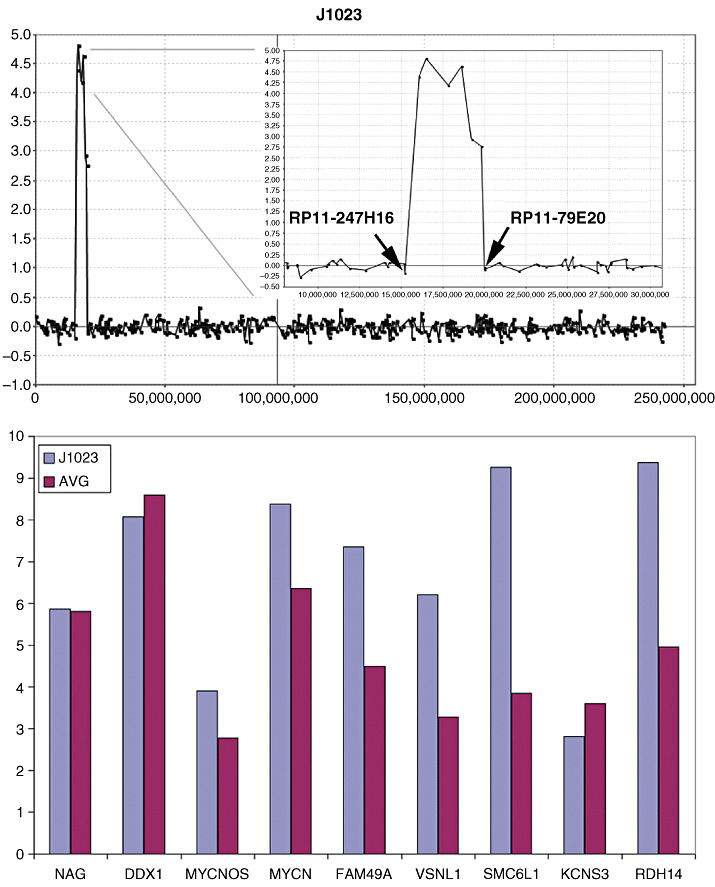
Amplification in 2p23 in tumor J1023. A 4.5 Mbp region shows an approximately 30‐fold increase (Log2 scale) in DNA content in this tumor (top). which demonstrates relatively equal level amplification across the region (inset, top) defined by the end points of the flanking uninvolved BACs. Gene expression analysis from the U133A arrays identifies genes at the proximal end of the amplicon which have increases in expression levels compared with tumors which do not show amplification in this region.
The 11q12 amplicon (Chr11:56507045‐ 58480720) in J1021 showed two groups of over‐expressed genes, which is consistent with the structure of this amplicon (Figure 3), where a proximal region involved over‐expression of the SSRP1 and SLC43A3 genes and a slightly more distal amplicon coincided with over‐expression of genes in the TIMM10‐CTNND1 interval. The SLC43A1 gene, however, which is located between the two amplicons, did not show over‐expression, again indicating that the amplicon involves two distinctive regions (Figure 3). Amplification was also seen in J1021 on 1p (Chr1:39046537‐40431821) which involved only a single BAC (Figure 4). CNAs involving single BACs are traditionally not reported without verification but, in this case, we were able to analyze gene expression changes for this region in this tumor (Figure 4), where genes which lie in the central part of the amplicon, in the HPCAL4‐MYCL1 interval, show over‐expression.
Figure 3.
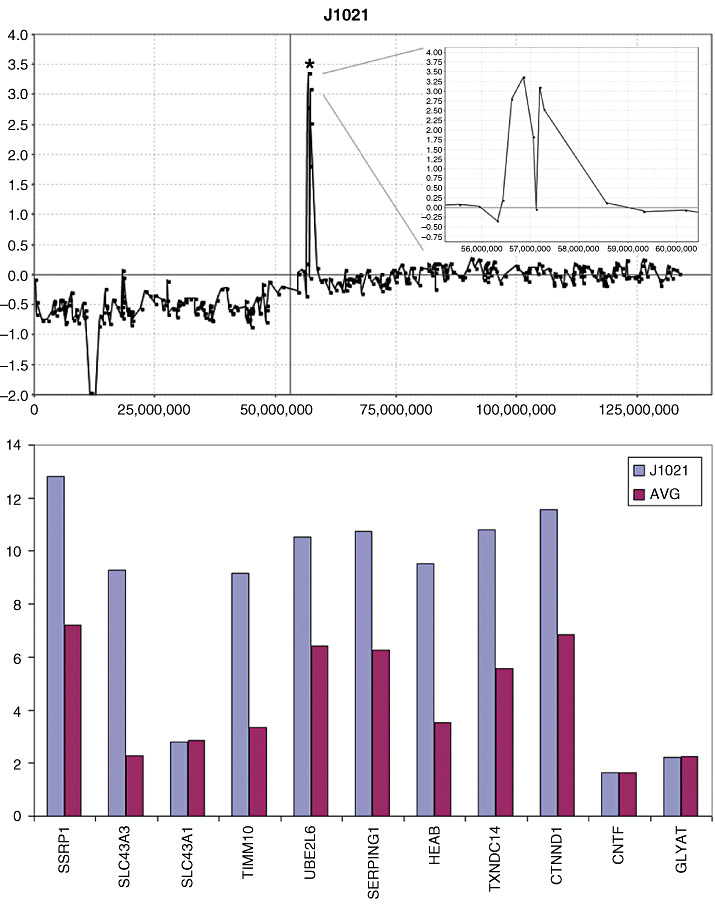
Amplification in the proximal centromeric region (*) of 11q (top) in tumor J1021 shows an amplicon structure (inset, top) which demonstrates an internal region with approximately normal DNA content levels. When the gene expression levels within this region are defined, increases are seen in the proximal region with the exception of SCL43A1 which lies within the region of the amplicon‐containing region showing minimal amplification.
Figure 4.
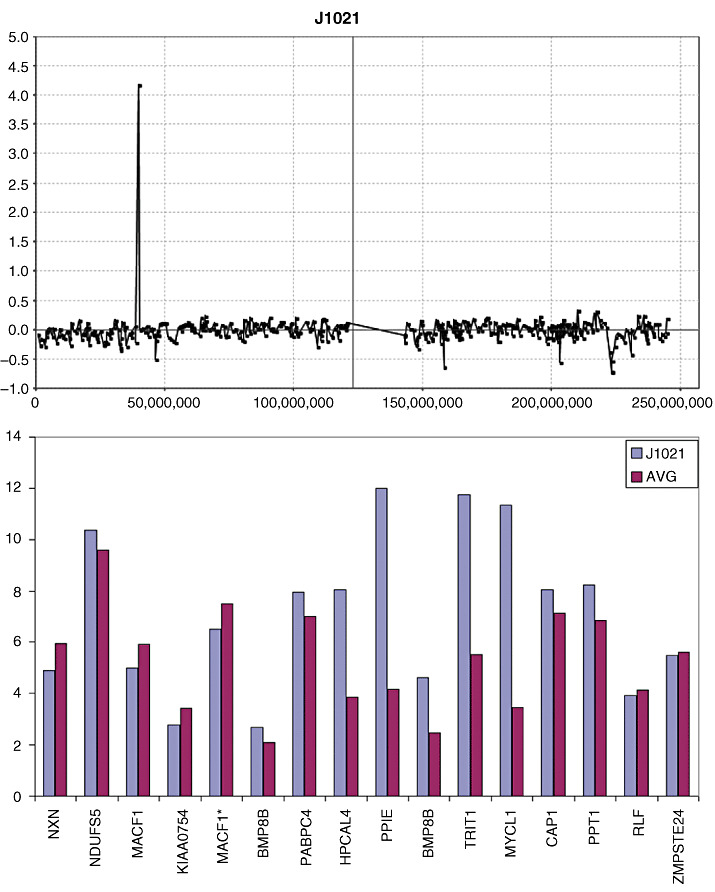
Amplification in 1p34 is seen in tumor J1021 involves only a single bacterial artificial chromosome. Gene expression analysis shows that only the genes within the central part of the amplified region (HPCAL4‐MYCL1) show concordant increases in gene expression levels.
The specific over‐expression of individual genes within the amplicons shown in 2, 3, 4 suggest that these events provide a selective advantage for the cancer cells. To show this specificity further, we compared expression profiles for genes in the regions immediately adjacent with the amplicons which showed normal copy number. In all cases, there was no significant difference between the expression of these genes in the amplicon‐containing tumors compared with the tumors in the series showing no amplification (data not shown).
Losses of chromosome material were also analyzed using the RPCI Overlay Tool which defines concordance between up‐regulation of expression and copy number gains as well as down‐regulation of expression and copy number losses (25). In tumor J1021, for example, a hemizygous loss of the short arm of chromosome 11 is seen, in addition to what appears to be an apparently homozygous deletion in 11p15 (Chr11:10692195‐13338428). This region carries only eight genes which are present on the U133A array (Figure 5). Of these, only USP47, DKK3 and MICAL2, which lie in the central region of the deletion, showed a greater than twofold down‐regulation compared with other tumors in the series with no CNA involving 11p (Figure 5B). In addition, for both USP47 and DKK3, the MAS5.0 detection calls transitioned from present (P) to absent (A), which suggests that the expression levels for these two genes are not detected with confidence on the gene expression array in J1021. Interestingly, despite 613 known genes being located on the short arm of chromosome 11, and of the 245 genes that were present on the U133A array, only 24 showed a > twofold down‐regulation in this tumor (Figure 5C). The genes most affected in the homozygous deletion clustered within the center of the deleted region supporting our previous contention that the BAC arrays overestimate the size of CNAs, especially where the maximal extent is reported.
Figure 5.
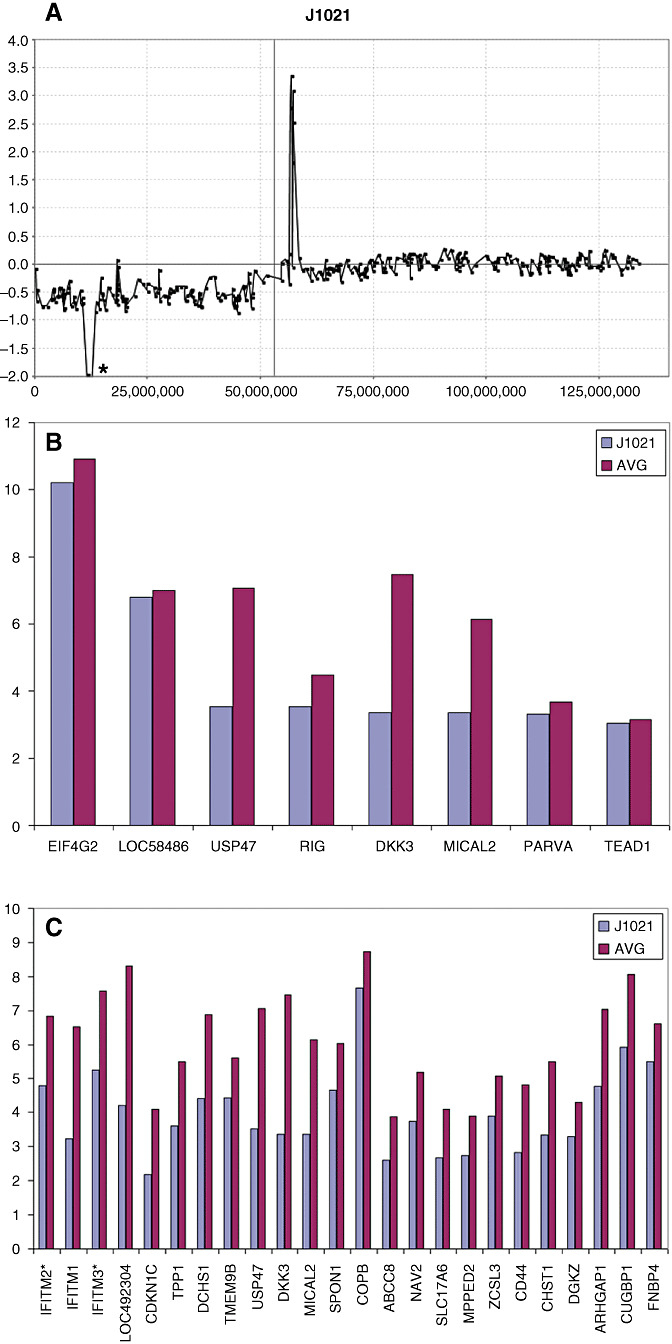
aCGH profile of chromosome 11 from tumor J1021 demonstrating a single copy loss of the entire short arm and homozygous deletion in the 11p15 region (*). Expression analysis of genes in this region shows a significantly reduced level for only four genes (USP47‐MICAL1) located in the center of the deleted region.
The long arm of chromosome 16 frequently shows hemizygous loss in medulloblastomas (9, 36), and our overlay analysis using data from tumor J1022, demonstrates that a > twofold decrease in expression levels was only seen for a subset of 18 genes along the length of this chromosome arm (Figure 6). Similarly, expression data were available for two tumors (J1022 and J1023) that carried the 17p loss/17q gain profile seen frequently in medulloblastomas. A comparison with the other three tumors that did not carry this CNA, revealed only a subset of genes that exhibited altered expression levels concordant with DNA copy number dosage (Figure 7). Again, the overlay comparison between CNA and expression data identified 26 genes from 17p which were down‐regulated in the two tumors with 17p loss, compared with the mean expression values seen in the tumors which had normal copies of 17p (Figure 7). In the same way, 61 genes on 17q (Figure 8) showed consistently increased expression changes, defining a subset of the genes within the region of chromosome 17 showing this CNA.
Figure 6.
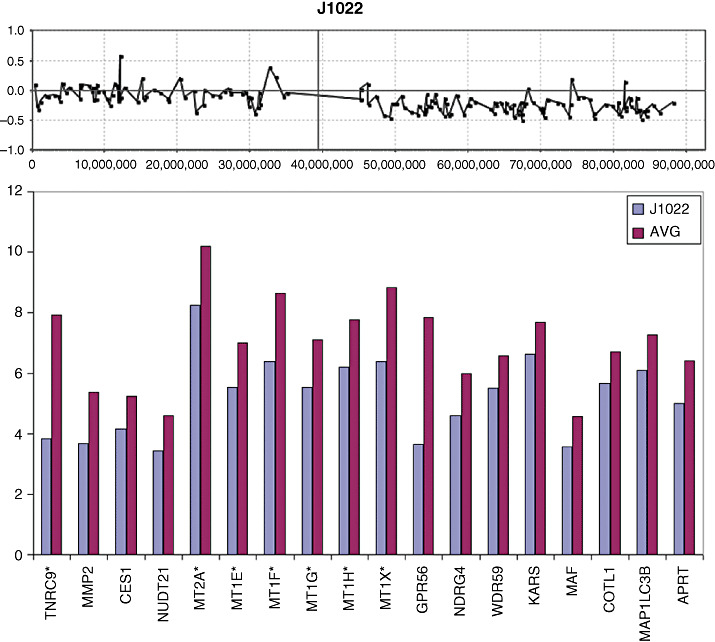
Deletion of the long arm of chromosome 16 is seen in the aCGH profile for tumor J1022. Gene expression analysis of all genes along the length of 16q present on the U133plus2 array shown that only a subset of genes (below) show >twofold reduction in gene expression levels.
Figure 7.
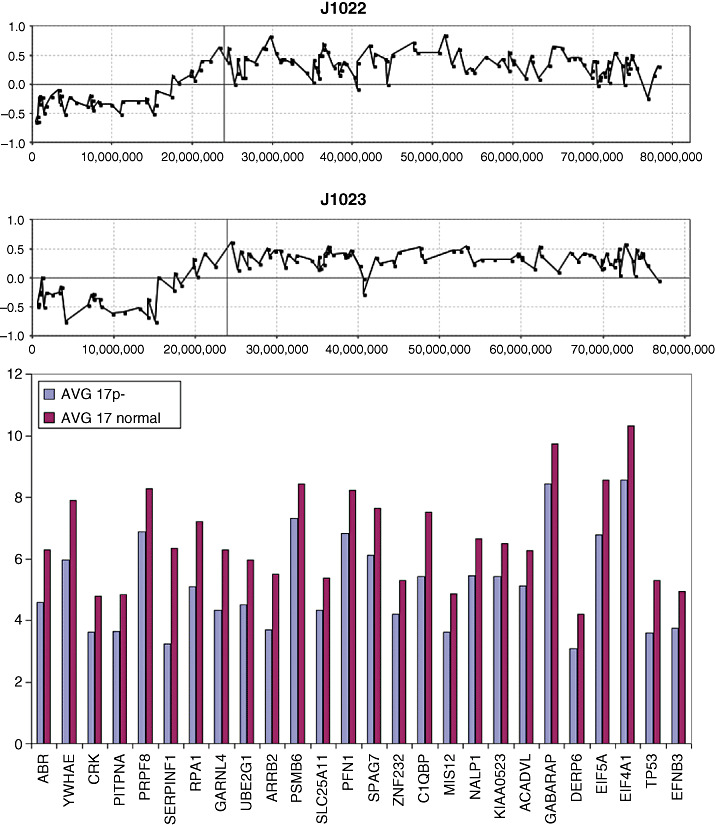
A typical aCGH profile for chromosome 17 showing loss of 17p and gain of 17q from tumors J1022 and J1023. When gene expression levels for all of the genes in the commonly deleted region in 17p are compared with tumors which show diploid 17p levels, only the subset of genes shown below have a significantly reduced (> twofold) expression level. * Represents probesets that have _x_ at designation which may cross hybridize in an unpredictable manner.
Figure 8.
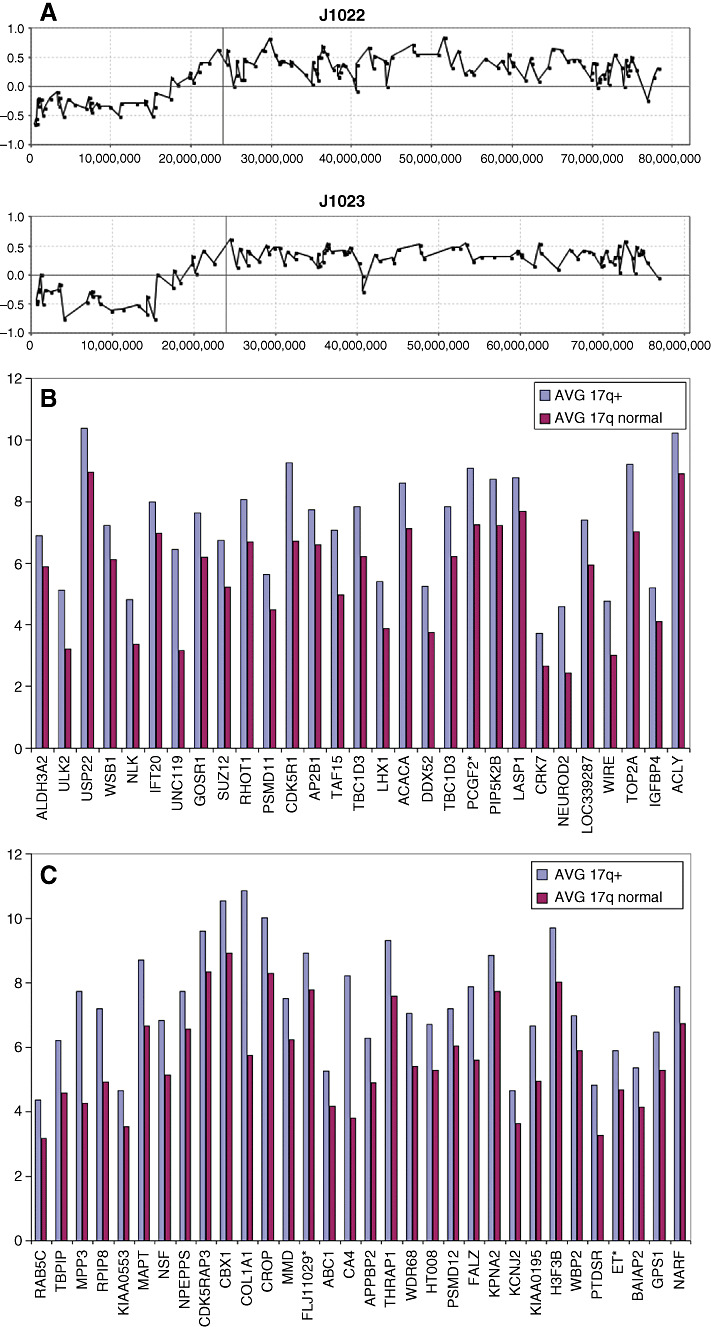
The genes which show concordant up‐regulation within the common region of 17q gain in tumors J1022 and J1023 are shown relative to expression levels where chromosome 17 appears normal in the aCGH profile. * Represents Affymetrix Probe Set ID with suffix ‘_x_at’ which are known to cross hybridize in an unpredictable manner.
Extended analysis of CNAs in medulloblastoma.
Because of the rare nature of medulloblastoma, an extensive genetic analysis of these tumors is difficult for any single center, as accumulating sufficiently large numbers of samples for statistical evaluations can be difficult. In addition, as the technologies used in single center studies and the bioinformatics surrounding their analysis often varies considerably, direct cross‐comparison between different data sets is suboptimal. This complication is particularly true for array‐based analyses, as sample processing and the type of array used can contribute significantly to the variance between individual studies. Even when BAC arrays alone are used, the fact that the array densities, as well as the specific clones used in the arrays, can vary widely between groups, means that it may be difficult to directly compare the data for high‐resolution analysis. Low‐resolution arrays, for example, still report CGH data using the traditional banding location on the chromosomes to define the breakpoints (36). For this reason, it is desirable to be able to analyze samples obtained using the same technologies and the same arrays. Over the past few years we have characterized two other cohorts of medulloblastoma using the same RPCI 6K BAC array (25, 46). When combined with the current series, 72 tumors are available for combined analysis of CNAs within this tumor type (Figure 9). In an attempt to define specific regions of the genome that are involved in losses, gains and amplifications in medulloblastoma more accurately, we have compiled the results from these various studies and the details are discussed below.
Figure 9.
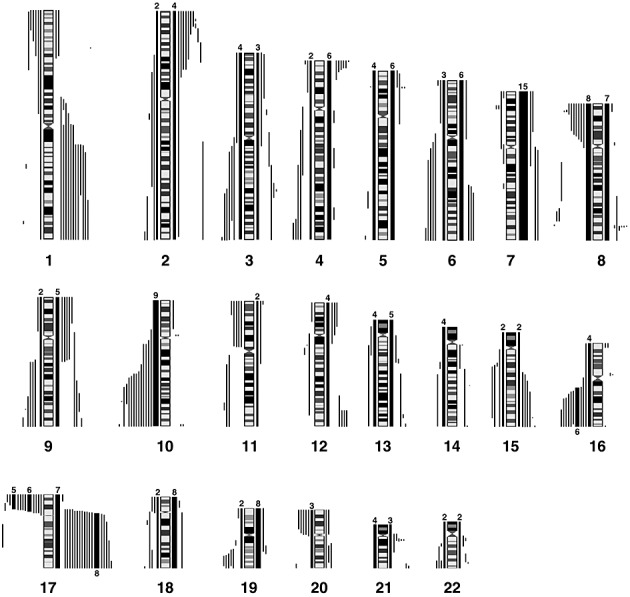
Summary of the losses and gains seen in an extended series of medulloblastomas analyzed by aCGH using the RPCI 6K platform. Each bar, drawn to scale, represents the extent of the losses (shown on the left of the ideograms) and the gains (shown on the right of the ideograms). Whole chromosome changes are included where the width of the bar represents the frequency of the event with the actual number of tumors showing this particular event shown above the bar. High Levels amplifications are described separately in Table 2.
Consistent CNAs in medullobastomas.
Although losses and gains of whole chromosome 1 were not observed in this series of 72 tumors, those which show CNAs involving this chromosome fall into two distinct subgroups; those involving a common region of loss in distal 1p36 and those showing gains involving the majority of 1q. Similarly, losses involving chromosome 6 identified two distinct regions on the short and long arms and deletions of 8p23, as well as distinct deletion of subregions on the long arm were identified. Deletions involving the CDKN2A (p16) locus were not frequent where, in fact, gains of chromosome 9 were more common.
One abnormality that is frequently seen in adult and pediatric brain tumors involves losses of chromosome 10, where we are able to define two distinct subregions showing minimal overlap (although in each case defined by only a single tumor). One of these involved the 10q23 region containing the PTEN gene and the other involved the distal most tip of 10q (Figure 9). Similar conclusions were described by Yin et al (55) from a highly focused analysis of these two regions using microsatellite markers. Unfortunately, because none of the six tumors in our series for which U133A expression data were available involved chromosome 10 CNAs, we were unable to define gene expression changes that were associated with this abnormality.
A novel observation in the current series of 22 MDs was the homozygous deletion in 11p15 (Chr11:56507045‐58480720) in J1021 (Figure 6). Losses involving any part of 11p were seen in 11% of the combined series (8/72), but in all cases included the homozygous deletion region in J1021. Losses involving chromosome 16q were also frequently seen in our extended series. Using composite data from all three cohorts, the minimal region of overlap was further refined to Chr16:69781966‐84771896. While this region still contained many genes, only four (WDR59, KARS, COTL1, and MAF) that were present on the U133A array showed a > twofold down‐regulation in the presence of this specific CNA.
In the 72 tumors in this series, 24 showed the 17p/17q abnormality. Our aCGH analysis of the breakpoints giving rise to this chromosome abnormality did not identify a consistent region, suggesting that the position of the breakpoint associated with this CNA may not be the important event. Instead, our data suggest that either 17p loss or 17q gain, by independently altering gene expression changes, are more important. In the combined cohort, whole chromosome gains of 17 were observed in 7/72 tumors. In addition, regional gains on 17q were observed in 3/72 tumors without the accompanying loss in 17p (Figure 10), suggesting that the critical event lies in the gain of 17q, with the possible minimal region of overlap involving Chr17:44947329‐qter.
Figure 10.
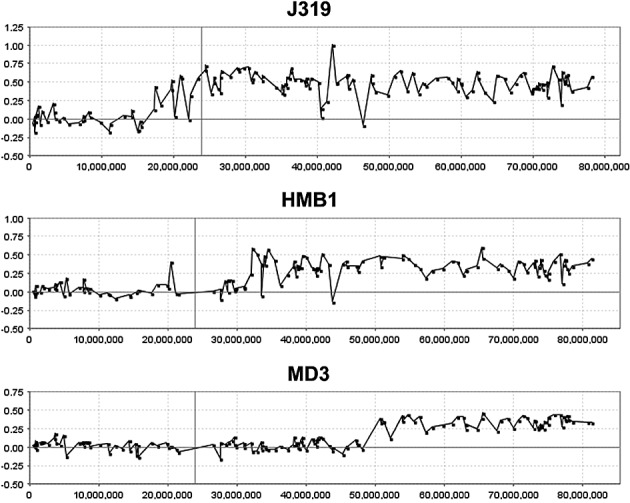
aCGH profiles of chromosome 17 from three medullobastoma tumors, J319 (this study), HMB1 (46) and MD3 (25), exhibiting only regional gains on 17q without losses involving 17p. The minimal region of overlap is defined by tumor MD3.
DISCUSSION
Chromosome abnormalities in medulloblastomas have been characterized over the years using a variety of different techniques, where the consensus finding has been that cytogenetic changes involving loss of chromosomes 8p, 10q, 11p, 16q and 17p and gains involving chromosome 7 and 17q are frequent events (2, 9, 10, 32, 36, 47, 50, 57). Despite the development of higher‐resolution approaches to study the copy number changes in these tumors, the cytogenetic landscape has not changed significantly, although the resolution with which the breakpoints giving rise to the CNAs are defined has improved considerably with the transition to a micro‐array platform (26, 46, 51, 53). The significant advantage provided by aCGH, is that by defining cytogenetic events at high resolution, and correlating these with high density gene expression studies from the same tumor, it has become possible to associate copy number changes with specific, or at least reduced numbers of, genes that show concordant changes (25). This analysis provides an unbiased approach that suggests candidate genes for the drivers of the CNAs rather than focusing on genes already demonstrated to be cancer related based on broad genome location alone. This combined approach, however, requires that the studies are coordinated to generate both sets of information, and this has not always been possible over the years for logistical reasons. In one of our previous studies, for example (46), our analysis of medulloblastoma focused only on CNAs, as outcomes data and RNA were historically not available from these samples for correlative studies. In another series of medulloblastomas analyzed using the same RPCI BAC array platform (25), we were able to perform association studies between CNAs and gene expression levels, but only using data previously obtained from an early release of the expression array platform. Nonetheless, although this analysis provided a clear correlation between high‐resolution CNAs and gene expression, only ∼29% of the known human genes were available to the study. In the present series we have been able to correlate high‐resolution CNAs with a higher density gene expression array, although for only relatively few of the tumor samples in the series. This genome‐wide correlation has been facilitated by the development of software which has made the overlay of these data sets possible (25). Although we do not have both data sets for each tumor in this series, it was nonetheless possible to investigate expression changes that occurred in specific regions that are frequently associated with medulloblastoma.
Although different approaches have been used to study CNAs in medulloblastomas, it is still possible to relate disparate sets of data provided the base‐pair location along the length of the chromosome has been defined. Loss of the short arm of chromosome 11, for example, was identified in 10%–20% of medulloblastomas using chromosome‐based analyses (12, 23, 48, 55). When analyzed using approaches that can detect allelic loss in the absence of CNAs, LOH is reportedly as high as 50% (55). Our compiled analysis of the 72 tumors analyzed on the RPCI aCGH platform revealed that the pter‐14699404 region is the commonly deleted region. Within this region only 13 genes were demonstrated to show down‐regulation in one tumor in this series compared with those that did not. A novel feature in the current series of medulloblastomas was the homozygous deletion in 11p15 in J1021. Losses of the short arm of chromosome 11 are reported in our overall analysis as only 8/72 (11%) but in all cases span the region of deletion in J1021. Using the expression levels from this tumor, only three genes in the deletion showed significant down‐regulation. The expectation is that all genes in this region would not be expressed, although the presence of contaminating normal cells in the tumor sample will inevitably tend to provide background expression levels. The genes most affected clustered within the deleted region supporting our previous contention that the BAC arrays overestimate the size of CNAs, especially where the maximal extent is reported. The expression studies, therefore, implicate DKK3, MICAL2 and USP47 which showed the largest down‐regulation. While little is currently known about the association between MICAL2 and USP47, and tumorigenesis, DKK3, a dickkopf homolog, is apparently down‐regulated in a variety of cancer and cancer cell lines such as prostate (1, 20), melanoma (21), hepatoma (14), acute lymphoblastic leukemia (ALL) (43), human renal clear cell carcinoma (22), and non‐small cell lung carcinomas (33, 52). Re‐expression of DKK3 in cancer cell lines promoted cell–cell adhesion and inhibited cell migration, supporting a putative tumor suppressor function for this gene in vivo (21). Furthermore, the DKK family of proteins appears to be inhibitors of the WNT signaling pathways, which have been implicated in medulloblastoma development during early embryogenesis through transcription of genes responsible for proliferation and migration (14).
Similarly, CNAs involving chromosome 8 are relatively frequent in aCGH studies of medulloblastomas and are of potential clinical importance with the suggestion that these losses may be related to clinical outcome (9). In our extended series, 15/72 tumors showed CNAs involving chromosome 8, where deletions in 8p23 identified a minimal region of overlap (MRO) of Chr8:pter‐11733927. Yin et al (56) described LOH involving 8p in >70% of medulloblastomas using microsatellite markers which identify LOH even where there is no loss of genetic material. This analysis suggested a common region of overlap in the Chr8:10499770‐11971658 interval defined by a single event, although a more constant region seen in many tumors extended the region to Chr8:6637322‐15794316, which encompasses the minimal region defined in our series. From similar studies, McCabe et al (27) reported that the consistently lost interval on 8p involved Chr8:5326020‐23286627. Thus, even though different platforms have been used to define these regions of loss, the fact that they all overlap reinforces the idea that the common region defined by the three studies involves Chr8:5326020‐1733927, which also encompasses the region reportedly showing homozygous deletion in a single tumor described by Yin et al (56).
Losses involving parts of chromosome 10 are also frequently seen in medulloblastomas (6, 48). In the present series we defined two distinct subregions showing different MROs, one involving the 10q23 region containing PTEN (55), and the other involving the distal most tip of 10q (29). Unfortunately, because of the lack of expression data from tumors showing this CNA, we were unable to identify candidate genes based on expression analysis of this specific event, although mutations in PTEN have only been described rarely (39). In one study (41), 10q25 represented the critical region, which is consistent with our analysis.
Frequent regional losses in the distal part of long arm on chromosome 16 have been described in medulloblastomas (9, 41, 55) and were also a frequent event in our series. Overlay analysis revealed only WDR59, KARS, COTL1 and MAF are concordantly down‐regulated. Interestingly the GPR56 gene, which lies slightly outside the MRO, was the most significantly down‐regulated in the novel series of 22 samples described here. In our extended series, the MRO involved the Chr16: 69781966‐qter region, which encompasses the Chr16:80586655‐86551673 region defined using microsatellite markers in a different cohort of tumors (55). Of the genes showing down‐regulation on distal 16q in J1022, only COTL1 and MAP1LC3B are implicated from these two independent studies. Although little is known about the function of these genes in relation to tumorigenesis, COTL1 was reported to be a tumor antigen that elicits both humoral and cellular immunity (31). It is conceivable that antigen shedding represent an evasive mechanism during the metastasis process.
The iso‐17q chromosomal abnormality in medulloblastoma has been known for many years, and cytogenetic studies suggest that this event results in loss of 17p and gain of 17q, which is largely supported by the aCGH data, which further demonstrates that there are apparently no other cryptic consequences of this event. The question that is raised from these observations is whether 17p loss or 17q gain (or both) are the critical events or whether the breakpoint itself is important in disrupting gene regulation. This observation is also of potential clinical relevance as it has been suggested that this event is a negative prognostic marker for medulloblastoma (3, 36, 48), although other reports fail to confirm this (9, 18). Furthermore, as iso‐17q can represent the sole aCGH‐defined abnormality within specific tumors (25, 46), this abnormality appears to be fundamental, at least for the development of some medulloblastomas. Specific studies using flourescence in‐situ hybridization (FISH) and polymerase chain reaction have suggested that the breakpoint in 17p that gives rise to this CNA are located in adjacent but different regions (27), reducing the possibility that specific genes are consistently disrupted. aCGH data described for our extended series and those of others (27, 49) have confirmed this observation and define 3–4 different breakpoint sites. The question that now arises, therefore, is whether 17p loss or 17q gain is important. Based on the data we present here, no case of whole chromosome loss was observed but whole chromosome gains of 17 were observed in seven tumors. In three other tumors, regional gains of 17q were present that were not accompanied by the loss of 17p. No specific loss of 17p alone was observed. These observations suggest that the important event may be dosage consequences result from a gain of 17q during tumorigenesis. With this in mind, we were able to screen genes in the Chr17:17349840‐qter region for consistent gene expression levels in two tumors displaying the most consistent 17p loss/17q gain compared with four tumors which were apparently normal for chromosome 17. Even though this is a small series, a streamlined set of genes was identified using our overlay analysis, which included 61 genes which were up‐regulated as a result of a gain in 17q. If the minimal Chr17:44947319‐qter region defined in Figure 10 constitutes the smallest region of gain, then this observation reduces the gene count to 22 within the COL1A1‐NARF interval on 17q.
ACKNOWLEDGEMENTS
We would like to thank Lisa Wylie for careful preparation of the manuscript. We are grateful to the members of the Roswell Park Cancer Institute Microarray Core for their help in generating the aCGH profiles. This work was supported in part by an award from the Thrasher Research Foundation and the National Cancer Institute CA 104504 and the Roswell Park Cancer Center Support Grant, CA 16056.
REFERENCES
- 1. Abarzua F, Sakaguchi M, Takaishi M, Nasu Y, Kurose K, Ebara S, Miyazaki M, Namba M, Kumon H, Huh NH (2005) Adenovirus‐mediated overexpression of REIC/Dkk‐3 selectively induces apoptosis in human prostate cancer cells through activation of c‐Jun‐NH2‐kinase. Cancer Res 65:9617–9622. [DOI] [PubMed] [Google Scholar]
- 2. Avet‐Loiseau H, Venuat AM, Terrier‐Lacombe MJ, Lellouch‐Tubiana A, Zerah M, Vassal G (1999) Comparative genomic hybridization detects many recurrent imbalances in central nervous system primitive neuroectodermal tumors in children. Br J Cancer 79:1843–1847. [DOI] [PMC free article] [PubMed] [Google Scholar]
- 3. Batra SK, McLendon RE, Koo JS, Castelino‐Prabhu S, Fuchs HE, Krischer JP, Friedman HS, Bigner DD, Bigner SH (1995) Prognostic implications of chromosome 17p deletions in human medulloblastomas. J Neurooncol 24:39–45. [DOI] [PubMed] [Google Scholar]
- 4. Bayani J, Zielenska M, Marrano P, Kwan Ng Y, Taylor MD, Jay V, Rutka JT, Squire JA (2000) Molecular cytogenetic analysis of medulloblastomas and supratentorial primitive neuroectodermal tumors by using conventional banding, comparative genomic hybridization, and spectral karyotyping. J Neurosurg 93:437–448. [DOI] [PubMed] [Google Scholar]
- 5. Bigner SH, Mark J, Friedman HS, Biegel JA, Bigner DD (1988) Structural chromosomal abnormalities in human medulloblastoma. Cancer Genet Cytogenet 30:91–101. [DOI] [PubMed] [Google Scholar]
- 6. Blaeker H, Rasheed BK, McLendon RE, Friedman HS, Batra SK, Fuchs HE, Bigner SH (1996) Microsatellite analysis of childhood brain tumors. Genes Chromosomes Cancer 15:54–63. [DOI] [PubMed] [Google Scholar]
- 7. Cowell JK, Nowak NJ (2003) High‐resolution analysis of genetic events in cancer cells using bacterial artificial chromosome arrays and comparative genome hybridization. Adv Cancer Res 90:91–125. [DOI] [PubMed] [Google Scholar]
- 8. Cowell JK, Wang YD, Head K, Conroy J, McQuaid D, Nowak NJ (2004) Identification and characterisation of constitutional chromosome abnormalities using arrays of bacterial artificial chromosomes. Br J Cancer 90:860–865. [DOI] [PMC free article] [PubMed] [Google Scholar]
- 9. De Bortoli M, Castellino RC, Lu XY, Deyo J, Sturla LM, Adesina AM, Perlaky L, Pomeroy SL, Lau CC, Man TK, Rao PH, Kim JY (2006) Medulloblastoma outcome is adversely associated with overexpression of EEF1D, RPL30, and RPS20 on the long arm of chromosome 8. BMC Cancer 6:223. [DOI] [PMC free article] [PubMed] [Google Scholar]
- 10. Eberhart CG, Kratz JE, Schuster A, Goldthwaite P, Cohen KJ, Perlman EJ, Burger PC (2002) Comparative genomic hybridization detects an increased number of chromosomal alterations in large cell/anaplastic medulloblastomas. Brain Pathol 12:36–44. [DOI] [PMC free article] [PubMed] [Google Scholar]
- 11. Eberhart CG, Kepner JL, Goldthwaite PT, Kun LE, Duffner PK, Friedman HS, Strother DR, Burger PC (2002) Histopathologic grading of medulloblastomas: a Pediatric Oncology Group study. Cancer 94:552–560. [DOI] [PubMed] [Google Scholar]
- 12. Fults D, Petronio J, Noblett BD, Pedone CA (1992) Chromosome 11p15 deletions in human malignant astrocytomas and primitive neuroectodermal tumors. Genomics 14:799–801. [DOI] [PubMed] [Google Scholar]
- 13. Goussia AC, Bruner JM, Kyritsis AP, Agnantis NJ, Fuller GN (2000) Cytogenetic and molecular genetic abnormalities in primitive neuroectodermal tumors of the central nervous system. Anticancer Res 20:65–73. [PubMed] [Google Scholar]
- 14. Hsieh SY, Hsieh PS, Chiu CT, Chen WY (2004) Dickkopf‐3/REIC functions as a suppressor gene of tumor growth. Oncogene 23:9183–9189. [DOI] [PubMed] [Google Scholar]
- 15. Irizarry RA, Hobbs B, Collin F, Beazer‐Barclay YD, Antonellis KJ, Scherf U, Speed TP (2003) Exploration, normalization, and summaries of high density oligonucleotide array probe level data. Biostatistics 4:249–264. [DOI] [PubMed] [Google Scholar]
- 16. Irizarry RA, Bolstad BM, Collin F, Cope LM, Hobbs B, Speed TP (2003) Summaries of Affymetrix GeneChip probe level data. Nucleic Acids Res 31:e15. [DOI] [PMC free article] [PubMed] [Google Scholar]
- 17. Johnson DR, Levanat S, Bale AE (1995) Direct molecular analysis of archival tumor tissue for loss of heterozygosity. Biotechniques 19:190–192. [PubMed] [Google Scholar]
- 18. Jung HL, Wang KC, Kim SK, Sung KW, Koo HH, Shin HY, Ahn HS, Shin HJ, Cho BK (2004) Loss of heterozygosity analysis of chromosome 17p13.1‐13.3 and its correlation with clinical outcome in medulloblastomas. J Neurooncol 67:41–46. [DOI] [PubMed] [Google Scholar]
- 19. Kallioniemi A, Kallioniemi OP, Sudar D, Rutovitz D, Gray JW, Waldman F, Pinkel D (1992) Comparative genomic hybridization for molecular cytogenetic analysis of solid tumors. Science 258:818–821. [DOI] [PubMed] [Google Scholar]
- 20. Kawano Y, Kitaoka M, Hamada Y, Walker MM, Waxman J, Kypta RM (2006) Regulation of prostate cell growth and morphogenesis by Dickkopf‐3. Oncogene 25:6528–6537. [DOI] [PubMed] [Google Scholar]
- 21. Kuphal S, Lodermeyer S, Bataille F, Schuierer M, Hoang BH, Bosserhoff AK (2006) Expression of Dickkopf genes is strongly reduced in malignant melanoma. Oncogene 25:5027–5036. [DOI] [PubMed] [Google Scholar]
- 22. Kurose K, Sakaguchi M, Nasu Y, Ebara S, Kaku H, Kariyama R, Arao Y, Miyazaki M, Tsushima T, Namba M, Kumon H, Huh NH (2004) Decreased expression of REIC/Dkk‐3 in human renal clear cell carcinoma. J Urol 171:1314–1318. [DOI] [PubMed] [Google Scholar]
- 23. Lescop S, Lellouch‐Tubiana A, Vassal G, Besnard‐Guerin C (1999) Molecular genetic studies of chromosome 11 and chromosome 22q DNA sequences in pediatric medulloblastomas. J Neurooncol 44:119–127. [DOI] [PubMed] [Google Scholar]
- 24. Liu G, Loraine AE, Shigeta R, Cline M, Cheng J, Valmeekam V, Sun S, Kulp D, Siani‐Rose MA (2003) NetAffx: affymetrix probesets and annotations. Nucleic Acids Res 31:82–86. [DOI] [PMC free article] [PubMed] [Google Scholar]
- 25. Lo KC, Rossi MR, Burkhardt T, Pomeroy SL, Cowell JK (2007) Overlay analysis of the oligonucleotide array gene expression profiles and copy number abnormalities as determined by array comparative genomic hybridization in medulloblastomas. Genes Chromosomes Cancer 46:53–66. [DOI] [PubMed] [Google Scholar]
- 26. Mantripragada KK, Thuresson AC, Piotrowski A, Diaz de Stahl T, Menzel U, Grigelionis G, Ferner RE, Griffiths S, Bolund L, Mautner V, Nordling M, Legius E, Vetrie D, Dahl N, Messiaen L, Upadhyaya M, Bruder CE, Dumanski JP (2006) Identification of novel deletion breakpoints bordered by segmental duplications in the NF1 locus using high resolution array‐CGH. J Med Genet 43:28–38. [DOI] [PMC free article] [PubMed] [Google Scholar]
- 27. McCabe MG, Ichimura K, Liu L, Plant K, Backlund LM, Pearson DM, Collins VP (2006) High‐resolution array‐based comparative genomic hybridization of medulloblastomas and supratentorial primitive neuroectodermal tumors. J Neuropathol Exp Neurol 65:549–561. [DOI] [PMC free article] [PubMed] [Google Scholar]
- 28. Mendrzyk F, Radlwimmer B, Joos S, Kokocinski F, Benner A, Stange DE, Neben K, Fiegler H, Carter NP, Reifenberger G, Korshunov A, Lichter P (2005) Genomic and protein expression profiling identifies CDK6 as novel independent prognostic marker in medulloblastoma. J Clin Oncol 23:8853–8862. [DOI] [PubMed] [Google Scholar]
- 29. Mollenhauer J, Wiemann S, Scheurlen W, Korn B, Hayashi Y, Wilgenbus KK, Von Deimling A, Poustka A (1997) DMBT1, a new member of the SRCR superfamily, on chromosome 10q25.3‐26.1 is deleted in malignant brain tumors. Nat Genet 17:32–39. [DOI] [PubMed] [Google Scholar]
- 30. Naef F, Lim DA, Patil N, Magnasco M (2002) DNA hybridization to mismatched templates: a chip study. Phys Rev E Stat Nonlin Soft Matter Phys 65:040902. [DOI] [PubMed] [Google Scholar]
- 31. Nakatsura T, Senju S, Ito M, Nishimura Y, Itoh K (2002) Cellular and humoral immune responses to a human pancreatic cancer antigen, coactosin‐like protein, originally defined by the SEREX method. Eur J Immunol 32:826–836. [DOI] [PubMed] [Google Scholar]
- 32. Nicholson J, Wickramasinghe C, Ross F, Crolla J, Ellison D (2000) Imbalances of chromosome 17 in medulloblastomas determined by comparative genomic hybridisation and fluorescence in situ hybridisation. Mol Pathol 53:313–319. [DOI] [PMC free article] [PubMed] [Google Scholar]
- 33. Nozaki I, Tsuji T, Iijima O, Ohmura Y, Andou A, Miyazaki M, Shimizu N, Namba M (2001) Reduced expression of REIC/Dkk‐3 gene in non‐small cell lung cancer. Int J Oncol 19:117–121. [DOI] [PubMed] [Google Scholar]
- 34. Olshen AB, Venkatraman ES, Lucito R, Wigler M (2004) Circular binary segmentation for the analysis of array‐based DNA copy number data. Biostatistics 5:557–572. [DOI] [PubMed] [Google Scholar]
- 35. Packer RJ (1990) Chemotherapy for medulloblastoma/primitive neuroectodermal tumors of the posterior fossa. Ann Neurol 28:823–828. [DOI] [PubMed] [Google Scholar]
- 36. Pan E, Pellarin M, Holmes E, Smirnov I, Misra A, Eberhart CG, Burger PC, Biegel JA, Feuerstein BG (2005) Isochromosome 17q is a negative prognostic factor in poor‐risk childhood medulloblastoma patients. Clin Cancer Res 11:4733–4740. [DOI] [PubMed] [Google Scholar]
- 37. Pinkel D, Albertson DG (2005) Array comparative genomic hybridization and its applications in cancer. Nat Genet 37(Suppl.):S11–S17. [DOI] [PubMed] [Google Scholar]
- 38. Pinkel D, Segraves R, Sudar D, Clark S, Poole I, Kowbel D, Collins C, Kuo WL, Chen C, Zhai Y, Dairkee SH, Ljung BM, Gray JW, Albertson DG (1998) High resolution analysis of DNA copy number variation using comparative genomic hybridization to microarrays. Nat Genet 20:207–211. [DOI] [PubMed] [Google Scholar]
- 39. Rasheed BK, Stenzel TT, McLendon RE, Parsons R, Friedman AH, Friedman HS, Bigner DD, Bigner SH (1997) PTEN gene mutations are seen in high‐grade but not in low‐grade gliomas. Cancer Res 57:4187–4190. [PubMed] [Google Scholar]
- 40. Read TA, Hegedus B, Wechsler‐Reya R, Gutmann DH (2006) The neurobiology of neurooncology. Ann Neurol 60:3–11. [DOI] [PubMed] [Google Scholar]
- 41. Reardon DA, Michalkiewicz E, Boyett JM, Sublett JE, Entrekin RE, Ragsdale ST, Valentine MB, Behm FG, Li H, Heideman RL, Kun LE, Shapiro DN, Look AT (1997) Extensive genomic abnormalities in childhood medulloblastoma by comparative genomic hybridization. Cancer Res 57:4042–4047. [PubMed] [Google Scholar]
- 42. Roberts P, Chumas PD, Picton S, Bridges L, Livingstone JH, Sheridan E (2001) A review of the cytogenetics of 58 pediatric brain tumors. Cancer Genet Cytogenet 131:1–12. [DOI] [PubMed] [Google Scholar]
- 43. Roman‐Gomez J, Jimenez‐Velasco A, Agirre X, Castillejo JA, Navarro G, Barrios M, Andreu EJ, Prosper F, Heiniger A, Torres A (2004) Transcriptional silencing of the Dickkopfs‐3 (Dkk‐3) gene by CpG hypermethylation in acute lymphoblastic leukemia. Br J Cancer 91:707–713. [DOI] [PMC free article] [PubMed] [Google Scholar]
- 44. Rossi MR, La Duca J, Matsui S, Nowak NJ, Hawthorn L, Cowell JK (2005) Novel amplicons on the short arm of chromosome 7 identified using high resolution array CGH contain over expressed genes in addition to EGFR in glioblastoma multiforme. Genes Chromosomes Cancer 44:392–404. [DOI] [PubMed] [Google Scholar]
- 45. Rossi MR, Gaile D, Laduca J, Matsui S, Conroy J, McQuaid D, Chervinsky D, Eddy R, Chen HS, Barnett GH, Nowak NJ, Cowell JK (2005) Identification of consistent novel submegabase deletions in low‐grade oligodendrogliomas using array‐based comparative genomic hybridization. Genes Chromosomes Cancer 44:85–96. [DOI] [PubMed] [Google Scholar]
- 46. Rossi MR, Conroy J, McQuaid D, Nowak NJ, Rutka JT, Cowell JK (2006) Array CGH analysis of pediatric medulloblastomas. Genes Chromosomes Cancer 45:290–303. [DOI] [PubMed] [Google Scholar]
- 47. Russo C, Pellarin M, Tingby O, Bollen AW, Lamborn KR, Mohapatra G, Collins VP, Feuerstein BG (1999) Comparative genomic hybridization in patients with supratentorial and infratentorial primitive neuroectodermal tumors. Cancer 86:331–339. [DOI] [PubMed] [Google Scholar]
- 48. Scheurlen WG, Schwabe GC, Joos S, Mollenhauer J, Sorensen N, Kuhl J (1998) Molecular analysis of childhood primitive neuroectodermal tumors defines markers associated with poor outcome. J Clin Oncol 16:2478–2485. [DOI] [PubMed] [Google Scholar]
- 49. Scheurlen WG, Schwabe GC, Seranski P, Joos S, Harbott J, Metzke S, Dohner H, Poustka A, Wilgenbus K, Haas OA (1999) Mapping of the breakpoints on the short arm of chromosome 17 in neoplasms with an i(17q). Genes Chromosomes Cancer 25:230–240. [DOI] [PubMed] [Google Scholar]
- 50. Schutz BR, Scheurlen W, Krauss J, Du Manoir S, Joos S, Bentz M, Lichter P (1996) Mapping of chromosomal gains and losses in primitive neuroectodermal tumors by comparative genomic hybridization. Genes Chromosomes Cancer 16:196–203. [DOI] [PubMed] [Google Scholar]
- 51. Selzer RR, Richmond TA, Pofahl NJ, Green RD, Eis PS, Nair P, Brothman AR, Stallings RL (2005) Analysis of chromosome breakpoints in neuroblastoma at sub‐kilobase resolution using fine‐tiling oligonucleotide array CGH. Genes Chromosomes Cancer 44:305–319. [DOI] [PubMed] [Google Scholar]
- 52. Tsuji T, Nozaki I, Miyazaki M, Sakaguchi M, Pu H, Hamazaki Y, Iijima O, Namba M (2001) Antiproliferative activity of REIC/Dkk‐3 and its significant down‐regulation in non‐small‐cell lung carcinomas. Biochem Biophys Res Commun 289:257–263. [DOI] [PubMed] [Google Scholar]
- 53. Weiss MM, Snijders AM, Kuipers EJ, Ylstra B, Pinkel D, Meuwissen SG, Van Diest PJ, Albertson DG, Meijer GA (2003) Determination of amplicon boundaries at 20q13.2 in tissue samples of human gastric adenocarcinomas by high‐resolution microarray comparative genomic hybridization. J Pathol 200:320–326. [DOI] [PubMed] [Google Scholar]
- 54. Wu Z, Irizarry RA, Gentleman R, Martinez‐Murillo F, Spencer F (2004) A model‐based background adjustment for oligonucleotide expression arrays. J Am Stat Assoc 99:909–917. [Google Scholar]
- 55. Yin XL, Pang JC, Liu YH, Chong EY, Cheng Y, Poon WS, Ng HK (2001) Analysis of loss of heterozygosity on chromosomes 10q, 11, and 16 in medulloblastomas. J Neurosurg 94:799–805. [DOI] [PubMed] [Google Scholar]
- 56. Yin XL, Pang JC, Ng HK (2002) Identification of a region of homozygous deletion on 8p22‐23.1 in medulloblastoma. Oncogene 21:1461–1468. [DOI] [PubMed] [Google Scholar]
- 57. Zakrzewska M, Rieske P, Debiec‐Rychter M, Zakrzewski K, Polis L, Fiks T, Liberski PP (2004) Molecular abnormalities in pediatric embryonal brain tumors—analysis of loss of heterozygosity on chromosomes 1, 5, 9, 10, 11, 16, 17 and 22. Clin Neuropathol 23:209–217. [PubMed] [Google Scholar]
- 58. Zhou Y, Abagyan R (2002) Match‐only integral distribution (MOID) algorithm for high‐density oligonucleotide array analysis. BMC Bioinformatics 3:3. [DOI] [PMC free article] [PubMed] [Google Scholar]


