

Abstract
Gangliogliomas are generally benign neuroepithelial tumors composed of dysplastic neuronal and neoplastic glial elements. We screened 61 gangliogliomas [World Health Organization (WHO) grade I] for genomic alterations by chromosomal and array‐based comparative genomic hybridization (CGH). Aberrations were detected in 66% of gangliogliomas (mean ± SEM = 2.5 ± 0.5 alterations/tumor). Frequent gains were on chromosomes 7 (21%), 5 (16%), 8 (13%), 12 (12%); frequent losses on 22q (16%), 9 (10%), 10 (8%). Recurrent partial imbalances comprised the minimal overlapping regions dim(10)(q25) and enh(12)(q13.3–q14.1). Unsupervised cluster analysis of genomic profiles detected two major subgroups (group I: complete gain of 7 and additional gains of 5, 8 or 12; group II: no major recurring imbalances, mainly losses). A comparison with low‐grade gliomas (astrocytomas WHO grade II) showed chromosome 5 gain to be significantly more frequent in gangliogliomas. Interphase fluorescence in situ hybridization (FISH) identified the aberrations to be contained in a subpopulation of glial but not in neuronal cells. Two gangliogliomas and their anaplastic recurrences (WHO grade III) were analyzed. Losses of CDKN2A/B and DMBT1 or a gain/amplification of CDK4 found in the anaplastic tumors were already present in the respective gangliogliomas by array CGH and interphase FISH. In summary, genomic profiling in a large series of gangliogliomas could distinguish genetic subgroups even in this low‐grade tumor.
Keywords: array‐based CGH, comparative genomic hybridization, DNA microarray, gangliogliomas, tumor genetics
INTRODUCTION
Gangliogliomas are slowly growing, well‐differentiated neuroepithelial tumors, which may occur throughout the central nervous system, but mostly involve the temporal lobe (27). They are generally benign and usually correspond to grade I according to the classification of the World Health Organization (WHO). Very rarely, gangliogliomas with anaplastic features are found and considered to be WHO grade III. Morphologically, these tumors consist of two cellular components of dysplastic neuronal and neoplastic glial elements. Accordingly, immunostains have demonstrated both neuronal features such as expression of synaptophysin and glial components by staining for glial fibrillary acidic protein in gangliogliomas 6, 7. In addition, approximately 75% of tumors were found to exhibit immunoreactivity for the stem cell epitope CD34 (8). Clinically, gangliogliomas are the most common tumors associated with chronic temporal lobe epilepsy 6, 7.
Very little is known about the molecular pathogenesis of gangliogliomas. Few gangliogliomas have been analyzed cytogenetically indicating involvement of chromosome 7 in numerical or structural aberrations as the only alteration detected in more than two cases 18, 19, 23, 30, 40. Gain on chromosome 7 was also found recurrently by chromosomal comparative genomic hybridization (CGH) analysis of less than 10 cases performed to date 31, 38, 46. Certain genes with relevance in other brain tumor entities (eg, TP53, EGFR, PTEN) were not shown to play a substantial role in the pathogenesis of gangliogliomas 11, 39. There was also no evidence for mutations in genes of the reelin pathway (eg, CDK5, DCX, CDK5R1, DAB1), a major signal transduction cascade in neuronal development and cellular migration, in these tumors 4, 22. However, gangliogliomas did show lower mRNA expression of these genes compared with normal central nervous system tissue controls 4, 22. A number of sequence polymorphisms in the TSC2 gene, a member of the PI3K signaling pathway, were found to be significantly more frequent in gangliogliomas than in constitutional DNA from normal individuals, suggesting a role for these sequence alterations in the molecular pathogenesis of these tumors (3).
To date, no particular genetic alteration has emerged from these studies to be consistently and typically associated with gangliogliomas. Thus, it was the aim of our study to do a genome‐wide screen for genomic aberrations in a large series of 61 gangliogliomas by chromosomal 10, 20 and array‐based 32, 37 CGH. An unsupervised cluster analysis of the results was performed to investigate whether gangliogliomas could be subclassified on the basis of their genomic profiles. As the glial cells in gangliogliomas are highly similar to the cells in diffuse astrocytomas histopathologically, the imbalances in gangliogliomas were compared with those in astrocytomas of WHO grade II. To address the question of which components carried the aberrations found by array CGH, interphase fluorescence in situ hybridization (FISH) on tumor tissue sections was performed with a separate evaluation of glial and neuronal cells. Finally, two primary gangliogliomas and their anaplastic recurrences were analyzed by array CGH and interphase FISH to identify genetic aberrations correlated with tumor recurrence and set the stage for individualizing therapeutic strategies used for gangliogliomas.
MATERIALS AND METHODS
Tumor samples
CGH analyses were performed on sporadic gangliogliomas from 61 patients (27 women, 34 men; mean age at operation: 27.9 years; Table 1). In the 51 patients with long‐standing epilepsy, presurgical evaluation had been performed within the epilepsy surgery program of the Department of Neurosurgery, Rheinische Friedrich‐Wilhelms‐University, Bonn (9). Informed, written consent was obtained from all patients with respect to the use of ganglioglioma tissue for additional studies. All procedures were conducted in accordance with the Declaration of Helsinki and approved by the Ethics Committee of the University of Bonn Medical Center. Tumors were reviewed by the same neuropathologist and classified as WHO grade I according to the guidelines of the WHO (25). From 41 tumors, formalin‐fixed paraffin‐embedded tissue samples were analyzed. Unfixed frozen samples were available from 20 tumors. All gangliogliomas were investigated for the CD34 epitope status and showed positive staining. The proportion of neuronal cells was under 10% in all gangliogliomas analyzed.
Table 1.
Clinical, histopathologic and CGH [chromosomal (cases 1–41) or array‐based (cases 42–61)] data in 61 gangliogliomas (WHO grade I). Abbreviations: No. = number; M = male; F = female; CD34 status: + = weak, ++ = moderate, +++ = strong; n.d. = not determined; CGH = comparative genomic hybridization.
| Case No. | Age at operation (years) | Sex | Long‐standing epilepsy | CD34 status | CGH loss | CGH gain |
|---|---|---|---|---|---|---|
| 1 | 32 | M | + | + | — | Xp21–q27 |
| 2 | 34 | F | + | +++ | 22q | — |
| 3 | 20 | F | + | +++ | — | 5, 7, 19, 20 |
| 4 | 29 | F | + | +++ | — | — |
| 5 | 21 | F | + | +++ | — | 21q |
| 6 | 9 | F | + | +++ | — | — |
| 7 | 31 | F | + | ++ | 5q31–q35, 20 | — |
| 8 | 28 | M | − | +++ | 9, 21q, 22q | — |
| 9 | 27 | F | + | +++ | — | — |
| 10 | 17 | M | + | +++ | 17q24–q25, 22q | 7, 8 |
| 11 | 37 | M | + | ++ | — | 9q32‐q34 |
| 12 | 46 | M | + | +++ | — | — |
| 13 | 9 | M | + | ++ | — | — |
| 14 | 17 | F | + | ++ | 10q22–q26, 13q | 7, 8, 12 |
| 15 | 16 | M | + | + | 15q, 16, 22q | 4, 5, 7, 8, 13q, 17, 19, 20, X, Y |
| 16 | 55 | F | + | ++ | — | — |
| 17 | 37 | F | + | ++ | — | 2, 3, 4, 5 |
| 18 | 20 | F | + | ++ | 10q25–q26, 14q24–q32, 16, 18q22‐q23, 22q | — |
| 19 | 21 | F | + | ++ | 12q23–q24.3 | — |
| 20 | 31 | F | + | +++ | 9 | 7, 8 |
| 21 | 22 | F | + | +++ | 9, 16 | — |
| 22 | 23 | M | + | +++ | — | 5, 7 |
| 23 | 36 | F | + | ++ | 22q | 5, 7, 8, 12p13–q21 |
| 24 | 22 | M | + | ++ | 9q34 | — |
| 25 | 38 | F | + | +++ | — | — |
| 26 | 30 | M | + | ++ | 18, Yq | — |
| 27 | 54 | M | + | ++ | — | — |
| 28 | 23 | F | + | ++ | — | 9q, 16, 17, 20q |
| 29 | 39 | M | + | +++ | — | — |
| 30 | 48 | M | + | ++ | Y | 1p12–p13 |
| 31 | 8 | M | + | ++ | — | — |
| 32 | 64 | F | + | ++ | — | — |
| 33 | 7 | F | + | ++ | 11p15 | — |
| 34 | 2 | M | + | + | — | — |
| 35 | 16 | F | + | +++ | — | — |
| 36 | 2 | F | − | +++ | 18, 19, 20q, 21q | — |
| 37 | 27 | F | + | n.d. | — | — |
| 38 | 2 | F | + | n.d. | — | — |
| 39 | 24 | F | + | n.d. | — | 8 |
| 40 | 3 | M | + | n.d. | 20q | X |
| 41 | 56 | F | + | n.d. | — | — |
| 42 | 32 | M | + | +++ | — | — |
| 43 | 14 | M | + | +++ | 1p, 21q22.11–q22.3 | — |
| 44 | 44 | M | + | + | 17p | 3p26.2–p26.3 |
| 45 | 9 | M | − | + | — | 6,10 |
| 46 | 41 | M | + | +++ | 9, 13q, 22q | — |
| 47 | 34 | F | − | ++ | — | 14q32.13–q32.2 |
| 48 | 40 | M | + | ++ | — | — |
| 49 | 14 | F | + | + | — | — |
| 50 | 31 | M | + | ++ | 16, 17, 19, 22q | 5, 6, 7, 8, 13q, Y |
| 51 | 20 | M | + | +++ | — | — |
| 52 | 32 | M | + | ++ | 22q | 5, 7, 8, 11, 12, 15q, 17, 19, 20, 21q, X |
| 53 | 10 | M | − | +++ | 1, 2, 3, 4, 8, 9, 11, 13q, 14q, 17, 22q, Y | 5, 6, 7, 10, 12, 15q, 16, 18, 19, 20, 21q, X |
| 54 | 40 | M | + | +++ | 10q22.3–q25.3 | 5 |
| 55 | 17 | M | + | +++ | — | — |
| 56 | 18 | M | − | ++ | — | 5, 7, 11, 12, 21q |
| 57 | 38 | M | − | ++ | Y | — |
| 58 | 12 | M | + | +++ | 2 | 7, 12, 18, 19, 21q, X, Y |
| 59 | 54 | M | − | + | 10, 18 | 7, 19 |
| 60 | 60 | M | − | +++ | — | 12q13.3–q14.1 |
| 61 | 60 | M | − | +++ | 10q21.1–q26.3, 13q, 15q11.2–q22.2 | — |
Two gangliogliomas (WHO grade I) from male patients recurred as anaplastic gangliogliomas (WHO grade III), also classified according to the WHO guidelines by the same neuropathologist (25). Frozen unfixed material was available from both anaplastic gangliogliomas. The patients had been treated by surgical resection and had not received adjuvant therapy for the primary gangliogliomas.
Nucleic acid extraction
DNA was extracted from paraffin‐embedded tissue sections of 41 gangliogliomas, and frozen tissue sections of 20 gangliogliomas and two anaplastic gangliogliomas (10 sections, 10 µm each) by DNeasy Tissue Kit (Qiagen, Hilden, Germany) according to the manufacturer's instructions. Care was taken to use only ganglioglioma tissue and avoid adjacent normal cortex and white matter. Characteristic neuropathologic features of gangliogliomas such as highly differentiated neoplastic glial cell components could be clearly determined by microscopic analysis and distinguished from normal central nervous system tissue components.
As reference DNA for CGH analyses, DNA was extracted from peripheral blood lymphocytes of normal individuals according to standard procedures (36).
Chromosomal CGH
Metaphase spreads were prepared from stimulated peripheral blood lymphocytes obtained from a healthy male subject (46,XY) following standard procedures. CGH was performed with tumor and control DNA as described in detail elsewhere 42, 43. For image capture and processing of CGH data, the Leica CW4000 System (Leica, Wetzlar, Germany) was used. The diagnostic thresholds used to score losses, gains and high‐level amplifications were 0.8, 1.2 and 2.0, respectively.
Array‐based CGH
Twenty gangliogliomas and two anaplastic gangliogliomas, for which high molecular weight DNA could be extracted from frozen tumor samples, were analyzed by array CGH using genomic DNA microarrays with more than 6000 large insert clones (6k array, eight tumors), or more than 8000 large insert clones (8k array, 12 tumors). Both arrays contained the Sanger Centre 1 Mb clone set covering the genome at an average resolution of ∼1 Mb (13). On the 6k array, there were 3000 additional gene‐ and region‐specific RCPI (RZPD, Berlin, Germany) and CalTech (Invitrogen, Karlsruhe, Germany) BAC clones, reaching an average resolution of 0.5 Mb (48). The 8k array contained 2000 additional clones providing tiling‐path resolution of the large GC and gene rich regions on chromosomes 1, 19 and 22. Array assembly, hybridization and analysis were essentially performed as described previously 12, 48, with minor modifications. Hybridization of 6k arrays was performed as “dye‐swap”. 8k arrays were hybridized with Cy3‐labeled tumor DNA and Cy5‐labeled reference DNA. Reference DNA pools were generated from 10 healthy women and 10 healthy men. Hybridizations of all gangliogliomas were sex matched. Array CGH data were processed using the ChipYard framework (http://www.dkfz.de/genetics/ChipYard/); for tumor aberrations in cell subpopulations, the integrated GLAD algorithm (16) was used.
Interphase FISH to tumor tissue sections
Interphase FISH was performed on ganglioglioma No. 46, on the two gangliogliomas with malignant recurrences (No. 60 and 61), and on their respective anaplastic gangliogliomas. Formalin‐fixed paraffin‐embedded tissue sections of 6 µm thickness were deparaffinated. Pretreatment and fixation of the slides was performed with the Paraffin Pretreatment Reagent Kit 1 (Abbot Molecular, Desplaines, IL, USA) according to manufacturer's instructions. Commercial FISH probes were hybridized according to manufacturer's instructions. Non‐commercial BAC or PAC clones were labeled with digoxigenin‐11‐dUTP or biotin‐16‐dUTP (Roche, Basel, Switzerland) by nick translation. FISH was carried out as described previously (24). In ganglioglioma No. 46, glial and neuronal cells were distinguished on the basis of their nucleus size as determined by staining with the DNA‐intercalating fluorophore DAPI. In this tumor, such a distinction was possible because of clear differences in size and shape between nuclei from glial and neuronal elements as well as ascertained by serial hematoxylin and eosin (H&E)‐stained sections. Evaluation of FISH analysis was performed in tissue areas found to contain approximately 80% or more of neoplastic glial and dysplastic neuronal cells selected by H&E staining on consecutive sections.
CGH data analysis
CGH annotations conforming to the ISCN 1995 standard (29) were processed by dedicated software implemented in the Perl scripting language using complex regular expression‐based parsing algorithms (1). Data matrices were generated, containing the imbalance status (“1” = gain, “−1” = loss, “2” = high level gain) for each of 862 chromosomal bands. From this data matrix, the frequency of occurrence of gains and losses for each interval was determined and histograms were generated. For evaluation of divergent imbalance patterns, unsupervised cluster analyses were performed on a reduced density matrix (86 intervals) using the Bioconductor “Heatplus” package (http://www.bioconductor.org/). Online versions of the data conversion and visualization applications are available through the Progenetix Project (2) (http://www.progenetix.net).
Statistical analysis
Comparisons between groups were performed by Fisher's exact test, t‐test or Mann–Whitney rank sum test, as appropriate. A P‐value of ≤0.05 was considered statistically significant.
RESULTS
Genomic imbalances detected by chromosomal or array CGH
Genomic aberrations were detected by CGH in 40 of 61 (66%) gangliogliomas (Table 1, Figure 1) with an average of 2.52 ± 0.50 (mean ± SEM) alterations per tumor (range: 0–24). Tumors from patients with long‐standing epilepsy (n = 51) had a significantly lower number of imbalances per case than tumors from patients without epilepsy (n = 10) (mean ± SEM: 2.08 ± 0.42 vs. 4.80 ± 2.18; P = 0.02).
Figure 1.
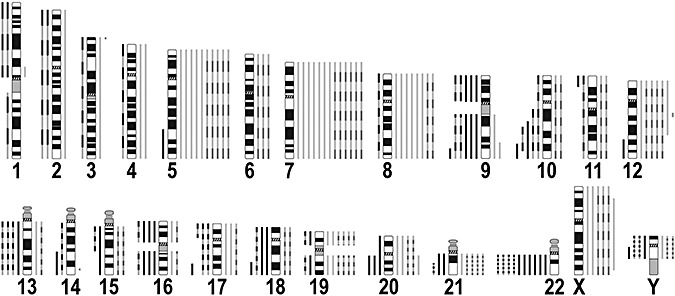
Summary of imbalances detected by comparative genomic hybridization (CGH) analysis of 61 gangliogliomas (WHO grade I). Alterations found by chromosomal CGH are depicted as continuous lines, array CGH findings are shown as dashed lines. Lines to the right of each chromosome ideogram indicate gains, and lines to the left of an ideogram represent losses.
Recurrent gains were identified on chromosomes 7 (21% of tumors), 5 (16%), 8 (13%), 12 (12%), 19 and X (10% each), Y (9% of tumors from male patients), 20 and 21q (8% each), 19 (7%), 17 and 6 (5% each), and 3, 4, 9, 10, 11, 13q, 15q, 16 and 18 (3% each). Recurrent losses were found on chromosomes 22q (16%), Y (12% of tumors from male patients), 9 (10%), 10 (8%), 13q, 16, 17 and 18 (7% each), 20 and 21q (5% each) as well as 1, 2, 11, 14q, 15q and 19 (3% each).
Recurrent partial losses and gains were found on chromosomes 10 (4 cases) and 12 (2 cases) (Figure 2). These were losses of 10q22‐q26 and 10q25‐q26 detected by CGH, as well as of 10q21.1‐q26.3 and 10q22.3‐q25.3 detected by array CGH, with a minimal overlapping region of loss in chromosomal band 10q25. The partial gains on chromosome 12 were mapped to 12p13‐q21 (CGH) and 12q13.3‐q14.1 (array CGH: approximately 2 Mb from clone RP11‐121C6 to RP11‐652N17). Small non‐recurrent alterations detected by array CGH were a gain of approximately 3.2 Mb in 3p26.2‐p26.3 (comprising clones PAC1186B18, RP11‐306H5, RP11‐86C13, RP11‐97C16) and a gain of approximately 2.4 Mb in 14q32.13‐q32.2 (comprising clones RP11‐298I23 and RP11‐164H13).
Figure 2.
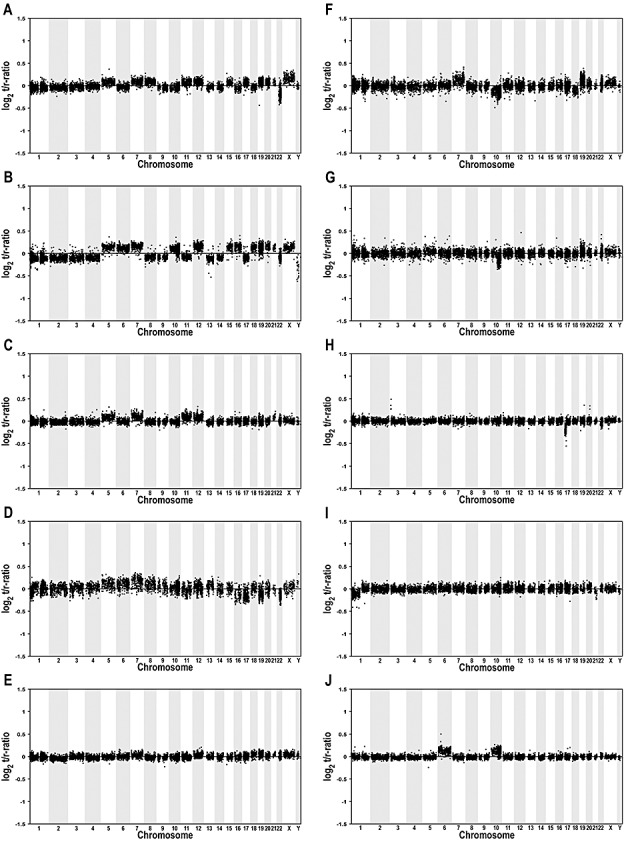
Array comparative genomic hybridization (CGH) profiles of 10 selected gangliogliomas (WHO grade I). Midpoints of all clones are plotted in genomic order from 1p to Yq on the x‐axis against their normalized log2 test to reference ratio on the y‐axis. Vertical bars indicate clones belonging to the same chromosome. The following tumors are shown: A: 52, B: 53, C: 56, D: 50, E: 58, F: 59, G: 54, H: 44, I: 43, J: 45. Note that tumor profiles shown in A–F show gains of chromosome 7 in combination with gains of chromosomes 5, 8, 12 and/or 19 (Table 1).
The genomic profile allows a separation into two ganglioglioma subgroups
By unsupervised cluster analysis of gangliogliomas with CGH imbalances, a separation of cases into two major subgroups is apparent (Figure 3A). Group I (Figure 3A, yellow) is defined by a complete gain of chromosome 7. This aberration appears to be related to a variety of additional chromosomal gains, that is, of chromosomes 5, 8, 12 and 19. Gain of 7 can also be found in one highly aberrant ganglioglioma not assigned to the two main clusters. Group II (Figure 3A, blue) does not exhibit major recurring imbalances, with the exception of losses on chromosomes 9 and 22q, which are, however, not exclusive to this group.
Figure 3.
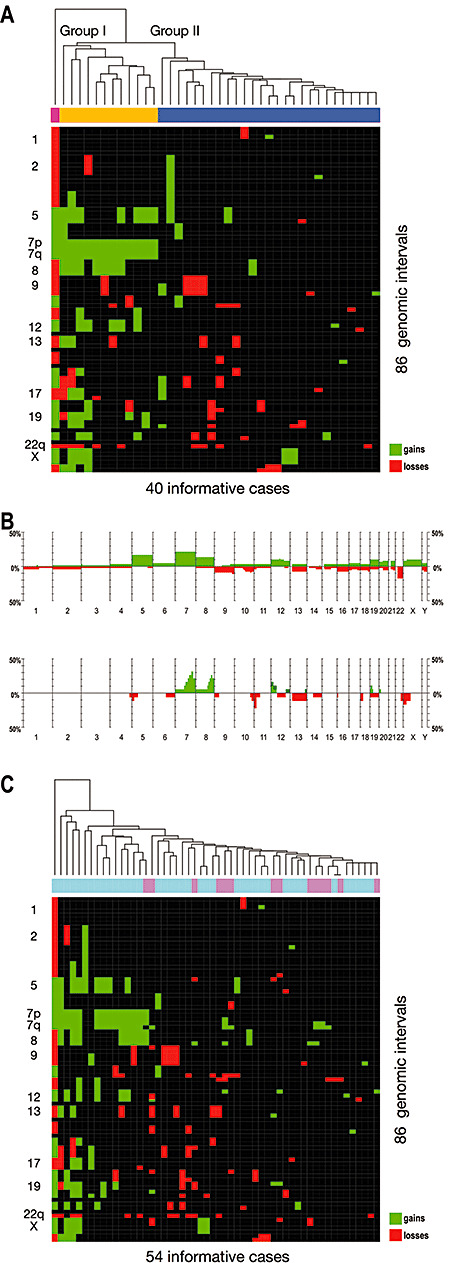
Molecular subclassification of gangliogliomas (WHO grade I) by their genomic signature and comparison of genetic profiles in gangliogliomas and diffuse astrocytomas (WHO grade II). A. Unsupervised cluster analysis of the gangliogliomas showing imbalances in comparative genomic hybridization analysis (40 of 61 cases). A separation of cases into two major groups is apparent, with gains of the whole chromosome 7 being the defining feature of group I (coded yellow). Group II (coded blue) does not exhibit major recurring imbalances, with the exception of losses on chromosomes 9 and 22, which are, however, not exclusive to the group. Interestingly, gain of chromosome 7 appears to be related to a variety of other chromosomal gains (eg, of 5, 8, 12, 19), which can also be found in one highly aberrant case not assigned to the two main clusters (coded magenta). B. Histograms comparing the frequency of genomic gains (green bars showing upwards) and losses (red bars showing downwards) in 61 gangliogliomas of WHO grade I (top) and 19 diffuse astrocytomas of WHO grade II (bottom). While mostly the same chromosomes are affected in both tumor entities, the majority of imbalances involve whole chromosomes in gangliogliomas vs. parts of chromosomes in diffuse astrocytomas. Gain of chromosome 5 was the only imbalance found significantly more frequently in gangliogliomas. C. Unsupervised cluster analysis of 40 gangliogliomas of WHO grade I (coded light blue) and 14 diffuse astrocytomas of WHO grade II (coded pink). While a subgroup of gangliogliomas largely corresponding to ganglioglioma cluster group I (compare A) exhibits a concordant pattern of genomic imbalances, the diffuse astrocytomas form small subclusters defined by single regional aberrations (eg, gains on 7q) within ganglioglioma cluster group II (compare A).
Patients from cluster groups I and II did not differ significantly in age (P = 0.49) or gender (P = 0.38).
Comparison between the genomic aberration pattern of gangliogliomas and diffuse astrocytomas
Genomic imbalances in gangliogliomas and 19 diffuse astrocytomas of WHO grade II, which were reported by us previously 41, 44, were compared (Figure 3B). While the majority of gains and losses in gangliogliomas involved whole chromosomes, most imbalances in diffuse astrocytomas involved only parts of chromosomes. The most striking difference was gain on chromosome 5, which was found significantly more frequently in gangliogliomas than in diffuse astrocytomas (P = 0.05).
Unsupervised cluster analysis of both tumor entities shows that only one diffuse astrocytoma is part of ganglioglioma group I exhibiting a concordant pattern of genomic imbalances (Figure 3C, left part of the heat map). The other diffuse astrocytomas form small subclusters defined through single regional aberrations (eg, gains on 7q) within ganglioglioma group II (Figure 3C, right part of the heat map).
A subpopulation of glial cells carries the chromosomal imbalances
By array CGH, losses of chromosome 9, 13q and 22q were found in ganglioglioma No. 46 (Figure 4A). To investigate which tumor cells carried these losses, we used clones from chromosomes 9 and 22 as probes for interphase FISH to sections from this tumor. One signal, that is, a deletion, for BAC RP11‐392G7 (9q22.32) was detected in 52% of glial cells, whereas no deletion was observed in neuronal cells (Figure 4A). The same was true for BAC CTA‐229A8 (22q13), which was deleted in 38% of glial cells, but not in any neuronal cell. The control probes (RP11‐242D8 from 17q21.31 and RP11‐279K24 from 4q35.1) showed two signals, that is, no deletion, in the cells analyzed. Thus, a subpopulation of neoplastic glial cells was found to contain the chromosomal imbalances, whereas in the dysplastic neuronal cells no aberrations were found.
Figure 4.
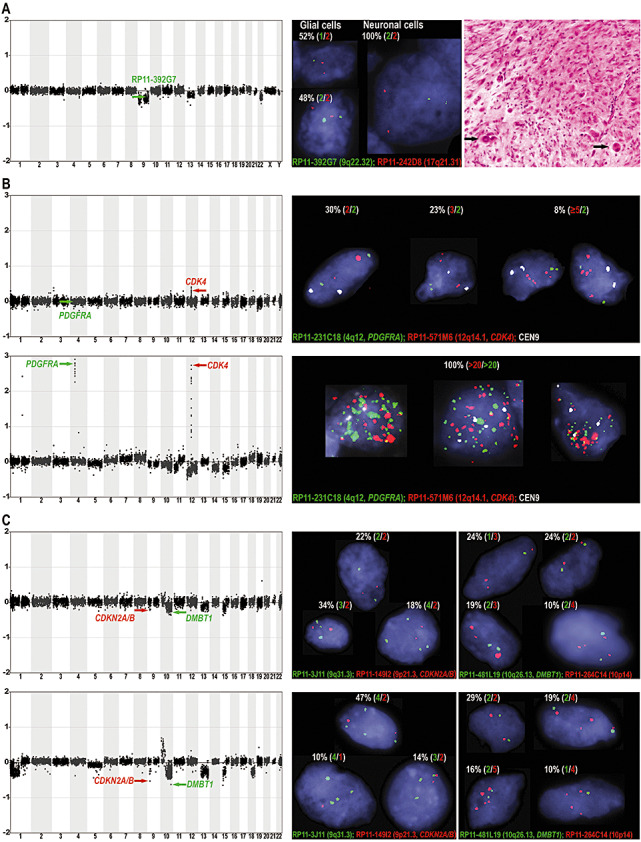
Analysis of tumor DNA by array comparative genomic hybridization (CGH) and tissue sections by interphase fluorescence in situ hybridization (FISH). A. Array CGH profile (left), interphase FISH analysis (center) and hematoxylin and eosin staining (right) of ganglioglioma No. 46 exhibiting the typical composition of dysplastic neuronal and astroglial elements; note the large dysplastic, occasionally binucleated neuronal cells (right, black arrows). The array CGH profile showed losses of chromosomes 9, 13q and 22q (left). By interphase FISH, losses of clones on 9 (green arrow in array CGH profile) and on 22q (not shown) were verified and the cell component harboring the imbalances was identified. Interphase FISH showed only one signal for clone RP11‐392G7 (9q22.32) in 52% of glial cells corresponding to a deletion of one copy, but two signals in all neuronal cells indicating a normal diploid pattern (center). For clone CTA‐229A8 (22q13), one signal was found in 38% of glial cells, whereas all neuronal cells showed two signals (data not shown). Thus, the imbalances were only detected in a subpopulation of glial and not in neuronal cells. B. Array CGH and interphase FISH analysis of ganglioglioma No. 60 (WHO grade I, upper panels) recurring as an anaplastic ganglioglioma (WHO grade III, lower panels) in the same patient. In the anaplastic ganglioglioma, array CGH detected amplifications of clones containing the oncogenes PDGFRA (RP11‐231C18, 4q12, green arrow) and CDK4 (RP11‐571M6, 12q14.1, red arrow). By interphase FISH, more than 20 copies were found for both clones in all tumor cells, whereas a control probe (CEN9) was present in up to four copies corresponding to a near tetraploid karyotype. In the ganglioglioma, array CGH detected no alteration of RP11‐231C18 (PDGFRA), while RP11‐571M6 (CDK4) showed a subtle gain at 12q14.1 not identified in any other ganglioglioma. By interphase FISH, over 30% of cells showed more than two signals for RP11‐571M6 (CDK4), whereas only 30% of cells had a normal diploid pattern (ie, two signals for all probes used). C. Array CGH and interphase FISH analysis of ganglioglioma No. 61 (WHO grade I, upper panels) recurring as an anaplastic ganglioglioma (WHO grade III, lower panels) in the same patient. In the anaplastic ganglioglioma, array CGH identified prominent losses for clones RP11‐149I2 (CDKN2A/B, 9p21.3) and RP11‐481L19 (DMBT1, 10q26.13). By interphase FISH, a pattern of three to four signals for control probes and one to two signals for RP11‐149I2 (CDKN2A/B) and RP11‐481L19 (DMBT1) were found in over 70% of cells, corresponding to a relative loss of the clones containing these tumor suppressor genes. In the ganglioglioma, the same clones showed a diminished ratio by array CGH making this the only ganglioglioma with combined CDKN2A/B and DMBT1 losses. Interphase FISH showed that on a cellular level the alterations were relative losses (one to two signals) compared with control probes present in three to four signals (near triploid to tetraploid karyotype) in around 50% of cells.
Array CGH and interphase FISH in two gangliogliomas and their anaplastic recurrences
Two of the gangliogliomas (WHO grade I) analyzed had recurred as anaplastic gangliogliomas (WHO grade III). By array CGH, one anaplastic ganglioglioma showed various gains and losses as well as amplifications of chromosomal bands 4q12 and 12q13.3‐q14.1 harboring the genes PDGFRA and CDK4 (Figure 4B, lower panel, left). By interphase FISH, both amplifications were detected in every tumor cell analyzed. FISH‐probes for PDGFRA (RP11‐231C18, 4q12) and CDK4 (RP11‐571M6, 12q14.1) showed at least 20 signals, whereas a centromere 9 control probe (CEN9) showed three or four signals in all cells indicating a near triploid or tetraploid karyotype (Figure 4B, lower panel, right).
In the respective primary ganglioglioma, a gain of 12q13.3‐q14.1 including the CDK4 locus was already detectable by array CGH, while the other aberrations were not found (Figure 4B, upper panel, left). This circumscribed gain of 12q13.3‐q14.1 was not found in any other ganglioglioma of our series. To investigate copy numbers of CDK4 compared with PDGFRA showing no gain on a cellular level, we performed interphase FISH with the same probes used in the anaplastic ganglioglioma (Figure 4B, upper panel, right). Two signals each were found for RP11‐231C18 (PDGFRA) and CEN9 in 25 of 30 cells. In these 25 cells, nine showed two signals for the CDK4 probe (RP11‐571M6), seven showed three signals, another seven showed four signals, and two cells showed six or seven signals. In five of 30 cells, the number of signals for all tested probes was higher than two. Thus in 21 of 30 cells (70%), CDK4 was present in more than two copies, but never in over seven copies.
The other anaplastic ganglioglioma also had multiple aberrations including pronounced losses of clones from chromosomal bands 9p21.3 and 10q26.13 harboring the genes CDKN2A/CDKN2B and DMBT1 (Figure 4C, lower panel, left). Interphase FISH to tissue sections of this anaplastic ganglioglioma with probe RP11‐149I2 (CDKN2A/B, 9p21.3) and control probe RP11‐3J11 (9q31.3) with a balanced ratio in array CGH showed different cellular clones (Figure 4C, lower panel, right). In a total of 49 analyzed cells, the average number of signals was 3.36 for RP11‐3J11 and 1.73 for RP11‐149I2 (CDKN2A/B). In the majority of cells (31 of 49), four signals were detected for RP11‐3J11; 23 of these had two signals and eight one signal for RP11‐149I2 (CDKN2A/B). Fifteen cells had three signals for RP11‐3J11; two of these had three signals, seven had two signals, and six had one signal for RP11‐149I2 (CDKN2A/B). In addition, interphase FISH was carried out with probes for DMBT1 (RP11‐481L19, 10q26.13) and control probe RP11‐264C14 (10p14) with a balanced ratio in array CGH (Figure 4C, lower panel, right). In 63 analyzed cells, the average signal number was 3.43 for clone RP11‐264C14 and 1.81 for clone RP11‐481L19 (DMBT1). In 18 of 63 cells, two signals were found for each probe. Fourteen cells showed three signals for RP11‐264C14; eight of these had two signals and six had one signal for RP11‐481L19 (DMBT1). In 18 cells, four signals were found for RP11‐264C14; 12 of these had two copies and six had one copy of RP11‐481L19 (DMBT1). In 12 cells, five signals were detected for RP11‐264C14; 10 of these had two signals and two had one signal for RP11‐481L19 (DMBT1).
In the array CGH profile of the respective primary ganglioglioma, losses of clones RP11‐149I2 (CDKN2A/B) and RP11‐481L19 (DMBT1) were less pronounced than in the anaplastic ganglioglioma but detectable (Figure 4C, upper panel, left). There was no ganglioglioma in our series with a lower ratio for RP11‐481L19 (DMBT1), and no other ganglioglioma with a combined loss of RP11‐149I2 (CDKN2A/B) and RP11‐481L19 (DMBT1). By interphase FISH, the average number of signals was 2.9 for the control probe (RP11‐3J11, 9q31.3) and 1.94 for RP11‐149I2 (CDKN2A/B) in 50 cells analyzed (Figure 4C, upper panel, right). Eleven cells were found with two signals and four cells with three signals for each probe. Five cells had two signals for RP11‐3J11 and one signal for RP11‐149I2 (CDKN2A/B), 17 cells had a pattern of three vs. two and two cells with a pattern of three vs. one signal. In one cell, we identified four vs. three signals, in nine cells four vs. two signals, in one cell four vs. one signal. By interphase FISH with other probes, 21 cells were successfully analyzed showing an average signal number of 2.67 for control clone RP11‐264C14 (10p14) and 1.62 for clone RP11‐481L19 containing the DMBT1 gene (Figure 4C, upper panel, right). In five of 21 cells, two copies were found for each probe. Four cells showed two signals for RP11‐264C14 and one signal for RP11‐481L19 (DMBT1). In 10 cells, three signals were detected for RP11‐264C14; one of these had three signals, four had two signals and five had one signal for RP11‐481L19 (DMBT1). Two cells showed a signal pattern of four signals for RP11‐264C14 and two signals for RP11‐481L19 (DMBT1).
DISCUSSION
As very little is known about the molecular pathogenesis of gangliogliomas, we used global genomic screening methods, that is, chromosomal and array based CGH, to comprehensively determine the genomic profile in a large series of 61 gangliogliomas. CGH analysis showed that the majority of gangliogliomas (66%) carried genomic imbalances mostly involving whole chromosomes with a mean number of aberrations of 2.5 per tumor. Interestingly, gangliogliomas from patients with long‐standing epilepsy had a significantly lower median number of imbalances per case than tumors from patients without epilepsy. There may be an association between these results and the observation that ganglioglioma patients with long‐standing epilepsy have a lower recurrence rate and a better clinical course than patients without epilepsy 26, 27.
The most frequent aberration in gangliogliomas was gain of chromosome 7 detected in 21% of tumors. Other common gains were on chromosomes 5, 8, 12, and 19. The most frequent loss was on 22q in 16% of cases. Other common losses were on Y, 9 and 10. In a fraction of tumors, gain of chromosome 7 was found in combination with gains on 5 and/or 8 and/or 12 and/or 19. By unsupervised cluster analysis, these gangliogliomas with a complete gain of chromosome 7 combined with one or more of the other frequent gains were found to represent a distinct subgroup (group I). The other group (group II) showed no major recurring imbalances except for losses on 9 and 22q, which are not exclusive to group II. Interestingly, unsupervised clustering of array CGH data also allowed the molecular subclassification of medulloblastomas into two clusters (28), corroborating our data that genomic profiling can distinguish genetic subgroups within the same brain tumor entity. Intriguingly, this is not only the case for highly malignant central nervous system tumors, that is, medulloblastomas, but also for the benign gangliogliomas.
As histopathologically the glial cells in gangliogliomas are highly similar to the cells in diffuse astrocytomas, the latter tumor type represents an appropriate collective for comparison. Thus, the present CGH data were compared with that for diffuse astrocytomas of WHO grade II, which we published previously 41, 44. There was no significant difference in the chromosomes affected by imbalances except for a chromosome 5 gain found significantly more frequently in gangliogliomas. Interestingly, by unsupervised cluster analysis, all but one diffuse astrocytoma form subclusters defined by single regional aberrations within group II of gangliogliomas showing no concordant pattern of genomic imbalances. This finding suggests that the ganglioglioma cluster defined by combined gains of chromosomes 5, 7, 8 and 12 (group I) represents a subgroup that can be genetically distinguished from diffuse astrocytomas, although cellular elements in the latter and the glial component of gangliogliomas are generally not distinguishable with respect to their cyto‐ and histopathological characteristics. Similarly, for different astrocytic and oligodendroglial tumor entities of WHO grade II to IV, Roerig et al (35) could show that high‐resolution genetic profiling allows a distinction between most tumors paralleling the histological classification.
Array CGH analysis of gangliogliomas also identified and finely mapped several smaller chromosomal imbalances. The most circumscribed aberration was a terminal subtelomeric gain on 3p involving 3p26.2‐p26.3. Three genes that are preferentially expressed in the brain, that is, CHL1, CNTN6 and CNTN4, are located in this region. CNTN6 and CNTN4 belong to the gene family of contactins, which act as ligands and activators of notch, and are involved in oligodendrocyte maturation (15) and neurite outgrowth (47). Amplification and over‐expression of another family member, CNTN2, was reported in individual malignant gliomas, and a reduced migration of glioma cells was found when blocking contactin 2 function (34). CHL1 coding for the neural cell adhesion molecule L1‐like protein is detectable in neurons, astrocytes, oligodendrocyte precursors and Schwann cells of the mouse and rat and promotes neurite outgrowth (14). In addition, there is evidence that members of the L1 gene family play a role in the adhesion and migration of glioma cells and participate in tumor invasion along neuronal fibers (17). Therefore, CNTN6, CNTN4 and CHL1 represent interesting target proto‐oncogenes in glial tumors. However, it remains to be shown whether they are of specific importance in the tumorigenesis of gangliogliomas.
Interphase FISH experiments to ganglioglioma sections allowed investigations on a cellular level. With this approach we wanted to address the question, which of the two cellular components of gangliogliomas carry genetic aberrations. In one ganglioglioma, the imbalances detected by array CGH were confirmed and could be localized to a subpopulation of glial cells, while no dysplastic neuronal cells carried the aberrations analyzed. These data represent genetic evidence, which corroborates histopathological data, suggesting that the glial cells represent the neoplastic component in gangliogliomas, whereas there were no evident signs for neoplasia of the neuronal cells 5, 21, 45. This hypothesis was further supported by the finding that a TSC2 sequence alteration detected in a ganglioglioma was restricted to its glial cell component (3).
One of the aims of genomic profiling is to set the stage for individualized medicine based on the identification of tumors, which will have different biological behavior than expected from histopathological evaluation. In our series, we had the chance to investigate two gangliogliomas (WHO grade I), for which the rare event of tumor recurrence and malignant progression to anaplastic ganglioglioma (WHO grade III) was observed. By array CGH analysis, the anaplastic recurrences showed genetic aberrations commonly associated with malignant gliomas, including amplifications of the oncogenes PDGFRA and CDK4, or pronounced losses of the tumor suppressor genes CDKN2A/B and DMBT1 (33). In the array CGH profiles of the primary gangliogliomas, the CDK4 amplification was detectable as a distinct CDK4 gain in one tumor and the clones containing the CDKN2A/B and DMBT1 genes both showed signal ratios indicating a slight loss in the other case. These aberrations, that is, circumscribed CDK4 gain and combined CDKN2A/B and DMBT1 loss, were not found in any of the other gangliogliomas of the present series. In addition, both tumors did not show the typical ganglioglioma pattern of genomic imbalances found in cluster group I. Thus, a genetic signature different from other gangliogliomas, which have the same histopathological features, pointing toward malignant progression is seen in these two cases with malignant recurrences.
These findings were corroborated by data from interphase FISH. While the CDK4 amplification (copy number higher than 20) was found in all cells of the anaplastic ganglioglioma, an increased copy number of CDK4 (three to six copies) was detectable in over 30% of cells of the primary ganglioglioma. Only 30% of cells showed normal diploid signals. The other anaplastic ganglioglioma was found to have a triploid to tetraploid background, that is, three and four copies of control clones, but only one or two copies of clones containing CDKN2A/B and DMBT1 in over 70% of cells. The same signal constellation resulting in a relative loss of CDKN2A/B and DMBT1 was found in over 50% of cells of the primary ganglioglioma, whereas only around 25% of cells showed a normal diploid pattern. Thus, interphase FISH confirms that there are genetic signs indicating tumor evolution toward higher malignancy in both gangliogliomas.
In summary, our study provides the first comprehensive overview of genomic alterations in a large series of gangliogliomas. We found that two‐thirds of cases of this generally benign tumor type carried genomic imbalances. One cluster group was identified to be defined by a complete gain of chromosome 7 and additional gains of chromosomes 5, 8, 12 or 19, and to have a distinct genetic signature compared with diffuse astrocytomas of WHO grade II. A subpopulation of glial cells and not the dysplastic neuronal cells were found to harbor the chromosomal imbalances. Furthermore, the present data demonstrate the potential of array CGH to detect early aberrations in evolving tumors even if they are just present in a subpopulation of cells. Therefore, one should consider using array CGH as an additional diagnostic tool to assess biological tumor behavior and assist in personalizing therapeutic strategies even in low‐grade tumors.
ACKNOWLEDGMENTS
The authors thank Richard Nissl, MD for performing the statistical analysis and Ilona Treschwig for strongly supporting this project. This work was supported by the Deutsche Krebshilfe e.V. (70‐3163‐Wi3: German Glioma Network), the German Ministry for Education and Research (National Network for Genome Research, NGFN‐2, Brain Tumor Network), the Deutsche Forschungsgemeinschaft (SFB TR3) and the BONFOR program of the Medical Faculty, Rheinische Friedrich‐Wilhelms‐University, Bonn (O‐149.0058).
REFERENCES
- 1. Baudis M (2006) Online database and bioinformatics toolbox to support data mining in cancer cytogenetics. Biotechniques 40:269–270, 272. [DOI] [PubMed] [Google Scholar]
- 2. Baudis M, Cleary ML (2001) Progenetix.net: an online repository for molecular cytogenetic aberration data. Bioinformatics 17:1228–1229. [DOI] [PubMed] [Google Scholar]
- 3. Becker AJ, Lobach M, Klein H, Normann S, Nothen MM, Von Deimling A et al (2001) Mutational analysis of TSC1 and TSC2 genes in gangliogliomas. Neuropathol Appl Neurobiol 27:105–114. [DOI] [PubMed] [Google Scholar]
- 4. Becker AJ, Klein H, Baden T, Aigner L, Normann S, Elger CE et al (2002) Mutational and expression analysis of the reelin pathway components CDK5 and doublecortin in gangliogliomas. Acta Neuropathol (Berl) 104:403–408. [DOI] [PubMed] [Google Scholar]
- 5. Becker AJ, Blumcke I, Urbach H, Hans V, Majores M (2006) Molecular neuropathology of epilepsy‐associated glioneuronal malformations. J Neuropathol Exp Neurol 65:99–108. [DOI] [PubMed] [Google Scholar]
- 6. Becker AJ, Wiestler OD, Figarella‐Branger D, Blümcke I (2007) Ganglioglioma and gangliocytoma. In: Classification of Tumours of the Nervous System, Louis DN, Ohgaki H, Wiestler OD, Cavenee WK (eds), pp. 103–105. IARC: Lyon. [Google Scholar]
- 7. Blumcke I, Wiestler OD (2002) Gangliogliomas: an intriguing tumor entity associated with focal epilepsies. J Neuropathol Exp Neurol 61:575–584. [DOI] [PubMed] [Google Scholar]
- 8. Blumcke I, Giencke K, Wardelmann E, Beyenburg S, Kral T, Sarioglu N et al (1999) The CD34 epitope is expressed in neoplastic and malformative lesions associated with chronic, focal epilepsies. Acta Neuropathol (Berl) 97:481–490. [DOI] [PubMed] [Google Scholar]
- 9. Clusmann H, Kral T, Schramm J (2006) Present practice and perspective of evaluation and surgery for temporal lobe epilepsy. Zentralbl Neurochir 67:165–182. [DOI] [PubMed] [Google Scholar]
- 10. Du Manoir S, Speicher MR, Joos S, Schrock E, Popp S, Dohner H et al (1993) Detection of complete and partial chromosome gains and losses by comparative genomic in situ hybridization. Hum Genet 90:590–610. [DOI] [PubMed] [Google Scholar]
- 11. Duerr EM, Rollbrocker B, Hayashi Y, Peters N, Meyer‐Puttlitz B, Louis DN et al (1998) PTEN mutations in gliomas and glioneuronal tumors. Oncogene 16:2259–2264. [DOI] [PubMed] [Google Scholar]
- 12. Fensterer H, Radlwimmer B, Strater J, Buchholz M, Aust DE, Julie C et al (2007) Matrix‐comparative genomic hybridization from multicenter formalin‐fixed paraffin‐embedded colorectal cancer tissue blocks. BMC Cancer 7:58. [DOI] [PMC free article] [PubMed] [Google Scholar]
- 13. Fiegler H, Carr P, Douglas EJ, Burford DC, Hunt S, Scott CE et al (2003) DNA microarrays for comparative genomic hybridization based on DOP‐PCR amplification of BAC and PAC clones. Genes Chromosomes Cancer 36:361–374. [DOI] [PubMed] [Google Scholar]
- 14. Hillenbrand R, Molthagen M, Montag D, Schachner M (1999) The close homologue of the neural adhesion molecule L1 (CHL1): patterns of expression and promotion of neurite outgrowth by heterophilic interactions. Eur J Neurosci 11:813–826. [DOI] [PubMed] [Google Scholar]
- 15. Hu QD, Ang BT, Karsak M, Hu WP, Cui XY, Duka T et al (2003) F3/contactin acts as a functional ligand for Notch during oligodendrocyte maturation. Cell 115:163–175. [DOI] [PubMed] [Google Scholar]
- 16. Hupe P, Stransky N, Thiery JP, Radvanyi F, Barillot E (2004) Analysis of array CGH data: from signal ratio to gain and loss of DNA regions. Bioinformatics 20:3413–3422. [DOI] [PubMed] [Google Scholar]
- 17. Izumoto S, Ohnishi T, Arita N, Hiraga S, Taki T, Hayakawa T (1996) Gene expression of neural cell adhesion molecule L1 in malignant gliomas and biological significance of L1 in glioma invasion. Cancer Res 56:1440–1444. [PubMed] [Google Scholar]
- 18. Jay V, Squire J, Becker LE, Humphreys R (1994) Malignant transformation in a ganglioglioma with anaplastic neuronal and astrocytic components. Report of a case with flow cytometric and cytogenetic analysis. Cancer 73:2862–2868. [DOI] [PubMed] [Google Scholar]
- 19. Jay V, Squire J, Blaser S, Hoffman HJ, Hwang P (1997) Intracranial and spinal metastases from a ganglioglioma with unusual cytogenetic abnormalities in a patient with complex partial seizures. Childs Nerv Syst 13:550–555. [DOI] [PubMed] [Google Scholar]
- 20. Kallioniemi A, Kallioniemi OP, Sudar D, Rutovitz D, Gray JW, Waldman F, Pinkel D (1992) Comparative genomic hybridization for molecular cytogenetic analysis of solid tumors. Science 258:818–821. [DOI] [PubMed] [Google Scholar]
- 21. Kalyan‐Raman UP, Olivero WC (1987) Ganglioglioma: a correlative clinicopathological and radiological study of ten surgically treated cases with follow‐up. Neurosurgery 20:428–433. [DOI] [PubMed] [Google Scholar]
- 22. Kam R, Chen J, Blumcke I, Normann S, Fassunke J, Elger CE et al (2004) The reelin pathway components disabled‐1 and p35 in gangliogliomas—a mutation and expression analysis. Neuropathol Appl Neurobiol 30:225–232. [DOI] [PubMed] [Google Scholar]
- 23. Kordek R, Klimek A, Karpinska A, Alwasiak J, Debiec‐Rychter M, Liberski P (1996) The immunohistochemistry and ultrastructure of ganglioglioma with chromosomal alterations: a case report. Pol J Pathol 47:37–39. [PubMed] [Google Scholar]
- 24. Lichter P, Bentz M, Joos S (1995) Detection of chromosomal aberrations by means of molecular cytogenetics: painting of chromosomes and chromosomal subregions and comparative genomic hybridization. Methods Enzymol 254:334–359. [DOI] [PubMed] [Google Scholar]
- 25. Louis DN, Ohgaki H, Wiestler OD, Cavenee WK (2007) Classification of Tumours of the Central Nervous System. IARC: Lyon. [DOI] [PMC free article] [PubMed] [Google Scholar]
- 26. Luyken C, Blumcke I, Fimmers R, Urbach H, Elger CE, Wiestler OD, Schramm J (2003) The spectrum of long‐term epilepsy‐associated tumors: long‐term seizure and tumor outcome and neurosurgical aspects. Epilepsia 44:822–830. [DOI] [PubMed] [Google Scholar]
- 27. Luyken C, Blumcke I, Fimmers R, Urbach H, Wiestler OD, Schramm J (2004) Supratentorial gangliogliomas: histopathologic grading and tumor recurrence in 184 patients with a median follow‐up of 8 years. Cancer 101:146–155. [DOI] [PubMed] [Google Scholar]
- 28. Mendrzyk F, Radlwimmer B, Joos S, Kokocinski F, Benner A, Stange DE et al (2005) Genomic and protein expression profiling identifies CDK6 as novel independent prognostic marker in medulloblastoma. J Clin Oncol 23:8853–8862. [DOI] [PubMed] [Google Scholar]
- 29. Mitelman F (1995) International System for Human Cytogenetic Nomenclature. Karger: Basel. [Google Scholar]
- 30. Neumann E, Kalousek DK, Norman MG, Steinbok P, Cochrane DD, Goddard K (1993) Cytogenetic analysis of 109 pediatric central nervous system tumors. Cancer Genet Cytogenet 71:40–49. [DOI] [PubMed] [Google Scholar]
- 31. Pandita A, Balasubramaniam A, Perrin R, Shannon P, Guha A (2007) Malignant and benign ganglioglioma: a pathological and molecular study. Neuro Oncol 9:124–134. [DOI] [PMC free article] [PubMed] [Google Scholar]
- 32. Pinkel D, Segraves R, Sudar D, Clark S, Poole I, Kowbel D et al (1998) High resolution analysis of DNA copy number variation using comparative genomic hybridization to microarrays. Nat Genet 20:207–211. [DOI] [PubMed] [Google Scholar]
- 33. Reifenberger G, Collins VP (2004) Pathology and molecular genetics of astrocytic gliomas. J Mol Med 82:656–670. [DOI] [PubMed] [Google Scholar]
- 34. Rickman DS, Tyagi R, Zhu XX, Bobek MP, Song S, Blaivas M et al (2001) The gene for the axonal cell adhesion molecule TAX‐1 is amplified and aberrantly expressed in malignant gliomas. Cancer Res 61:2162–2168. [PubMed] [Google Scholar]
- 35. Roerig P, Nessling M, Radlwimmer B, Joos S, Wrobel G, Schwaenen C et al (2005) Molecular classification of human gliomas using matrix‐based comparative genomic hybridization. Int J Cancer 117:95–103. [DOI] [PubMed] [Google Scholar]
- 36. Sambrook J, Fritsch EF, Maniatis T (1989) Molecular Cloning: A laboratory Manual. Cold Spring Harbor Laboratory Press: Cold Spring Harbor, NY. [Google Scholar]
- 37. Solinas‐Toldo S, Lampel S, Stilgenbauer S, Nickolenko J, Benner A, Dohner H, Cremer T, Lichter P (1997) Matrix‐based comparative genomic hybridization: biochips to screen for genomic imbalances. Genes Chromosomes Cancer 20:399–407. [PubMed] [Google Scholar]
- 38. Squire JA, Arab S, Marrano P, Bayani J, Karaskova J, Taylor M et al (2001) Molecular cytogenetic analysis of glial tumors using spectral karyotyping and comparative genomic hybridization. Mol Diagn 6:93–108. [DOI] [PubMed] [Google Scholar]
- 39. Von Deimling A, Fimmers R, Schmidt MC, Bender B, Fassbender F, Nagel J et al (2000) Comprehensive allelotype and genetic anaysis of 466 human nervous system tumors. J Neuropathol Exp Neurol 59:544–558. [DOI] [PubMed] [Google Scholar]
- 40. Wacker MR, Cogen PH, Etzell JE, Daneshvar L, Davis RL, Prados MD (1992) Diffuse leptomeningeal involvement by a ganglioglioma in a child. Case report. J Neurosurg 77:302–306. [DOI] [PubMed] [Google Scholar]
- 41. Weber RG, Sabel M, Reifenberger J, Sommer C, Oberstrass J, Reifenberger G, Lichter P (1996) Characterization of genomic alterations associated with glioma progression by comparative genomic hybridization. Oncogene 13:983–994. [PubMed] [Google Scholar]
- 42. Weber RG, Sommer C, Albert FK, Kiessling M, Cremer T (1996) Clinically distinct subgroups of glioblastoma multiforme studied by comparative genomic hybridization. Lab Invest 74:108–119. [PubMed] [Google Scholar]
- 43. Weber RG, Bostrom J, Wolter M, Baudis M, Collins VP, Reifenberger G et al (1997) Analysis of genomic alterations in benign, atypical, and anaplastic meningiomas: toward a genetic model of meningioma progression. Proc Natl Acad Sci USA 94:14719–14724. [DOI] [PMC free article] [PubMed] [Google Scholar]
- 44. Weber RG, Hoischen A, Ehrler M, Zipper P, Kaulich K, Blaschke B et al (2007) Frequent loss of chromosome 9, homozygous CDKN2A/p14(ARF)/CDKN2B deletion and low TSC1 mRNA expression in pleomorphic xanthoastrocytomas. Oncogene 26:1088–1097. [DOI] [PubMed] [Google Scholar]
- 45. Wolf HK, Muller MB, Spanle M, Zentner J, Schramm J, Wiestler OD (1994) Ganglioglioma: a detailed histopathological and immunohistochemical analysis of 61 cases. Acta Neuropathol (Berl) 88:166–173. [DOI] [PubMed] [Google Scholar]
- 46. Yin XL, Hui AB, Pang JC, Poon WS, Ng HK (2002) Genome‐wide survey for chromosomal imbalances in ganglioglioma using comparative genomic hybridization. Cancer Genet Cytogenet 134:71–76. [DOI] [PubMed] [Google Scholar]
- 47. Yoshihara Y, Kawasaki M, Tamada A, Nagata S, Kagamiyama H, Mori K (1995) Overlapping and differential expression of BIG‐2, BIG‐1, TAG‐1, and F3: four members of an axon‐associated cell adhesion molecule subgroup of the immunoglobulin superfamily. J Neurobiol 28:51–69. [DOI] [PubMed] [Google Scholar]
- 48. Zielinski B, Gratias S, Toedt G, Mendrzyk F, Stange DE, Radlwimmer B et al (2005) Detection of chromosomal imbalances in retinoblastoma by matrix‐based comparative genomic hybridization. Genes Chromosomes Cancer 43:294–301. [DOI] [PubMed] [Google Scholar]