

Abstract
Recent studies revealed an important involvement of the cerebral cortex in multiple sclerosis (MS) patients. Cortical lesions in MS were reported to be less inflammatory and to show less structural damage than white matter lesions. Animal models reflecting the histopathological hallmarks of cortical demyelinated lesions in MS are sparse. Induction of experimental autoimmune encephalomyelitis (EAE) in the common marmoset has turned out to be an attractive non‐human‐primate model for MS. In the present study we investigated the presence and detailed cellular composition of cortical inflammatory demyelinating pathology in the common marmoset upon immunization with myelin oligodendrocyte glycoprotein (MOG). Extensive cortical demyelination reflecting the topographically distinct cortical lesion types in MS patients was revealed by immunohistochemistry for myelin basic protein (MBP). We explored the density of T‐ and B‐lymphocytes, MHC‐II expressing macrophages/microglia cells and early activated macrophages (MRP14) at perivascular and parenchymal lesions sites in neocortex and subcortical white matter. Despite a similar density of perivascular inflammatory infiltrates in the demyelinated neocortex, a considerable lower fraction of macrophages was found to express MRP14 in the neocortex indicating a different activation pattern in cortical compared with white matter lesions. Furthermore, cortical EAE lesions in marmoset monkeys revealed immunoglobulin leakage and complement component C9 deposition in intracortical but not subpial demyelination. Our findings indicate that the inflammatory response, especially macrophage and microglia activation, may be regulated differently in gray matter areas in primate brain.
INTRODUCTION
Multiple Sclerosis (MS) is the most common chronic disabling neurological disease of young adulthood. The characteristic pathological and radiological features of MS include multiple demyelinated lesions disseminated throughout the central nervous system (CNS). Histopathologically, MS lesions are characterized by demyelination, inflammation, relative axonal preservation, and gliosis (18, 29). Although gray matter (GM) involvement in MS has been acknowledged already more than a century ago (11, 17, 32), MS research has traditionally focused on white matter pathology during the last decades (19, 20, 29). Nevertheless, the presence of MS lesions involving the gray matter has been shown in both histopathological (7, 31) and imaging studies (9, 10, 15, 25) but the extent of cortical involvement has been largely underestimated (2, 15, 27). Different types of lesions were proposed according to lesion topography (2, 15). In general, cortical lesions were found to be less inflammatory than white matter lesions and it was thus suggested that different pathological pathways may lead to demyelination in different tissue compartments (3). Demyelination in white matter plaques is associated with axonal injury and destruction (16, 33). Similarly, axonal and dendritic transection and apoptotic loss of neurons were reported in cortical MS lesions (27). Although there is growing interest in cortical disease involvement in MS, its contribution to clinical symptoms and disease progression as well as the underlying pathological mechanisms leading to plaque formation is poorly understood.
The experimental autoimmune encephalomyelitis (EAE) model is the most widely investigated animal model of MS (12). Because of the structural and functional similarity to humans, induction of EAE in the common marmoset monkey (Callithrix jacchus) has turned out to be an attractive non‐human‐primate model for MS (13). Following immunization with recombinant myelin oligodendrocyte glycoprotein (1–125; rMOG) clinical signs appear after an asymptomatic period ranging between 2 and 15 weeks resulting in a primary progressive disease course which can last up to 20 weeks (6). Several studies applying histology and Magnetic Resonance Imaging (MRI) measurements revealed heterogeneity—as in humans—regarding the onset, location and subsequent development of white matter lesions (4, 14). The characteristic lesions in the white matter closely reflect the T cell plus antibody/complement immunopattern II of active MS lesions, which is the most frequent lesion type found in MS (20, 22).
Similar to MS, EAE studies have so far mainly focused on white matter pathology. This can be traced back to the fact that EAE in rodents predominantly affects the spinal cord but rarely the brain. Only very recently, neocortical demyelination resembling the topographically different cortical lesion types in MS were described in the marmoset EAE model (28). Comparative analysis of inflammatory infiltrates in cortical and white matter lesions revealed a considerably lower parenchymal density of inflammatory infiltrates in neocortical EAE lesions. It was speculated that differences of the blood brain barrier (3) might account for that difference. To further elucidate the pathophysiology of lesion evolvement in the primate neocortex, we explored the relation of inflammatory cellular density and activation status at perivascular and parenchymal lesion sites applying antibodies to T and B lympohcytes, MHC‐II expressing macrophages/microglial cells, and the macrophage early activation marker MRP‐14. We found that perivascular infiltrates were similar in density in white matter and neocortical lesions, but the fraction of macrophages/microglia expressing MRP‐14 was considerably lower in the neocortex. Furthermore, immunoglobulin and complement deposition could be detected perivascularly both in cortical and subcortical lesions but not in subpial demyelinated areas. Our findings support and extend the notion that local immune regulatory properties of CNS compartments might account for the relatively mild inflammatory infiltration observed in cortical lesions in MS.
MATERIAL AND METHODS
Animals. Four (311–450 g, two male, two female) common marmoset monkeys (Callithrix jacchus) were used for these experiments. The animals were obtained from the breeding colony at the German Primate Center in Göttingen, Germany and housed in pairs on a regular day/night cycle at 26°C and 55% relative humidity, with free access to food and water. Animal experiments were conducted in accordance with the European Communities Council Directive of November 24, 1986 (86/EEC) and were approved by the Government of Lower Saxony, Germany.
Sensitization procedure. For the induction of EAE, recombinant protein (rMOG) corresponding to the N‐terminal sequence of rat MOG (amino acids 1–125) was expressed in Escherichia coli and purified to homogeneity as previously described (1). The purified protein was dissolved in 6 M urea, dialyzed against 20 mM sodium acetate buffer (pH 3.0) to obtain a soluble preparation, and stored at −20°C. Marmosets were anaesthetized by intramuscular injection of Saffan (18 mg/kg), Valium (0.5 mg/kg), and Robinul (0.008 mg/kg), and received 500–600 µL of rMOG (250–300 µg/animal diluted in saline) emulsified in complete Freund’s adjuvant (CFA, Difco, Detroit, Michigan, USA) subcutaneously.
EAE evaluation. As first described by Villoslada et al (34) clinical signs of EAE were recorded daily by a trained and experienced observer using a grading scale system. The disability scoring method was further developed in our laboratory and included three main categories: (i) CNS related parameters; (ii) motor activity; and (iii) general condition and is described elsewhere in detail (4). At the time point of experimental termination, all four animals showed advanced neurological impairments as reflected in the disability grading scale.
Histopathology. After survival times of 4–8 weeks (average 6 weeks) the animals received an overdose of xylazin/ketamine and were perfused transcardially with 200 mL of saline followed by 400 mL of fixative containing 4% 0.1 M sodium‐phosphate‐buffered paraformaldehyde (pH 7.4). Animals were postfixed overnight in fresh fixative, and brains and spinal cords were dissected and embedded in paraffin. A total of nine paraffin tissue blocks comprising 12 brain sections were used for histological analysis. Histological evaluation was performed on 3 µm thick sections stained with hematoxylin‐eosin, Luxol fast blue and Bielschowsky silver impregnation to assess inflammation, demyelination and axonal pathology. Immunohistochemistry was performed after antigen‐unmasking microwave treatment for 15 minutes (800 W) in citrate buffer. Endogenous peroxidase activity was blocked by incubation in 3% H2O2 in PBS. Sections were blocked with 10% fetal calf serum in PBS for 10 minutes at RT. Washed sections were stained with the following primary antibodies: mouse anti‐human MRP14 (1 : 1000, BMA, Augst, Switzerland), mouse anti‐human human leukocyte antigen (HLA) DR+DP+DQ (clone CR3/43, referred to as CR3/43, 1 : 100, DAKO, Hamburg, Germany), mouse anti‐human CD3 (1 : 200, Serotec, Düsseldorf, Germany), mouse anti‐human CD20 (1 : 100; DAKO), rabbit anti‐human myelin basic protein (MBP) (1 : 2000, DAKO) or mouse anti‐MBP (SMI94, Sternberger Monoclonals Incorporated, Lutherville, Maryland, USA). Antibody extravasation was detected by isotype‐specific mouse anti‐human antibodies against IgM or IgG (1 : 50, DAKO). Deposition of activated complement was detected with rabbit anti‐rat C9 antibody (1 : 1000, kindly provided by Dr P. Morgan, Department of Biochemistry, Cardiff, Wales). Bound antibody was visualized either using an avidin‐biotin technique with 3,3′‐diaminobenzidine (DAB) or with Cy3‐ or Cy2‐conjugated goat‐anti rabbit IgG and donkey anti‐mouse IgG for fluorescence microscopy (all from Jackson, ImmunoResearch, West Grove, Pennsylvania, USA). Double labeling immunohistochemistry for light microscopy was performed by visualizing the first primary antibody using DAB as a chromogen, followed by detection of the second primary antibody using an alkaline phosphatase anti‐alkaline phosphatase technique with Fast Red. The demyelinating activity of EAE lesions was evaluated according to previously established criteria (8).
Morphometry. MRP14‐, CR3/43‐ and CD3‐positive cells were quantified in demyelinated areas (visualized by MBP immunohistochemistry) of cortical gray matter and subcortical white matter using a 10 × 10 field counting grid at a 400‐fold magnification. Inflammatory infiltrates were categorized into the following groups according to their localization: (i) subcortical perivascular; (ii) subcortical parenchymal; (iii) intracortical perivascular; and (iv) intracortical parenchymal. Perivascular infiltrates were defined as immunopositive cells localized at a maximal distance of three cell layers around vessels. Cells situated more than three cell layers away from a vessel were considered as parenchymal. For the quantification of inflammatory cell infiltrates a total of 42 cortical lesions and 91 white matter lesions were analyzed. For each animal and immunohistochemical staining, cell infiltrates in an area of ≥2.5 × 106 µm2 white matter and ≥3.7 × 105 µm2 neocortex were counted, respectively. The density of CD3+, CR3/43+ and MRP14+ cells is expressed as cells per mm2.
The contribution of different cortical lesion types to the total amount of cortical demyelination was determined as follows: overview photographs from MBP‐immunostained neocortex (>2.0 × 108 µm2) were systematically recorded by a CCD camera (Color View II, Soft imaging System®, Münster, Germany), independent of the presence of cortical demyelination. Neocortical demyelination was identified on digital images, classified according to its topography as described earlier (27) and measured using the Analysis Software Color View II (Soft imaging System®).
Data acquisition and statistical analysis. Digital images of tissue sections were acquired on an Olympus light‐/fluorescent microscope (Olympus optical CO.LTD) with a CCD camera. Data were analyzed and graphs were generated using GraphPad Prism version 4.00 for Windows (GraphPad Software, San Diego California, CA, USA). Student’s t‐test was applied to analyze differences between white matter lesions and cortical lesions in individual animals. Values are expressed as mean ± SEM unless stated otherwise.
RESULTS
Demyelination in MOG‐induced EAE in the common marmoset involves the cerebral cortex. Sharply demarcated, demyelinated lesions in the subcortical white matter could be detected in all animals by immunohistochemistry for MBP (Figure 1A). Ongoing active demyelination was evident in the majority of these lesions by the presence of MBP‐positive myelin degradation products within the macrophages (Figure 1A, upper inset). The deposition of both IgM and IgG was demonstrable within white matter plaques (data not shown). In general, white matter lesions resembled the MS pattern II lesional subtype with antibody/complement deposition (21, 22).
Figure 1.
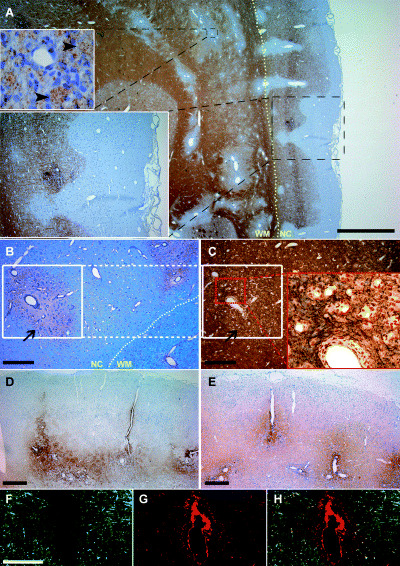
Neocortical demyelination in marmoset experimental autoimmune encephalomyelitis. (A) Immunhistochemical staining for myelin basic protein (MBP) reveals actively demyelinating white matter and cortical lesions topographically resembling type II (entirely intracortical) and type III (subpial) cortical lesions of MS patients. Foamy macrophages containing MBP‐positive myelin degradation products can be identified (upper inset). Adjacent sections stained for myelin (B, luxol fast blue) and axons (C, Bielschowsky silver impregnation) showing a representative area of type II cortical lesion (white square in B and C). Note that cortical demyelination (arrow in B and C) is not accompanied by an obvious reduction of axonal density. IgM (D) and IgG (E) deposition is apparent at perivascular but not along subpial cortical lesion areas. (F–H) Few perivascular demyelinated cortical lesions (F, MBP in green) show deposition of complement components (G, C9 in red). Overlay of myelin and C9 staining is shown in H. Yellow dotted line in (A) and (B) highlights the border between neocortex (NC) and white matter (WM). Scale bar in A = 1000 µm; B–E = 200 µm; F–G = 100 µm.
Three out of four immunized animals showed cortical demyelination (Figure 1A) with similar lesion distribution and extension as described recently (28). One animal with a mild disease course showed only very few perivascular spots of white matter infiltrates, and no demyelination in the neocortex. This latter animal was excluded from further analysis of cortical EAE lesions. According to the earlier described cortical lesion topography in MS patients (2, 15), three main cortical lesion types were observed in the marmosets (Figure 1A): (i) leukocortical lesions involving both white matter and neocortex (type I cortical lesion); (ii) entirely intracortical lesions (type II cortical lesion); and (iii) subpial lesions, extending from the pial surface into the neocortex (type III cortical lesion). Subpial demyelination was most prominent affecting large areas (3.3 ± 0.3 × 105 µm2; maximum 2.2 × 106 µm2) and accounting in average for 69.5% (animal 1: 69.6%, animal 2: 66.6%, animal 3: 72.5%) of total demyelinated neocortical area. Purely intracortical lesions accounted for 12.1% (animal 1: 0.01%, animal 2: 17.3%, animal 3: 18.9%) and leukocortical lesions for 18.3% (animal 1: 30.3%, animal 2: 16.1%, animal 3: 8.5%) of total demyelinated neocortical area. As in humans, the cortical lesions in the common marmosets appeared less destructive compared with white matter lesions, and axons were well preserved (Figure 1B,C). Intracortical deposition of IgM (Figure 1D) and IgG (Figure 1E) was in general perivascularly accentuated and associated with the presence of intracortical lesions (type II cortical lesions). In contrast, no deposition of immunoglobulins was observed at sites of subpial demyelination (type III cortical lesions). Perivascular immunoreactivity for complement C9 antigen on degenerating myelin sheaths was only rarely detectable, and mainly found around small intracortical vessels (Figure 1F–H).
Density of inflammatory infiltrates in cortical and white matter lesions. Inflammatory infiltrates were visualized immunohistochemically using anti‐CD3 (T cells), anti‐CD20 (B cells), anti‐CR3/43 (HLA expressing cells) and anti‐MRP14 (early activated macrophages/microglia cells) antibodies. To visualize the extension of gray matter lesions, immunostaining against MBP was performed on the same section. Cellular infiltrates were quantified and categorized according to their perivascular and parenchymal localization in subcortical white matter lesions and in demyelinated intracortical areas as described in Material and methods.
The inflammatory infiltrates were predominantly composed of activated MRP14+ macrophages/microglia (Figure 2A) and T cells (Figure 2B,C). Only few CD20+ B cells were detectable within the lesions (Figure 2D,E). In white matter lesions, MRP14+ cells frequently had the morphology of foamy macrophages with incorporated myelin debris (Figure 1A). In contrast, MRP14+ cells in the cerebral cortex showed almost exclusively stellate morphology suggestive of activated microglia cells (inset in Figure 2A). The density of perivascularly located MRP14+ cells was found to be significantly higher in a given animal in white matter than in cortical lesions (Figure 3A; Table 1). In the parenchyma, the density of MRP14+ cells was also significantly higher in subcortical white matter lesions than in cerebral cortex (Figure 3B). However, MRP14 is only expressed in early differentiation stages of monocytes and neutrophils (5), but cannot be detected in resting tissue macrophages (26, 30). Therefore, the observed difference between white matter and cortical lesions could reflect a difference in lesion acuity. To further elucidate this aspect, we performed immunostainings against CR3/43 which labels early and late activated macrophages/microglia cells. Densities of perivascular CR3/43‐positive macrophages/microglia were not different between white matter and neocortex (Table 1). However, in contrast, cell densities of CR3/43‐positive cells were significantly lower in the lesion parenchyma in the cerebral cortex than in the white matter (Table 1). To investigate whether the fraction of early activated (MRP 14+) cells was different between white matter and neocortex a ratio between MRP14‐positive cells and CR3/43‐positive cells was calculated (Figure 3E,F). The calculated ratios in perivascular and parenchymal lesion areas were significantly (P < 0.05) smaller in cerebral cortex than white matter in any given animal (Figure 3E,F). However, a considerable inter‐individual variability of the MRP14–CR3/43 ratio was observed in the lesion parenchyma between the different animals reflecting slight differences in lesion stage (Figure 3F).
Figure 2.
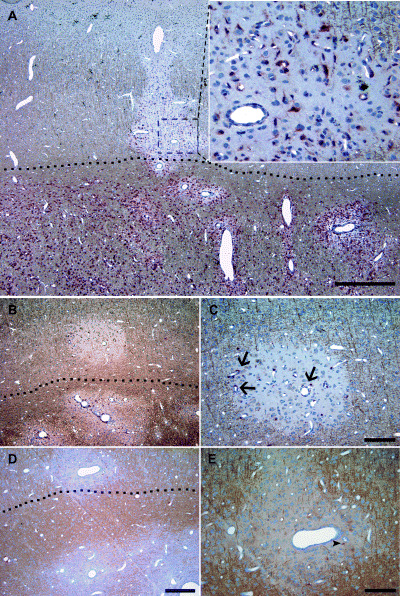
Cellular infiltrates in cortical and subcortical EAE lesions. (A–E) Double labeling for myelin basic protein (brown) and cellular infiltrates (red). (A) The border between white matter and neocortex is clearly respected with regard to the density of MRP14‐positive macrophages/microglia. MRP14‐positive cells in the cerebral cortex appeared stellate shaped resembling activated microglia cells (inset in A). As in white matter lesions, CD3‐positive T cells (B, C) are mainly situated perivascularly (arrow in C) and to a lesser extent dispersed in the lesion parenchyma. (D, E) B cells are only sporadically detected in cortical EAE (arrow head in E). Dashed lines in A, B and D delineate the border between white matter and neocortex. Scale bar in A = 1000 µm; B and D = 200 µm; C and E = 100 µm.
Figure 3.
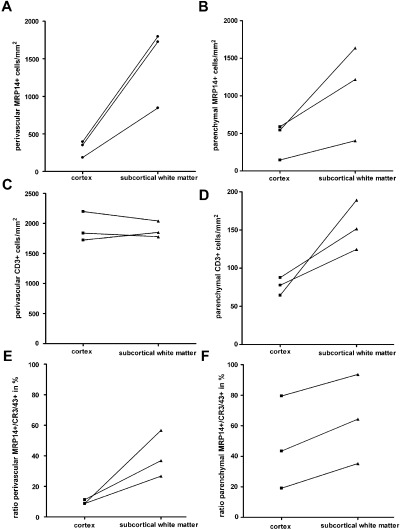
Densities of cellular infiltrates in neocortical compared with white matter lesions. Densities of cellular infiltrates were quantified in perivascular areas (A, C, E) and in the lesion parenchyma (B, D, F) in demyelinated neocortex and white matter as described in material and methods. Infiltrates of MRP14‐positive cells were significantly less dense in cerebral cortex compared with subcortical white matter in both perivascular (A) and parenchymal (B) lesion sites. Perivascular CD3‐positive T cells showed comparable densities in white matter and cortical lesions (C). However, in the lesion parenchyma, the densities of CD3‐positive T cells were considerably lower (D) in both cortical and white matter lesions (note the different scale bar in C). Although densities of white matter parenchymal T cells were consistently higher than in cortical parenchyma, a statistical significance was reached only in one of three animals. (E, F) The fraction of early activated MRP14‐positive macrophages in relation to the total number of macrophages/microglial cells (CR3/43‐positive cells) was calculated (ratio MRP14+/CR3/43+ in %).
Table 1.
Quantification of inflammatory infiltrates in demyelinated areas.
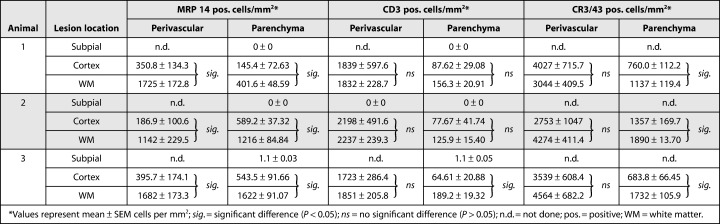
Densities of perivascular CD3+ T cells were found to be similar in white matter lesions and cortical lesions (Figure 3C). In the lesion parenchyma, mean CD3+ cell densities showed a trend toward higher T‐cell counts in white matter lesions in each individual animal but did reach statistical significance only in one of the marmosets (Table 1 and Figure 3D).
Inflammatory infiltrates (CD3, MRP14 and CR3/43) were extremely scarce in areas of subpial demyelination (Table 1).
DISCUSSION
In the present study, we identified cortical demyelination in three out of four marmosets immunized with recombinant MOG. Similar to cortical lesions detected in MS patients, the density of parenchymal infiltration in demyelinated neocortex was less pronounced, and axonal integrity appeared largely preserved in the marmoset EAE model. In general, densities of inflammatory infiltrates within the lesion parenchyma strictly respected the border between white matter and neocortex. This was particularly apparent in leukocortical lesions with involvement of both white matter and cerebral cortex (Figure 2a).
Although there is increasing interest in cortical disease involvement in MS, it is still unclear which pathological mechanisms contribute to plaque formation in the cortex. It was discussed that the lower inflammatory cell density within the cerebral cortex could be caused by differences in the blood brain barrier (3). Yet, densities of T cell infiltrates and CR3/43 expressing macrophages/microglia cells in the perivascular lesion area did not differ between cortex and white matter in the acute phase of demyelination in our study. This finding suggests that the initial ability of T cells and macrophages to invade into the CNS compartments does not differ substantially between neocortex and white matter in marmoset EAE. Assuming that cortical demyelination occurs within the same time frame as white matter lesions, the lower number of perivascular MRP14‐expressing macrophage/microglia in the neocortex indicate that the kinetics of macrophage activation could be substantially different in cortex than in white matter. One can speculate that anti‐inflammatory or immune‐modulating properties of neurons (23, 24) or differences in the cytoarchitecture of the cerebral cortex, such as the fewer (myelin‐) antigens that are present, may restrict the inflammatory response in time and severity (3). The consistently lower density of inflammatory infiltrates in the cortical lesion parenchyma indicates that the migration properties of inflammatory infiltrates within the cortical compartment are significantly altered.
Particularly in the case of extensive subpial lesions in MS, substances present in the cerebrospinal fluid (CSF) may mediate demyelination (2). Complement activation is known to occur in white matter MS lesions and is thought to be a marker of pathologic heterogeneity in MS (20). White matter lesions of MOG‐induced EAE in the common marmoset resemble the antibody/complement and T‐cell immunopattern (Type II) of MS lesions (22). Therefore, antibodies and complement are likely candidates in mediating cortical demyelinating pathology. In accordance, perivascular antibody deposition was detectable in some intracortical demyelinated lesions (Type II cortical lesions). However, in our histological analysis neither immunoglobulin nor C9 deposition could be detected in subpial demyelinated areas (Type III cortical lesions). This finding obviously challenges the role of antibodies and complement in the process of subpial demyelination. Other yet undefined molecules most likely diffusing from the cerebrospinal fluid may be involved in the process of subpial demyelination. Alternatively, the low myelin content at subpial locations may limit the detectability of complement and antibody deposition. Finally, it remains to be determined to what extent differences in pathology observed between type II and type III cortical lesions might also reflect differences in pathogenesis. In addition, it is important to note that our study focuses on demyelinating lesions in only the neocortex and subcortical white matter; conclusions on other putatively affected areas of gray matter in EAE or MS therefore can only be drawn with caution.
In summary, we could demonstrate that cellular composition and macrophage activation differ in neocortical and white matter EAE lesions in the marmoset supporting and extending findings in human MS brain tissue. MOG‐induced EAE in the marmoset thus mirrors cortical and white matter MS pathology (13) and can be regarded a highly useful tool for the elaboration of MRI contrasts enabling the in vivo detection of cortical pathology in MS and for the preclinical evaluation of therapies targeting cortical lesions.
ACKNOWLEDGMENTS
The authors are grateful to C. Heckmann for the behavioral scoring of the animals. This work was supported in part by the Institute for Multiple Sclerosis Research, Bereich Humanmedizin der Universität Göttingen und Gemeinnützige Hertie‐Stiftung, Göttingen, Germany, and the DFG Research Center Molecular Physiology of the Brain (CMPB). C.S. holds a grant from the Gemeinnützige Hertie‐Stiftung. C.S. and D.M. are supported by the Medical Faculty of the University of Goettingen (junior research group).
REFERENCES
- 1. Adelmann M, Wood J, Benzel I, Fiori P, Lassmann H, Matthieu J‐M, Gardinier MJ, Dornmair K, Linington C (1995) The N‐terminal domain of the myelin oligodendrocyte glycoprotein (MOG) induces acute demyelinating experimental autoimmune encephalomyelitis in the Lewis rat. J Neuroimmunol 63:17–27. [DOI] [PubMed] [Google Scholar]
- 2. Bo L, Vedeler CA, Nyland HI, Trapp BD, Mork SJ (2003) Subpial demyelination in the cerebral cortex of multiple sclerosis patients. J Neuropathol Exp Neurol 62:723–732. [DOI] [PubMed] [Google Scholar]
- 3. Bo L, Vedeler CA, Nyland H, Trapp BD, Mork SJ (2003) Intracortical multiple sclerosis lesions are not associated with increased lymphocyte infiltration. Mult Scler 9:323–331. [DOI] [PubMed] [Google Scholar]
- 4. Boretius S, Schmelting B, Watanabe T, Merkler D, Tammer R, Czéh B, Michaelis T, Frahm J, Fuchs E (2006) Monitoring of EAE onset and progression in the common marmoset monkey by sequential high‐resolution 3D MRI. NMR Biomed 19:41–46. [DOI] [PubMed] [Google Scholar]
- 5. Van Den Bos C, Roth J, Koch HG, Hartmann M, Sorg C (1996) Phosphorylation of MRP14, an S100 protein expressed during monocytic differentiation, modulates Ca(2+)‐dependent translocation from cytoplasm to membranes and cytoskeleton. J Immunol 156:1247–1254. [PubMed] [Google Scholar]
- 6. Brok HP, Bauer J, Jonker M, Blezer E, Amor S, Bontrop RE, Laman JD, ’t Hart BA (2001) Non‐human primate models of multiple sclerosis. Immunol Rev 183:173–185. [DOI] [PubMed] [Google Scholar]
- 7. Brownell B, Hughes JT (1962) The distribution of plaques in the cerebrum in multiple sclerosis. J Neurol Neurosurg Psychiatry 25:315–320. [DOI] [PMC free article] [PubMed] [Google Scholar]
- 8. Bruck W, Porada P, Poser S, Rieckmann P, Hanefeld F, Kretzschmar HA, Lassmann H (1995) Monocyte/macrophage differentiation in early multiple sclerosis lesions. Ann Neurol 38:788–796. [DOI] [PubMed] [Google Scholar]
- 9. Catalaa I, Fulton JC, Zhang X, Udupa JK, Kolson D, Grossman M, Wei L, McGowan JC, Polansky M, Grossman RI (1999) MR imaging quantitation of gray matter involvement in multiple sclerosis and its correlation with disability measures and neurocognitive testing. AJNR Am J Neuroradiol 20:1613–1618. [PMC free article] [PubMed] [Google Scholar]
- 10. Chen JT, Narayanan S, Collins DL, Smith SM, Matthews PM, Arnold DL (2004) Relating neocortical pathology to disability progression in multiple sclerosis using MRI. Neuroimage 23: 1168–1175. [DOI] [PubMed] [Google Scholar]
- 11. Dawson JW (1916) The histology of multiple sclerosis. Trans R Soc Edinburgh 50:517–740. [Google Scholar]
- 12. ’t Hart BA, Amor S (2003) The use of animal models to investigate the pathogenesis of neuroinflammatory disorders of the central nervous system. Curr Opin Neurol 16:375–383. [DOI] [PubMed] [Google Scholar]
- 13. ’t Hart BA, Bauer J, Muller HJ, Melchers B, Nicolay K, Brok H, Bontrop RE, Lassmann H, Massacesi L (1998) Histopathological characterization of magnetic resonance imaging‐detectable brain white matter lesions in a primate model of multiple sclerosis: a correlative study in the experimental autoimmune encephalomyelitis model in common marmosets (Callithrix jacchus). Am J Pathol 153:649–663. [DOI] [PMC free article] [PubMed] [Google Scholar]
- 14. ’t Hart BA, Vogels J, Bauer J, Brok HP, Blezer E (2004) Non‐invasive measurement of brain damage in a primate model of multiple sclerosis. Trends Mo. Med 10:85–91. [DOI] [PubMed] [Google Scholar]
- 15. Kidd D, Barkhof F, McConnell R, Algra PR, Allen IV, Revesz T (1999) Cortical lesions in multiple sclerosis. Brain 122:17–26. [DOI] [PubMed] [Google Scholar]
- 16. Kornek B, Lassmann H (1999) Axonal pathology in multiple sclerosis. A historical note. Brain Pathol 9:651–656. [DOI] [PMC free article] [PubMed] [Google Scholar]
- 17. Kutzelnigg A, Lassmann H (2005) Cortical lesions and brain atrophy in MS. J Neurol Sci 233:55–59. [DOI] [PubMed] [Google Scholar]
- 18. Lassmann H (1998) Neuropathology in multiple sclerosis: new concepts. Mult Scler 4:93–98. [DOI] [PubMed] [Google Scholar]
- 19. Lassmann H, Bruck W, Lucchinetti C (2001) Heterogeneity of multiple sclerosis pathogenesis: implications for diagnosis and therapy. Trends Mol Med 7:115–121. [DOI] [PubMed] [Google Scholar]
- 20. Lucchinetti CF, Bruck W, Rodriguez M, Lassmann H (1996) Distinct patterns of multiple sclerosis pathology indicates heterogeneity on pathogenesis. Brain Pathol 6:259–274. [DOI] [PMC free article] [PubMed] [Google Scholar]
- 21. Lucchinetti C, Bruck W, Parisi J, Scheithauer B, Rodriguez M, Lassmann H (2000) Heterogeneity of multiple sclerosis lesions: implications for the pathogenesis of demyelination. Ann Neurol 47: 707–717. [DOI] [PubMed] [Google Scholar]
- 22. Merkler D, Schmelting B, Czéh B, Fuchs E, Stadelmann C, Bruck W (2006) Myelin oligodendrocyte glycoprotein‐induced EAE in the common marmoset reflects the immunopathology of pattern II multiple sclerosis lesions. Mult Scler (in press). [DOI] [PubMed] [Google Scholar]
- 23. Neumann H (2001) Control of glial immune function by neurons. Glia 36:191–199. [DOI] [PubMed] [Google Scholar]
- 24. Neumann H, Misgeld T, Matsumuro K, Wekerle H (1998) Neurotrophins inhibit major histocompatibility class II inducibility of microglia: involvement of the p75 neurotrophin receptor. Proc Natl Acad Sci USA 95:5779–5784. [DOI] [PMC free article] [PubMed] [Google Scholar]
- 25. Newcombe J, Hawkins CP, Henderson CL, Patel HA, Woodroofe MN, Hayes GM, Cuzner ML, MacManus D, Du Boulay EP, McDonald WI (1991) Histopathology of multiple sclerosis lesions detected by magnetic resonance imaging in unfixed postmortem central nervous system tissue. Brain 114(Pt 1):1013–1023. [DOI] [PubMed] [Google Scholar]
- 26. Odink K, Cerletti N, Bruggen J, Clerc RG, Tarcsay L, Zwadlo G, Gerhards G, Schlegel R, Sorg C (1987) Two calcium‐binding proteins in infiltrate macrophages of rheumatoid arthritis. Nature 330:80–82. [DOI] [PubMed] [Google Scholar]
- 27. Peterson JW, Bo L, Mork S, Chang A, Trapp BD (2001) Transected neurites, apoptotic neurons, and reduced inflammation in cortical multiple sclerosis lesions. Ann Neurol 50:389–400. [DOI] [PubMed] [Google Scholar]
- 28. Pomeroy IM, Matthews PM, Frank JA, Jordan EK, Esiri MM (2005) Demyelinated neocortical lesions in marmoset autoimmune encephalomyelitis mimic those in multiple sclerosis. Brain 128:2713–2721. [DOI] [PubMed] [Google Scholar]
- 29. Prineas JW (1985) The neuropathology of multiple sclerosis. In: Handbook of Clinical Neurology, Demyelinating Diseases. Vinken PJ, Bruyn GW, Kawans HL, Koetsier JC (eds). Elsevier Science Publisher, Amsterdam/New York. 3(47):213–257.
- 30. Roth J, Goebeler M, Van Den BC, Sorg C (1993) Expression of calcium‐binding proteins MRP8 and MRP14 is associated with distinct monocytic differentiation pathways in HL‐60 cells. Biochem Biophys Res Commun 191:565–570. [DOI] [PubMed] [Google Scholar]
- 31. Schwab C, McGeer PL (2002) Complement activated C4d immunoreactive oligodendrocytes delineate small cortical plaques in multiple sclerosis. Exp Neurol 174:81–88. [DOI] [PubMed] [Google Scholar]
- 32. Taylor EW (1892) Zur pathologischen Anatomie der multiplen Sklerose. Dtsch Z Nervenheilkd 5:1–26. [Google Scholar]
- 33. Trapp BD, Peterson J, Ransohoff RM, Rudick R, Mork S, Bo L (1998) Axonal transection in the lesions of multiple sclerosis. N Engl J Med 338:278–285. [DOI] [PubMed] [Google Scholar]
- 34. Villoslada P, Hauser SL, Bartke I, Unger J, Heald N, Rosenberg D, Cheung SW, Mobley WC, Fisher S, Genain CP (2000) Human nerve growth factor protects common marmosets against autoimmune encephalomyelitis by switching the balance of T helper cell type 1 and 2 cytokines within the central nervous system. J Exp Med 191:1799–1806. [DOI] [PMC free article] [PubMed] [Google Scholar]