


Abstract
The nucleocapsid (NC) protein plays key roles in Human Immunodeficiency Virus 1 (HIV-1) replication, notably by condensing and protecting the viral RNA genome and by chaperoning its reverse transcription into double-stranded DNA (dsDNA). Recent findings suggest that integration of viral dsDNA into the host genome, and hence productive infection, is linked to a small subpopulation of viral complexes where reverse transcription was completed within the intact capsid. Therefore, the synthesized dsDNA has to be tightly compacted, most likely by NC, to prevent breaking of the capsid in these complexes. To investigate NC’s ability to compact viral dsDNA, we here characterize the compaction of single dsDNA molecules under unsaturated NC binding conditions using nanofluidic channels. Compaction is shown to result from accumulation of NC at one or few compaction sites, which leads to small dsDNA condensates. NC preferentially initiates compaction at flexible regions along the dsDNA, such as AT-rich regions and DNA ends. Upon further NC binding, these condensates develop into a globular state containing the whole dsDNA molecule. These findings support NC’s role in viral dsDNA compaction within the mature HIV-1 capsid and suggest a possible scenario for the gradual dsDNA decondensation upon capsid uncoating and NC loss.
INTRODUCTION
The nucleocapsid (NC) protein of Human Immunodeficiency Virus 1 (HIV-1) is a small structural protein (55 amino acids) that has two zinc-finger motifs of the CCHC type, bridged by a small basic linker and flanked by poorly folded N- and C-terminal domains (Figure 1A) (1). This protein is derived from the Gag polyprotein, which is sequentially cleaved by proteases into the matrix (MA), capsid (CA) and NC proteins (2–6). As a result of this cleavage, about 1500–2400 NC proteins are found in the infectious viral particles, where they coat, condense and protect the dimeric genomic RNA (gRNA) within the viral capsid (7–10). NC is also endowed with nucleic acid binding and chaperone (NAC) activity that allows NC to promote the thermodynamically most stable conformations of both DNA and RNA (7,11–13). This NAC activity relies on the ability of NC to weakly destabilize the secondary structure of NAs mainly through its zinc fingers, promote NA aggregation mainly through its linker and basic N-terminal domain and its rapid on-and-off binding kinetics (14–17). Through its NAC activity, NC plays a key role in promoting the initiation and the two obligatory (and about ten random) strand transfer events in the reverse transcription process where the gRNA is converted into the viral dsDNA (vDNA) (7,12,18,19).
Figure 1.

(A) Amino acid sequence of NC, including its two CCHC-zinc fingers. (B and C) Schematic illustrations of the two nanofluidic chip designs used in this study. (B) Static channel system. This channel system consists of pairs of microchannels, spanned by an array of straight nanochannels, 500 μm long, 100 nm deep and 150 nm wide. The cartoon (left) shows DNA confined inside a nanochannel. DNA will be partially stretched along the nanochannel, with an extension R||, shorter than its contour length L. The fluorescence image (right) shows a YOYO-1 stained DNA molecule confined in a nanochannel. The scale bar is 1 μm. (C) Dynamic channel system. The channel system consists of two pairs of microchannels. The pair for DNA in and out is spanned by an array of nanochannels at the center with a depth of 100 nm, a width of 100 nm and a length of 500 μm, with reaction chambers in the central region (100 μm in length, 300 nm in width and 130 nm in depth). The pair of microchannels for protein in and out is connected by a nanoslit (width = 60 μm, depth = 30 nm) that runs across the reaction chamber orthogonally. The inset shows a zoom of the reaction chamber region.
Reverse transcription and capsid uncoating were until very recently considered to happen only in the cytoplasm of infected cells. However, recent studies have shown that the small (∼2%) sub-population of mature HIV-1 capsids which leads to viral dsDNA integration and productive infection completes the synthesis of its full length viral dsDNA and the subsequent capsid disassembly near the integration sites in the nucleus (20–23). In contrast to the flexible ssRNA and ssDNA, dsDNA is rigid and would never fit into the small conical capsid with average diameter ∼50 nm, similar to the dsDNA persistence length, without being tightly compacted by a condensing agent. Therefore, the only way the mature HIV capsid can survive the complete proviral dsDNA synthesis inside its very small volume is the presence of high concentrations of NC, leading to strong dsDNA condensation (24).
The nucleic acid condensing agent in HIV-1 is the NC protein which is at ∼10 mM in the intact mature capsid, as can be estimated from the number of NC proteins found in viral particles and the volume of the capsid (VCA ∼ πr2.h = π.252.80 nm3 = 1.5 × 10⁵ nm3). The only way for NC to escape an intact capsid and thus reduce its concentration would be through the capsid pores. Recently, these pores were extensively studied both experimentally and computationally (25) and were found to be too small (∼8 Å) even for the smallest proteins, such as NC, to escape, but large enough to allow small ions and dNTPs required for reverse transcription to go in and out. Hence, by condensing viral dsDNA, NC could prevent premature uncoating of the capsid before reverse transcription is completed, and regulate uncoating timing with respect to the reverse transcription process.
Single molecule methods have been extensively used to study the interaction of NC and Gag with both DNA and RNA. Notably, single molecule fluorescence resonance energy transfer was performed on doubly-labelled DNA sequences immobilized on a glass surface to investigate the nucleic acid destabilization (26–30) and bending activity of NC (31,32). In addition, the NAC activity of NC and Gag proteins was also thoroughly investigated by the Williams group using optical tweezers to stretch single DNA molecules or unfold individual RNA hairpins (17,33–37). These studies provided major conclusions on the NC-induced nucleic acid destabilization and aggregation as well as on binding kinetics. Comparison of Gag and NC also revealed that the two proteins share the same NAC mechanism (38), but that NC has a stronger NAC activity as compared to Gag, while the latter exhibits stronger binding and aggregation capabilities (39).
We recently used nanofluidic channels for characterizing, at the single DNA molecule level, the interactions of both Gag and NC with dsDNA (40). The main asset compared to traditional single DNA molecule techniques is that long DNA (>10 kb) can be stretched in the nanochannels without attaching handles to any of the DNA ends (41). This means that any DNA can be stretched and that interactions occurring at the ends of dsDNA can be investigated (42,43). In our previous study, we demonstrated that the NC protein, as well as Gag, can compact and finally condense long dsDNA (40). Full DNA condensation happened at about a ratio of 1 protein to 5 DNA bp. We could also visualize, using a dsDNA with short complementary single stranded overhangs, the NAC activity of NC and Gag by the formation of circular dsDNA and dsDNA concatemers via annealing of the 12 bp single-stranded overhangs of the dsDNA used.
The strength of NC-induced dsDNA compaction, the size of the dsDNA globule, the kinetics of its formation and its de-condensation upon capsid uncoating and loss of NC are all open questions that have not been addressed experimentally. This study strives to fill that gap by studying the equilibrium and kinetic properties of dsDNA compaction by the wild type HIV-1 at sub-saturating concentrations of less than 1 NC per 5 bp that were previously shown to fully condense dsDNA (40). We characterize preformed complexes at equilibrium, but also use a dynamic nanofluidic device (44,45) to visualize the formation of locally compacted regions along dsDNA in real time after NC is added at saturating concentrations. Using fluorescently labeled NC, we were also able to identify DNA-bound NC clusters that over time develop into dsDNA condensates.
MATERIALS AND METHODS
Protein purification
NC was synthesized by solid-phase peptide synthesis on a 433A synthesizer (ABI, Foster City, CA), as previously described (46). To label NC by Cy3, 2.5 eq. (0.0625 mmol) of Cyanine3 NHS-ester were dissolved in 300 μL of N-methyl-2-pyrrolidone (NMP) and then added to the Fmoc-deprotected peptidylresin (0.025 mmol) swelled in 300 μL of NMP. After two minutes of shaking, 2 eq. of N,N-diisopropylethylamine (DIEA) solution were added. Then, the reaction mixture was shaken overnight at 37°C. The resin was filtered and washed with methanol and dichloromethane. The zinc-bound form of NC was prepared by dissolving the lyophilized protein in water, adding a 2.5-fold molar excess of zinc sulphate, and raising the pH to 7.5 by adding 25 mM Tris buffer. The NC concentration was determined by using an absorption coefficient of 5.7 × 10³ M−1 cm−1 at 280 nm. The labeling did not significantly affect the propensity of NC to form local globules on DNA (Supplementary Figure S1, Supporting Information).
Nanofluidic devices
Two different nanofluidic device designs were used to perform the single DNA molecule experiments and were fabricated using advanced nanofabrication as described elsewhere (44,47). To avoid non-specific binding of the basic protein to the negatively charged channel walls, the channels were prior to the experiments coated with a lipid bilayer comprising 99% 1-palmitoyl-2-oleoyl-sn-glycero-3-phosphocholine (POPC, Avanti) and 1% N-(fluorescein-5-thiocarbamoyl)-1,2-dihexadecanoyl-sn-glycero-3-phosphoethanolamine, triethylammonium salt (fluorescein- DHPE, Invitrogen). The coating procedure is described elsewhere (48).
Static channel system
The single DNA molecule experiments with pre-incubated samples were all performed in nanochannels with a depth of 100 nm and a width of 150 nm. A schematic illustration of the static channel system is shown in Figure 1B. The channel system consists of a pair of feeding channels (micron sized), spanned by a set of parallel nanochannels. The samples were loaded into the channel system from one of the four reservoirs that are connected to the feeding channels and moved into the nanochannels by pressure-driven (N2) flow. One hundred subsequent images were recorded for each molecule.
Dynamic channel system
The single DNA molecule experiments for real time studies of DNA-NC interactions were all performed in the dynamic channel system schematically shown in Figure 1C. The channel system consists of two parallel microchannels connected by an array of nanochannels with a depth of 100 nm, a width of 100 nm and a length of 500 μm, except for the middle region spanning 100 μm in length (the reaction chamber), where the width is 300 nm and the depth is 130 nm. In addition, a pair of microchannels on each side of the nanochannel array are connected by a nanoslit (width = 60 μm, depth = 30 nm) that runs across the reaction chamber orthogonally. The DNA samples were loaded in one of the reservoirs connected to the nanochannel array, from where the DNA can be flushed into the nanochannels. The NC-protein solution was loaded in one or several of the reservoirs connected to the nanoslit, from where they were flushed across the reaction chambers through the nanoslit. The flow of DNA and protein within the nanofluidic system was controlled by pressure-driven (N2) flow.
Sample preparation
DNA from phage T7 (T7-DNA, 39.4 kbp MABION, Konstantynów Łódzki, Poland) and phage λ (λ-DNA, 48.5 kbp, Roche, Basel, Switzerland) was used in this study. For experiments in the static channel system, DNA was first mixed with the NC protein at ratios of 50:1 or 17:1 (bp:protein) and then YOYO-1 was added. To minimize the effect of YOYO-1 on DNA conformation, the ratio of the staining was kept at one dye molecule per 50 bp, that has previously been shown to have a minimal effect on the properties of dsDNA (49,50). The resulting complexes were incubated at 4°C for at least 2 h. The complexes were then introduced into the nanofluidic system and equilibrated for 60 s before image capture at room temperature. The DNA concentration was 5 μM (base-pairs) in all samples. For the optical mapping assay, λ-DNA was pre-stained with YOYO-1 (Invitrogen, Waltham, MA, USA) at a molar ratio of one dye per 14 bp and with netropsin (Sigma-Aldrich, St. Louis, MO, USA) at a molar ratio of 200:1 with respect to YOYO-1. For experiments in the dynamic channel system, 10 μM NC protein was used and added to individually confined pre-stained dsDNA molecules (1:50 YOYO-1 to bp ratio). For all experiments, 3% (v/v) β-mercaptoethanol (Sigma-Aldrich, St. Louis, MO, USA) was added as an oxygen scavenger to suppress oxygen radical induced photo-damage of the DNA. The buffer used was 25 mM Tris with 30 mM NaCl and 0.2 mM MgCl2 (pH 7.5). In such low salt HIV-1 NC binds dsDNA with sub μM Kd (51). Therefore, even at our lowest NC concentration of 0.1 μM, corresponding to 1:50 NC:bp, a large fraction of the added protein is dsDNA-bound. Therefore, the level of dsDNA saturation with NC in all our experiments is defined by the nominal protein:bp ratio.
Nanofluidics experiments
The dsDNA and dsDNA–protein complexes were imaged using an epifluorescence microscope (Zeiss AxioObserver.Z1) equipped with SPECTRA X light engine (Lumencor), an EMCCD camera (Photometrics Evolve), a 63 × oil immersion TIRF objective (NA = 1.46) and a 1.6× optovar from Zeiss. For experiments with unlabeled NC where only YOYO-1 was used to stain DNA, a dichroic beam-splitter was used with a cut-off wavelength at 500 nm, a bandpass filter in the 475/40 wavelength region as an excitation filter and an emission filter in the 530/50 wavelength region. For experiments with Cy3-labeled NC, in addition to the beam-splitter for YOYO-1, a dichroic beam-splitter with a cut-off wavelength at 570 nm, a bandpass filter in the 545/25 wavelength region as an excitation filter and 605/70 wavelength region as an emission filter were used for Cy3. A dual-channel imaging function was used to record the YOYO-1 and Cy3 signal by shifting between the two dichroic beam-splitters frame by frame. The exposure time of all the recorded images was 100 ms.
Data analysis
Data analysis for DNA extension was performed using custom-written MATLAB-based software. Microscopy image stacks were used as input to the program. Images were first binarized by thresholding with a global average plus onefold of standard deviation. Kymographs were generated by stacking one-dimensional representations of each image on top of each other. Taking advantage of the high contrast of the YOYO-1-stained DNA fluorescence images, regions with higher brightness were directly considered as DNA objects without additional image filtering. These regions persist throughout the movie of each molecule and are hence easily detected in the kymographs and separated from thermal fluctuations. The lowest increase in intensity that was identified as a local condensate was ∼30% brighter in emission intensity than the surrounding DNA backbone (Supplementary Figure S2, Supporting Information). The fractions of DNA with different numbers of local condensates or bound NC were counted by hand. Errors were calculated as standard deviation (SD) between different repeats. Finally, the lengths of the DNA molecules were extracted by identifying the longest axis of the objects and the length was measured. The intensity profiles were generated by using Fiji software (https://fiji.sc/), and then normalized by subtracting the average background intensity. For experiments with Cy3-labeled NC, two series of images for two different channels (YOYO-1 and Cy3) were generated from each recording, and then merged using Fiji software for further analysis. All the histograms were fitted with Gaussian distributions. In total, at least 200 DNA molecules were analyzed for each sample concentration. For experiments using the dynamic channels, kymographs were generated using the Fiji software. The aligned kymographs were generated using custom-written MATLAB-based software. In the experiment to determine the sequence selectivity of NC-binding, we rotated each molecule so that the binding site was located in the first half of the molecule. The calculation of the theoretical intensity profile for DNA labelled with YOYO-1 and netropsin is described elsewhere (52). The sequence of λ-DNA was downloaded from the NCBI GenBank.
Data can be provided via the corresponding author upon reasonable request.
RESULTS
The goal of the study was to investigate the binding of the NC protein to single long dsDNA molecules at concentrations where the DNA is not saturated, using nanofluidic channels. For the first section of the paper we used unlabeled protein and YOYO-1 as a reporter of the formation of local regions of compacted DNA induced by NC and in the later parts we used a fluorescently labeled NC protein.
NC induces local compaction along DNA
To investigate the first steps of compaction of long dsDNA, we incubated T7-DNA (blunt ends) or λ-DNA (12 nt ssDNA overhangs) with unlabeled NC at ratios of 1:50 or 1:17 (protein:bp) and stained the DNA with YOYO-1. For both T7- and λ-DNA, and at both NC:bp ratios used, local regions with a higher emission intensity were observed along the DNA contour. Figure 2A–C shows representative images of the YOYO-1 intensity profile along λ-DNA molecules, clearly highlighting the regions of local compaction with a higher YOYO-1 emission intensity (more examples in Supplementary Figure S2, Supporting Information). These regions were never observed without NC (Supporting Supplementary Figure S2), and we conclude that they are due to local compaction of dsDNA by NC. Importantly, since the recorded emission is from YOYO-1 bound to DNA, these regions have a distinctly higher dsDNA content indicating a local dsDNA condensate. Since there is a direct correlation between the amount of DNA in the compaction and the emission intensity, the observed variations in emission intensity indicate that the size of the local condensates varies.
Figure 2.

(A–C) Representative intensity profiles of λ-DNA with 1 (A), 2 (B) and 3 (C) local condensates. Insets show fluorescence snapshot images of YOYO-1 stained λ-DNA with corresponding local condensates. The scale bars are 2 μm. (D, E) Number of local condensates along blunt ended T7-DNA (D), and λ-DNA with 12 bp overhangs (E), in the presence of 0.1 μM (black) or 0.3 μM (gray) NC, with 5 μM DNA (in bp). As these concentrations are above Kd, these conditions correspond to 1 NC molecule bound per 50 or 17 bp, respectively, as indicated in panels A and B. Values are expressed as mean  SD.
SD.
Figure 2D and E show the number of local condensates along the DNA contour for two sub-saturating NC:bp ratios 1:50 and 1:17 at a DNA concentration of 5 μM (bp). For T7-DNA, ∼14% of the DNA molecules had one local condensate at the lower concentration, and only ∼1.5% had more than one. When increasing the NC concentration, the number of molecules with local condensates increased to ∼56% with one local condensate and ∼18% with more than one (∼16% with two and ∼2% with three). We never observed DNA molecules with more than three local condensates. Similar results were observed when changing the DNA from T7-DNA to λ-DNA, but with more molecules with one local condensate (∼19% at 1:50 and ∼63% at 1:17) and fewer molecules with more condensates (∼5% for 1:50 and ∼8% for 1:17 with two local condensates and ∼1.5% for 1:17 with three local condensates).
To further characterize the initiation of local compaction, we focused on DNA molecules with one local condensate. The fluorescence images directly give us the information where along the DNA contour these local condensates were located. We divided these molecules into two groups, in which the local compaction occurred ‘at the end’ or ‘in the center’, where we define compaction ‘at the end’ as a condensate at one end of the DNA and the rest of the molecules as ‘in the center’. Figure 3A shows images of DNA molecules belonging to both groups (more examples in Supplementary Figure S2, Supporting Information). A larger fraction of molecules with compaction at one end was observed for T7 DNA (∼47%), compared to λ-DNA (∼28%) (Figure 3B), but for both DNAs the number of condensates at the ends is larger than what would be expected if the process was random (each compaction at an end constitutes 2–3 pixels and the DNA is 30–35 pixels long, meaning that both ends make up 12–20% of the contour). Figure 3C–F compare the extension of λ-DNA without and with local condensates. The extension of bare DNA without NC was (6.0 ± 0.6 μm) and we observed a similar extension for the DNA molecules with NC present, but where we do not observe local condensates (6.2 ± 0.7 μm). When we observed local condensates, a similar decrease in extension was observed for compaction at the end (5.3  0.8 μm) and in the center (5.1
  0.8 μm). Thus, with one local condensate, the extension of DNA decreased by ∼10–20%, suggesting that the local condensate contained 5–10 kb of the 48.5 kb of λ-DNA. In other words, the total length of dsDNA contained within the local condensate at an NC:bp ratio of 1:50 was ∼5–10 kb.
Figure 3.
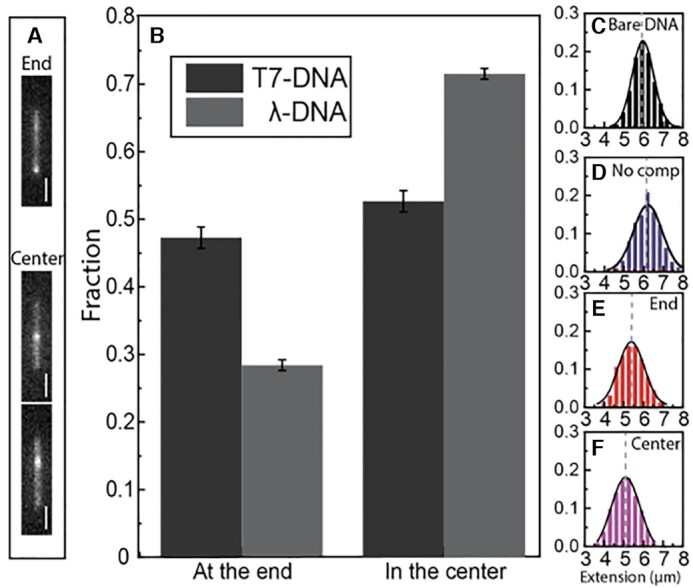
(A) Fluorescence images of YOYO-1 stained λ-DNA with local condensate at the end (top) or in the center (bottom). The scale bars are 2 μm. (B) Distribution of DNAs with local condensate at the ends or in the center at an NC concentration of 0.1 μM with 5 μM DNA (1:50 NC:bp ratio). Values are expressed as mean SD. (C) Distribution in the extension of bare λ-DNA without NC protein. Distribution in the extension of λ-DNA without visible local condensate (D) and with visible local condensate at the end (E) or in the center (F), at the same NC concentration as in A and B.
Real-time visualization of compaction initiation
To further investigate the local dsDNA compaction by NC, we used a novel nanofluidic device where the protein can be added to DNA in real time (44) (Figure 1C, see Materials and Methods for details). The device consists of a reaction chamber where the dsDNA is entropically trapped and an orthogonal slit that is too shallow to let the dsDNA escape, but where the NC protein can be added. Single dsDNA molecules, pre-stained with YOYO-1, were introduced into the reaction chamber and then 10 μM NC was slowly flushed across the reaction chamber. The results are presented in Figure 4A and D as kymographs (additional example in Supplementary Figure S3, Supporting Information). These kymographs are formed by collapsing each frame of the movie into a 1D intensity trace and stacking these traces on top of each other. The dsDNA was locally compacted (visible after ca 23 s in Figure 4A, white arrow) and finally fully condensed by the NC protein (after ca 60 s, Figure 4A). The full condensation was completed in approximately 1 minute. Local sites of compaction along the DNA contour were observed before condensation both in the center (Figure 4A) or at the end (Figure 4D) of the DNA contour. Figure 4B shows the intensity profile in Figure 4A as a 3D surface plot of the time period when the local condensate appeared, showing that they were formed in seconds. Figure 4Ci–iii) shows the YOYO-1 intensity profiles along the DNA molecule in Figure 4A before local compaction (Figure 4Ci), after local compaction (Figure 4Cii) and when fully condensed (Figure 4Ciii). On rare occasions we did observe, as in Figure 4E, that the local condensate dissolved after some time and then reformed at another place along the contour.
Figure 4.

Real-time visualization of DNA compaction by NC. (A) Kymograph of YOYO-1 stained λ-DNA when 10 μM NC is added in the dynamic nanochannel device. The DNA molecule is compacted and finally condensed by NC, starting in the center of the molecule (white arrow). (B) 3D surface plot of 6 seconds at the start of the formation of the local condensate, corresponding to the dashed square in (A). The color code corresponds to the emission intensity. (C) Normalized intensity profiles of DNA at the corresponding times in the kymograph in A. (D) As in A, but for a DNA molecule where the local condensate is formed at the end. (E) As in A, but for a DNA molecule where the local condensate resolves and subsequently reforms during the compaction process. The horizontal scale bars are 2 μm.
NC clustering on DNA before compaction
Next we were interested in NC binding before the sites of local compaction are visible. To study this, we added Cy3-labeled NC to λ-DNA. We first noted that the number of local condensates and their distribution between ends and internal regions of DNA was the same with and without labeling. At an NC:bp ratio of 1:50 (0.1 μM NC), a majority of the DNA molecules had no visible local condensate (Figure 2A). However, we found that >80% of the dsDNA molecules had clear evidence of NC bound as a cluster within a single particular region along the dsDNA molecule (Figure 5A) without any associated visible dsDNA compaction. The extension of the dsDNA molecules with NC clusters, but with no visible local compaction, was very similar to the extension of λ-DNA in the absence of NC, suggesting that compaction had not started (Figure 5C–E). Figure 5F shows snapshots of single λ-DNA molecules with one or two clusters of bound NC, but without visible local condensates. Interestingly, ∼33% of these NC binding events occurred at the end of the λ-DNA (Figure 5B), a percentage similar to the distribution of DNA condensates (∼28%) at the DNA ends with non-fluorescent NC at the same 1:50 NC:bp ratio (Figure 3B). For the small fraction of DNA molecules (<25%) with local condensate at a particular dsDNA site, we always detected NC associated at that site (Figure 5G), confirming that NC causes the compaction. One more group of molecules was detected with one or more locally compacted sites with NC clusters bound and at least one other site where NC was clustered but did not induce any visible local compaction (Figure 5H).
Figure 5.

(A) Distribution of λ-DNA molecules with or without clustered NC bound at an NC:bp ratio of 1:50. (B) Distribution of λ-DNAs with clustered NC bound at the ends or in the center, but no visible local condensate. (C–E) Distribution in the extension of λ-DNA without NC binding (C) and with NC clusters at the end (D) or in the center (E), but no local condensate. (F) Fluorescence images of YOYO-1 stained DNA with Cy3-labeled NC bound, but no local condensate. The same molecule is shown in each image pair. Left image: fluorescence image of YOYO-1 stained λ-DNA (grey), right image: YOYO-1 stained λ-DNA (blue) with Cy3-labeled NC (white). (G) Fluorescence images of YOYO-1 stained DNA with Cy3-labeled NC with NC bound and a local condensate at the same position. (H) Fluorescence images of YOYO-1 stained DNA with Cy3-labeled NC bound at both a local condensate and elsewhere. The scale bars are 1 μm. (I) Ratio of the total intensity of the NC emission from the sites of NC accumulation with no visible local DNA compaction and the sites of NC accumulation with local DNA compaction for the 11 molecules in total containing both types of NC binding. The box is determined by the 25th and 75th percentiles and the whiskers are determined by the 5th and 95th percentiles. The line in the box is the median value and the square symbol in the box is the mean value.
The small group of DNA molecules (11 in total) with NC clustered both at locally compacted and non-compacted sites (Figure 5H), allowed us to compare directly how much protein is bound at each site. For each individual molecule, we measured the emission intensity of the NC clusters with and without visible local compaction. By comparing NC sites on the same DNA molecule, we avoided any bias due to the photobleaching or uneven illumination. For all molecules, the fluorescence intensity of NC cluster from the site with no visible local compaction was on average about half compared to the locally compacted DNA site (Figure 5I).
A closer look at the fraction of molecules from Figure 5 where NC was bound, but where no local compaction was visible, indicated that the location of the binding along the dsDNA was not random. To locate the binding position of NC on dsDNA, we measured the distance of the binding position from the closest dsDNA end. The resulting boxplot of the position of the NC binding on dsDNA (Figure 6A) showed two clear clusters. These clusters were located ∼27% and ∼50% from the end of the DNA. For the analysis in nanochannels, we have no control of which end of the DNA that enters the channels first. The binding site ∼27% into the contour of the DNA could thus be on either end of the λ-DNA. We speculate that it is on the side of the DNA that is AT-rich since the very center of λ-DNA is also AT-rich (Figure 6B, shaded grey areas). To further demonstrate that the binding at the position ∼27% into the contour is indeed on the AT-rich side of λ-DNA, we used an optical DNA mapping assay. This assay is based on competitive binding between the fluorescent dye YOYO-1 and the AT-selective molecule netropsin (52,53). Netropsin prevents YOYO-1 binding on AT-rich sites, which means that AT-rich regions appear darker than GC-rich regions. Figure 6C shows fluorescence images of netropsin/YOYO-1 stained λ-DNA and Cy3-labeled NC. The DNA molecules with NC bound at the 27%-position all had NC bound at the region with low YOYO-1 fluorescence intensity, which supports that the binding is indeed at the AT-rich side.
Figure 6.

(A) Boxplot of the position of the bound NC along λ-DNA at an NC concentration of 0.1 μM with 5 μM DNA (in bp), (1:50 NC:bp ratio). The position is defined as the closest distance to one of the DNA ends. (B) Theoretical barcode of optical mapping of λ-DNA, in which AT-rich regions have low emission intensity and GC-rich high emission. (C) Pairs of images of the same molecule with and without the Cy3-NC signal. Left: fluorescence image of netropsin/YOYO-1 stained λ-DNA (grey), right: netropsin/YOYO-1 stained λ-DNA (blue) with Cy3-labelled NC (white). The scale bars are 1 μm.
DNA annealing does not directly lead to DNA compaction
In our previous report, we found that NC can, in addition to condensing the DNA, also anneal the 12 nt ssDNA overhangs of λ-DNA and promote DNA concatemer formation (40). In that study, we observed this as an increase in the number of concatemers and circles of λ-DNA in the presence of NC. Here, we were interested in investigating how the annealing is related to the formation of local condensates. First, the NC-induced ssDNA annealing process was investigated in real time in the dynamic nanofluidic device (44) in a reaction chamber where two (Figure 7A) or three (Figure 7B) λ-DNA molecules were located. The NC-induced formation of concatemers can be seen as the initially separated DNA molecules combined into a larger DNA complex in the reaction chamber. Such concatemer-formation was not observed without NC present (not shown). Next we wanted to understand how this annealing of the complementary ssDNA overhangs by NC correlates with the formation of the local condensates. To address this question, we focused on DNA concatemers formed with Cy3-labeled NC in the static device. Figure 7C shows snapshots of DNA concatemers at the low NC:DNA bp ratio of 1:50. If NC had annealed ssDNA and stayed bound to the annealed region, NC should be observed in the middle (concatemer formed by two DNA molecules) or evenly spaced along the concatemers (concatemer formed by three or more DNA molecules) (42). However, this was not observed. Rather, for most concatemers, no bound NC was observed. A small fraction of concatemers had NC clustered on it, but not at the junctions where the annealing had happened. Importantly, this experiment shows the ability of NC to facilitate ssDNA annealing even at subsaturating concentrations that do not lead to major DNA condensation. It, however, does not exclude the possibility of yet stronger annealing facilitation by saturating amounts of NC where condensation occurs.
Figure 7.

(A-B) Kymographs of YOYO-1 stained λ-DNA in the dynamic nanofluidic device with 10 μM NC added in the reaction chamber, showing how the 12 nt overhangs anneal in presence of the protein. (C) Fluorescence images of YOYO-1 stained λ-DNA concatemers with and without the Cy3 signal, the same molecule is shown in each image pair at 1 NC to 50 bp. Left: fluorescence image of YOYO-1 stained λ-DNA (grey), right: YOYO-1 stained λ-DNA (blue) with Cy3-labelled NC (white). The dashed boxes mark out the junctions of the annealed λ-DNA concatemers. The scale bars are 2 μm.
DISCUSSION
This study provides a detailed characterization of the initial steps of dsDNA compaction by NC. It is well established that NC condenses nucleic acids, as revealed, for example, via electron microscopy and light scattering (8,9,54,55), but these studies have focused mainly on single-stranded nucleic acids, as the gRNA and its complementary ssDNA are the substrates for the reverse transcription, and their aggregation by NC constitutes a major component of NC’s ability to facilitate this process. Studies on dsDNA with single molecule analysis have mainly focused on the NAC activity of NC (26–35). However, recent studies suggest that NC’s ability to condense viral dsDNA may be critical for HIV-1 infectivity. Indeed, according to in cell studies (20–23), productive infection requires that the synthesis of viral dsDNA is completed in the nucleus while still inside the mature HIV-1 capsid. The high concentration of NC in the capsid likely facilitates this process by condensing dsDNA and this study characterizes this condensation process in detail.
NC forms local condensates on dsDNA
We investigated dsDNA compaction by NC well below the saturating amount of 1 NC per 5 bp that is expected to condense the whole dsDNA into a tight globule (40). At subsaturating amounts of NC, we observe the formation of one or a few finite size condensates that coexist with uncondensed dsDNA within individual DNA molecules at equilibrium. A single finite size NC-induced dsDNA globule reduced the apparent length of the λ-DNA by ∼5–10 kb, suggesting that this is the dsDNA length within the single globule under these conditions. If NC compacts the rigid dsDNA similarly to other multivalent cations (56), i.e. by winding onto itself into a compact toroidal globule with an average radius R on the order of the dsDNA persistence length (∼50 nm), then the length of the dsDNA wound into a single circumference of such a toroid (∼2πR ∼ 300 nm) would be ∼900 bp. Hence, the NC-condensed dsDNA globules that we observe at low NC concentrations at equilibrium are expected to have ∼5–10 dsDNA turns around their circumference.
Using fluorescently labeled NC we visualized the NC distribution before visible compaction. Instead of distributing evenly along the dsDNA molecule, NC appears clustered in one or a few dsDNA regions. This is quite unexpected, as NC is known to bind nucleic acids with no or limited cooperativity (57–60). A likely explanation of NC clustering on dsDNA at unsaturated conditions is that it is associated with, and driven by, the local dsDNA compaction. Indeed, if NC can drive strong local dsDNA compaction, the total system free energy can be lowered by creating NC-saturated and compacted regions in equilibrium with NC-free uncondensed regions within the same dsDNA molecule.
Approximately 80% of the observed clusters of fluorescent NC at low ratios were not associated with visible dsDNA intensity increase and/or with measurable overall DNA shortening. Moreover, on the rare occasions when two NC clusters were observed on the same DNA molecule, with one cluster associated with visible DNA compaction and one not, the former NC cluster was typically twice brighter and hence contained twice the amount of NC molecules. Thus, the larger NC cluster was associated with a larger DNA condensate that appeared visible, while the smaller cluster was associated with a smaller DNA condensate which we could not resolve, as its YOYO-1 fluorescence was not sufficiently different from the background of uncondensed DNA.
Local compaction by NC preferentially initiates in flexible regions of dsDNA
A significant fraction of the initial globule nucleation events occured at the DNA ends for dsDNA with or without 12 nt overhangs. A probable explanation is that nucleation of the dsDNA globule driving NC accumulation and associated with a strong local dsDNA bending is easier at the DNA ends. Consistent with this hypothesis, formation of local DNA compaction by another chaperone protein, the intrinsically disordered HCVcp from the HCV virus, showed a near 100% preference for DNA ends of both T7 and λ-DNA (45). A similar behavior was observed for the small cationic molecule spermidine (44).
In addition to the preferred NC-dsDNA clustering (at low NC:bp) at the DNA ends, we also observed cluster formation within the AT-rich regions of λ-DNA. This agrees with the notion that it is easier to nucleate dsDNA compaction at flexible regions of the DNA since AT-rich sequences are known to have the highest flexibility (53). This result provides additional support for our hypothesis that the NC clustering on particular dsDNA sites prior to visible dsDNA compaction at these sites is driven by NC-induced local dsDNA condensation, associated with strong local dsDNA bending.
The chaperone activity of NC is not directly correlated with condensation
In our earlier study, we demonstrated that NC chaperones the annealing of ssDNA overhangs to form DNA concatemers (40). Here we demonstrate that we can follow this well studied NA annealing activity of NC (16,57,61,62) at the single DNA molecule level in real time. Importantly, the annealing occurs at NC concentrations lower than the ones that drive dsDNA compaction. This is consistent with stronger NC binding to ssDNA overhangs than to dsDNA (57). This means that the ssDNA overhangs can be NC-saturated, and their annealing strongly facilitated, under conditions where the NC-dsDNA binding is low and condensation does not occur. Since we do not observe any NC accumulation at the sites of annealed overhangs, NC, most likely, redistributes over the whole dsDNA contour at undetectably small levels after the annealing is completed.
Biological implications of the local dsDNA compaction by NC
The ability of NC to condense dsDNA appears crucial in the viral life cycle since for the small fraction of intact HIV-1 viral cores that enter the nucleus, the full viral dsDNA is synthesized in the nucleus prior to capsid disassembly (20–22). This is in contrast to the great majority of the viral cores that disassemble in the cytoplasm, leading to incomplete reverse transcription, and loss of infectivity. In the latter viral cores, we can hypothesize that once a small hole appears in the capsid structure, the small NC protein, that is otherwise contained within the intact core at ∼10 mM concentration, leaks out leading to dsDNA de-condensation, that in turn leads to complete disruption of the capsid. It is thus critical to understand the mechanism, the strength and the kinetics of the dsDNA condensation and decondensation by the NC protein.
Our results support the notion that saturating levels of NC can efficiently and rapidly (i.e. within seconds) condense the whole dsDNA molecule into a compact globule. This compaction is also important for viral dsDNAs which are synthesized with several gaps during reverse transcription (63). Indeed if the distance between these gaps along dsDNA is much larger than the dsDNA persistence length, which is just ∼150 bp, these ssDNA gaps will have no effect on the overall dsDNA stiffness and dsDNA packaging into the mature capsid. Our data also suggest that NC-induced dsDNA condensation is able of clustering the otherwise noncooperative NC into the dsDNA globule with saturated amounts of NC bound, while the rest of the dsDNA is left protein-free. A gradual de-condensation of the viral dsDNA accompanying NC loss after the appearance of a hole in the capsid may be important for facilitating capsid disassembly, for example by the stiff dsDNA breaking the capsid (23).
The experiments in the dynamic devic demonstrates that the NAC activity of NC and the condensation propensity are decoupled, and also that the binding is dynamic. We do not observe the NC protein bound at the dsDNA regions where the NAC process had occurred at equilibrium, this means that NC does the annealing, then dissociates, and then forms the local condensates elsewhere on the DNA.
The biophysics of the formation of NC-induced local dsDNA condensates
It is interesting to understand the NC-induced transition from extended dsDNA to compact globule as a phase separation inside a single polymeric molecule. While our study does not provide information on the physical nature of the NC-induced dsDNA condensation, our observations are consistent with the dsDNA condensation mode typical of other multivalent cations with a charge larger than +3 (56). The characteristic feature of the multivalent cation-induced condensation of dsDNA is the requirement of the complete dsDNA saturation with the condensing agent (56,64–66). Cation-induced dsDNA nucleation has a typical first order phase transition kinetics, related to the nucleation barrier associated with the high surface tension of small dsDNA globules (67,68). However, smaller dsDNA globules co-existing with uncondensed dsDNA have not been observed, except for a single molecule study of spermidine-induced condensation of a 166 kb-long T4-DNA (65), indicating that a sufficiently strong dsDNA compaction by the condensing agent can drive its phase separation into globular regions and uncondensed regions. This result is analogous to the finding of the present work and our two recent studies on the hepatitis C virus core protein (45) and the PrgB protein from the type IV secretion system of Gram positive bacteria (69). Here, for the first time, we visualize partitioning of NC into the globular part of the long dsDNA molecule at low NC saturation levels. The finite equilibrium size of the NC-induced dsDNA globule is likely defined by the balance between the free energy cost of NC partitioning, and the free energy benefit of forming the globule. This is in contrast to what happens with saturating amounts of NC that always lead to infinite growth of the globule leading to a cooperative coil-to-globule transition in the whole dsDNA molecule.
The observed condensation properties of NC are in line with a counterion-correlation induced mechanism of dsDNA self-attraction (70,71). This mechanism requires complete dsDNA charge neutralization with non-specifically electrostatically bound and highly mobile multivalent cations. While on the dsDNA surface, these multivalent cations form a pattern of excessive positive (from cations) and negative (from the DNA surface) charges on the overall neutral dsDNA, leading to ionic crystal-type attraction between two such dsDNA surfaces (72,71). Alternative mechanisms can also be envisioned. Indeed, though NC has an effective charge of +3.5 (57,59,72), it is not just a simple multivalent cation, but has two aromatic residues in its two structured zinc fingers able of stacking interactions with unpaired NA bases. We cannot exclude NC-DNA interactions beyond non-specific electrostatic ones, that could, potentially, lead to NC-induced dsDNA crosslinking and compaction. This alternative mechanism would, probably, not require dsDNA saturation with NC and not lead to dsDNA compaction to a maximal density globule. Future studies will, hopefully, be able to distinguish between the different possible mechanisms of NC-induced dsDNA compaction.
Nanofluidics as a tool to study DNA–protein interactions
In addition to revealing important features of the NC-induced dsDNA condensation, our study highlights the usefulness of nanofluidic devices for analyzing DNA-protein interactions. We are able to simultaneously fluorescently monitor both NC and dsDNA and observe protein-induced sub-molecular phase transitions in individual dsDNA molecules. As our nanofluidic channels present a unique way allowing long single DNA molecules to be visualized without any tethers at their ends we are able to show the preference for the dsDNA ends (either with or without 12 ss overhang) as a site of the NC-induced dsDNA globule formation. Of particular interest from a methodology point of view is the experiment in Figure 7 where we visualize the annealing of the single stranded overhangs of λ-DNA in real time. This is the first experiment of this kind in nanofluidic channels and is made possible in the novel dynamic nanofluidic device where protein can be added to already confined DNA. Reactions occurring on DNA ends, and in particular when two ends meet are difficult to study using traditional techniques for analyzing long DNA molecules but are of relevance, for example, in repair of DNA double stranded breaks (42,43).
CONCLUSIONS
To conclude, we use stretching of single dsDNA-protein complexes to understand the compaction of dsDNA by NC. We follow the process from initial unsaturated NC-dsDNA binding to fully compacted dsDNA and conclude that it proceeds via NC partitioning into finite sized equilibrium NC-induced dsDNA globules at preferred sites of easier dsDNA bending (either at the dsDNA ends or at AT-rich internal dsDNA sequences) at unsaturated NC concentrations. Moreover, we are able to follow the kinetics of the NC-induced dsDNA coil-to-globule transition, after the abrupt introduction of saturating amounts of NC that happens on the time scale of seconds, and leads to whole dsDNA transition from the completely extended to the completely globular state. This highly compact globular state and its associated meachanism of formation are thought to be relevant for the NC-coated viral dsDNA in the infectious viral capsids that are competent for integration into the host genome.
Supplementary Material
ACKNOWLEDGEMENTS
Y.M. is grateful to the Institut Universitaire de France (IUF) for support and providing additional time to be dedicated to research. We acknowledge Dr Yii-Lih Lin and the group of Prof. Tobias Ambjörnsson at Lund University for constructing the image analysis software.
Contributor Information
Kai Jiang, Division of Chemical Biology, Department of Biology and Biological Engineering, Chalmers University of Technology, Gothenburg SE 412 96, Sweden.
Nicolas Humbert, Laboratoire de Bioimagerie et Pathologies, UMR 7021 CNRS, Université de Strasbourg, Faculté de Pharmacie, Illkirch F 67401, France.
Sriram K.K., Division of Chemical Biology, Department of Biology and Biological Engineering, Chalmers University of Technology, Gothenburg SE 412 96, Sweden.
Ioulia Rouzina, Department of Chemistry and Biochemistry, The Ohio State University, Center for Retroviral Research, and Center for RNA Biology, Columbus, OH 43210, USA.
Yves Mely, Laboratoire de Bioimagerie et Pathologies, UMR 7021 CNRS, Université de Strasbourg, Faculté de Pharmacie, Illkirch F 67401, France.
Fredrik Westerlund, Division of Chemical Biology, Department of Biology and Biological Engineering, Chalmers University of Technology, Gothenburg SE 412 96, Sweden.
SUPPLEMENTARY DATA
Supplementary Data are available at NAR Online.
FUNDING
Swedish Research Council [2015-5062]; Olle Engqvist Byggmästare foundation and the European Research Council, in the form of an ERC consolidator grant [nanoDNArepair, 866238 to F.W.]; K.J. has a personal grant from the Wenner-Gren Foundation; Centre National de la Recherche Scientifique (to Y.M.). Funding for open access charge: European Research Council.
Conflict of interest statement. None declared.
REFERENCES
- 1. Darlix J.-L., Lapadat-Tapolsky M., de Rocquigny H., Roques B.P.. First glimpses at structure-function relationships of the nucleocapsid protein of retroviruses. J. Mol. Biol. 1995; 254:523–537. [DOI] [PubMed] [Google Scholar]
- 2. Campbell S., Rein A.. In vitro assembly properties of human immunodeficiency virus type 1 Gag protein lacking the p6 domain. J. Virol. 1999; 73:2270–2279. [DOI] [PMC free article] [PubMed] [Google Scholar]
- 3. Ganser B.K. Assembly and analysis of conical models for the HIV-1 core. Science. 1999; 283:80–83. [DOI] [PubMed] [Google Scholar]
- 4. Ganser-Pornillos B.K., Yeager M., Sundquist W.I.. The structural biology of HIV assembly. Curr. Opin. Struct. Biol. 2008; 18:203–217. [DOI] [PMC free article] [PubMed] [Google Scholar]
- 5. Adamson C.S., Freed E.O.. Human immunodeficiency virus type 1 assembly, release, and maturation. Adv. Pharmacol. 2007; 55:347–387. [DOI] [PubMed] [Google Scholar]
- 6. Pettit S.C., Lindquist J.N., Kaplan A.H., Swanstrom R.. Processing sites in the human immunodeficiency virus type 1 (HIV-1) Gag-Pro-Pol precursor are cleaved by the viral protease at different rates. Retrovirology. 2005; 2:12–16. [DOI] [PMC free article] [PubMed] [Google Scholar]
- 7. Darlix J., Godet J., Ivanyi-Nagy R., Fossé P., Mauffret O., Mély Y.. Flexible nature and specific functions of the HIV-1 nucleocapsid protein. J. Mol. Biol. 2011; 410:565–581. [DOI] [PubMed] [Google Scholar]
- 8. Stoylov S.P., Vuilleumier C., Stoylova E., De Rocquigny H., Roques B.P., Gérard D., Mély Y.. Ordered aggregation of ribonucleic acids by the human immunodeficiency virus type 1 nucleocapsid protein. Biopolymers. 1997; 41:301–312. [DOI] [PubMed] [Google Scholar]
- 9. Cam E.Le, Coulaud D., Delain E., Petitjean P., Roques B.P., Gérard D., Stoylova E., Vuilleumier C., Stoylov S.P., Mély Y.. Properties and growth mechanism of the ordered aggregation of a model RNA by the HIV-1 nucleocapsid protein: an electron microscopy investigation. Biopolymers. 1998; 45:217–229. [DOI] [PubMed] [Google Scholar]
- 10. Benjamin J., Ganser-Pornillos B.K., Tivol W.F., Sundquist W.I., Jensen G.J.. Three-dimensional structure of HIV-1 virus-like particles by electron cryotomography. J. Mol. Biol. 2005; 346:577–588. [DOI] [PMC free article] [PubMed] [Google Scholar]
- 11. Rein A., Henderson L.E., Levin J.G.. Nucleic-acid-chaperone activity of retroviral nucleocapsid proteins: significance for viral replication. Trends Biochem. Sci. 1998; 23:297–301. [DOI] [PubMed] [Google Scholar]
- 12. Levin J.G., Guo J., Rouzina I., Musier-Forsyth K.. Nucleic acid chaperone activity of HIV-1 nucleocapsid protein: critical role in reverse transcription and molecular mechanism. Prog. Nucleic Acid Res. Mol. Biol. 2005; 80:217–286. [DOI] [PubMed] [Google Scholar]
- 13. Godet J., Mély Y.. Biophysical studies of the nucleic acid chaperone properties of the HIV-1 nucleocapsid protein. RNA Biol. 2010; 7:687–699. [DOI] [PubMed] [Google Scholar]
- 14. Bernacchi S., Stoylov S., Piémont E., Ficheux D., Roques B.P., Darlix J.L., Mély Y.. HIV-1 nucleocapsid protein activates transient melting of least stable parts of the secondary structure of TAR and its complementary sequence. J. Mol. Biol. 2002; 317:385–399. [DOI] [PubMed] [Google Scholar]
- 15. Beltz H., Clauss C., Piémont E., Ficheux D., Gorelick R.J., Roques B., Gabus C., Darlix J.-L., de Rocquigny H., Mély Y.. Structural determinants of HIV-1 nucleocapsid protein for cTAR DNA binding and destabilization, and correlation with inhibition of self-primed DNA synthesis. J. Mol. Biol. 2005; 348:1113–1126. [DOI] [PubMed] [Google Scholar]
- 16. Godet J., Ramalanjaona N., Sharma K.K., Richert L., de Rocquigny H., Darlix J.-L., Duportail G., Mély Y.. Specific implications of the HIV-1 nucleocapsid zinc fingers in the annealing of the primer binding site complementary sequences during the obligatory plus strand transfer. Nucleic Acids Res. 2011; 39:6633–6645. [DOI] [PMC free article] [PubMed] [Google Scholar]
- 17. Wu H., Mitra M., McCauley M.J., Thomas J.A., Rouzina I., Musier-Forsyth K., Williams M.C., Gorelick R.J.. Aromatic residue mutations reveal direct correlation between HIV-1 nucleocapsid protein's nucleic acid chaperone activity and retroviral replication. Virus Res. 2013; 171:263–277. [DOI] [PMC free article] [PubMed] [Google Scholar]
- 18. Thomas J.A., Gorelick R.J.. Nucleocapsid protein function in early infection processes. Virus Res. 2008; 134:39–63. [DOI] [PMC free article] [PubMed] [Google Scholar]
- 19. Darlix J.L., De Rocquigny H., Mély Y.. The multiple roles of the nucleocapsid in retroviral RNA conversion into proviral DNA by reverse transcriptase. Biochem. Soc. Trans. 2016; 44:1427–1440. [DOI] [PubMed] [Google Scholar]
- 20. Burdick R.C., Li C., Munshi M.H., Rawson J.M.O., Nagashima K., Hu W.S., Pathak V.K.. HIV-1 uncoats in the nucleus near sites of integration. Proc. Natl. Acad. Sci. U.S.A. 2020; 117:5486–5493. [DOI] [PMC free article] [PubMed] [Google Scholar]
- 21. Dharan A., Bachmann N., Talley S., Zwikelmaier V., Campbell E.M.. Nuclear pore blockade reveals that HIV-1 completes reverse transcription and uncoating in the nucleus. Nat. Microbiol. 2020; 5:1088–1095. [DOI] [PMC free article] [PubMed] [Google Scholar]
- 22. Selyutina A., Persaud M., Lee K., KewalRamani V., Diaz-Griffero F.. Nuclear import of the HIV-1 core precedes reverse transcription and uncoating. Cell Rep. 2020; 32:108201. [DOI] [PMC free article] [PubMed] [Google Scholar]
- 23. Zila V., Margiotta E., Turonova B., Müller T.G., Zimmerli C.E., Mattei S., Allegretti M., Börner K., Rada J., Müller B.et al.. Cone-shaped HIV-1 capsids are transported through intact nuclear pores. Cell. 2021; 184:1032–1046. [DOI] [PMC free article] [PubMed] [Google Scholar]
- 24. Rouzina I., Bruinsma R.. DNA confinement drives uncoating of the HIV Virus. Eur. Phys. J. Spec. Top. 2014; 223:1745–1754. [Google Scholar]
- 25. Xu C., Fischer D.K., Rankovic S., Li W., Dick R.A., Runge B., Zadorozhnyi R., Ahn J., Aiken C., Polenova T.et al.. Permeability of the HIV-1 capsid to metabolites modulates viral DNA synthesis. PLoS Biol. 2020; 18:e3001015. [DOI] [PMC free article] [PubMed] [Google Scholar]
- 26. Cosa G., Harbron E.J., Zeng Y., Liu H.W., O’Connor D.B., Eta-Hosokawa C., Musier-Forsyth K., Barbara P.F.. Secondary structure and secondary structure dynamics of DNA hairpins complexed with HIV-1 NC protein. Biophys. J. 2004; 87:2759–2767. [DOI] [PMC free article] [PubMed] [Google Scholar]
- 27. Cosa G., Zeng Y., Liu H.W., Landes C.F., Makarov D.E., Musier-Forsyth K., Barbara P.F.. Evidence for non-two-state kinetics in the nucleocapsid protein chaperoned opening of DNA hairpins. J. Phys. Chem. B. 2006; 110:2419–2426. [DOI] [PubMed] [Google Scholar]
- 28. Liu H.W., Cosa G., Landes C.F., Zeng Y., Kovaleski B.J., Mullen D.G., Barany G., Musier-Forsyth K., Barbara P.F.. Single-molecule FRET studies of important intermediates in the nucleocapsid-protein-chaperoned minus-strand transfer step in HIV-1 reverse transcription. Biophys. J. 2005; 89:3470–3479. [DOI] [PMC free article] [PubMed] [Google Scholar]
- 29. Liu H.W., Zeng Y., Landes C.F., Yoen J.K., Zhu Y., Ma X., Vo M.N., Musier-Forsyth K., Barbara P.F.. Insights on the role of nucleic acid/protein interactions in chaperoned nucleic acid rearrangements of HIV-1 reverse transcription. Proc. Natl. Acad. Sci. U.S.A. 2007; 104:5261–5267. [DOI] [PMC free article] [PubMed] [Google Scholar]
- 30. Zeng Y., Liu H.W., Landes C.F., Yoen J.K., Ma X., Zhu Y., Musier-Forsyth K., Barbara P.F.. Probing nucleation, reverse annealing, and chaperone function along the reaction path of HIV-1 single-strand transfer. Proc. Natl. Acad. Sci. U.S.A. 2007; 104:12651–12656. [DOI] [PMC free article] [PubMed] [Google Scholar]
- 31. Wang H., Yeh Y.S., Barbara P.F.. HIV-1 nucleocapsid protein bends double-stranded nucleic acids. J. Am. Chem. Soc. 2009; 131:15534–15543. [DOI] [PubMed] [Google Scholar]
- 32. Wang H., Musier-Forsyth K., Falk C., Barbara P.F.. Single-molecule spectroscopic study of dynamic nanoscale DNA bending behavior of HIV-1 nucleocapsid protein. J. Phys. Chem. B. 2013; 117:4183–4196. [DOI] [PMC free article] [PubMed] [Google Scholar]
- 33. Williams M.C., Rouzina I., Wenner J.R., Gorelick R.J., Musier-Forsyth K., Bloomfield V.A.. Mechanism for nucleic acid chaperone activity of HIV-1 nucleocapsid protein revealed by single molecule stretching. Proc. Natl. Acad. Sci. U.S.A. 2001; 98:6121–6126. [DOI] [PMC free article] [PubMed] [Google Scholar]
- 34. Williams M.C., Gorelick R.J., Musier-Forsyth K.. Specific zinc-finger architecture required for HIV-1 nucleocapsid protein's nucleic acid chaperone function. Proc. Natl. Acad. Sci. U.S.A. 2002; 99:8614–8619. [DOI] [PMC free article] [PubMed] [Google Scholar]
- 35. Cruceanu M., Gorelick R.J., Musier-Forsyth K., Rouzina I., Williams M.C.. Rapid kinetics of protein–nucleic acid interaction is a major component of HIV-1 nucleocapsid protein's nucleic acid chaperone function. J. Mol. Biol. 2006; 363:867–877. [DOI] [PubMed] [Google Scholar]
- 36. Cruceanu M. Nucleic acid binding and chaperone properties of HIV-1 Gag and nucleocapsid proteins. Nucleic Acids Res. 2006; 34:593–605. [DOI] [PMC free article] [PubMed] [Google Scholar]
- 37. Wu H., Mitra M., Naufer M.N., McCauley M.J., Gorelick R.J., Rouzina I., Musier-Forsyth K., Williams M.C.. Differential contribution of basic residues to HIV-1 nucleocapsid protein's nucleic acid chaperone function and retroviral replication. Nucleic Acids Res. 2014; 42:2525–2537. [DOI] [PMC free article] [PubMed] [Google Scholar]
- 38. Karnib H., Nadeem M.F., Humbert N., Sharma K.K., Grytsyk N., Tisné C., Boutant E., Lequeu T., Réal E., Boudier C.et al.. The nucleic acid chaperone activity of the HIV-1 Gag polyprotein is boosted by its cellular partner RPL7: a kinetic study. Nucleic Acids Res. 2020; 48:9218–9234. [DOI] [PMC free article] [PubMed] [Google Scholar]
- 39. Cruceanu M., Urbaneja M.A., Hixson C.V., Johnson D.G., Datta S.A., Fivash M.J., Stephen A.G., Fisher R.J., Gorelick R.J., Casas-Finet J.R.et al.. Nucleic acid binding and chaperone properties of HIV-1 Gag and nucleocapsid proteins. Nucleic Acids Res. 2006; 34:593–605. [DOI] [PMC free article] [PubMed] [Google Scholar]
- 40. Jiang K., Humbert N., Kk S., Lequeu T., Lin Y.L., Mely Y., Westerlund F.. Annealing of ssDNA and compaction of dsDNA by the HIV-1 nucleocapsid and Gag proteins visualized using nanofluidic channels. Q. Rev. Biophys. 2019; 52:e2. [DOI] [PubMed] [Google Scholar]
- 41. Frykholm K., Nyberg L.K., Westerlund F.. Exploring DNA–protein interactions on the single DNA molecule level using nanofluidic tools. Integr. Biol. 2017; 9:650–661. [DOI] [PubMed] [Google Scholar]
- 42. Öz R., Wang J.L., Guerois R., Goyal G., KK S., Ropars V., Sharma R., Koca F., Charbonnier J., Modesti M.et al.. Dynamics of Ku and bacterial non-homologous end-joining characterized using single DNA molecule analysis. Nucleic Acids Res. 2021; 49:2629–2641. [DOI] [PMC free article] [PubMed] [Google Scholar]
- 43. Öz R., Howard S.M., Sharma R., Törnkvist H., Ceppi I., Sriram K.K., Kristiansson E., Cejka P., Westerlund F.. Phosphorylated CtIP bridges DNA to promote annealing of broken ends. Proc. Natl. Acad. Sci. U.S.A. 2020; 117:21403–21412. [DOI] [PMC free article] [PubMed] [Google Scholar]
- 44. Öz R., Kk S., Westerlund F.. A nanofluidic device for real-time visualization of DNA-protein interactions on the single DNA molecule level. Nanoscale. 2019; 11:2071–2078. [DOI] [PubMed] [Google Scholar]
- 45. Sharma R., KK S., Holmstrom E.D., Westerlund F.. Real-time compaction of nanoconfined DNA by an intrinsically disordered macromolecular counterion. Biochem. Biophys. Res. Commun. 2020; 118:218a. [DOI] [PMC free article] [PubMed] [Google Scholar]
- 46. Shvadchak V., Sanglier S., Rocle S., Villa P., Haiech J., Hibert M., Van Dorsselaer A., Mély Y., de Rocquigny H.. Identification by high throughput screening of small compounds inhibiting the nucleic acid destabilization activity of the HIV-1 nucleocapsid protein. Biochimie. 2009; 91:916–923. [DOI] [PubMed] [Google Scholar]
- 47. Persson F., Tegenfeldt J.O.. DNA in nanochannels—directly visualizing genomic information. Chem. Soc. Rev. 2010; 39:985. [DOI] [PubMed] [Google Scholar]
- 48. Persson F., Fritzsche J., Mir K.U., Modesti M., Westerlund F., Tegenfeldt J.O.. Lipid-based passivation in nano fluidics. Nano Lett. 2012; 12:2260–2265. [DOI] [PMC free article] [PubMed] [Google Scholar]
- 49. Kundukad B., Cong P., Van Der Maarel J.R.C., Doyle P.S.. Time-dependent bending rigidity and helical twist of DNA by rearrangement of bound HU protein. Nucleic Acids Res. 2013; 41:8280–8288. [DOI] [PMC free article] [PubMed] [Google Scholar]
- 50. Nyberg L., Persson F., Åkerman B., Westerlund F.. Heterogeneous staining: a tool for studies of how fluorescent dyes affect the physical properties of DNA. Nucleic Acids Res. 2013; 41:e184. [DOI] [PMC free article] [PubMed] [Google Scholar]
- 51. Stewart-Maynard K.M., Cruceanu M., Wang F., Vo M.-N., Gorelick R.J., Williams M.C., Rouzina I., Musier-Forsyth K.. Retroviral nucleocapsid proteins display nonequivalent levels of nucleic acid chaperone activity. J. Virol. 2008; 82:10129–10142. [DOI] [PMC free article] [PubMed] [Google Scholar]
- 52. Nilsson A.N., Emilsson G., Nyberg L.K., Noble C., Stadler L.S., Fritzsche J., Moore E.R.B., Tegenfeldt J.O., Ambjörnsson T., Westerlund F.. Competitive binding-based optical DNA mapping for fast identification of bacteria - multi-ligand transfer matrix theory and experimental applications on Escherichia coli. Nucleic Acids Res. 2014; 42:e118. [DOI] [PMC free article] [PubMed] [Google Scholar]
- 53. Müller V., Karami N., Nyberg L.K., Pichler C., Torche Pedreschi P.C., Quaderi S., Fritzsche J., Ambjörnsson T., Åhrén C., Westerlund F.. Rapid tracing of resistance plasmids in a nosocomial outbreak using optical DNA mapping. ACS Infect. Dis. 2016; 2:322–328. [DOI] [PubMed] [Google Scholar]
- 54. Mirambeau G., Lyonnais S., Coulaud D., Hameau L., Lafosse S., Jeusset J., Justome A., Delain E., Gorelick R.J., Le Cam E.. Transmission electron microscopy reveals an optimal HIV-1 nucleocapsid aggregation with single-stranded nucleic acids and the mature HIV-1 nucleocapsid protein. J. Mol. Biol. 2006; 364:496–511. [DOI] [PubMed] [Google Scholar]
- 55. Krishnamoorthy G., Roques B., Darlix J.L., Mely Y.. DNA condensation by the nucleocapsid protein of HIV-1: a mechanism ensuring DNA protection. Nucleic Acids Res. 2003; 31:5425–5432. [DOI] [PMC free article] [PubMed] [Google Scholar]
- 56. Bloomfield V.A. DNA condensation by multivalent cations. Biopolymers. 1997; 44:269–282. [DOI] [PubMed] [Google Scholar]
- 57. Vo M.-N., Barany G., Rouzina I., Musier-Forsyth K.. Effect of Mg2+ and Na+ on the nucleic acid chaperone activity of HIV-1 nucleocapsid protein: implications for reverse transcription. J. Mol. Biol. 2009; 386:773–788. [DOI] [PMC free article] [PubMed] [Google Scholar]
- 58. Khan R., Giedroc D.P.. Recombinant human immunodeficiency virus type 1 nucleocapsid (NC(p7)) protein unwinds tRNA. J. Biol. Chem. 1992; 267:6689–6695. [PubMed] [Google Scholar]
- 59. Mely Y., De Rocquigny H., Sorinas-Jimeno M., Keith G., Roques B.P., Marquet R., Gerard D.. Binding of the HIV-1 nucleocapsid protein to the primer tRNA3/(Lys), in vitro, is essentially not specific. J. Biol. Chem. 1995; 270:1650–1656. [DOI] [PubMed] [Google Scholar]
- 60. Avilov S.V., Godet J., Piémont E., Mély Y.. Site-specific characterization of HIV-1 nucleocapsid protein binding to oligonucleotides with two binding sites. Biochemistry. 2009; 48:2422–2430. [DOI] [PubMed] [Google Scholar]
- 61. Vo M.-N., Barany G., Rouzina I., Musier-Forsyth K.. Mechanistic studies of mini-TAR RNA/DNA annealing in the absence and presence of HIV-1 nucleocapsid protein. J. Mol. Biol. 2006; 363:244–261. [DOI] [PubMed] [Google Scholar]
- 62. Ramalanjaona N., Rocquigny H., Millet A., Ficheux D., Darlix J.L., Mély Y.. Investigating the mechanism of the nucleocapsid protein chaperoning of the second strand transfer during HIV-1 DNA synthesis. J. Mol. Biol. 2007; 374:1041–1053. [DOI] [PubMed] [Google Scholar]
- 63. Miller M.D., Wang B., Bushman F.D.. Human immunodeficiency virus type 1 preintegration complexes containing discontinuous plus strands are competent to integrate in vitro. J. Virol. 1995; 69:3938–3944. [DOI] [PMC free article] [PubMed] [Google Scholar]
- 64. Raspaud E., Chaperon I., Leforestier A., Livolant F.. Spermine-induced aggregation of DNA, nucleosome, and chromatin. Biophys. J. 1999; 77:1547–1555. [DOI] [PMC free article] [PubMed] [Google Scholar]
- 65. Yamasaki Y., Teramoto Y., Yoshikawa K.. Disappearance of the negative charge in giant DNA with a folding transition. Biophys. J. 2001; 80:2823–2832. [DOI] [PMC free article] [PubMed] [Google Scholar]
- 66. Hud N.V., Downing K.H.. Cryoelectron microscopy of λ phage DNA condensates in vitreous ice: The fine structure of DNA toroids. Proc. Natl. Acad. Sci. U.S.A. 2001; 98:14925–14930. [DOI] [PMC free article] [PubMed] [Google Scholar]
- 67. Vilfan I.D., Conwell C.C., Sarkar T., Hud N.V.. Time study of DNA condensate morphology: implications regarding the nucleation, growth, and equilibrium populations of toroids and rods. Biochemistry. 2006; 45:8174–8183. [DOI] [PubMed] [Google Scholar]
- 68. He S., Arscott P.G., Bloomfield V.A.. Condensation of DNA by multivalent cations: experimental studies of condensation kinetics. Biopolymers. 2000; 53:329–341. [DOI] [PubMed] [Google Scholar]
- 69. Schmitt A., Jiang K., Camacho M.I., Jonna V.R., Hofer A., Westerlund F., Christie P.J., Berntsson R.P.A. PrgB promotes aggregation, biofilm formation, and conjugation through DNA binding and compaction. Mol. Microbiol. 2018; 109:291–305. [DOI] [PMC free article] [PubMed] [Google Scholar]
- 70. Rouzina I., Bloomfield V.A.. Macroion attraction due to electrostatic correlation between screening counterions. 1. Mobile surface-adsorbed ions and diffuse ion cloud. J. Phys. Chem. 1996; 100:9977–9989. [Google Scholar]
- 71. Nguyen T.T., Rouzina I., Shklovskii B.I.. Reentrant condensation of DNA induced by multivalent counterions. J. Chem. Phys. 2000; 112:2562–2568. [Google Scholar]
- 72. Webb J.A., Jones C.P., Parent L.J., Rouzina I., Musier-Forsyth K.. Distinct binding interactions of HIV-1 Gag to Psi and non-Psi RNAs: Implications for viral genomic RNA packaging. RNA. 2013; 19:1078–1088. [DOI] [PMC free article] [PubMed] [Google Scholar]
Associated Data
This section collects any data citations, data availability statements, or supplementary materials included in this article.