

Abstract
Carbon-fiber microelectrodes (CFMEs) are considered to be the standard electrodes for neurotransmitter detection. Fast-scan cyclic voltammetry (FSCV), an electro analytical method, has the ability to follow neurochemical dynamics in real time using CFMEs. Improvements in neurochemical detection with CFMEs were previously made through the coating of polymers onto the surface of the carbon-fiber. Polymers such as PEI, PEDOT, and Nafion were electrodeposited onto the surface of the electrodes to enhance neurochemical detection. This work demonstrates applications for enhancements in co-detection of similarly structured neurochemicals such as dopamine, DOPAL, 3-methoxytyramine, DOPAC, and other neurotransmitters. Manipulating the charge and surface structure of the carbon electrode allows for the improvement of sensitivity and selectivity of neurotransmitter detection. The analytes are detected and differentiated by the shape and the peak positions of their respective cyclic voltammograms.
Introduction
Dopamine (DA) is an important neurotransmitter associated with motor and cognitive functions such as movement, motivation, and reward. Its impairment is involved with several neurological processes and neuropsychiatric disorders, specifically Alzheimer’s disease, schizophrenia, drug abuse, and Parkinson’s disease (1). The ability to diagnose these diseases requires the development of a method with the ability for rapid neurotransmission detection in awake and behaving subjects. While different electrochemical sensors have been introduced over the past thirty years, carbon-fiber microelectrodes (CFMEs) are considered to be the standard electrodes for neurotransmitter detection (2). Fast-scan cyclic voltammetry (FSCV), an electroanalytical method, primarily uses CFMEs and has the ability to follow neurochemical dynamics in real time (3). Other techniques such as microdialysis utilize relatively large probes, which cause tissue damage during in vivo implantation and lack the spatial and temporal resolution of FSCV measurements (4). In conjunction with FSCV, CFMEs have the capability to accurately measure the oxidation of several crucial neurotransmitters, like dopamine, to produce specific cyclic voltammograms (5).
Neurotransmitters are small molecules, that usually are monoamines containing nitrogen, synthesized in neuron cells and packaged in membrane-bound packets called vesicles (6). Neurotransmitter detection is very important for understanding various disease states such as epilepsy (7, 8), obesity (9), amphetamine abuse (10, 11), and cocaine (12) addiction. The synapses, located between terminals of neurons, are involved in both electrical and chemical forms of signal communication. Chemical transmission takes place via the movement of an action potential down the axon of a presynaptic neuron leading to the release of neurotransmitters from their secretory vesicles, a process known as exocytosis. Exocytosis, or the release of neurotransmitters from the cell, can either be inhibited or enhanced depending on the subsequent depolarization. The exocytosis results in either their binding to the postsynaptic neuron cell through G-protein coupled receptors, their reuptake into the nerve terminal through a transport protein, their degradation, or their uptake and metabolism in glial cells (13). Therefore, each of the above pathways has an effect on stimulation of neuron cells and neurotransmitter signaling.
Catecholamines are monoamine transmitters composed of a benzene group with two adjacent hydroxyl groups, as well as an ethylamine side chain with a single amine group, that may have additional substitutions (14). DA’s structure has the general catecholamine composition, mentioned previously, and an additional amine group attached at the end of the ethylamine chain. Deficiencies in DA signaling are understood to be the leading cause of Parkinson’s disease and schizophrenia in humans, which are caused by a progressive degeneration of neurons in the substantia nigra region of the brain resulting in a lowered amount of available DA (5, 6, 15, 16). Conversely, the overstimulation of dopamine signaling is thought to be associated with the reward system such that motivation and satisfaction can be activated by food, drink, sex, and also by addictive drugs (6). For this reason, it is believed that an inverted-u shaped relationship is observed between dopamine and cognitive functions (15, 17).
While excessive dopamine stimulation results in unrestrained hyperactivation of the motivation pathway, insufficient levels of DA can lead to debilitating neurological disorders (5, 18). In cases of neuropsychiatric disorders, the stimulation or blockage of DA receptors, have been a key target for therapeutic treatment targets. Additionally, the accurate and precise detection of DA in artificial, in-vivo and ex-vivo environments is vital so a better understanding of the dopaminergic pathway can be achieved. The release of DA from the presynaptic neurons is followed by the activation of G protein coupled receptors (GPCRs), also known as dopamine receptors. There are five DA receptors types that are divided into two subfamilies, D1-like and D2-like, based on their ability to modulate cAMP production, their structure, pharmacology, and signaling properties (1). The D1-like class of DA receptors includes D1 and D5 receptors and are coupled with stimulatory G proteins that result in the increase of intracellular cAMP levels (19). On the other hand, the D2-like class of DA receptors includes D2, D3, and D4 receptors that are coupled with inhibitory G proteins, which prevents the activity of adenylyl cyclase. Almost 50% of the FDA-approved drugs target GPCRs; however, many of these drugs are not very selective and display troublesome side effects due to the deviant signaling (20).
Fast-scan cyclic voltammetry (FSCV), is a technique that utilizes rapid potential sweeps to oxidize and reduce analytes of interest. Voltammetry has evolved through time, starting with Leland Clark and his glassy carbon sensors; he was then followed by Ralph Adams and his graphite paste electrodes (3). The FSCV electrochemical technique was conceived in the 1980s by a researcher called Mark R. Wightman, which primarily used carbon-fiber microelectrodes (3). Furthermore, FSCVs produce cyclic voltammograms that display a response current on the y-axis, in response to an applied potential located on the x-axis. In addition, cyclic voltammograms provide information such as compound identification, yielding real time neurological dynamics of analytes with different current-potential characteristics. With voltammetry, a molecule generates its own current during its redox reaction, thus requiring for a specific waveform to enclose the region at which a molecule generates a current from its redox reaction. One of the most common waveforms is the dopamine waveform that scans from −0.4 V to +1.3 V at 400 V/s. Although it generates a large background current, the background current is subtracted to help determine the smaller underlying current, resulting in a cyclic voltammogram. In addition to the waveform, various other aspects such as potential limits, scan rate, and application frequency of the waveform can be modified to optimize the performance of the FSCV, especially its sensitivity, selectively, and temporal resolution (5). From the resulting cyclic voltammograms, the chemical signature, or fingerprint, can be interpreted to identify the species detected by using the peak oxidative or reductive currents. Despite dopamine being the most common target for FSCV usage, a wide range of other molecules still ought to be identified and quantified using FSCV.
Carbon fiber microelectrodes are known to be the standard for neurotransmitter detection. CFMEs are made from carbon fibers insulated in glass capillaries and require an exposed length of approximately 100 microns and an electrical connection in order to properly measure molecules with it. Carbon fibers have certain chemical properties due to the presence of carbonyl and hydroxyl group, among more complex ones, that enables the alteration of the surface charge and the steric properties of the carbon fiber. Specific electrode modifications have recently been made to enhance both the temporal and spatial resolution of carbon fiber microelectrodes with fast scan cyclic voltammetry. For instance, altering the waveform applied and the chemical and physical properties of the electrode materials can allow for fine tuning the electrochemical sensitivity for enhance neurotransmitter selectivity and detection (21). For example, carbon nanotubes (CNTs) have been explored due to their relatively high sp2 hybridization and conductivity properties(22, 23). Carbon nanotubes have increased surface roughness and higher aspect rations, which lead to the frequency independent neurotransmitter response with respect to dopamine detection (24, 25). Advances in polymer science have been made by the principal investigator of this research group that warrant further discussion (26–29). The Hashemi group has utilized Nafion coated carbon fiber microelectrodes to enhance serotonin detection (30), while Venton and colleagues have shown that CNT modified microelectrodes enhance both sensitivity and temporal resolution of neurochemical measurements (31). Moreover, polymer and other electrode coatings such as PEI (32), Nafion (33), poly(3,4-ethylenedioxythiophene) PEDOT-Nafion (34, 35), and others have been used to enhance the detection by increasing conductivity and reducing surface fouling (21).
In this study, polymer coatings were utilized to test for the enhancement of 3,4-Dihydroxyphenylacetic acid (DOPAC), 3-methoxytyramine (3-MT), and 3,4-Dihydroxyphenylacetaldehyde (DOPAL) selectivity and discrimination from dopamine when detected with CFMEs using FSCV. These molecules are metabolites of dopamine and are formed through the oxidative catalyzation of the monoamines, dopamine, where the amine group on the DA molecule is replaced by a carboxyl group to form DOPAC. In addition, the hydroxyl group on the DA molecule is replaced by a methyl group which forms 3-MT and DOPAL is formed through the catalyzed oxidative deamination of the monoamine oxidase (MAO) enzyme, replacing the amine group of dopamine with a carbonyl group (36). DOPAC is a metabolite breakdown product of dopamine and has been found to be physiologically important in stress and the response to predators (37–39). Enzymatic inhibitors of MAO and COMT are frequently used as drug treatments for bipolar mania disorder, multiple personality disorder, drug induced psychosis, depression, and other psychiatric states (40). 3-MT has also been found to be physiologically important as the administration of 3-MT was shown to reverse the effects of dyskinesia in dopamine deficient Parkinsonian mice (41–43). DOPAL is a toxic metabolite of dopamine whose accumulation in the striatum can lead to the death of dopaminergic neurons in the striatum and hence cause Parkinson’s disease (36). The accumulation of DOPAL has recently been seen as a biomarker for Parkinsonian and pre-Parkinsonian patients (36). Chemicals with only slight redox potential differences can interfere with each other and require electrode modifications to enhance selectivity and discrimination. Furthermore, polymer coatings such as polyethyleneimine (PEI) (44) and Poly(3,4-ethylenedioxythiophene) (45) polystyrene sulfonate (EDOT:PSS) were used to functionalize the surface of the CFMEs to discriminate dopamine and its metabolites. PEI coatings on the surface of CFMEs applied a more positive charge to the surface the electrode due to the protonation of the nitrogen functionalized groups, which electrostatically attract the negatively charged anionic DOPAC and DOPAL. Conversely, electrodeposition of EDOT:PSS onto the surface if the CFME coated the electrode with a thin negatively charged polymer that electrostatically attracts dopamine and 3-MT but repels DOPAC and DOPAL.
FSCV is also commonly used to measure sub-second release of dopamine in a variety of model biological systems, including cultured cells, rodents, and viable brain tissue slices and now zebrafish retinas (46). Of these systems, zebrafish retinas have proven to operate as possible electrophysiological models for the detection of uptake and release of neurotransmitters. The release of dopamine and other neurotransmitters was measured in zebrafish retinal tissue, providing important proof of concept. The measurements of DA and its metabolites through FSCV recordings in zebrafish retinal tissue were performed to demonstrate the ability of bare and polymer coated CFMEs to exogenously applied DA and the potassium chloride stimulation of dopamine and its metabolites through the ex-vivo tissue. This work also provides a novel enhancement for DOPAC, 3-MT, and DOPAL selectively, detection at sub-second timescale, and a possibly future greater understanding of this important metabolite for in vivo measurements. Improvements in neurochemical detection with CFMEs were previously made through the coating of polymers onto the surface of the carbon-fiber (21, 47). This work demonstrates applications for enhancements in co-detection of similarly structured neurochemicals.
Experimental Methods and Materials
Materials
The solutions were prepared according to the protocol found in previously reported literature (21, 47). Dopamine, DOPAC, 3-MT, DOPAL, polyethyleneimine (PEI), and 3,4-ethylenedioxythiophene (EDOT) were obtained from Sigma-Aldrich (St. Louis, MO). Poly(styrene sulfonic acid) sodium salt (PSS) was obtained from Alfa Aesar (Ward Hill, MA). A 10 mM stock solution of 0.1 M perchloric acid was prepared and diluted to 1.0-100 μM daily with phosphate-buffered saline (PBS) (145 mM NaCl, 2.68 mM KCl, 1.40 mM CaCl2.2H2O, 1.01 mM MgSO4.7H2O, 15.5 mM Na2HPO4, and 0.45 mM NaH2PO4.H2O with the pH adjusted to 7.4). All the aqueous solutions were prepared with deionized water (Millipore, Billerica, MA). Epon 828 Epoxy was obtained from Miller-Stephenson (Morton Grove, IL) and diethylenetriamine hardener was obtained from Fisher Scientific (Waltham, MA) (21, 47).
Instrumentation
The instrumentation was operated according to previously reported literature (21, 47). Data was collected using the electrochemical technique known as Fast Scan Cyclic Voltammetry (FSCV), which was performed with the WaveNeuro FSCV system and a 5 MΩ headstage (Pine Instruments, Durham, NC, USA) (21). Data was analyzed using the HDCV software (University of North Carolina Chapel Hill, Mark Wightman) and a computer interface board (National Instruments PC1e-6363, Austin, TX, USA) (21). The triangular waveform was used with the FSCV as it is commonly used for the quantification of catecholamines (3, 48). The cyclic waveform was applied to the electrode from a holding potential of −0.4 V to +1.3 V at a scan rate of 400 V/s and a frequency of 10 Hz. Both the scan rates (50-1000 V/s) and concentrations (100 nM to 100 μM) were varied from lower to higher values (21). A silver-silver chloride reference electrode was used as a reference point to measure the potential of the CFME. Samples were tested in a flow injection analysis system (In Vitro/FSCV Microelectrode Flow Cell with xyz micromanipulator Translational Stage, Pine Instruments, Durham, NC) (21). Buffer and samples were pumped through the flow cell at 1 mL/min using the NE-300 Just Infusion™ Syringe Pump (New Era Pump Systems, Farmingdale, NY) (21). The electrodes were given 10 minutes to equilibrate to the applied waveform and to prevent electrode drift between each run (21). All data was background subtracted to remove any non-faradaic currents (21).
Construction of Carbon-Fiber Microelectrodes
The procedure for the construction of carbon-fiber microelectrodes was applied as per the previously reported literature (21, 47). First carbon fibers (0.007 mm, Goodfellow, Huntingdon, England) were separated one by one using hands, gloves, and spatula. An isolated carbon fiber was aspirated into a cylindrical glass capillary (1.2 mm by 0.68 mm, A-M Systems, Inc., Carlsborg, WA) using a vacuum pump (DOA-P704-AA, GAST, Benton Harbor, MI) to form carbon-fiber microelectrodes (49). The capillary was pulled using a vertical capillary puller (Narishige, model PC-100 and PE-22, Tokyo, Japan) and the fiber was cut to length of approximately 100 – 150 microns. Glass insulated electrodes were epoxied with Epon 828 epoxy (Miller-Stephenson, Morton Grove, IL) and diethylenetriamine (Sigma Aldrich, Milwaukee, WI). Protruding carbon-fiber microelectrode tips were dipped in the epoxy hardener mixture (0.8% by mass resin) for approximately 15 seconds and then rinsed in acetone to wash away any excess residual epoxy hardener. The electrodes were cured in the oven for 3 h at 125°C (21).
Electrodeposition of Polymers onto CFMEs
The electrodeposition of polyethyleneimine (PEI) polymer solution onto the surface of carbon-fiber microelectrodes (CFMEs) was performed as previously described (21). Linear PEI polymer (Mn ~60,000, Sigma Aldrich, Milwaukee, WI) was dissolved in methanol to make a 20% mass solution. The CFME was lowered into the PEI solution. A triangle waveform scanning from +1.5 V to −0.8 V and back to +1.5 V was applied at a scan rate of 100 mV/s for 15 cycles. The electrodeposition occurred over the course of five minutes (21). The electrodeposition and electropolymerization of 3,4-ethylenedioxythiophene polystyrene sulfonate (EDOT:PSS) polymer solution onto the surface of carbon-fiber microelectrodes (CFMEs) was performed using the same triangle waveform settings as for the PEI electrodeposition. 10 mM EDOT:PSS (Sigma-Aldrich, St. Louis, MO) was dissolved in 1% mass solution of PSS, which was dissolved in deionized water.
Calibration of CFMEs
The bare CFMEs are back filled with a saturated solution of potassium chloride (KCl) and inserted in the flow cell system using the electrode holder and the proper headstage. The neurotransmitters (DA, DOPAC, 3-MT, and DOPAL) of interest are then injected, one by one, at a 0.1 mL quantity for the desired concentration, ranging from 1 μM to 5 μM. The same bare CFMEs are then electrodeposited with PEI and PEDOT and re-tested with the same neurotransmitters at the same concentrations to compare the effects of the polymer coating onto the carbon fiber and enable a proper analysis of results using zebrafish brains or retinas.
Dopamine and Metabolites Detection in Zebrafish Brain and Retina
Following the calibration of a bare CFME with dopamine and its three metabolites, PEDOT-PEI is electrodeposited onto the carbon fiber. This method requires another calibration test to determine the effect of the polymers on the sensitivity CFME. Zebrafish eyes can either be preserved for later utilization by freezing them at −80°C in Ringer’s solution or used as follows. With the corneal side up, one side of the eye is gripped along its equator with forceps. Using the purple ALCON I-knife, a first incision on the periphery of the cornea is made. A second incision is created by tracing a line across the diameter of the pupil in the periphery of the cornea. Then, the sides of the perforation are gripped and very gently pulled apart, some aqueous humor should spill out with flecks of retina. The retina tissue is then inverted as carefully as possible to provide the most access to retinal tissue possible (50, 51). The inverted eye is placed on a cut filter paper square with the retinal matter facing upwards. 200 μL of PBS buffer was injected slowly in the bridge between the reference electrode well and the glass electrode well. The electrode is lowered into the retina with xyz micromanipulator and left to equilibrate for 5 minutes. Afterwards, either 5 μL of dopamine, 3-MT, DOPAC or DOPAL are injected at various concentrations ranging from 20 μM to 100 μM. The injections were performed as close as possible to the meniscus of the buffer in the well with the retinal sample, while taking care to not actually touch the buffer. FSCV was setup to run each trial with the dopamine waveform. After each run, the buffer was syringed out and replaced from the wells.
Scanning Electron Microscopy
The images obtained using a scanning electron microscope (SEM) were taken as previously described (21). The SEM images were obtained with a JEOL JSM-IT100 (JEOL, Tokyo, Japan). Bare or polymer modified carbon fiber microelectrodes were sputter-coated with gold in Denton Desk II sputter coater at 100 millitorr and 45 milliamps current. They were then placed onto conductive tape, which was then inserted into the stage. The working distance was set to 10 mm and slightly adjusted to obtain optimal resolution and magnification, while the accelerating voltage from 5 kV to 20 kV. Furthermore, the same JEOL software was also used to perform Energy-dispersive X-ray spectroscopy (EDS/EDX) measurements for chemical identification of polymers on the surface of the carbon-fiber microelectrode. The collection time was ranged from approximately three to ten minutes (21).
Data Analysis
All data analysis was performed using GraphPad Prism 8. All error bars are standard error of the mean (SEM) unless otherwise noted.
Representative Results
Schematic of Fast-Scan Cyclic Voltammetry
The illustration in Figure 1(A) of the triangular waveform with applied voltage from -0.4 V to +1.3 V at a scan rate of 400 V/s. The x-axis represents the time, usually in seconds, and the y-axis represents the voltage potential applied to the working electrode, made of carbon fiber. The triangle potential waveform is composed of a forward scan starting at an initial potential (Einitial) of −0.4 V to 1.3 V, and a backward scan from 1.3 V to a final potential (Efinal) of −0.4 V generated by the potentiostat at a frequency of 10 Hz. The applied voltage potential causes the oxidation of dopamine to dopamine-o-quinone, a quasi-reversible process, where not all of the oxidized dopamine is reduced back to its original form as illustrated in Figure 1(B). Thus, the oxidation peak of dopamine on the cyclic voltammogram is expected to have a higher change in current than the reduction peak. The illustration in Figure 1(C) represents the output the software HDCV produces known as a three-dimensional color plot of the dopamine oxidation reaction. It is assumed that the current is negligible in PBS buffer, creating a relatively neutral background current. However, dopamine oxidation is shown in the color plot by the green circular shape and the dopamine reduction is shown by the dark blue semi-circular shape, representing positive and negative current, respectively. Additionally, the color plot is overlaid with a current versus time plot where the oxidation of dopamine to dopamine-o-quinone can be measured over time due to the adsorption of dopamine onto the carbon fiber surface. Then the current slowly decreases demonstrating the desorption of dopamine onto the carbon fiber surface.
Figure 1.

Schematic of fast-scan cyclic voltammetry testing to measure dopamine oxidation in-vitro) by S. Mohanaraj (47). (A) Triangular waveform with applied voltage. (B) Dopamine oxidation to dopamine-o-quinone. (C) Three-dimensional color plot with real-time current.
Schematic of Dopamine Metabolites
DA is formed by decarboxylation of L-dihydroxyphenylalanine (L-DOPA) using DOPA decarboxylase, which is composed of an aromatic L-amino acid decarboxylase, releasing CO2 and forming DA. In addition, DA can be broken down into inactive metabolites such as 3,4-dihydroxyphenol acetic acid (DOPAC) pre-synaptically by monoamine oxidase (MAO) and 3-methoxytyramine (3-MT) post-synaptically from catechol-o-methyltransferase (COMT). The amine group on the DA molecule is replaced by a carboxyl group to form DOPAC and the hydroxyl group on the DA molecule is replaced by a methyl group which forms 3-MT. Both DOPAC and 3-MT can be further metabolized to Homovanillic Acid (HVA) by COMT and MAO respectively. Furthermore, dopamine can also be metabolized to norepinephrine and normetanephrine by dopamine-beta-hydroxylase and catechol-o-methyltransferase, respectively.
Schematic of DOPAL and DOPAC Metabolism
As previously mentioned, DA can be broken down into different metabolites by introducing MAO, ALDH2, and COMT enzyme. An intermediate to the formation of DOPAC is known as 3,4-Dihydroxyphenylacetaldehyde (DOPAL) which is formed by the catalyzed oxidative deamination of MAO enzyme, replacing the amine group of dopamine with a carbonyl group (36). Furthermore, ALDH2 oxidizes the formerly mentioned carbonyl group on DOPAL which forms a carboxyl group and the DOPAC molecule.
Scanning Electron Microscope Images (Bare and PEDOT-PEI CFMEs)
As shown in the scanning electron microscope (SEM) images, the bare carbon fiber has deep grooves and ridges as they are thermally spun from polyacrylonitrile (PAN) and pyrolyzed at temperatures about 1000 K (21, 53, 54). The diameter of bare carbon fibers is approximately 7 microns. For this experiment, they were used as a control for comparison testing with polymer modified microelectrodes. Polyethyleneimine (PEI, ~60,000 Mn, 20% in methanol, Sigma-Aldrich, Milwaukee) was electrodeposited onto the surface of CFMEs (Figure 5(A)). PEI is composed of repeating units of amine groups that gives the molecule an overall positive charge. Therefore, coating this polymer onto carbon fibers also creates a positive charge, especially at a physiological pH of 7.4 of phosphate buffered saline (PBS) due to the amine being protonated (pKa ~ 10) (21). PEI was electrodeposited onto the surface of CFMEs using the triangle waveform by cycling from 1.5 V to −0.8 V to 1.5 V at 100 mV/s scan rate for approximately 300 s (21). SEM images were taken of the surface of the carbon fibers to confirm a complete and thorough coating of the PEI polymer. Poly(3,4-ethylenedioxythiophene) polystyrene sulfonate (EDOT:PSS, 1% in deionized water, Sigma-Aldrich, St Louis, MO) was electrodeposited onto the surface of PEI coated CFMEs using the same triangle waveform as for PEI electrodeposition. SEM images were taken of the surface of the carbon fiber to confirm a complete and thorough coating of the PEDOT-PEI polymer. In addition, the carbon fiber samples were run through a gold sputter coater to enhance the conductivity, enabling for a higher resolution. A sample of carbon fiber coated with PEI and PEDOT-PEI were not gold sputtered to allow for energy-dispersive X-Ray analysis by performing a count of the elements composing the two polymers. Figure 5(A) shows the structure of the PEI polymer with a large quantity of nitrogen atoms and Figure 6(B) shows the structure of the EDOT:PSS polymer with a large quantity of oxygen and sulfur atoms.
Figure 5.

Energy-dispersive X-Ray (EDS/EDX) analysis enabled the quantification of certain elements that compose the polymers coated onto the carbon fibers. (A) A carbon fiber coated with PEI polymer was analyzed and acquired a significant count of nitrogen confirming the presence of PEI of the carbon fiber. (B) A carbon fiber with PEDOT-PEI polymer was analyzed and acquired a significant count of oxygen and sulfur, confirming the presence of PEDOT-PEI on the carbon fiber. The high level of carbon count is accounted for as the sample holder is made out of carbon and the carbon fiber is also composed of carbon.
Sensitivity Comparison (Bare, PEI and PEDOT-PEI CFMEs)
In Figure 6, the effects of polymer coatings from dopamine, DOPAC, uric acid, and ascorbic acid detection were studied. Uric acid and ascorbic acid are often co-present in human biological fluids and are important in clinical diagnosis (55). As previously shown in literature, the concentration of neurotransmitters used was estimated to be within the broad physiological range (54, 56). The 20% PEI (in methanol) coated carbon fiber microelectrodes (CFMEs) possess, on average, higher peak oxidative current (POC) for DOPAC, dopamine and ascorbic acid, and none for uric acid (Figure 6). The electrodeposition of PEI polymer onto the surface of the electrode had a significantly enhanced signal detection with DOPAC (p-value = 0.053) by making the electroactive surface area more positive and minimizing the electrostatic repulsion from the anionic DOPAC. However, the small sample size of two restricted the ability to confirm t-test analysis significance for dopamine and ascorbic acid.
Figure 6.
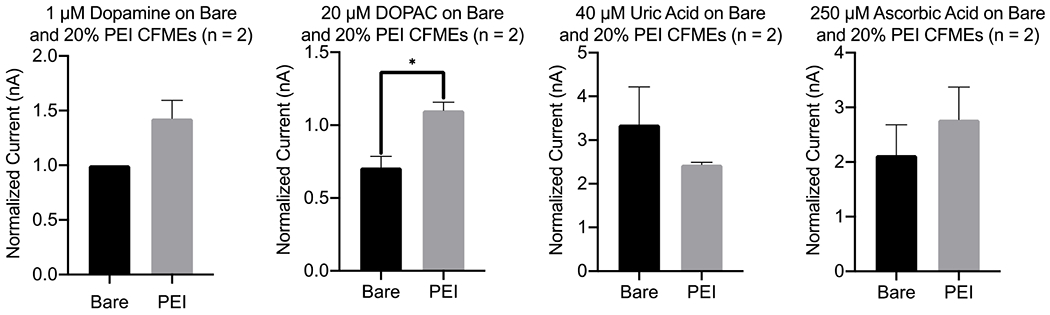
Effect of PEI polymer coatings on dopamine, DOPAC, uric acid, and ascorbic acid on detection. The effect of PEI coating on sensitivity for 1 μM dopamine (DA, p-value = 0.121), 20 μM DOPAC (p-value = 0.053), 40 μM uric acid (UA, p-value = 0.398), and 250 μM ascorbic acid (AA, p-value = 0.508) detection are shown above. The currents were normalized to dopamine averages currents (n = 2). PEI coating on the surface of CFMEs enhance the sensitivity of DA, DOPAC, and AA, but not for the UA analyte.
As shown with figure 7, the detection effects of polymer coatings were studied for dopamine and its three metabolites. The neurotransmitters concentrations used were estimated to be within the broad physiological range (54, 56). As previously mentioned, the effect of PEI on detection was most significant with DOPAC. Figure 7 also demonstrates the effects of PEDOT-PEI polymer coating on the detection of various neurotransmitters, such as dopamine and three of its metabolites. PEDOT-PEI coatings onto the carbon fiber significantly increased the sensitivity, through peak oxidative current of the cyclic voltammograms of 3-methoxytyramine (3-MT) and DOPAC, an intermediate increase for dopamine, and had no effect on DOPAL’s detection.
Figure 7.

Effect of PEI and PEDOT-PEI polymer coatings on dopamine, DOPAL, 3-MT, and DOPAC on detection. The effect of PEI coating on sensitivity for 5 μM dopamine, 5 μM DOPAL, 5 μM 3-methoxytyramine (3-MT), and 5 μM DOPAC detection are shown above. The currents were normalized for each neurotransmitter average current (n = 3). PEI coating on the surface of CFMEs enhance the sensitivity of DA, DOPAC, but not the other analytes. PEDOT-PEI coating on the surface of CFMEs enhance the sensitivity of DA, DOPAL, and DOPAC, but not the DOPAL analyte. Dopamine comparison t-tests results are summarized in the table with DOPAL and DOPAC showing significance for bare, PEI, and PEDOT-PEI electrodes.
Adsorption Control Experiments with Dopamine (Bare and PEI CFMEs)
In Figure 8(A – D), several experiments including stability, scan rate, and concentration testing were performed to determine the adsorption control for dopamine with bare CFMEs and PEI polymer coated CFMEs, thus demonstrating its utility for enhanced neurochemical detection. As dopamine did not show any significant increase in sensitivity with PEI polymer coatings, Figure 8(A) demonstrates the stability of bare CFMEs over the course of four hours for the detection of 1 μM dopamine. With a sample size of 3 microelectrodes, dopamine’s sensitivity experiment on stability with bare unmodified CFMEs with an R2 calculated to be 0.214. Therefore, there was no significant or marked decrease or increase in peak oxidative current over time, which illustrates the integrity of the polymer coating onto the surface of the carbon fiber over a 4 hour time period. Figure 8(B) showed a normalized current detection of 1 μM dopamine with bare and PEI polymer coated CFMEs with scan rates ranging from 50 V/s to 1000 V/s. A linear relationship is observed between both the bare CFMEs and the PEI polymer coated CFMEs, a higher adsorption control is observed on the latter (R2 = 0.976, slope (m) = 1.04E−3) than the former (R2 = 0.980 m = 1.39E−3). In addition, analysis of the slope from the linear regression showed increased sensitivity between bare CFMEs versus the PEI-coated CFMEs. The higher sample size of bare CFMEs (n = 5) can account for the coefficient of determination’s (R2) difference with the PEI polymer coated CFMEs (n = 3). Figure 8(C) indicated the dopamine adsorption control on bare CFMEs with different concentrations, ranging from 50 nM to 100ΜM. The asymptotic curve demonstrates a saturation of the electrodes at concentrations higher than 10 μM with a sample size of 3. Figure 8(D) indicated that the average peak oxidative currents for the cyclic voltammograms for DA are linear with respect to concentration from 50 nM to 5 μM for the selected sample size (R2 = 0.631).
Figure 8.

Adsorption control testing of dopamine with CFMEs. (A) The electrode displays a stability towards DA detection (peak oxidative current) for at least four hours (n = 3). (B). Adsorption control testing for bare and polymer coated CFMEs. The peak oxidative current for dopamine (1 μM) cyclic voltammograms are linear with respect to scan rate (50-1000 V/s), thus denoting adsorption control to the surface of the bare and polymer coated CFMEs. The PEI coated CFME shows an enhanced sensitivity. R2 = 0.980 and 0.976, respectively. (C). Adsorption control testing of bare CFMEs. The peak oxidative currents for the cyclic voltammograms for DA are saturated at the surface of the electrode, with respect to the concentration, which blocks further adsorption. R2 = 0.9698 (n = 3). (D). The peak oxidative currents for the cyclic voltammograms for DA are linear with respect to concentration up from 100 nM to 10 mM.
Adsorption Control Experiments with DOPAC (Bare and PEI CFMEs)
In Figure 9(A – D), several experiments including stability, scan rate, and concentration testing were performed to determine the adsorption control of DOPAC with bare CFMEs and PEI polymer coated CFMEs, thus demonstrating its utility for enhanced neurochemical detection. Traditionally, DOPAC sensitivity at CFMEs is low because it is anionic and is electrostatically repelled form the oxide groups at the surface of the electrode in addition to the negative holding potential (−0.4 V) As DOPAC showed significant detection increases with PEI polymer coating, Figure 9(A) demonstrates the stability of bare CFMEs over the course of four hours for the detection of 5 μM DOPAC. Figure 9(B) shows a normalized scan rate experiments performed with 5 μM DOPAC was detected with bare and PEI polymer coated CFMEs with scan rates ranging from 50 V/s to 1000 V/s. A linear relationship is observed between both the bare CFMEs and the PEI polymer coated CFMEs, thus denoting a higher adsorption control is observed on the latter (R2 = 0.9715) than the former (R2 = 0.9978). The higher sample size of bare CFMEs (n = 3) can account for the coefficient of determination’s difference with the PEI polymer coated CFMEs. Figure 9(C) indicated the adsorption control of DOPAC on bare CFMEs with different concentrations, ranging from 100 nM to 100μM due to the linear relationship observed between peak oxidative current and concentration. The linear regression curve demonstrates no saturation of the electrode at 100 μM with a sample size of 2 which may reflect some errors (R2 = 0.8880). Conversely, Figure 9(D) shows the average peak oxidative current of cyclic voltammograms for two CFMEs, with low concentration from 100 nM to 10 μM, which depict a fairly linear regression (R2 = 0.844).
Figure 9.

Adsorption control testing of the bare and PEI polymer coated CFMEs. (A) The electrode displays a stability towards DOPAC detection (peak oxidative current) for at least four hours. R2 = 0.6706 and 0.4970, respectively (n = 4).(21) (B) Adsorption control testing of the polymer coated CFMEs. The peak oxidative current for DOPAC (5 μM) cyclic voltammograms are linear with respect to scan rate (50-1000 V/s), thus denoting adsorption control to the surface of the bare and polymer coated CFMEs. R2 = 0.9978 (n = 3) and 0.9715 (n = 1), respectively. (C) Adsorption control testing of the bare CFMEs. The peak oxidative current for the cyclic voltammograms for DOPAC are linear with respect to concentration from 100 nM up to 100 μM. R2 = 0.8880 (n = 2). (D) The peak oxidative currents for the cyclic voltammograms for DOPAC are linear with respect to concentration up from 100 nM to 10 μM R2 = 0.844 (n = 2).
Adsorption Control Experiments with 3-MT (Bare and PEI CFMEs)
In Figure 10(A – D), several experiments including stability, scan rate, and concentration testing were performed to determine the adsorption control of 3-methoxytyramine (3-MT) with bare CFMEs, thus demonstrating its utility for enhanced neurochemical detection. As 3-MT showed significant detection increases with PEI polymer coating, Figure 9(A) demonstrates the stability of bare CFMEs over the course of four hours for the detection of 1 μM 3-MT. With a sample size of 3, 3-MT’s detection with bare CFMEs appeared linear with an R2 value calculated to be 0.7799 for the bare CFMEs. Figure 10(B) showed a normalized current detection of 1 ΜM 3-MT with bare CFMEs with scan rates ranging from 50 V/s to 1000 V/s. With a sample size of 7, a linear relationship is observed between the bare CFMEs, a higher adsorption control is observed on the latter (R2 = 0.9901). Figure 10(C) indicated the adsorption control of 3-MT on bare CFMEs with different concentrations, ranging from 0.1 μM to 100 μM. The asymptotic curve demonstrates saturation of the electrodes at 10 μM with a sample size of 3 (R2 = 0.9663). Figure 10(D) shows the average peak oxidative current of cyclic voltammograms for three CFMEs, with low concentration from 100 nM to 1 μM, which depict a linear regression with an R2 value of 0.995.
Figure 10.

Adsorption control testing of CFMEs. (A) The electrode displays a stability towards 3-MT detection (peak oxidative current) for at least four hours. R2 = 0.7799 (n = 2). (B). Adsorption control testing for bare CFMEs. The peak oxidative current for 3-methoxytyramine (1 μM) cyclic voltammograms are linear with respect to scan rate (50-1000 V/s), thus denoting adsorption control to the surface of the bare CFMEs. R2 = 0.9901 (n = 7). (C). Adsorption control testing of bare CFMEs. The peak oxidative currents for the cyclic voltammograms for 3-methoxytyramine are saturated at the surface of the electrode, with respect to the concentration, which blocks further adsorption. R2 = 0.9663 (n = 3). (D) The peak oxidative currents for the cyclic voltammograms for 3-MT are linear with respect to concentration up from 100 nM to 1 μM (R2 = 0.995, n = 3).
Adsorption Control Experiment with DOPAL (Bare CFMEs)
In Figure 11 (A – D), several experiments including stability, scan rate, and concentration testing were performed to determine the adsorption control of DOPAL with bare CFMEs, thus demonstrating its utility for enhanced neurochemical detection. Figure 11(A) demonstrates the stability of bare CFMEs over the course of four hours for the detection of 5 μM DOPAL. With a sample size of 3, DOPAL’s detection with bare CFMEs appeared linear with an R2 value calculated to be 0.2015 for the bare CFMEs. Figure 11(B) showed a normalized current detection of 5 μM DOPAL with bare CFMEs with scan rates ranging from 50 V/s to 1000 V/s. With a sample size of 3, a linear relationship is observed between the bare CFMEs, a higher adsorption control is observed on the latter (R2 = 0.9917). Figure 11(C) indicated the adsorption control of DOPAL on bare CFMEs with different concentrations, ranging from 0.1 μM to 200μM. The slight asymptotic curve demonstrates some saturation of the electrodes with a sample size of 3 (R2 = 0.939). Further concentration testing can be done to discover the true saturation of the electrodes. Conversely, Figure 11(D) shows the average peak oxidative current of cyclic voltammograms for three CFMEs, with low concentration from 100 nM to 10 μM, which depict a linear regression with an R2 value of 0.999.
Figure 11.

Adsorption control testing of CFMEs. (A) The electrode displays a stability towards DOPAL detection (peak oxidative current) for at least four hours. (n = 3). (B). Adsorption control testing for bare CFMEs. The peak oxidative current for DOPAL (5 μM) cyclic voltammograms are linear with respect to scan rate (50-1000 V/s), thus denoting adsorption control to the surface of the bare CFMEs. R2 = 0.9917 (n = 3). (C). Adsorption control testing of bare CFMEs. The peak oxidative currents for the cyclic voltammograms for DOPAL are saturated at the surface of the electrode, with respect to the concentration, which blocks further adsorption. R2 = 0.9321 (n = 3). (D) The peak oxidative currents for the cyclic voltammograms for 3-MT are linear with respect to concentration up from 100 nM to 1 μM (R2 = 0.999, n = 4).
Co-Detection of Dopamine and DOPAC (Bare and PEDOT-PEI CFMEs)
The combination of the DA waveform and PEDOT-PEI polymer coatings to the surface of CFMEs were used with combination of dopamine and DOPAC, 3-MT, and DOPAL, respectively, and were tested for sensitivity changes. In Figure 12 through Figure 14, several experiments, including cyclic voltammograms comparisons of bare and PEDOT-PEI electrodeposited CFMEs and concentration ratios mixtures experiments between DA and DOPAC, which were performed to determine their possible co-detection enhancement with electrodeposited PEDOT-PEI polymer onto the carbon fiber. Figure 12 demonstrates the enhancement of 1 μM DA and 5 μM DOPAC detection with PEDOT-PEI CFMEs rather than bare CFMEs. In Figure 12(A), the peak oxidative current of DA intensified from 48.89 nA to 53.06 nA demonstrating the ability of PEDOT-PEI to enhance the detection of neurotransmitters such as DA. In addition, Figure 12(B) shows the increased peak oxidative currents from 4.14 nA to 12.20 nA for DOPAC detection with the same bare and PEDOT-PEI electrodeposited CFME used for DA comparison. The peak oxidative current shift in current between the bare and coated electrode shows that DOPAC is more sensitive to PEDOT-PEI coating than DA is. Figure 13 demonstrates the co-detection of DA and DOPAC using the same relative concentrations of neurotransmitters as for Figure 12(1 μM DA and 5μM DOPAC) but by testing them in different relative ratio combinations, such as 1:1, 1:10, and 1:100, on a bare CFME. As seen, the higher the concentration of DOPAC versus DA gets, the lower the peak oxidative current gets such that it mimics the behavior of the DOPAC analytes on its own. However, even when using 5 μM DOPAC, DA’s ability to bind to the surface of the bare carbon fiber is better. In Figure 14, the same experiment was repeated as Figure 13, but with higher relative concentration ratios of DA versus DOPAL in addition to the others (100:1 and 1:10), on a PEDOT-PEI CFME to study the co-detection improvement to a bare CFME using their cyclic voltammograms. At 5 μM DOPAC can easily be differentiated from DA at 1 μM. However, as the concentration of DA gets higher than DOPAC, starting at 1:1 and higher, the ability to differentiate DOPAC from DA is not permissible. Conversely, the lower the concentration of DA versus DOPAC, the DOPAC detection is more facile.
Figure 12.

Detection of dopamine and DOPAC using a bare and PEDOT-PEI polymer coated electrode with the dopamine waveform. The cyclic voltammograms of a solution of 1 μM dopamine and 5 μM DOPAC, respectively, are displayed with the same electrode before and after electrodeposition of PEDOT-PEI onto the carbon fiber. The dashed-lines represent the detection of dopamine and DOPAC with a bare CFME, whereas the solid lines represent the detection of dopamine and DOPAC with PEDOT-PEI electrodeposited onto the same CFME. Dopamine and DOPAC’s detection are enhanced through the increased surface area of the CFME creating an improved sensitivity of the electrode.
Figure 14.

Co-detection of dopamine and DOPAC using a PEDOT-PEI polymer coated electrode and the dopamine waveform. Various concentrations of dopamine and DOPAC were prepared in a solution of buffer and injected into the flow cell and were detected with a PEDOT-PEI polymer coated CFME utilizing the dopamine waveform. Baselines for dopamine and DOPAC were established by testing their detection separately with 1 μM and 5 μM solutions, respectively. Several solutions with ratios ranging from 100 dopamine : 1 DOPAC to 1 dopamine : 100 DOPAC were prepared. The peak oxidative current of DOPAC and dopamine can clearly be distinguished from one another using the PEDOT-PEI CFME.
Figure 13.

Co-detection of dopamine and DOPAC using a bare electrode and the dopamine waveform. Various concentrations of dopamine and DOPAC were prepared in a solution of buffer and injected into the flow cell and were detection with a bare CFME utilizing the dopamine waveform. Baselines for dopamine and DOPAC were established by testing their detection separately with 1 μM and 5 μM solutions, respectively. Several ratios ranging from 100 dopamine : 1 DOPAC to 1 dopamine : 100 DOPAC were prepared. The peak oxidative current of DOPAC and dopamine can somewhat be distinguished from one another. The secondary broad peak of DOPAC is enhanced in the presence of dopamine as seen in the 100:1, 10:1, and 1:1 ratios of dopamine and DOPAC, respectively.
Co-Detection of Dopamine and 3-MT (Bare and PEDOT-PEI CFMEs)
To continue, the combination of the DA waveform and PEDOT-PEI polymer coatings to the surface of CFMEs were used with co-detection of dopamine and 3-MT and were tested for sensitivity changes. In Figure 15 through Figure 17, several experiments, including cyclic voltammograms comparisons of bare and PEDOT-PEI electrodeposited CFMEs and concentration ratios mixtures experiments between DA and 3-MT, which were performed to determine their possible co-detection enhancement with electrodeposited PEDOT-PEI polymer onto the carbon fiber. Figure 15 demonstrates the enhancement of 1 μM DA and 5 μM 3-MT detection with PEDOT-PEI CFMEs rather than bare CFMEs. In Figure 15(A), the peak oxidative current of DA intensified from 43.90 nA to 53.06 nA demonstrating the ability of PEDOT-PEI to enhance the detection of neurotransmitters such as DA. In addition, Figure 12(B) shows the increased peak oxidative currents from 4.28 nA to 45.01 nA for 3-MT detection with the same bare and PEDOT-PEI electrodeposited CFME used for DA comparison. The peak oxidative current shift in current between the bare and coated electrode shows that 3-MT is more sensitive to PEDOT-PEI coating than DA is. Figure 16 demonstrates the co-detection of DA and DOPAC using the same relative concentrations of neurotransmitters as for Figure 15 (1μM DA and 5μM 3-MT) but by testing them in different relative ratio combinations, such as 1:1, 1:10, and 1:100, on a bare CFME. As seen, the higher the concentration of 3-MT versus DA gets, the higher the peak oxidative current gets such that it is greater than the POC of the 3-MT analyte on its own, much like an additive detection ability. The 1:1 DA to 3-MT ratio demonstrate a broad peak covering both the POC of DA and the POC of 3-MT. Furthermore, as the 3-MT concentration increases, the POC potential of 3-MT can be discerned from DA as it is shifted to a greater voltage. In Figure 17, the same experiment was repeated as Figure 16, but with higher relative concentration ratios of DA versus 3-MT in addition to the others (100:1 and 1:10), on a PEDOT-PEI CFME to study the co-detection improvement to a bare CFME using their cyclic voltammograms. At 5 μM, 3-MT can easily be differentiated from DA at 1 μM because of the POC potential shift of 0.85 V. In addition, their combination continued to have an additive behavior when co-detected as seen for ratios 1:1, 1:10, and 1:100. Upon the usage of lower concentrations of 3-MT and higher concentrations of DA (10:1, 100:1), the POC of the cyclic voltammograms realigns with the POC with the DA neurotransmitter on its own.
Figure 15.

Detection of dopamine and 3-methoxytyramine (3-MT) using a bare and PEDOT-PEI polymer coated electrode with the dopamine waveform. The cyclic voltammograms of a solution of 1 μM dopamine and 5 μM 3-MT, respectively, are displayed with the same electrode before and after electrodeposition of PEDOT-PEI onto the carbon fiber. The dashed-lines represent the detection of dopamine and 3-MT with a bare CFME, whereas the solid lines represent the detection of dopamine and 3-MT with PEDOT-PEI electrodeposited onto the same CFME. Although 3-MT’s oxidation potential is higher than dopamine (1 V and 0.75 V, respectively), the detection of 3-MT was compromised by the presence of left-over dopamine residues on the carbon fiber creating a secondary peak on the 3-MT voltammograms representing dopamine’s oxidation potential.
Figure 17.

Co-detection of dopamine and 3-methoxytyramine (3-MT) using a PEDOT-PEI polymer coated electrode and the dopamine waveform. Various concentrations of dopamine and 3-MT were prepared in a solution of buffer and injected into the flow cell and were detected with a PEDOT-PEI polymer coated CFME utilizing the dopamine waveform. Baselines for dopamine and 3-MT were established by testing their detection separately with 5 μM and 5 μM solutions, respectively. Several solutions with ratios ranging from 100 dopamine : 1 3-MT to 1 dopamine : 100 3-MT were prepared. The peak oxidative current of 3-MT and dopamine can clearly be distinguished from one another using the PEDOT-PEI CFME.
Figure 16.

Co-detection of dopamine and 3-methoxytyramine (3-MT) using a bare electrode and the dopamine waveform. Various concentrations of dopamine and 3-MT were prepared in a solution of buffer and injected into the flow cell and were detection with a bare CFME utilizing the dopamine waveform. Baselines for dopamine and 3-MT were established by testing their detection separately with 5 μM solutions. Several ratios ranging from 1 dopamine : 1 3-MT to 1 dopamine : 100 3-MT were prepared. The peak oxidative current of 3-MT and dopamine can clearly be distinguished from one another.
Co-Detection of Dopamine and DOPAL (Bare and PEDOT-PEI CFMEs)
Lastly, the combination of the DA waveform and PEDOT-PEI polymer coatings to the surface of CFMEs were used with the co-detection of dopamine and DOPAL and were tested for sensitivity changes. In Figure 18 through Figure 20, several experiments, including cyclic voltammograms comparisons of bare and PEDOT-PEI electrodeposited CFMEs and concentration ratios mixtures experiments between DA and DOPAL, which were performed to determine their possible co-detection enhancement with electrodeposited PEDOT-PEI polymer onto the carbon fiber. Figure 18 demonstrates the enhancement of 1 μM DA and 5 ΜM DOPAL detection with PEDOT-PEI CFMEs rather than bare CFMEs. In Figure 18(A), the peak oxidative current of DA intensified from 48.89 nA to 53.06 nA demonstrating the ability of PEDOT-PEI to enhance the detection of neurotransmitters such as DA. In addition, Figure 18(B) shows the stabilization of the peak oxidative currents from 48.71 nA to 48.33 nA for DOPAL detection with the same bare and PEDOT-PEI electrodeposited CFME used for DA comparison. The peak oxidative current between the bare and coated electrode shows that DOPAL’s detection is not affected by PEDOT-PEI coating. Figure 19 demonstrates the co-detection of DA and DOPAL using the same relative concentrations of neurotransmitters as for Figure 18 (1μM DA and 5μM DOPAL) but by testing them in different relative ratio combinations, such as 1:1, 1:10, and 1:100, on a bare CFME. As seen, the higher the concentration of DOPAL versus DA gets, the lower the peak oxidative current gets such that it mimics the behavior of the DOPAL analytes on its own. However, even when using 5 μM DOPAL, DA’s ability to bind to the surface of the bare carbon fiber is better. In Figure 20, the same experiment was repeated as Figure 19, but with higher relative concentration ratios of DA versus DOPAL in addition to the others (100:1 and 1:10), on a PEDOT-PEI CFME to study the co-detection improvement to a bare CFME using their cyclic voltammograms. At 5 μM, DOPAL cannot easily be differentiated from DA at 1 μM. As the concentration of DA gets higher than DOPAC, starting at 10:1 and higher, the ability to differentiate DOPAL from DA is not permissible. Conversely, the lower the concentration of DA versus DOPAC, the better the DOPAC detection gets.
Figure 18.

Detection of dopamine and DOPAL using a bare and PEDOT-PEI polymer coated electrode with the dopamine waveform. The cyclic voltammograms of a solution of 1 μM dopamine and 5 μM DOPAL, respectively, are displayed with the same electrode before and after electrodeposition of PEDOT-PEI onto the carbon fiber.
Figure 20.

Co-detection of dopamine and DOPAL using a PEDOT-PEI polymer coated electrode and the dopamine waveform. Various concentrations of dopamine MJ/e and DOPAC were prepared in a solution of buffer and injected into the flow cell and were detected with a PEDOT-PEI polymer coated CFME utilizing the dopamine waveform. Baselines for dopamine and DOPAC were established by testing their detection separately with 1 μM and 5 μM solutions, respectively. Several solutions with ratios ranging from 100 dopamine : 1 DOPAC to 1 dopamine : 100 DOPAC were prepared. The peak oxidative current of DOPAC and dopamine can clearly be distinguished from one another using the PEDOT-PEI CFME.
Figure 19.

Co-detection of dopamine and DOPAL using a bare electrode and the dopamine waveform. Various concentrations of dopamine and DOPAL were prepared in a solution of buffer and injected into the flow cell and were detection with a bare CFME utilizing the dopamine waveform. Baselines for dopamine and DOPAL were established by testing their detection separately with 5 μM solutions. Several ratios ranging from 1 dopamine : 1 DOPAL to 1 dopamine : 100 DOPAL were prepared. The peak oxidative current of DOPAL and dopamine can somewhat be distinguished from one another. DOPAL appears to create a slight shift in oxidative current from 0.75 V for dopamine to 0.7 for DOPAL enabling some co-detection.
Conclusions:
We have shown a novel polymer PEDOT: PEI coating enhances the detection of dopamine and dopaminergic metabolites such as 3-MT, DOPAC, and DOPAL. This work is important in differentiating and co-detecting these metabolites. This will be critical in understanding the physiological role of these metabolites.
Future works of this study would include the examination of the DOPAL neurochemical using the dopamine waveform in ex vivo zebrafish retinal or brain tissue and PEDOT-PEI electrodes. We will also measure the potassium chloride, psychostimulant, and electrical stimulation of neurotransmitter in vivo in zebrafish and rodent models. In addition, the newly established waveform with a voltage ranging from -0.4 V to +1.45 V (currently used for adenosine detection) could be used to further investigate the adsorption increase of DOPAC but also investigate it with the other neurotransmitters used through this research project including dopamine, DOPAL, and 3-MT. Furthermore, in vivo investigations of the neurotransmitters pathway in zebrafish and rodents using polymer modified microelectrodes could model human diseases or neurological and psychiatric disorders.
Figure 2.
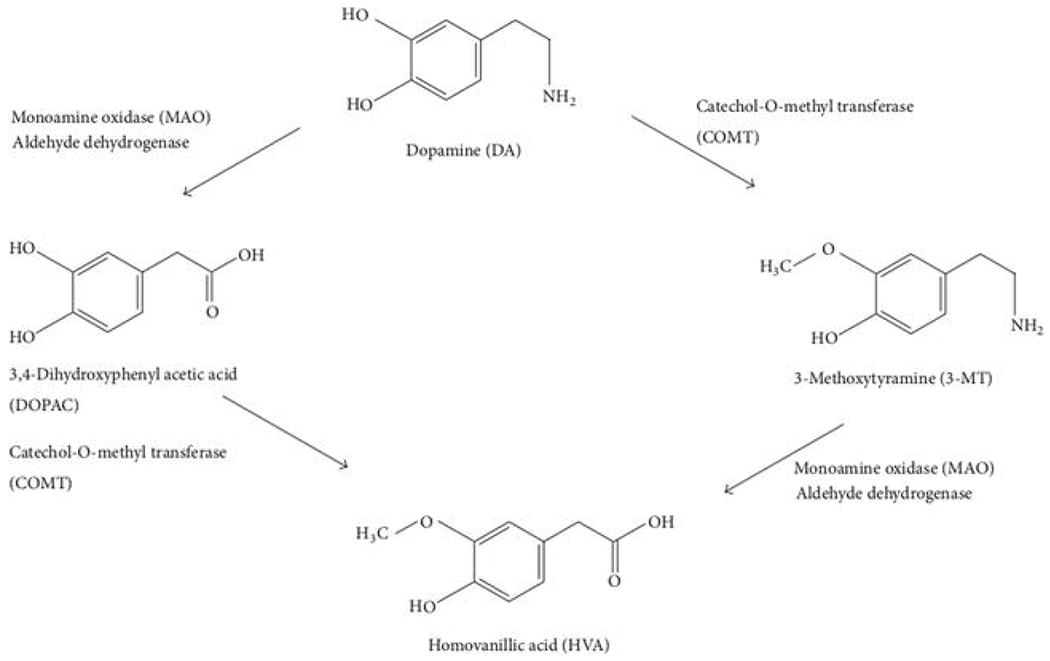
The enzymatic breakdown of DA to its inactive metabolites is carried out by catechol-O-methyl transferase (COMT) and monoamine oxidase (MAO) (52).
Figure 3.

Metabolism of DA involving monoamine oxidase-catalyzed oxidative deamination to DOPAL followed by ALDH2-mediated oxidation to DOPAC. Structure and reaction drawn using ChemDraw online.
Figure 4.

SEM images of (A) a bar uncoated carbon fiber approximately 7 microns in diameter. (B) A carbon fiber electrodeposited in polyethyleneimine (PEI). A thin layer of polymer evenly coats the surface of the electrode and fills the ridge of the fiber. (C) A carbon fiber electrodeposited with PEDOT-PEI. A thin layer of polymer coats the surface of the electrode and fills the ridge of the fiber to a greater extent than the PEI-coated carbon fiber. The SEM settings were adjusted to enhance the resolution of the images. The probe current (P.C.) used ranged between 30 and 35. The working distance (WD) varied from 6 mm to 10 mm. The accelerating voltage ranged from 5kV to 20 kV and the magnification ranged from 3,300 to 3,500.
References
- 1.Beaulieu J and Gainetdinov R, Molecular And Cellular Biology, 63, 182 (2014). [Google Scholar]
- 2.Zestos AG, Yang C, Jacobs CB, Hensley D and Venton BJ, The Analyst, 140, 7283 (2015). [DOI] [PMC free article] [PubMed] [Google Scholar]
- 3.Roberts JG and Sombers LA, Analytical chemistry, 90, 490 (2018). [DOI] [PMC free article] [PubMed] [Google Scholar]
- 4.Zestos AG and Kennedy RT, The AAPS Journal (2017). [DOI] [PMC free article] [PubMed] [Google Scholar]
- 5.Bucher ES and Wightman RM, Annual Review of Analytical Chemistry, 8, 239 (2015). [DOI] [PMC free article] [PubMed] [Google Scholar]
- 6.Venton BJ and Wightman RM, Analytical Chemistry, 75, 414 A (2003). [DOI] [PubMed] [Google Scholar]
- 7.Luna-Munguia H, Zestos AG, Gliske SV, Kennedy RT and Stacey WC, Neurobiology of disease, 121, 177 (2019). [DOI] [PMC free article] [PubMed] [Google Scholar]
- 8.Zestos AG, Luna-Munguia H, Stacey WC and Kennedy RT, ACS chemical neuroscience, 10, 4 (2018). [DOI] [PMC free article] [PubMed] [Google Scholar]
- 9.Jun H, Yu H, Gong J, Jiang J, Qiao X, Perkey E, Kim D.-i., Emont MP, Zestos AG and Cho J-S, Nature medicine, 24, 6 (2018). [DOI] [PMC free article] [PubMed] [Google Scholar]
- 10.Zestos AG, Mikelman SR, Kennedy RT and Gnegy ME, ACS chemical neuroscience (2016). [DOI] [PMC free article] [PubMed] [Google Scholar]
- 11.Carpenter C, Zestos AG, Altshuler R, Sorenson RJ, Guptaroy B, Showalter HD, Kennedy RT, Jutkiewicz E and Gnegy ME, Neuropsychopharmacology, 42, 1940 (2017). [DOI] [PMC free article] [PubMed] [Google Scholar]
- 12.Zestos AG, Carpenter C, Kim Y, Low MJ, Kennedy RT and Gnegy ME, ACS Chemical Neuroscience, 10, 1960 (2019). [DOI] [PMC free article] [PubMed] [Google Scholar]
- 13.Holz RW and Fisher SK, in Basic Neurochemistry (Eighth Edition), Brady ST, Siegel GJ, Albers RW and Price DL Editors, p. 235, Academic Press, New York: (2012). [Google Scholar]
- 14.Gnegy ME, in Basic Neurochemistry (Eighth Edition), Brady ST, Siegel GJ, Albers RW and Price DL Editors, p. 283, Academic Press, New York: (2012). [Google Scholar]
- 15.Cools R and D’Esposito M, Biological Psychiatry, 69, e113 (2011). [DOI] [PMC free article] [PubMed] [Google Scholar]
- 16.Ehringer H and Hornykiewicz O, Klinische Wochenschrift, 38, 1236 (1960). [DOI] [PubMed] [Google Scholar]
- 17.Arnsten AF and Dudley AG, Behavioral and brain functions : BBF, 1, 2 (2005). [DOI] [PMC free article] [PubMed] [Google Scholar]
- 18.Volkow ND, Wang G-J, Fowler JS, Tomasi D, Telang F and Baler R, BioEssays : news and reviews in molecular, cellular and developmental biology, 32, 748 (2010). [DOI] [PMC free article] [PubMed] [Google Scholar]
- 19.Luderman KD, Conroy JL, Free RB, Southall N, Ferrer M, Sanchez-Soto M, Moritz AE, Willette BKA, Fyfe TJ, Jain P, Titus S, Hazelwood LA, Aube J, Lane JR, Frankowski KJ and Sibley DR, Molecular Pharmacology, 94, 1197 (2018). [DOI] [PMC free article] [PubMed] [Google Scholar]
- 20.Eglen RM. [Google Scholar]
- 21.Raju D, Mendoza A, Wonnenberg P, Mohanaraj S, Sarbanes M, Truong C and Zestos AG, Analytical Methods, 11, 1620 (2019). [DOI] [PMC free article] [PubMed] [Google Scholar]
- 22.Zestos AG, International Journal of Electrochemistry, 2018 (2018). [DOI] [PMC free article] [PubMed] [Google Scholar]
- 23.Zestos AG, Jacobs CB, Trikantzopoulos E, Ross AE and Venton BJ, Analytical chemistry, 86, 8568 (2014). [DOI] [PMC free article] [PubMed] [Google Scholar]
- 24.Zestos AG and Venton BJ, Journal of The Electrochemical Society, 165, G3071 (2018). [DOI] [PMC free article] [PubMed] [Google Scholar]
- 25.Jacobs CB, Ivanov IN, Nguyen MD, Zestos AG and Venton BJ, Analytical chemistry, 86, 5721 (2014). [DOI] [PMC free article] [PubMed] [Google Scholar]
- 26.Ge X, Culyba EK, Grinnell CL, Zestos AG and Starnes WH, Journal of Vinyl and Additive Technology, 13, 170 (2007). [Google Scholar]
- 27.Zhang G, Xu S, Zestos AG, Evans RE, Lu J and Fraser CL, ACS applied materials & interfaces, 2, 3069 (2010). [DOI] [PubMed] [Google Scholar]
- 28.Ho WK, Walker J, Orski S, Fuller T, Zestos A, Grinnell C, Pike R and Starnes W, Journal of Vinyl and Additive Technology, 14, 16 (2008). [Google Scholar]
- 29.Zestos AG, Grinnell CL, Vinh LJ, Pike RD and Starnes WH, Journal of Vinyl and Additive Technology, 15, 87 (2009). [Google Scholar]
- 30.Hashemi P, Dankoski EC, Petrovic J, Keithley RB and Wightman R, Analytical chemistry, 81, 9462 (2009). [DOI] [PMC free article] [PubMed] [Google Scholar]
- 31.Xiao N and Venton BJ, Analytical chemistry, 84, 7816 (2012). [DOI] [PMC free article] [PubMed] [Google Scholar]
- 32.Zestos A, University of Virginia (2014). [Google Scholar]
- 33.Hashemi P, Dankoski EC, Petrovic J, Keithley RB and Wightman RM, Anal Chem, 81, 9462 (2009). [DOI] [PMC free article] [PubMed] [Google Scholar]
- 34.Demuru S and Deligianni H, Journal of The Electrochemical Society, 164, G129 (2017). [Google Scholar]
- 35.Peairs MJ, Ross AE and Venton BJ, Analytical Methods, 3 (2011). [Google Scholar]
- 36.Goldstein DS, Sullivan P, Holmes C, Miller GW, Alter S, Strong R, Mash DC, Kopin IJ and Sharabi Y, Journal of neurochemistry, 126, 591 (2013). [DOI] [PMC free article] [PubMed] [Google Scholar]
- 37.Zetterström T, Sharp T, Collin A and Ungerstedt U, European journal of pharmacology, 148, 327 (1988). [DOI] [PubMed] [Google Scholar]
- 38.Deutch AY, Tam S-Y and Roth RH, Brain research, 333, 143 (1985). [DOI] [PubMed] [Google Scholar]
- 39.Gonon F, Buda M, Cespuglio R, Jouvet M and Pujol J-F, Nature, 286, 902 (1980). [DOI] [PubMed] [Google Scholar]
- 40.Liebowitz MR, Hollander E, Schneier F, Campeas R, Welkowitz L, Hatterer J and Fallon B, Acta Psychiatrica Scandinavica, 82, 29 (1990). [DOI] [PubMed] [Google Scholar]
- 41.Sotnikova TD, Beaulieu J-M, Espinoza S, Masri B, Zhang X, Salahpour A, Barak LS, Caron MG and Gainetdinov RR, PLoS One, 5, e13452 (2010). [DOI] [PMC free article] [PubMed] [Google Scholar]
- 42.Antkiewicz-Michaluk L, Ossowska K, Romańska I, Michaluk J and Vetulani J, European journal of pharmacology, 599, 32 (2008). [DOI] [PubMed] [Google Scholar]
- 43.Wood PL and Altar CA, Pharmacological Reviews, 40, 163 (1988). [PubMed] [Google Scholar]
- 44.Muñoz E, Suh DS, Collins S, Selvidge M, Dalton AB, Kim BG, Razal JM, Ussery G, Rinzler AG and Martínez MT, Advanced Materials, 17, 1064 (2005). [Google Scholar]
- 45.Vreeland RF, Atcherley CW, Russell WS, Xie JY, Lu D, Laude ND, Porreca F and Heien ML, Analytical chemistry, 87, 2600 (2015). [DOI] [PMC free article] [PubMed] [Google Scholar]
- 46.Sun M, Kaplan SV, Gehringer RC, Limbocker RA and Johnson MA, Anal Chem, 86, 4151 (2014). [DOI] [PMC free article] [PubMed] [Google Scholar]
- 47.Au - Mohanaraj S, Au - Wonnenberg P, Au - Cohen B, Au - Zhao H, Au - Hartings MR, Au - Zou S, Au - Fox DM and Au - Zestos AG, JoVE, e59552 (2019). [DOI] [PMC free article] [PubMed] [Google Scholar]
- 48.Kissinger PT and Heineman WR, Journal of Chemical Education, 60, 702 (1983). [Google Scholar]
- 49.Zestos AG, Nguyen MD, Poe BL, Jacobs CB and Venton BJ, Sensors and Actuators B: Chemical, 182, 652 (2013). [DOI] [PMC free article] [PubMed] [Google Scholar]
- 50.Connaughton VP, Wetzell B, Arneson LS, DeLucia V and Riley AL, Journal of neurochemistry, 135, 101 (2015). [DOI] [PubMed] [Google Scholar]
- 51.Connaughton VP, Methods in Cell Science, 25, 49 (2003). [DOI] [PubMed] [Google Scholar]
- 52.Juarez Olguin H, Calderon Guzman D, Hernandez Garcia E and Barragan Mejia G, Oxid Med Cell Longev, 2016, 9730467 (2016). [DOI] [PMC free article] [PubMed] [Google Scholar]
- 53.Bartosova Z, Riman D, Jakubec P, Halouzka V, Hrbac J and Jirovsky D, ScientificWorldJournal, 2012, 295802 (2012). [DOI] [PMC free article] [PubMed] [Google Scholar]
- 54.Nguyen MD, Lee ST, Ross AE, Ryals M, Choudhry VI and Venton BJ, PLoS One, 9, e87165 (2014). [DOI] [PMC free article] [PubMed] [Google Scholar]
- 55.Choukairi M, Bouchta D, Bounab L, Ben atyah M, Elkhamlichi R, Chaouket F, Raissouni I and Rodriguez IN, Journal of Electroanalytical Chemistry, 758, 117 (2015). [Google Scholar]
- 56.Yang C, Jacobs CB, Nguyen MD, Ganesana M, Zestos AG, Ivanov IN, Puretzky AA, Rouleau CM, Geohegan DB and Venton BJ, Analytical chemistry, 88, 645 (2016). [DOI] [PMC free article] [PubMed] [Google Scholar]
- 57.Mendoza A, Asrat T, Liu F, Wonnenberg P, and Zestos AG. Sensors, 20, 4 (2020). [DOI] [PMC free article] [PubMed] [Google Scholar]