

Abstract
Oxalate is a common component of many foods typically present as a salt of oxalic acid, which will be excreted in the urine. Hyperoxaluria is known to be a considerable risk factor for urolithiasis, and formation of oxalate kidney stone. Oxalate degradation by the probiotic anaerobic bacterium Oxalobacter formigenes DSM 4420 has high yield and efficiency both in the human colon helping to prevent hyperoxaluria and disorders such as the development of kidney stones and as a novel approach in reducing the high concentration of foodstuff oxalate content such as tea, coffee, and nuts. For determining the effective factors to enhance high concentration oxalate biodegradation activity of Oxalobacter formigenes DSM 4420 Plackett-Burman screening design was applied to evaluate the impact of 10 process variables. After determining the main factors by screening design, a response surface methodology was used to find suitable treatment combination for oxalate biodegradation by this probiotic. A second-order quadratic model estimated that the highest biodegradation of 60.2% was achieved in presence of 1.35 (g/L) inulin, 36.56 (g/L) glucose, 26 (mmol/L) ammonium oxalate, and pH 6. In other word, the optimum point showed that in the above condition the high concentration of ammonium oxalate content of 26 mmoL/L will reach to 9.95 mmoL/L. Reconfirmation experiment showed the validity of predicted optimum conditions. A surface model using the RSM and optimizing this model using the GA technique, resulted in a useful method of finding an optimal set of process parameters.
Keywords: Biodegradation, O. formigenes DSM 4420, Oxalate, High concentration, Probiotics, Response surface method, Algorithmic genetic technique
1. Introduction
Oxalobacter formigenes is a gram-negative, anaerobic bacterium that often inhabits the colon of vertebrates (human and animals) as intestinal microflora (Murru et al., 2017). Oxalate is the main carbon and energy source in this bacterium (Ruan et al., 1992). O. formigenes contains a group of oxalate degrading enzymes such as oxalate oxidase, oxalate decarboxylase, oxalyl-CoA decarboxylase, and formyl-CoA transferase, which degrade oxalate into formate and CO2 (Turroni et al., 2007). The absence of O. formigenes in the gut is a reported risk factor in the development of kidney stone disease (Kaufman et al., 2008).
This bacteria has been utilized in studies on hyperoxaluria, and hyperoxaluria-simulated conditions in single-stage continuous-culture fermenters (Duncan et al., 2002), in rat models (Daniel et al., 1987) and in humans (Zhao et al., 2018). However, the growth of this bacterium depends on oxalate as sole carbon and energy source in anaerobic cultivation, which limits its use in functional food production.
One method of alteration of the intestinal microflora is via administration of prebiotics. Prebiotics are non-digestible food ingredients that beneficially affect the host by stimulating growth or activity of certain bacterial components of the intestinal microflora (Gibson and Roberfoid, 1995; Shoaib et al., 2016; Balthazar et al., 2018). Among prebiotics, inulin was shown to exert a protective effect on lactic acid bacteria by stimulating their survival and activity during storage of the final product. Inulin is a water-soluble storage polysaccharide and belongs to a group of non-digestible carbohydrates called fructans (Darilmaz et al., 2018).
A study has addressed the use of prebiotics or pH alteration to reduce oxalate excretion and to regulate hyperoxaluria (Turroni et al., 2010). Also, there are some reports on oxalate degradation by several probiotics including Lactobacillus acidophilus, Lactobacillus gasseri, Bifidobacterium lactis, and oxalobacter formigenes. Considering that the absence of O. formigenes could lead to increased colonic absorption of oxalate, a suitable condition should be provided for bacterial growth and activity. Although some previous studies focused on O. formigenes oxalate biodegradation the impact of optimum pH for O. formigenes activity, presence of inulin as a synergistic variable for bacterial growth and presence of glucose solution as carbon source haven’t been studied to help O. formigenes to better growth and activity. Our previous research on L. acidophilus oxalate biodegradation activity showed that combines effects of variables could enhance the oxalate degradation activity to 42% in 15 mmoL/L of sodium oxalate media in the presence of inulin and glucose (Karamad et al., 2019). However, to our knowledge, there is no information on suitable combinations of O. formigenes, inulin, glucose and pH in oxalate biodegradation specifically targeting the biodegradation of high concentration oxalate content in in vitro models.
The objective of this study, for the first time, is conducting a comprehensive study to find an effective formulation for high concentration oxalate biodegradation by O. formigenes. As a result for using this bacteria to enhance. For this purpose, a Plackett-Burman screening design was applied to evaluate the impact of 11 possible influencing factors on oxalate biodegradation. After the screening of main variables, a Box-Behnken design was selected (a response surface methodology) to determine the best suitable treatment combination to achieve the highest response.
2. Method and material
2.1. Chemicals and media
Proteose peptone, yeast extract, tween 80, potassium dihydrogen phosphate, Na acetate, di-ammonium hydrogen-citrate, magnesium sulfate heptahydrate, manganese sulfate monohydrate, disodium oxalate, diammonium oxalate monohydrate, D (+)glucose anhydrous, D (+)-sucrose were purchased from Merck (Darmstadt, Germany). Inulin was purchased from Beneo (Mannheim, Germany). Schaedler (SB) broth was obtained from Merck (Darmstadt, Germany).
2.2. Microorganism and culture media
O. formigenes was obtained from the DSM 4420 (Germany) in freeze-dried ampules. After activation of bacteria at first step, O. formigenes was preadapted for high oxalate degradation through anaerobic growth of this bacteria in Schaedler broth + sodium acetate containing 0.35 mmoL/L ammonium oxalate (pH 6.8) incubated at 37 °C anaerobically for 4 days. Then growing cells were transferred to (i) Schaedler broth (pH 6.8) and (ii) Schaedler broth containing 35 mmoL/L ammonium oxalate (pH 6.8) and both incubated at 37 °C anaerobically for 4 days. Samples were collected from (i) as a control sample and (ii) for oxalate degradation capacity of bacteria through enzymatic method (oxalate kit) estimation.
Culture media was prepared by adding solutions listed below to 10 mL base media [proteose peptone no. 3 10 g, yeast extract 5 g, Tween 80 1 mL, KH2PO4 2 g, Na-acetate 5 g, di-Ammonium hydrogen-citrate 2 g, MgSO4·7H2O 0.05 g, MnSO4 0.05 g. The volume of solution was reached by deionized water to 500 mL and sterilized at 121 °C for 15 min.
All variables and their levels for Plackett-Burman (PBD) and response surface method (RSM) have been explained in Tables 1 and 2. Final culture media were inoculated with 100 μl of preadapted O. formigenes suspension.
Table 1.
Treatment combinations and responses for Plackett-Burman experiments.
| Run | Factor 1 | Factor 2 | Factor 3 | Factor 4 | Factor 5 | Factor 6 | Factor 7 | Factor 8 |
Factor 9 | Factor 10 | Response |
|---|---|---|---|---|---|---|---|---|---|---|---|
| A:pH | B:Sucrose | C:Glucose | D:Sodium oxalate |
E:Ammonium oxalate | F:Yeast extract | G:Inoculumn size | H:Inoculumn age | J:inulin | K:Sodium acetate |
oxalate degradation | |
| 1 | 5.00 | 20.00 | 40.00 | 5.00 | 10.00 | 0.00 | 1010.00 | 36.00 | 1.00 | 10.00 | 38.07 |
| 2 | 7.00 | 10.00 | 40.00 | 5.00 | 10.00 | 1.00 | 106.00 | 36.00 | 1.00 | 10.00 | 46.33 |
| 3 | 7.00 | 10.00 | 20.00 | 20.00 | 20.00 | 1.00 | 106.00 | 18.00 | 1.00 | 10.00 | 19.7 |
| 4 | 7.00 | 10.00 | 40.00 | 20.00 | 10.00 | 0.00 | 1010.00 | 18.00 | 0.00 | 10.00 | 27.9 |
| 5 | 7.00 | 10.00 | 20.00 | 5.00 | 20.00 | 0.00 | 1010.00 | 36.00 | 0.00 | 10.00 | 5.96 |
| 6 | 7.00 | 20.00 | 20.00 | 20.00 | 10.00 | 0.00 | 106.00 | 36.00 | 0.00 | 20.00 | 36.23 |
| 7 | 5.00 | 20.00 | 20.00 | 5.00 | 20.00 | 1.00 | 106.00 | 36.00 | 0.00 | 10.00 | 5.04 |
| 8 | 5.00 | 20.00 | 40.00 | 20.00 | 10.00 | 1.00 | 106.00 | 18.00 | 0.00 | 10.00 | 9.63 |
| 9 | 5.00 | 20.00 | 20.00 | 20.00 | 20.00 | 0.00 | 1010.00 | 18.00 | 1.00 | 10.00 | 8.2 |
| 10 | 7.00 | 20.00 | 40.00 | 5.00 | 20.00 | 0.00 | 106.00 | 18.00 | 0.00 | 20.00 | 0.45 |
| 11 | 5.00 | 10.00 | 20.00 | 5.00 | 10.00 | 0.00 | 106.00 | 18.00 | 1.00 | 20.00 | 52.76 |
| 12 | 5.00 | 10.00 | 40.00 | 20.00 | 20.00 | 0.00 | 106.00 | 36.00 | 1.00 | 20.00 | 9.63 |
| 13 | 5.00 | 10.00 | 40.00 | 5.00 | 20.00 | 1.00 | 1010.00 | 18.00 | 0.00 | 20.00 | 4.58 |
| 14 | 7.00 | 20.00 | 20.00 | 5.00 | 10.00 | 1.00 | 1010.00 | 18.00 | 1.00 | 20.00 | 54.1 |
| 15 | 7.00 | 20.00 | 40.00 | 20.00 | 20.00 | 1.00 | 1010.00 | 36.00 | 1.00 | 20.00 | 27.98 |
| 16 | 5.00 | 10.00 | 20.00 | 20.00 | 10.00 | 1.00 | 1010.00 | 36.00 | 0.00 | 20.00 | 21.56 |
Table 2.
Treatment combinations and responses for Response surface method.
| Run | Factor 1 | Factor 2 | Factor 3 | Factor 4 | Response | Bacterial population | |
|---|---|---|---|---|---|---|---|
| A:pH | B:Inulin (g/L) | C:ammonium oxalate (mmol/L) | D:glucose (g/L) | oxalate degradation (%) | Time 0 CFU/ml*106 | End growth CFU/ml*106 | |
| 1 | 6.00 | 1.50 | 5.00 | 40.00 | 28.75 | 23 | 200 |
| 2 | 6.00 | 1.00 | 15.00 | 40.00 | 55.58 | 30 | 150 |
| 3 | 6.00 | 1.00 | 15.00 | 40.00 | 57.42 | 25 | 230 |
| 4 | 6.50 | 0.50 | 15.00 | 40.00 | 20 | 32 | 270 |
| 5 | 6.50 | 1.00 | 15.00 | 45.00 | 32.57 | 27 | 160 |
| 6 | 6.00 | 0.50 | 15.00 | 45.00 | 36.57 | 25 | 200 |
| 7 | 6.00 | 1.00 | 15.00 | 40.00 | 56.85 | 30 | 240 |
| 8 | 6.00 | 0.50 | 15.00 | 35.00 | 21.14 | 26 | 160 |
| 9 | 5.50 | 1.50 | 15.00 | 40.00 | 32 | 25 | 200 |
| 10 | 6.00 | 1.00 | 5.00 | 45.00 | 21.93 | 32 | 250 |
| 11 | 6.50 | 1.00 | 15.00 | 35.00 | 41.42 | 25 | 185 |
| 12 | 6.00 | 1.00 | 25.00 | 35.00 | 58 | 30 | 170 |
| 13 | 6.00 | 0.50 | 25.00 | 40.00 | 32.22 | 22 | 210 |
| 14 | 6.50 | 1.00 | 5.00 | 40.00 | 46.36 | 32 | 150 |
| 15 | 6.50 | 1.00 | 25.00 | 40.00 | 23.1 | 22 | 200 |
| 16 | 6.00 | 1.50 | 25.00 | 40.00 | 60.55 | 30 | 145 |
| 17 | 6.00 | 1.00 | 5.00 | 35.00 | 31.83 | 26 | 130 |
| 18 | 5.50 | 1.00 | 5.00 | 40.00 | 32.84 | 32 | 210 |
| 19 | 6.00 | 1.00 | 25.00 | 45.00 | 26.66 | 28 | 170 |
| 20 | 6.00 | 1.50 | 15.00 | 45.00 | 32.28 | 25 | 220 |
| 21 | 5.50 | 1.00 | 15.00 | 45.00 | 25.28 | 22 | 150 |
| 22 | 5.50 | 0.50 | 15.00 | 40.00 | 43.1 | 25 | 240 |
| 23 | 6.50 | 0.50 | 15.00 | 40.00 | 21.5 | 30 | 175 |
| 24 | 6.00 | 1.50 | 15.00 | 35.00 | 34.1 | 24 | 180 |
| 25 | 5.50 | 1.00 | 25.00 | 40.00 | 58 | 31 | 160 |
| 26 | 5.50 | 1.00 | 15.00 | 35.00 | 62.8 | 25 | 210 |
| 27 | 6.00 | 1.00 | 15.00 | 40.00 | 57.57 | 31 | 210 |
| 28 | 6.00 | 0.50 | 5.00 | 40.00 | 33.4 | 22 | 180 |
| 29 | 6.00 | 1.00 | 15.00 | 40.00 | 45.81 | 25 | 220 |
2.3. Oxalate degradation estimation
Although there are some different method for oxalate determination in a liquid solution, based on pre-experience of this group (Karamad et al., 2019b), the oxalate concentration in the supernatants was measured in triplicate by using an enzymatic kit (Darman Faraz Kave) (Tehran, Iran) (Karamad et al., 2019), based on the oxidation of oxalate by oxalate oxidase followed by detection of H2O2 produced during the reaction (Tsai et al., 2005).
.Oxalate assay kit as a colorimetric method is a sensitive, easy-to-use, and high throughput adaptable kit for estimation of oxalate content in solution. In this method on oxalate content estimation, oxalate reacts with oxalate converter and oxalate enzyme mix to form a media, which visible in spectrophotometry. This enzymatic kit can detect oxalate contents in the range of 0.05–0.7 mmol. Before measuring, the pH value of each sample was adjusted to between 5 and 7 using either 1 N of an HCl or NaOH solution. All of the samples were diluted with a diluent which contained EDTA of chelating calcium within the sample. Diluted samples were purified with sample purifying tubes which contained activated charcoal. After centrifuging samples in sample-purifying tubes, the supernatant was collected via filtering through filter paper. Fifty microliters of purified supernatant were added into 1 ml of reagent A and then 200 μl reagent B was added. The optical density value at a wavelength of 590 nm was then measured. The oxalate concentration was calculated by multiplying of the dilution factor with the reading obtained by comparing the measured optical density value with that of a standard solution (1 or 0.5 mmol standard solutions of oxalate). If the initial optical density ratio exceeded that of the 1 mmol oxalate standard solution, the sample was further diluted and the measurement was redone. The process was repeated until the reading was within range.
Calculation of oxalate concentration obtained from Eq. (1).
| (Eq.1) |
Where 0.25 is the concentration of oxalate in standard and 2 is the dilution factor.
2.4. Utilization of substrate and growth yield
The utilization of substrate was determined as the difference between the initial concentrations of oxalate concentration in broth media and their final concentrations after 4 days incubation period. After pasteurization of media at 90 °C for 15 min broths were centrifuged at 5000×g for 10 min, and the supernatants were used to determine the concentrations of residual oxalate. Oxalate degradation was estimated as a percentage (initial concentration over final concentration).
2.5. Experimental design, selection of variables and their levels
The experimental design is a key tool when in research several independent variables may influence a particular response. The classic approach is a screening of variables with Plackett-Burman design at the beginning of study, finding main variables and then drawing the response surface for achieving optimum condition (Jahadi et al., 2015; Hadiani et al., 2018, 2019; Zoghi et al., 2019). At the beginning of the study 10 variables were selected based on literature review and our pre-experience and screened with PBD (Khosravi-Darani et al., 2008; Esmaeili et al., 2012). After screening degradation optimization conducted in Response Surface Method (RSM). RSM can be used for assessing the relative importance of various factors in the presence of complex interactions (Khosravi-Darani et al., 2008; Esmaeili et al., 2012). With RSM, different levels of functional factors can be used to achieve maximum efficiency with minimum tests. One of the most common practical methods in RSM is the application of Box Behnken Design, as coefficients of the second-degree model can be estimated easily.
2.6. Selection of variables and range finding
All process variables and corresponding concentrations was listed for study by the experimental design of Plackett Burman. We used pH factor in two levels: 5.5 and 7. pH 5.5 is in the acidic range. In this variable experiment O. formigenes showed that with proton consumption as the index of activity, the pH optimum for oxalate degradation by O. formigenes was arising to approximate pH: 7. Sucrose with two levels: 10 and 20 g/L and glucose in two levels: 20 and 40 g/L as a carbon source for bacterial consumption depend on the need for bacterial source. Sodium oxalate in two levels: 5 and 20 mmoL/L and ammonium oxalate in two levels: 10 and 20 mmoL/L as bacterial degrading substrate. Below 5 mmoL/L the growth will stop, and above 30 mmoL/L, sodium oxalate is very unsolvable and couldn’t be consumed well by bacteria. Yeast extract in two levels: 0 and 0.1 percentage in the medium as an extra source for nitrogen. Inoculum size in two ranges: 106 CFU/ml and 1010 CFU/ml for studying the oxalate degrading activity. Inoculum age in two levels: 18 h and 36 h which are the most recommended ages in related articles. Inulin in two levels: 0 and 1 g/L that can induce the growth or activity of oxalate degrading bacteria. After screening design, four main factors were selected for further study by RSM as ammonium oxalate, inulin and glucose solutions, and pH. The experimental design and selected levels were based on results of screening design and previous experiences (Table 1) for every 29 samples. Final culture media were inoculated with 100 μl of preadapted O. formigenes suspension.
Although recently there have been researchers who proclaimed the advantages of real-value encodings of GAs (Chauhan et al., 2018; Kumar et al., 2019). The GAs provide a very flexible framework and recently have been regarded as not only a global optimization method but also a multi-objective optimization method in various areas. Binary encodings are still more popular for several reasons, one of which is that much of the existing GA theory is based on the assumption of fixed-length binary encodings, including the so-called fundamental theorem of genetic algorithms or the Schema theorem. In this study, the binary encoding GAs were adopted (Table 5).
Table 5.
The parameters relevant to a Simple Genetic Algorithm.
| Parameters | |
|---|---|
| Population size | 50 |
| Number of bits | 20 |
| Mutation rate | 0.4 |
| Cross over rate | 0.8 |
| Maximum generation | 200 |
3. Results and discussion
3.1. PBD
The first screening step was to identify the variables which have significant effects on oxalate degradation by O. formigenes DSM 4420. Selection of these factors was based on previous experiences and selection of settings reflects a wide but reasonable numerical range. The design matrix of the PBD for the effects of 10 variables on oxalate degradation and their responses are shown in Table 1. Results showed the highest oxalate degradation of 52.76% of oxalate in run 11. As Table 3 shows oxalate degradation was most affected by the change in the amount of four variables
Table 3.
Analysis of variance (ANOVA) of the regression model from the Plackett-Burman design for oxalate degradation in un-coded units.
| Source | Sum of Squares | df | Mean Square | F-value | p-value | |
|---|---|---|---|---|---|---|
| Model | 6499.19 | 9 | 722.13 | 54.90 | <0.0001 | significant |
| A-pH | 724.96 | 1 | 724.96 | 55.12 | 0.0003 | |
| C-Glucose | 375.39 | 1 | 375.39 | 28.54 | 0.0018 | |
| E-Ammonium oxalate | 2627.59 | 1 | 2627.59 | 199.77 | <0.0001 | |
| J-prebiotic | 1321.69 | 1 | 1321.69 | 100.48 | <0.0001 | |
| AC | 161.54 | 1 | 161.54 | 12.28 | 0.0128 | |
| AD | 563.11 | 1 | 563.11 | 42.81 | 0.0006 | |
| Residual | 78.92 | 6 | 13.15 | |||
| Cor Total | 6578.10 | 15 |
*df, degrees of freedom.
R2 _ 0.9217.
Adjusted R2_0.8700.
Predicted R2_0.6147.
(p ≤ 0.05).
The optimization of oxalate degradation was performed by response surface method. The basic role of screening tests is to choose essential principle impacts from less critical ones. In this study, screening was used to generate a second-degree equation and to test the significance of factors. Results from the three-level partial factorial design are shown in Table 1, while analysis of variance (ANOVA) results for evaluations of the second-order model are shown in Table 3. ANOVA showed that the model used was suitable and the lack-of-fit test was insignificant. Th1byuke second-order model generated for screening was curved. The statistical design of BBD was applied to optimize potential oxalate degradation by varying the parameters pH (A), inulin (B), ammonium oxalate (C) and glucose (D) at different concentration range. Based on the results, the response was obtained. The ANOVA for the acquired model was organized (Table 4). The three-dimensional (3D) contour plots for the optimal levels of each variable for maximum oxalate degradation were illustrated in Fig. 2 (A to F).
Table 4.
Analysis of variance (ANOVA) of the regression model from the response surface quadratic model design for oxalate degradation in un-coded units.
| Source | Sum of Squares | Mean (df) | F-value | p-value | ||
|---|---|---|---|---|---|---|
| Model | 4518.20 | 14 | 322.73 | 4.79 | 0.0030 | significant |
| A-pH | 129.22 | 1 | 129.22 | 1.92 | 0.1878 | |
| B-Inulin | 166.56 | 1 | 166.56 | 2.47 | 0.1383 | |
| C-ammonium oxalate | 335.17 | 1 | 335.17 | 4.97 | 0.0426 | |
| d-glucose | 456.33 | 1 | 456.33 | 6.77 | 0.0209 | |
| AB | 252.54 | 1 | 252.54 | 3.75 | 0.0734 | |
| AC | 586.12 | 1 | 586.12 | 8.70 | 0.0106 | |
| AD | 205.49 | 1 | 205.49 | 3.05 | 0.1027 | |
| BC | 271.92 | 1 | 271.92 | 4.03 | 0.0643 | |
| BD | 74.39 | 1 | 74.39 | 1.10 | 0.3112 | |
| CD | 114.92 | 1 | 114.92 | 1.71 | 0.2127 | |
| A^2 | 208.80 | 1 | 208.80 | 3.10 | 0.1002 | |
| B^2 | 765.69 | 1 | 765.69 | 11.36 | 0.0046 | |
| C^2 | 348.04 | 1 | 348.04 | 5.16 | 0.0394 | |
| D^2 | 773.11 | 1 | 773.11 | 11.47 | 0.0044 | |
| Residual | 943.56 | 14 | 67.40 | |||
| Lack of Fit | 842.38 | 9 | 93.60 | 4.63 | 0.0532 | not significant |
| Pure Error | 101.17 | 5 | 20.23 | |||
| Cor Total | 5461.75 | 28 |
Adjusted R2_0.8601.
Predicted R2_0.7012.
Fig. 2.
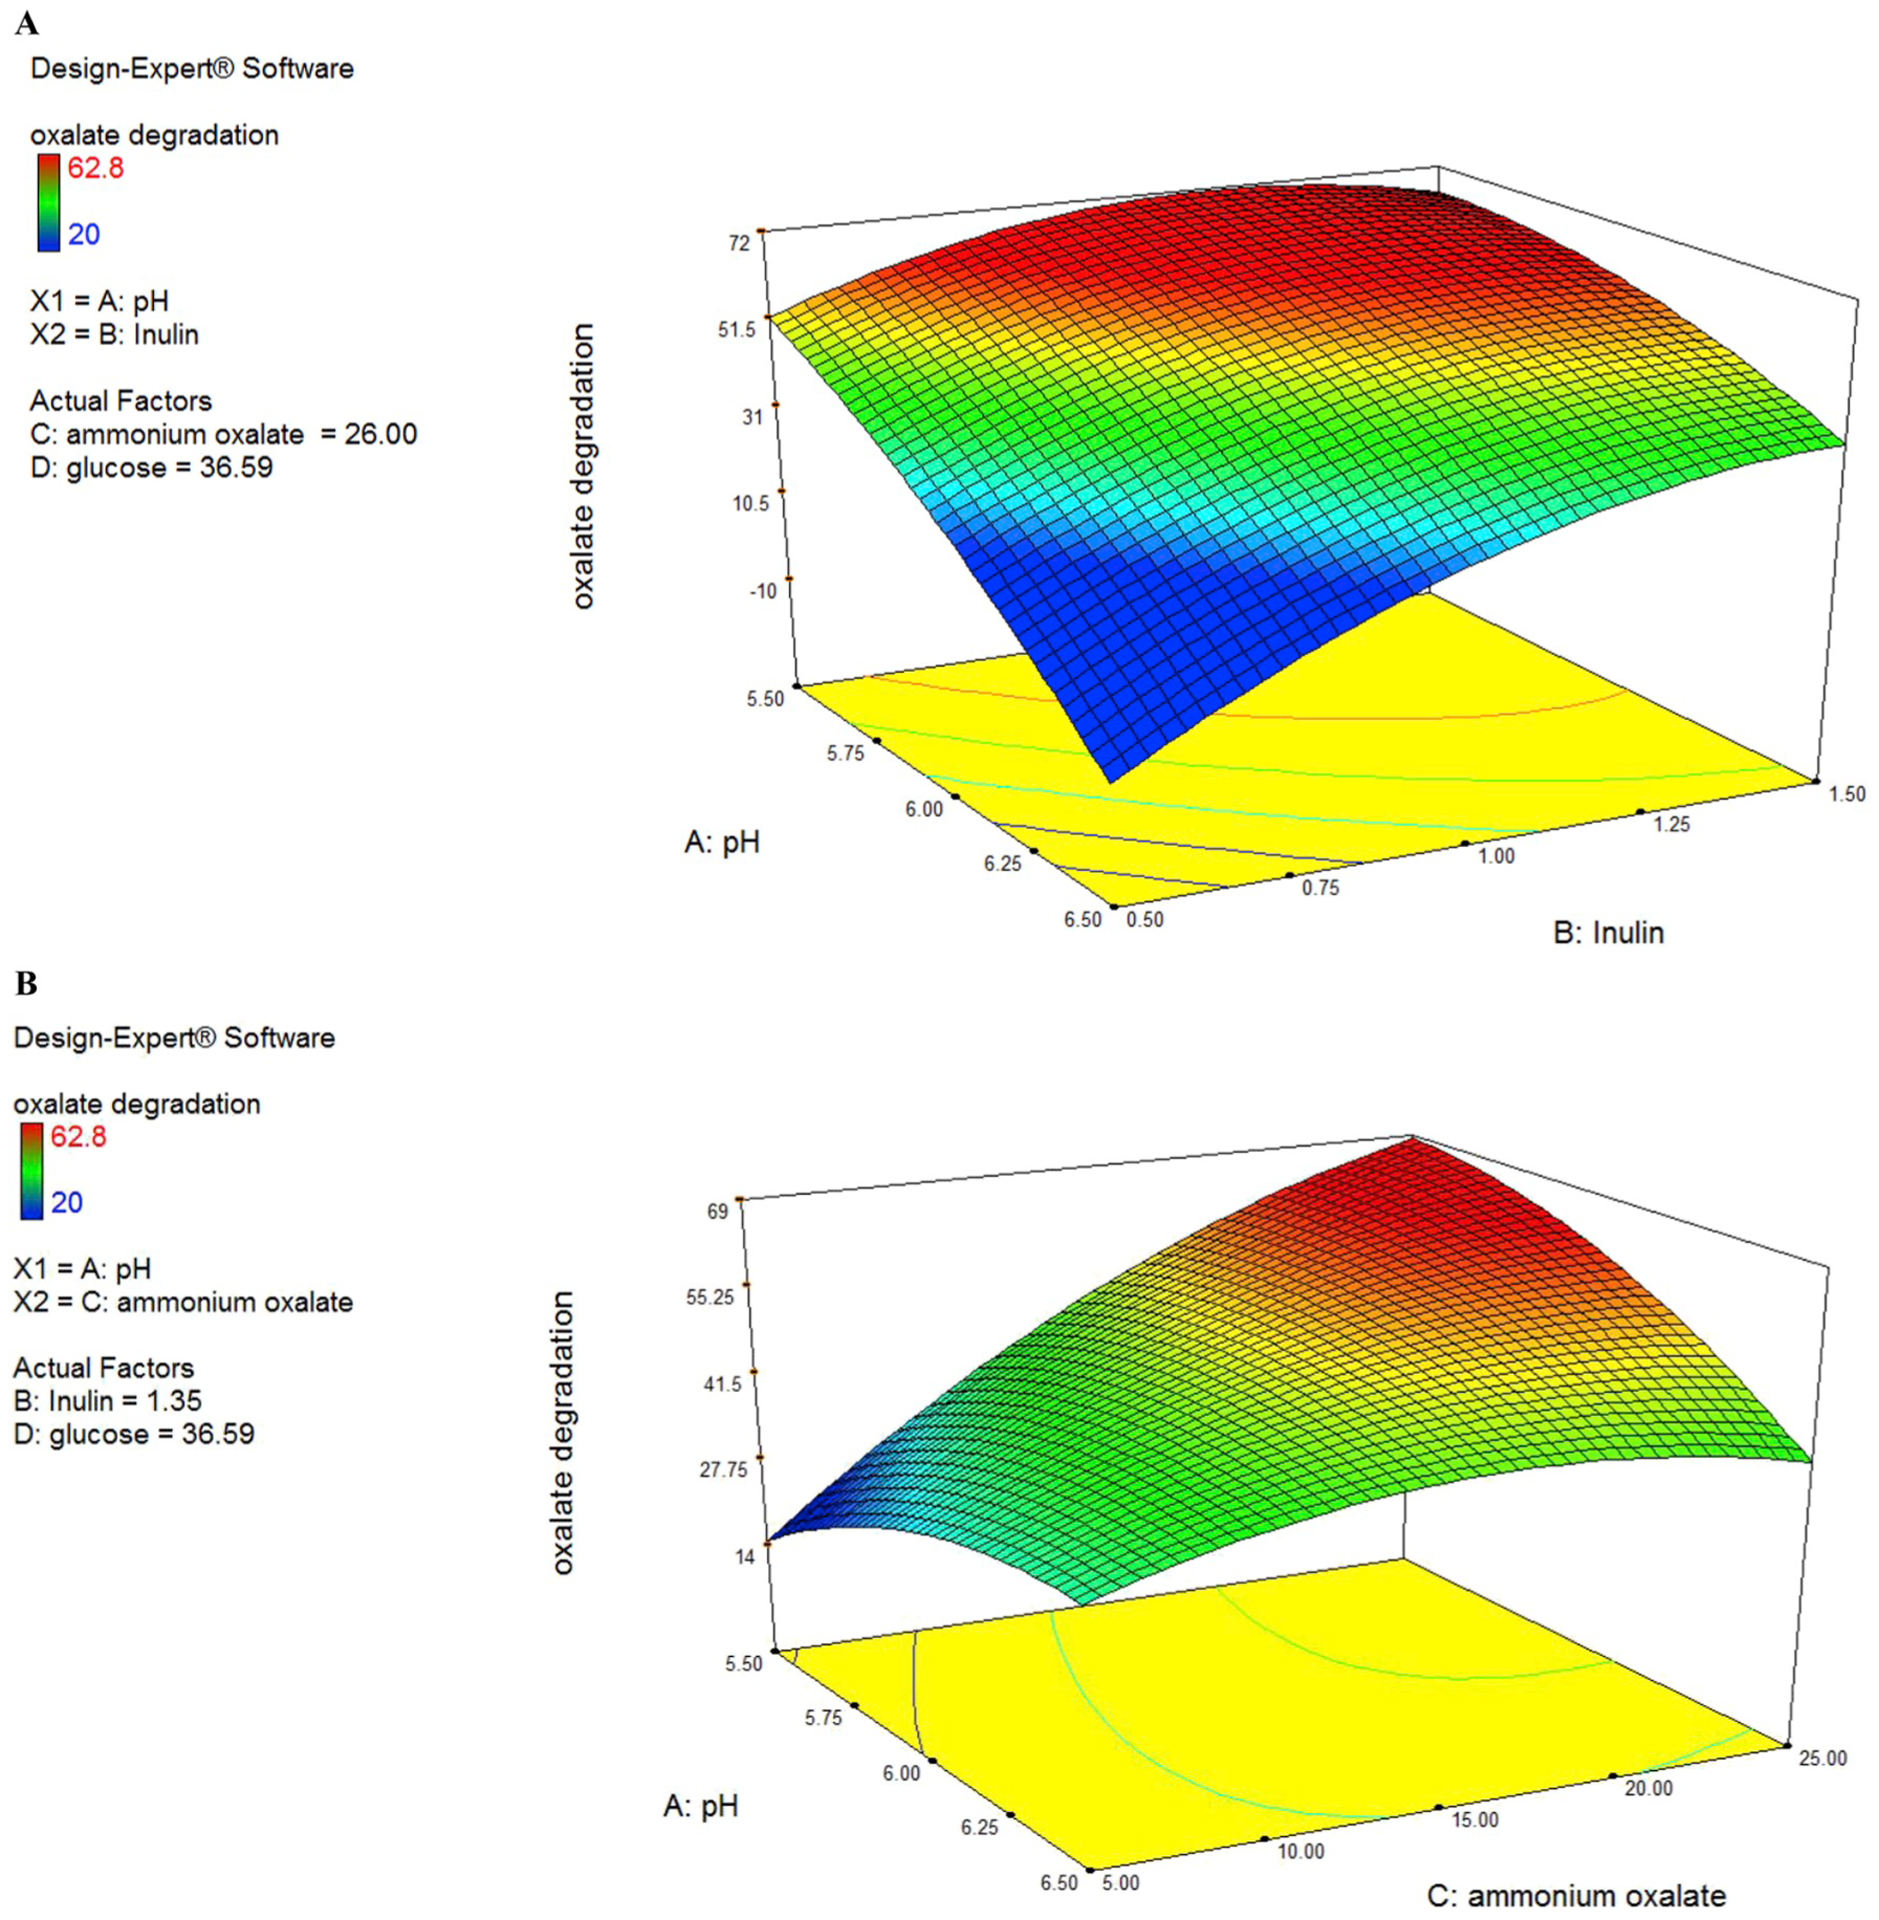
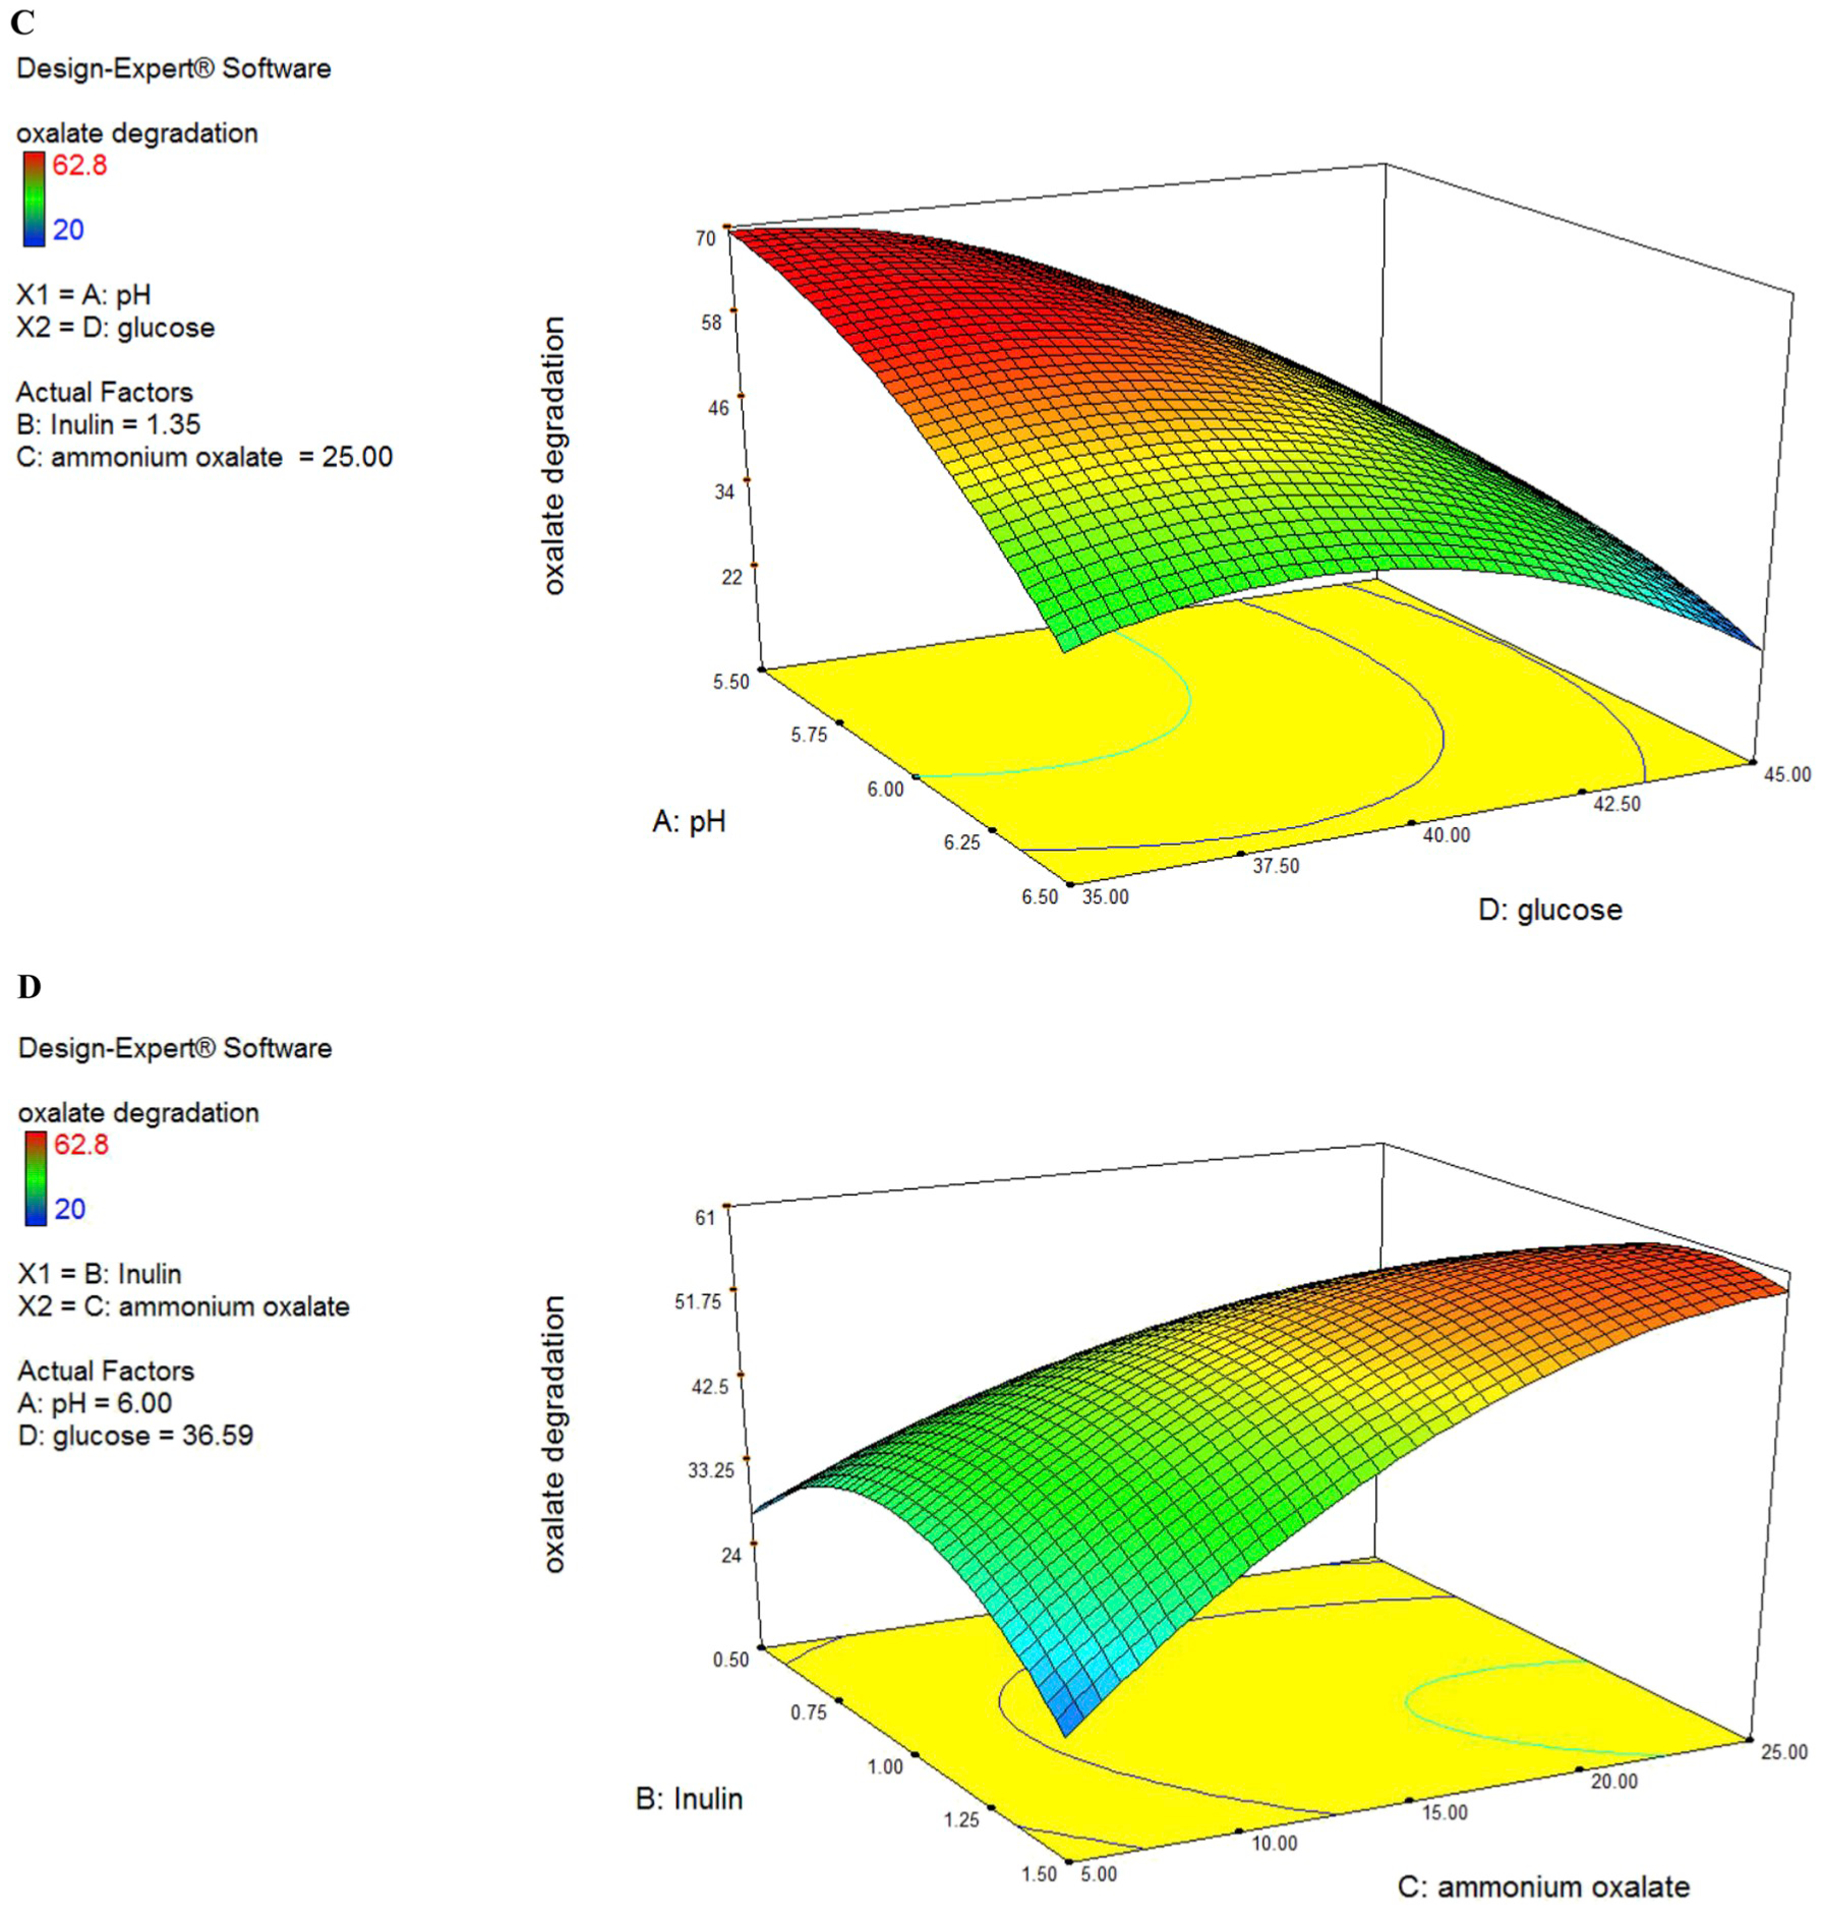
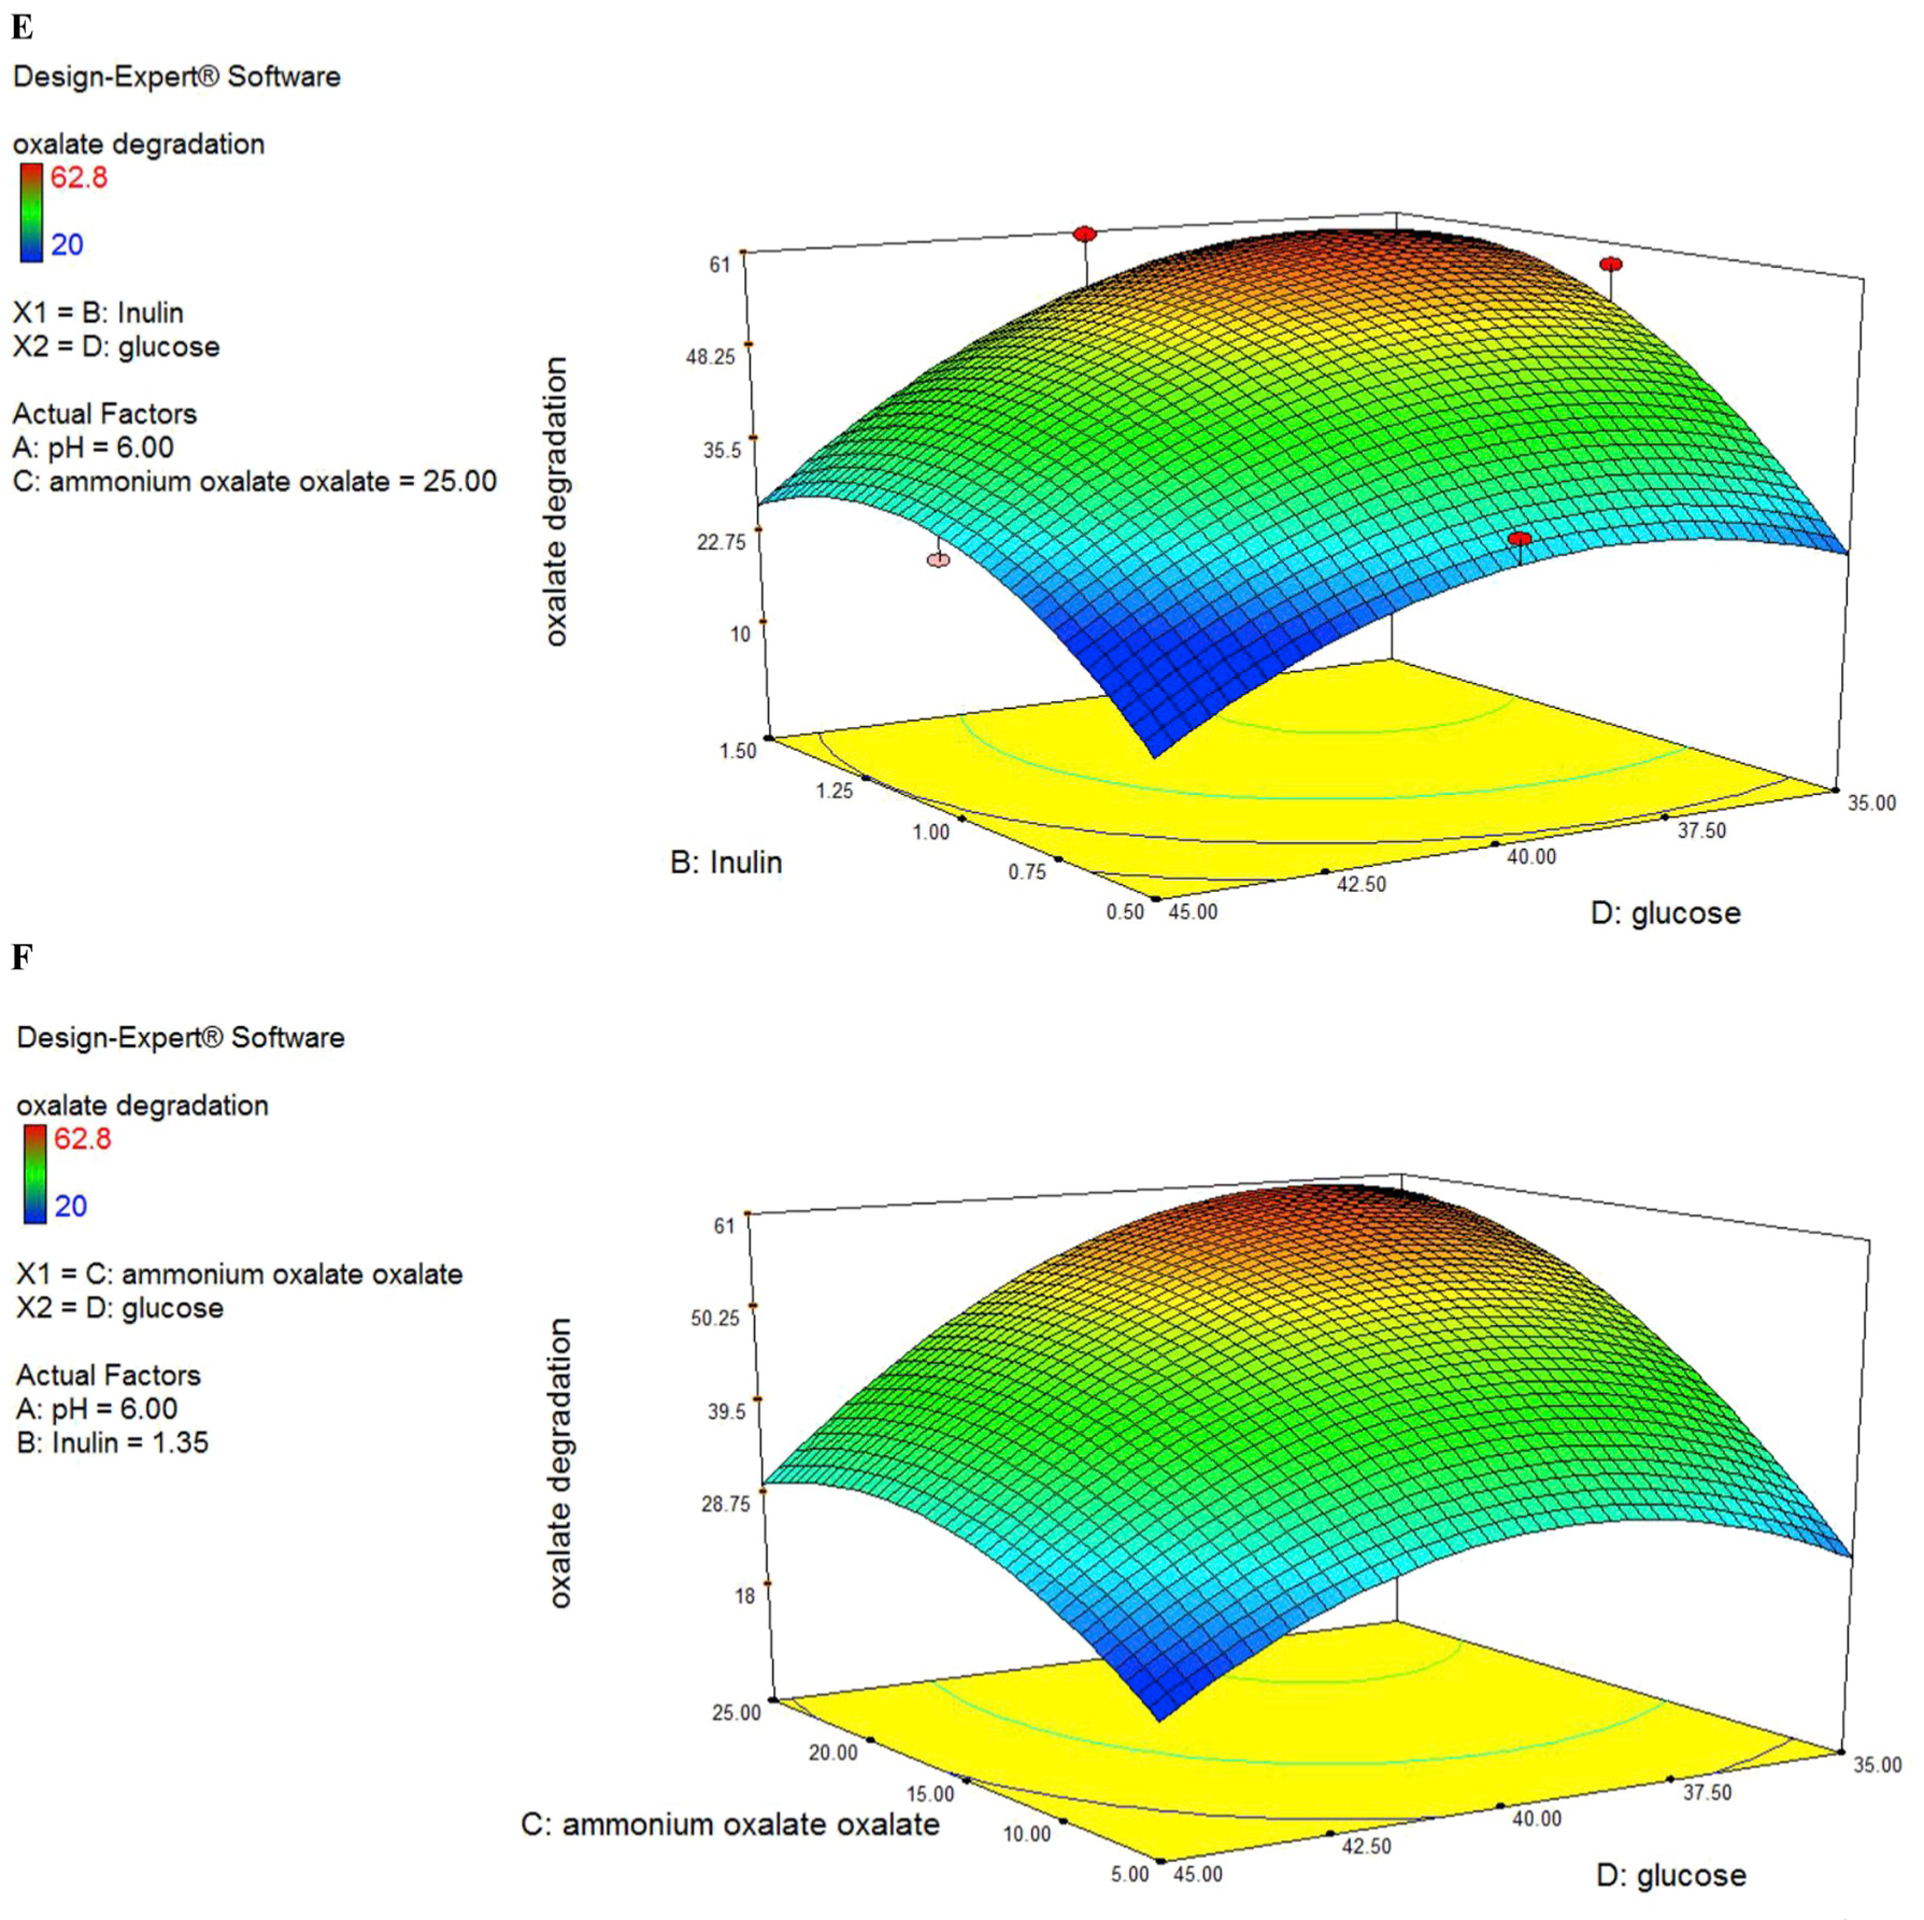
(A to F). Response surface for oxalate degradation from the effects of pH at 6.5 (A), Inulin at 1.484 (g/L) (B), ammonium oxalate at 16.042 (mmol/L) (C) and glucose at 44.819 (g/L) (D).
The predicted values were calculated mistreatment multivariate analysis and connected with experimental knowledge that was well in agreement with the expected response values (Fig. 2C). ANOVA analysis showed that AC interaction has the highest F-value (8.7) among the other variables and it indicated that interaction between pH and ammonium oxalate has the highest impact on oxalate biodegradation.
In this case, C, D, AC, B2, C2, D2 are significant model terms. C variable had a positive significance on oxalate degradation efficiency. Interactive effect of variables AC (pH and ammonium oxalate) showed the most significant positive impact on oxalate degradation efficiency as compared to AB (pH and inulin) and other interactions (Fig. 2A and B) with the P ≤ 0.05.
The result of every issue was assessed by the utilization of perturbation plots to indicate however the response changes as each issue moves from the chosen indicator, with all different factors command constant at reference values. For this study, together specific chosen issue was assessed, the opposite factors were controlled constant at the optimum purpose. An optimum point was produced, with optimum oxalate degradation obtained at 62.8%. The combination that produced the optimum point was (X1, X2, X3, X4) _ (0.853, 0.841, 0.25, 0.921). The original levels that correlated with those coded values were found to be pH at 6, Inulin at 1.35 (g/L), Ammonium oxalate at 26 (mmol/L), glucose at 36.56 (g/L). The constant estimate represents the expected modification in response per unit modification in issue worth once all remaining factors area unit control was constant (See Fig. 1).
Fig. 1.
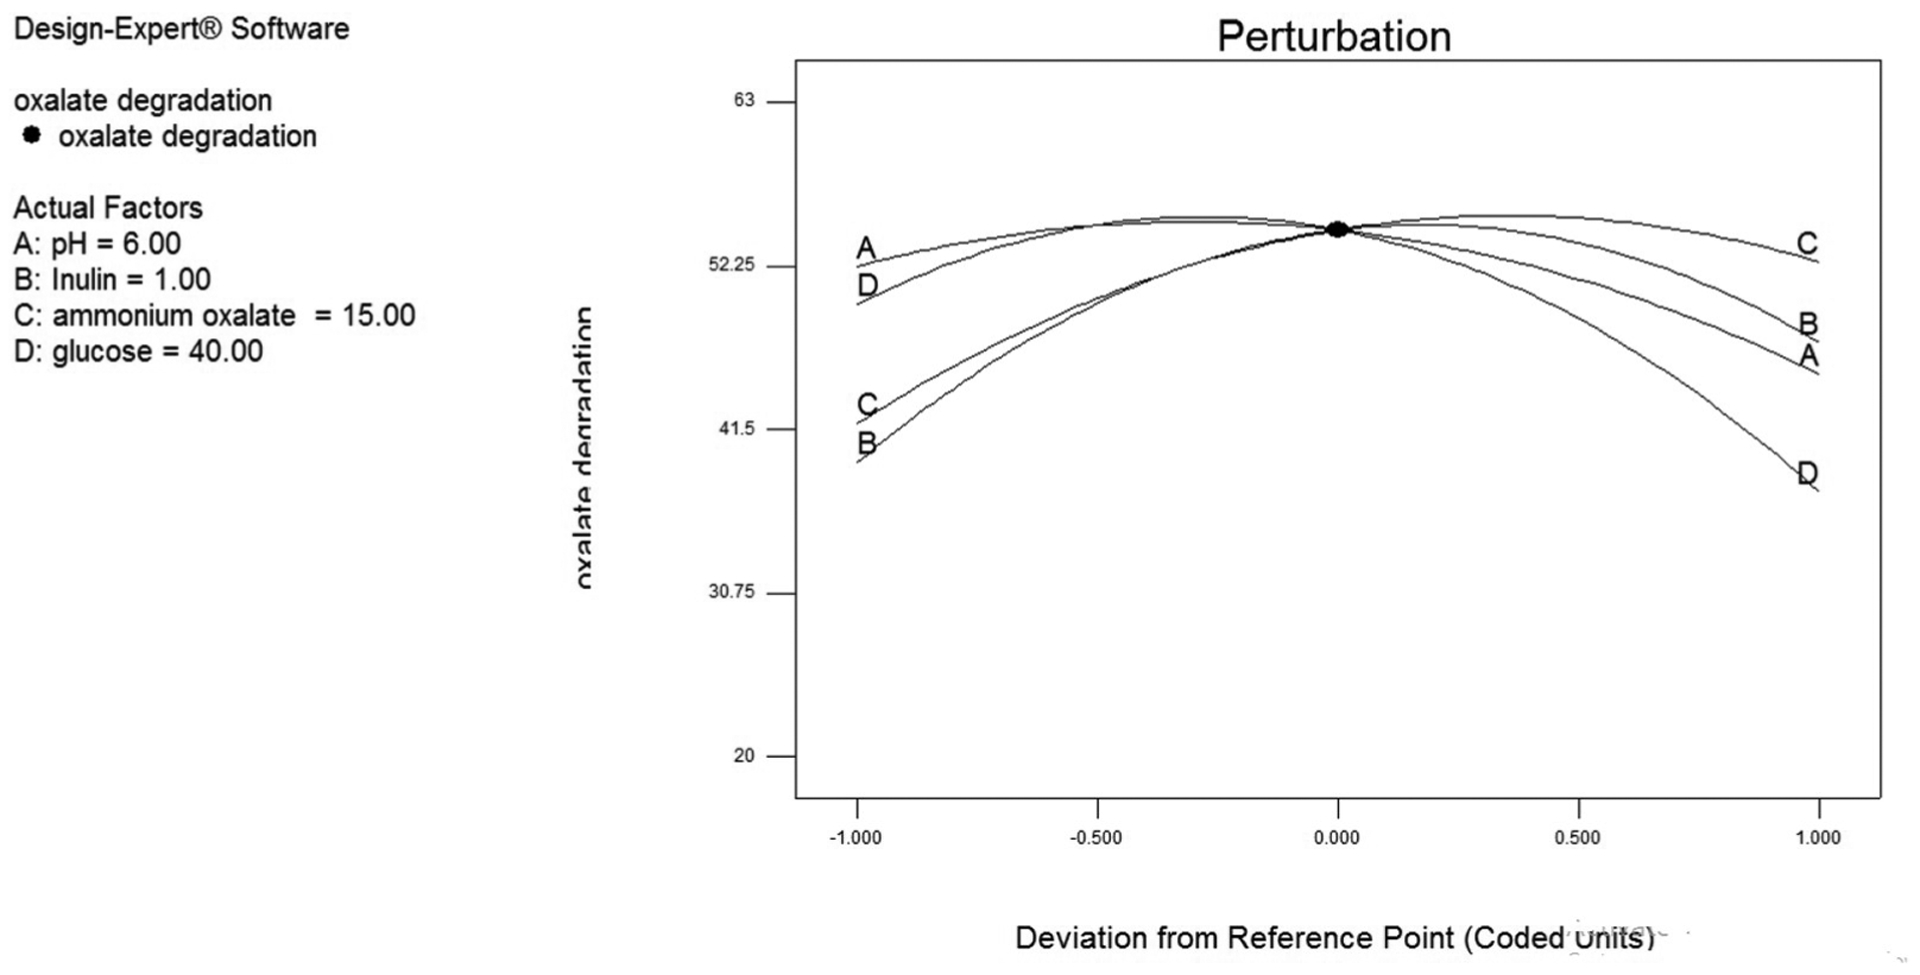
Perturbation plot of pH (A), Inulin (B), ammonium oxalate (C), glucose (D).
From the three-dimensional plot of pH and ammonium oxalate (Fig. 2B), we found that when the optimum point was achieved, the levels of pH and ammonium oxalate were 6 and 25 (mmol/L) respectively. However, it must be noted that the interaction of A and C also showed a negative sign (antagonistic effect). This may flow from to alternative terms that dominate this explicit interaction term.
3D plots showed significant influence on oxalate degradation either independently or in interaction with each other. In this case, C, D, AC, B2, C2, D2 are significant model terms. The “Lack of Fit F-value” of 4.63 implies the Lack of Fit is not significant relative to the pure error. No significant lack of fit is good and considered that the model is fit. All factors studied showed significant quadratic effects, as shown by the P values of the coefficient estimates. Other than the main quadratic effects, the interaction between the ammonium oxalate and pH produced a strong influence on bacterial biodegradation. The response surface of AD interaction (pH and glucose) showed that in a medium level of pH and glucose concentration the highest level of oxalate degradation achieved. Experts have previously shown that in vitro oxalate consumption and degradation is associated. Knowing this, it would be beneficial to maintain or improve the viability of O. formigenes oxalate degrading ability via glucose sources in in vivo models to favor as well.
Prebiotics fermentation by gut microbiota produces short-chain fatty acids, which improve the ability of gut probiotic bacteria. The response surface generated from the second-order coefficients showed a close correlation with substrate utilization (Fig. 2A, D & 2E). This indicated that the production of SCFA from the fermentation of inulin was closely associated with the uptake of the substrate. However, it must be noted that increasing the level of Inulin generated a decrease in SCFA production but increased ammonium oxalate utilization. The hydrolysis of Inulin was repressed by the products of the hydrolysis (Darilmaz et al., 2018). Thus, we postulate that an increase in ammonium oxalate utilization in the experimental regions would generate higher concentrations of hydrolysis products and subsequently repress further SCFA production.
The response surfaces of oxalate degradation in Fig. 2A (pH vs inulin), 2D (Ammonium oxalate vs inulin) and 2E (glucose vs inulin) showed that biodegradation increased with increasing inulin concentration from 1 to 1.5 g/L, glucose from 39 to 45 g/L, ammonium oxalate 5–20 mmoL/L, pH from 6 to 6.5, but a further increase in these variables produced a decrease in oxalate utilization. Maximum oxalate degradation was produced at high level of glucose, pH and inulin, medium level of ammonium oxalate.
The interaction effects showed that the interactions between pH and ammonium oxalate, pH and inulin and pH and glucose was significant. As the pH increased from 5.5 to 6 the ammonium oxalate degradation increased from 15 mmoL/L to 26 mmoL/L. In contrast, at a low ammonium oxalate concentration (15 mmoL/L), substrate utilization decreased with decreasing pH medium. This may be due to competition for the oxalate consumption with increasing cell numbers at low substrate levels. It must be noted that substrate utilization increased with ammonium oxalate content increasing and increasing medium pH value, because O. formigenes has the best oxalate degradation activity in about pH: 6. pH show an overall significant interaction effect with the inulin and it generated a significant main quadratic effect. Our results indicated that interactions between the pH and inulin might have a stronger influence on oxalate degradation at maximally high pH level (pH: 5.5 to pH: 6) and high inulin level (1 g/L to 1.5 g/L). It must be noted that substrate utilization increased with increasing inulin as prebiotic media at high pH value (Fig. 2A). This indicated that the degradation of oxalate by O. formigenes in the presence of inulin as a prebiotic medium was more effective at pH: 6. Our experimental results showed that the highest interactive effect of these two variables on oxalate biodegradation might be at pH: 6 and medium glucose concentrations (39–40 g/L). This indicated that glucose consumption by O. formigenes is more efficient in pH: 6 because the bacteria gene expression of oxalate degradation and consequently energy consumption of bacteria in this pH value is high and the glucose is the carbon source of energy for bacteria. Inulin and ammonium oxalate showed a significant interaction effect. Our results showed that inulin had a high effect on oxalate degradation in concentrations 1–1.5 g/L but the amount of oxalate degradation was low. This indicated that inulin as one carbon source cannot influence on oxalate degradation and glucose must be present in the media as a carbon source for O. formigenes.
3.2. Search of an optimal value using genetic algorisms
For optimization using the GAs. Fig. 3 shows the evolution curves in searching for an optimal value. The number of function evaluations reached the maximum value in the curves of the GA technique. The searching procedure was stopped when the same maximum value with increasing numbers of function evaluations. The chromosomes having the maximum provided the optimal ratios of concentrations of the growth promoters. The number of function evaluations in Eq. (2) represents the efficiency of the algorithms. A smaller number indicates a higher efficiency.
| (Eq.2) |
Fig. 3.
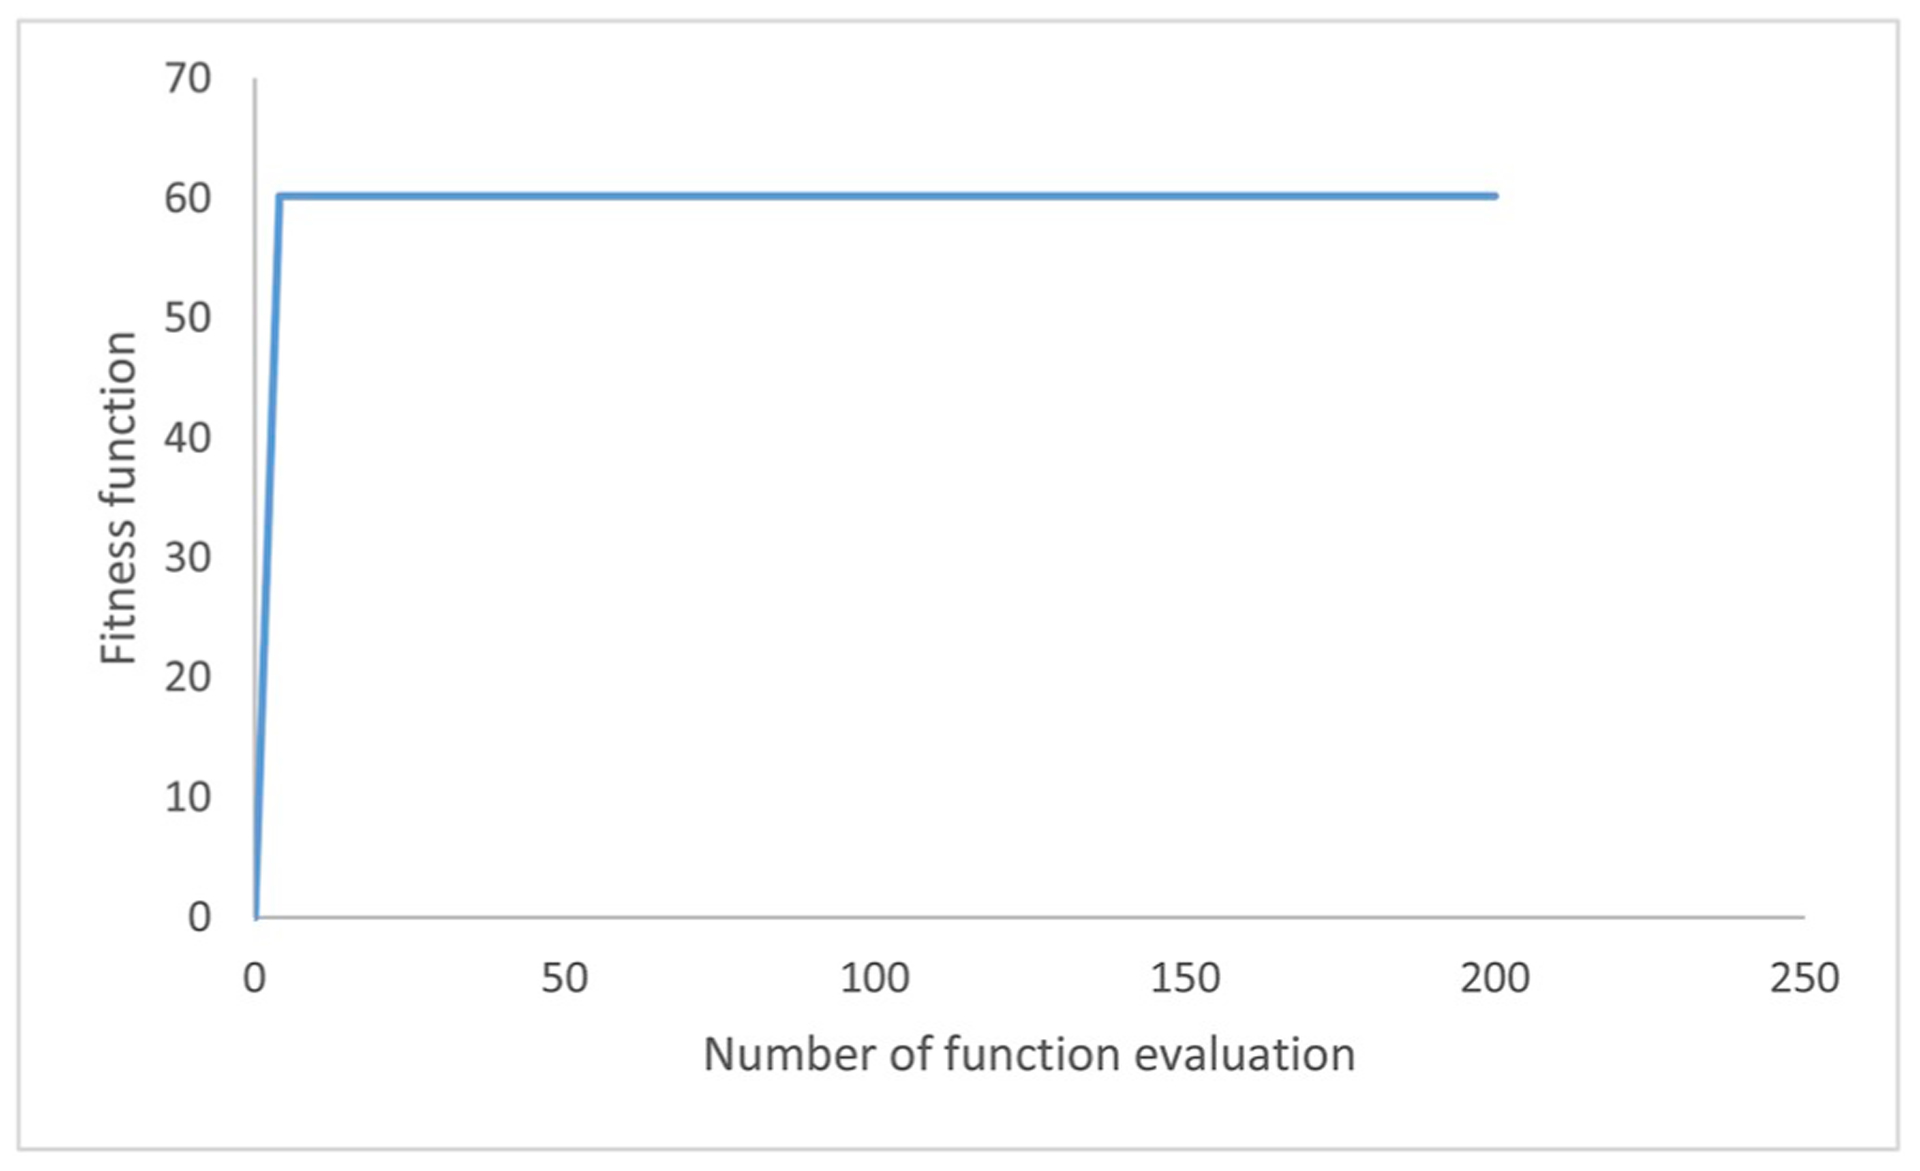
Evolution curves in searching for an optimal value under different search procedures of the genetic algorithm.
In Fig. 3, GA produced fast increasing during the early stage of optimization process.
Previous studies reported 0.94 and 0.73% oxalate degrading activities after three days of incubation with L. brevis in 10 and 20 mM ammonium oxalate media, respectively (Shoaib et al., 2016). Other studies found oxalate degrading activities ranging 54.8–58.3% in fermentation of 10 mM of potassium oxalate (KOX) with L. fermentum TY5, TY12 and AM3 strains (Campieri et al., 2001). In similar studies, 20 and 47% degrading activities were found in fermentation of 5 mM of sodium oxalate with L. rhamnosus PB41 and PB45 strains (Turroni et al., 2010). The ability of O. formigenes to degrade oxalate in a simulated humangut environment was tested by Fecal oxalate measurements in the study by Jiang et al. 2011 [34] allowed the yield of O. formigenes per mg oxalate to be estimated. Total fecal oxalate recovered from stool of non-colonized and colonized subjects on the highest oxalate diet tested (750 mg oxalate/1000 mg calcium) was 477 ±60 and 93 ± 25 mg oxalate (mean ± SEM), respectively, indicating O. formigenes degraded approximately 51% of dietary oxalate ingested per day and other bacteria degraded 36% of total dietary oxalate. Total mean fecal O. formigenes number on the 750 mg oxalate diet was 4.9 * 1010 ± 8.7 * 109 cells (mean ± SEM). Thus, these data suggest that approximately 1 * 108 O. formigenes cells are produced per mg of dietary oxalate degraded assuming that degradation of intestinal oxalate by bacteria other than O. formigenes was similar in colonized and no colonized individuals. Duncan et al. (2002) using a single-stage, continuous-culture fermenter inoculated with a human fecal sample that contained 10 mmoL/L Sodium oxalate and no detectable oxalate-degrading bacteria prior to the study. Results showed that O. formigenes strain OxB was able to colonize the fermenter and degrade nearly all of the oxalate supplied in the culture medium in 2 days. In general, oxalate-degrading activity in this study was higher than the previous studies (See Fig. 4). In terms of differences within-species, oxalate degradation rates of the same strain were variable at different concentrations of oxalate. Differences within-species or within-strains in oxalate degrading activity could be explained with physiological states of cells (Turroni et al., 2010), acidic conditions and pre-adaption of cells with low levels of oxalate.(See Table 6)
Fig. 4.
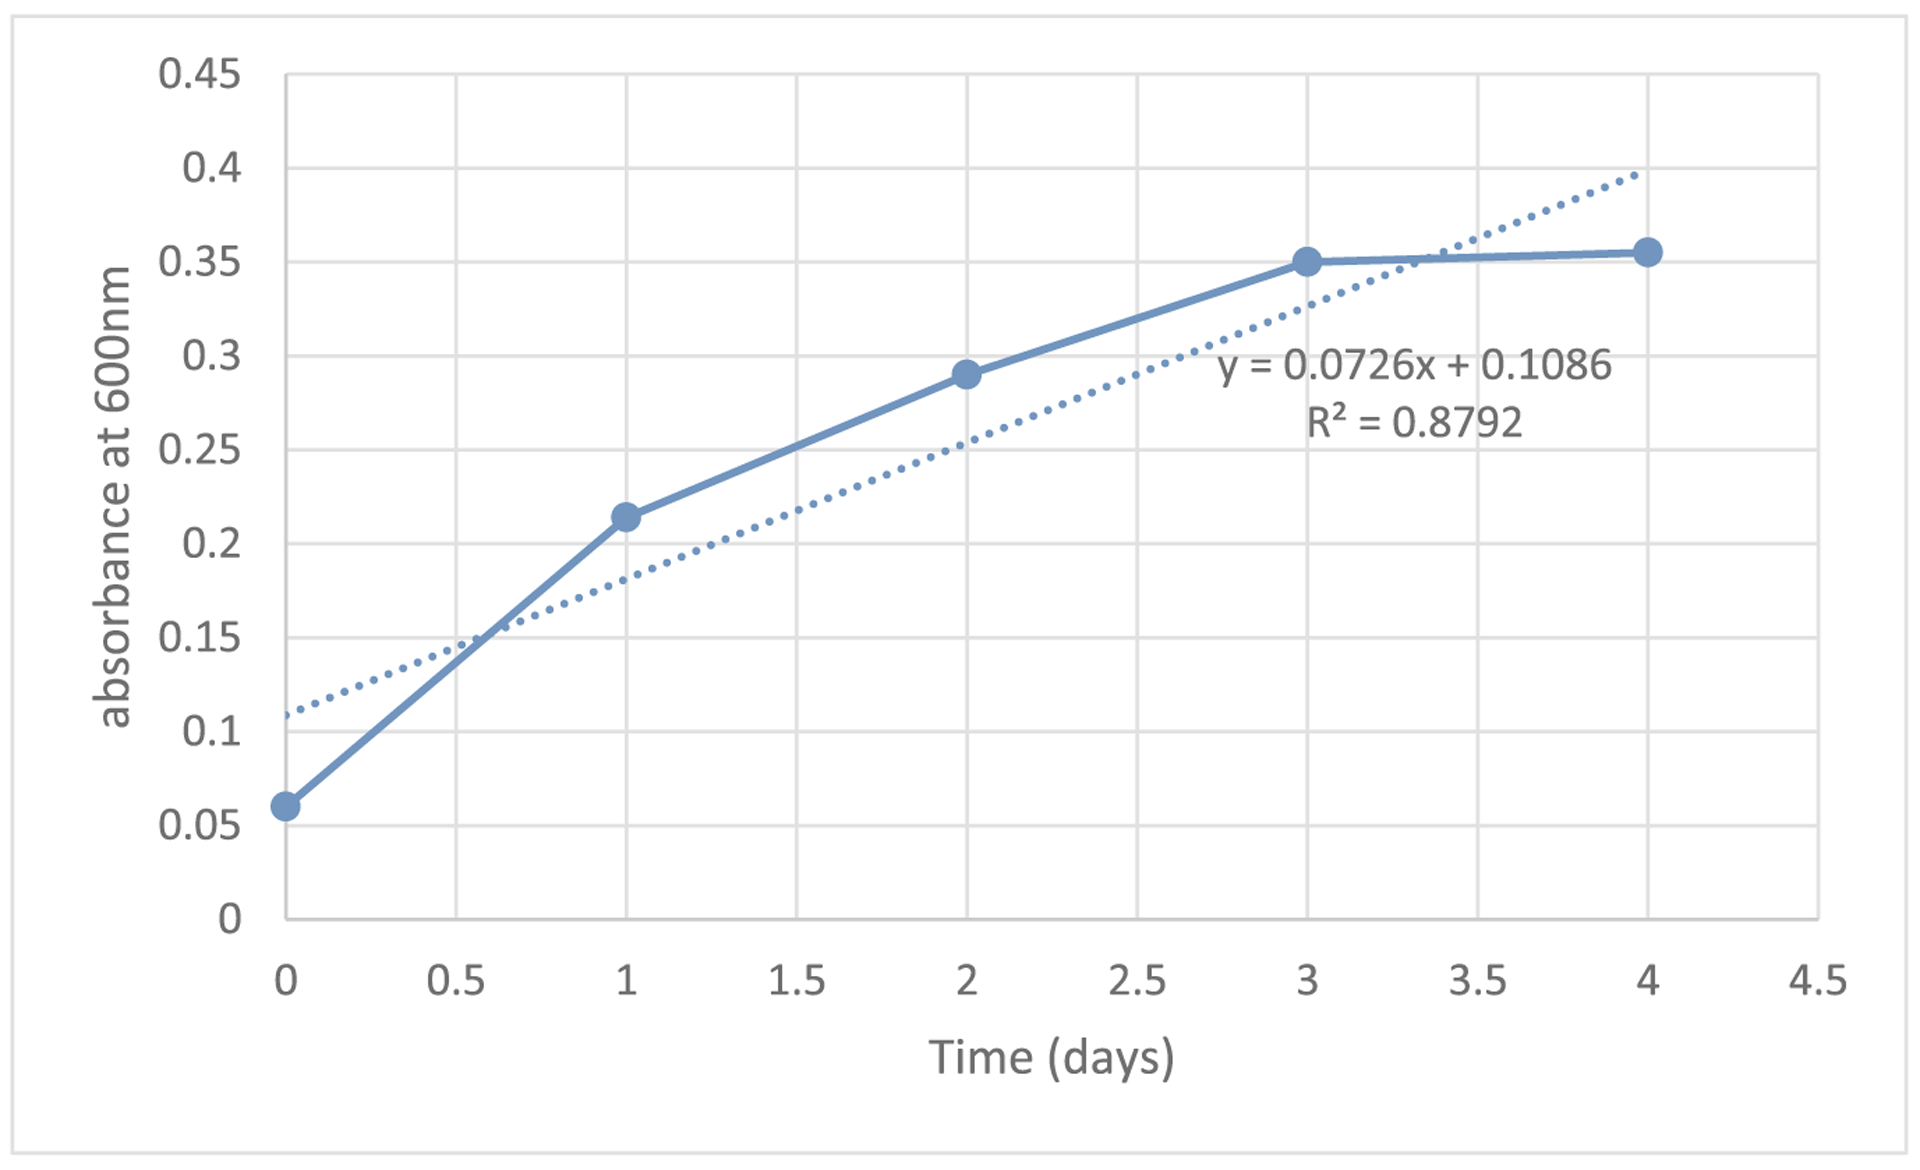
Oxalobacter formigenes growth curve in media containing 25mmol/L sodium oxalate.
Table 6.
In vitro growth and degradation of oxalate salt by different strains of lactic acid bacteria.
| No. | Microorganism | Salt | Initial = ]8concentration (mmol/L) | Final concentration (mmol/L) | % | Incubation time |
Reference |
|---|---|---|---|---|---|---|---|
| 1 | L. plantarum | ammonium oxalate | 10 | 9.858 | 1.42 | three days | Campieri et al. (2001) |
| 2 | L. brevis | ammonium oxalate | 10 | 9.906 | 0.96 | three days | Campieri et al. (2001) |
| 3 | S. thermophiles | ammonium oxalate | 10 | 9.769 | 2.31 | three days | Campieri et al. (2001) |
| 4 | L. acidophilus | ammonium oxalate | 10 | 8.821 | 11.79 | three days | Campieri et al. (2001) |
| 5 | B. infantis | ammonium oxalate | 10 | 9.474 | 5.26 | three days | Campieri et al. (2001) |
| 6 | L. plantarum | Sodium oxalate | 20 | 20 | 0 | three days | Campieri et al. (2001) |
| 7 | L. brevis | Sodium oxalate | 20 | 19.854 | 0.73 | three days | Campieri et al. (2001) |
| 8 | S. thermophiles | Sodium oxalate | 20 | 19.388 | 3.06 | three days | Campieri et al. (2001) |
| 9 | L. acidophilus | Sodium oxalate | 20 | 19.318 | 3.41 | three days | Campieri et al. (2001) |
| 10 | B. infantis | Sodium oxalate | 20 | 19.564 | 2.18 | three days | Campieri et al. (2001) |
| 11 | L. fermentum TY12 | potassium oxalate | 10 | 4.52 | 54.8 | five days | Gomathi et al. (2014) |
| 12 | L. rhamnosus PB41 | sodium oxalate | 5 | 4 | 20 | five days | Turroni et al. (2007) |
| 13 | L. rhamnosus PB45 | sodium oxalate | 5 | 2.65 | 47 | five days | Turroni et al. (2007) |
| 14 | L. acidophilus ATCC 4356 | sodium oxalate | 25 | 12.756 | 48.94 | four days | Karamad et al., 2019 |
As the gastrointestinal microbiota is a diverse and complex ecosystem, we evaluated the combined effects of strains of different species on oxalate degradation activity. In our study, the synergistic effect of synbiotic (mixed culture and inulin) on oxalate degrading activity was higher than the effect of the individual strain (P < 0.05). The degrading activity of the mixed culture increased after being grown in 35 mM Schaedler broth. Nevertheless, very scarce information is available on the influence of mixed culture on oxalate degrading activity. The mixture of O. formigenes with other strains may enhance the oxalate degradation capacity. According to our previous researches, L. acidophilus in 10 and 20 mmoL/L of sodium oxalate in the presence of inulin and glucose can degrade approximately 45% of oxalate in the medium. Ren et al. (2011) reported that the mixture of enterococcus or lactococcus isolates shows a significantly higher oxalate degrading capacity than the individual isolates. Different results were obtained with a mixture of Lactobacillus casei and Bifidobacterium breve. In their study, the mixture of L. casei and B. breve was shown to possess a variable lowering effect upon urinary oxalate excretion in stone-forming subjects, and they also suggested that this variable effect could be dependent on dietary oxalate intake. The difference in our study compared to the aforementioned studies is that the addition of inulin to rumen fluid media enhanced the degrading activity. The toxic or stimulating effect of oxalate and inulin on viability was also investigated in this study (Table 2). The results indicate that both oxalate concentrations affected the growth of Lactobacillus spp. while the oxalate with the concentration of 20 mM plus 5% inulin interestingly had a lesser effect than 10 mM oxalate plus 5% inulin. As oxalate degradation may be influenced by many factors, especially in vivo, our investigation is not comprehensive enough. Further studies are required to identify the suitable condition for oxalate degradation in the gastrointestinal tract.
4. Conclusion
This study shows that in comparison with control samples with 17% oxalate degradation the optimal oxalate degradation with different variables was increased to 60.204% in the pH value of 6 and in the presence of 1.35 (g/L) inulin, (mmol/L) ammonium oxalate, and 36.56 (g/L) glucose. In pH 6 Proton Motive Force generate by oxalobacter formigenes DSM 4420 so the oxalate degradation of bacteria increased (Kuhner et al., 1996). Inulin was the preferred substrate for growth as a carbon source, oxalate degradation, and the production of SCFA. Although lactic acid bacteria prefer other substrates to obtain energy in comparison to oxalate, it is reliable to use the lowest level of glucose in O. formigenes DSM 4420 colonization. The results derived from this study will benefit the development of a probiotic product that will particularly target oxalate degradation. The validation experiment and reconfirmation tests showed that RSM was reliable for developing a model, optimizing factors, and analyzing interaction effects. In vivo experiments are required to ascertain the oxalate degradation capacity of O. formigenes DSM 4420 in the presence of inulin and glucose.
A surface model using the RSM and optimizing this model using the GA technique, resulted in a useful method of finding an optimal set of process parameters. In the current study, the RSM and GA proved effective for optimization of the activity of Oxalobacter formigenes DSM 4420 biodegradation activity for high oxalate media content.
Acknowledgment
The research reported in this publication was supported by Shahid Beheshti University of Medical Sciences under award number 14956. The authors acknowledge Professor Steven L Daniel, for his scientific support. Also National Nutrition and Food Technology Research Institute for instrumental support.
Footnotes
Declaration of competing interest
There is no conflict of interests to declare.
Appendix A. Supplementary data
Supplementary data to this article can be found online at https://doi.org/10.1016/j.bcab.2019.101378.
References
- Balthazar CF, Silva HLA, Esmerino EA, 2018. The addition of inulin and Lactobacillus casei 01 in sheep milk ice cream. Food Chem. 246, 464–472. [DOI] [PubMed] [Google Scholar]
- Campieri C, Campieri M, Bertuzzi V, Swennen E, Matteuzzi D, Stefoni S, Pirovano F, Centi C, 2001. Reduction of oxaluria after an oral course of lactic acid bacteria at high concentration. Kidney Int. 60, 1097–1105. [DOI] [PubMed] [Google Scholar]
- Chauhan PS, Goradia B, Jha B, 2018. Optimization and up scaling of ionic liquid tolerant and thermo-alkali stable laccase from a marine Staphylococcus arlettae S1–20 using tea waste. J. Taiwan inst. chem e. 86, 1–8. [Google Scholar]
- Daniel SL, Hartman PA, Allison MJ, 1987. Intestinal colonization of laboratory rats with Oxalobacter formigenes. Appl. Environ. Microbiol 53 (12), 2767–2770. [DOI] [PMC free article] [PubMed] [Google Scholar]
- Darilmaz DO, Sonmez S, Beyatli Y, 2018. The effects of inulin as a prebiotic supplement and the symbiotic interactions of probiotics to improve oxalate degrading activity. Int. J. Food Sci. Technol 54 (2), 1–11. [Google Scholar]
- Duncan SH, Richardson AJ, Kaul P, Holmes RP, Allison MJ, Stewart CS, 2002. Oxalobacter formigenes and its potential role in human health. Appl. Environ. Microbiol 68 (8), 3841–3847. [DOI] [PMC free article] [PubMed] [Google Scholar]
- Esmaeili S, Khosravi-Darani K, Pourahmad R, Komeili R, 2012. An experimental design for production of selenium-enriched yeast. World Appl. Sci. J 19 (1), 31–37. [Google Scholar]
- Gibson GR, Roberfroid MB, 1995. Dietary modulation of the human colonic microbiota: introducing the concept of prebiotics. J. Nutr 125, 1401–1412. [DOI] [PubMed] [Google Scholar]
- Gomathi S, Sasikumar P, Anbazhagan K, 2014. Screening of ındigenous oxalate degrading Lactic Acid Bacteria from human faeces and south indian fermented foods: Assessment of probiotic potential. Sci. World J 4, 1–11. [DOI] [PMC free article] [PubMed] [Google Scholar]
- Hadiani MR, Khosravi-Darani K, Rahimifard N, Younesi H, 2018. Biosorption of low concentration levels of Lead (II) and Cadmium (II) from aqueous solution by Saccharomyces cerevisiae: Response surface methodology. Biocat. Agr. Biotechnol 15, 25–34. [Google Scholar]
- Jahadi M, Khosravi-Darani K, Ehsani MR, Mozafari MR, Sabouri AA, Zoghi A, Mohammadi M, 2015. Modeling of proteolysis in Iranianbrined cheese using proteinase-loaded nanoliposome. Int. J.Dairy. Technol 68, 1–6. [Google Scholar]
- Jiang J, Knight J, Easter LH, Neiberg R, Holmes RP, Assimos DG, 2011. Impact of dietary calcium and oxalate, and Oxalobacter formigenes colonization on urinary oxalate excretion. J. Urol 186, 135–139. [DOI] [PMC free article] [PubMed] [Google Scholar]
- Karamad D, Khosravi-Darani K, Hosseini H, Tavasoli S, Miller AW, 2019. Analytical procedures and methods validation for oxalate content estimation: in vitro design. Biointerface Res. Appl. Chem 9 (5), 4305–4310. [DOI] [PMC free article] [PubMed] [Google Scholar]
- Karamad D, Khosravi-Darani K, Hosseini H, Tavasoli S, Miller AW, 2019. Evaluation of process variables for sodium oxalate degradation by probiotic L. acidophilus in the presence of prebiotic. J. Appl. Microbiol submitted for publication). [Google Scholar]
- Kaufman DW, Kelly JP, Curhan GC, Anderson TE, Dretler SP, Preminger GM, Cave DR, 2008. Oxalobacter formigenes may reduce the risk of calcium oxalate kidney stones. JASN (J. Am. Soc. Nephrol.) 19 (6), 1197–1203. [DOI] [PMC free article] [PubMed] [Google Scholar]
- Khosravi-Darani K, Zoghi A, 2008. Comparison of pretreatment strategies of sugarcane baggase: Experimental design for citric acid production. Bioresour. Technol 99, 6986–6993. [DOI] [PubMed] [Google Scholar]
- Kuhner CH, Hartman PA, Allison MJ, 1996. Generation of a proton motive force by the anaerobic oxalate-degrading bacterium Oxalobacter formigenes. Appl. environ. microbial 62 (7), 2494–2500. [DOI] [PMC free article] [PubMed] [Google Scholar]
- Kumar V, Kumar A, Chhabra D, Shukla P, 2019. Improved biobleaching of mixed hardwood pulp and process optimization using novel GA-ANN and GA-ANFIS hybrid statistical tools. Bioresour. Technol 271, 274–282. [DOI] [PubMed] [Google Scholar]
- Murru N, Blaiotta G, Peruzy MF, Santonicola S, Mercogliano R, Aponte M, 2017. Screening of oxalate degrading lactic acid bacteria of food origin. Ital. J. Food Saf 6 (2), 6345. [DOI] [PMC free article] [PubMed] [Google Scholar]
- Ren Z, Pan C, Jiang L, Wua C, Liu Y, Zhong Z, Ran L, Ren F, Chen X, Wang Y, Zhu Y, Huang K, 2011. Oxalate-degrading capacities of lactic acid bacteria in canine feces. Vet. Microbiol 152, 368–373. [DOI] [PubMed] [Google Scholar]
- Ruan ZS, Anantharam V, Crawford IT, Ambudkar SV, Rhee SY, Allison MJ, 1992. Identification, purification, and reconstitution of OxlT, the oxalate: formate antiport protein of Oxalobacter formigenes. J. Biol. Chem 267, 10537–10543. [PubMed] [Google Scholar]
- Shoaib M, Shehzad A, Omar M, Rakha A, 2016. Inulin : properties, health benefits and food applications Inulin : properties, health benefits and food applications. Carbohydr. Polym 147, 444–454. [DOI] [PubMed] [Google Scholar]
- Turroni S, Vitali B, Bendazzoli C, Candela M, Gotti R, Federici F, Pirovano F, Brigidi P, 2007. Oxalate consumption by lactobacilli: evaluation of oxalyl-CoA decarboxylase and formyl-CoA transferase activity in Lactobacillus acidophilus. J. Appl. Microbiol 103, 1600–1609. [DOI] [PubMed] [Google Scholar]
- Turroni S, Bendazzoli C, Dipalo SC, Candela M, Vitali B, Gotti R, Brigidi P, 2010. Oxalate degrading activity in Bifidobacterium animalis subsp. lactis: impact of acidic conditions on the transcriptional levels of the oxalyl coenzyme A (CoA) decarboxylase and formyl-CoA transferase genes. Appl. Environ. Microbiol 76, 5609–5620. [DOI] [PMC free article] [PubMed] [Google Scholar]
- Tsai JY, Huang JK, Wu TT, Lee YH, 2005. Comparison of oxalate content in foods and beverages in Taiwan. JTUA 16, 93–99. [Google Scholar]
- Zhao C, Yang H, Zhu X, Li Y, Wang N, Han S, Xu H, Chen Z, Ye Z, 2018. Oxalate-degrading Enzyme recombined lactic acid bacteria strains Reduce hyperoxaluria. Urol. Times 113, 1–7. [DOI] [PubMed] [Google Scholar]
- Zoghi A, Khosravi-Darani K, Sohrabvandi S, Attar H, 2019. Patulin removal from synbiotic apple juice using Lactobacillus plantarum ATCC 8014. J. Appl. Microbiol 126 (4), 1149–1160. [DOI] [PubMed] [Google Scholar]