


Abstract
Higher-order chromatin structure undergoes striking changes in response to various developmental and environmental signals, causing distinct cell types to adopt specific chromatin organization. High throughput chromatin conformation capture (Hi-C) allows studying higher-order chromatin structure; however, this technique requires substantial amounts of starting material, which has limited the establishment of cell type-specific higher-order chromatin structure in plants. To overcome this limitation, we established a protocol that is applicable to a limited amount of nuclei by combining the INTACT (isolation of nuclei tagged in specific cell types) method and Hi-C (INT-Hi-C). Using this INT-Hi-C protocol, we generated Hi-C data from INTACT purified endosperm and leaf nuclei. Our INT-Hi-C data from leaf accurately reiterated chromatin interaction patterns derived from conventional leaf Hi-C data. We found that the higher-order chromatin organization of mixed leaf tissues and endosperm differs and that DNA methylation and repressive histone marks positively correlate with the chromatin compaction level. We furthermore found that self-looped interacting genes have increased expression in leaves and endosperm and that interacting intergenic regions negatively impact on gene expression in the endosperm. Last, we identified several imprinted genes involved in long-range and trans interactions exclusively in endosperm. Our study provides evidence that the endosperm adopts a distinct higher-order chromatin structure that differs from other cell types in plants and that chromatin interactions influence transcriptional activity.
INTRODUCTION
The genome is non-randomly packaged in the nucleus and some regions are more likely to interact than others. This is particularly evident by the presence of chromosomal territories, wherein individual chromosomes occupy distinct regions within the nucleus (1). The hierarchical pattern of genome organization in the nucleus is important for genome integrity and its regulation, therefore linked to nuclear processes like gene expression, replication and DNA repair (2–5). Microscopic and 3C-based techniques (3C, 4C, 5C and Hi-C) have enabled to investigate chromatin architecture and greatly advanced our knowledge of the 3D chromatin organization in the nucleus (6–10). These studies revealed that the spatial organization of the genome varies considerably among different cell types, suggesting that specific spatial organization is of functional relevance (11,12). Our understanding of the plant 3D genome organization is mainly derived from a series of Hi-C studies performed with leaves, aerial tissues, and whole seedlings in different plant species (13–18). The interactome generated by Hi-C in these previously published reports represents average conformations of complex plant tissue used as input (14,16,17); therefore, whether there are plant cell-type-specific chromatin structures remains poorly defined. A recent tissue-specific Hi-C study in rice and maize mesophyll cells and endosperm highlights tissue-specific differences in the 3D chromatin organization (19). The endosperm of rice and maize has decreased interaction frequencies in heterochromatic regions, but increased interactions between chromocenters and euchromatic chromosome arms, coinciding with the endosperm being hypomethylated compared to other tissues (20,21).
The endosperm is the product of a double fertilization event, which is characteristic for flowering plants. The other fertilization product is the embryo, which will give rise to a new plant, while the endosperm acts as nourishing tissue and supports embryo growth (22). The endosperm has an unusual genetic constitution, containing two maternal genomes and one paternal genome. Triploidy of the endosperm has likely evolved in consequence of parental conflict over the transfer of nutrients from maternal to offspring tissue and resulted in several epigenetic processes taking place specifically in the endosperm (23,24). These features make the endosperm a unique model system and understanding of its higher-order chromatin organization is particularly relevant.
While Hi-C is a powerful tool for studying the spatial organization of chromatin, the variance of higher-order structure among different cell types restricts the interpretive power of Hi-C assays derived from complex plant tissues. Hence, characterizing the 3D organization of genomes necessitates cell- or tissue-specific analyses (19,25). This has been achieved for different animal cell lines but has remained a challenge in plants, due to limitations in isolating specific cell types and the limited amount of starting material (26,27). A low input method to study plant cell-type-specific chromatin organization has been recently published, which is based on a combination of fluorescent activated cell sorting (FACS) with in situ Hi-C (28). In contrast to the regular Hi-C method, in the in situ Hi-C method chromatin digestion, labeling, and ligation happen inside the nuclei, which allows to maintain overall chromatin structure during ligation (13,28,29). In this study, we report the INT-Hi-C protocol, which combines the isolation of nuclei tagged in specific cell types (INTACT) method to isolate endosperm nuclei (30,31) with an adapted previously published high-resolution in situ Hi-C method (26). Our results reveal that the Arabidopsis endosperm has a distinct higher-order chromatin organization compared to mixed leaf tissue and differs from that previously described in rice and maize, two species with substantially larger genomes than Arabidopsis. We discovered increased chromatin interaction frequencies in the endosperm in comparison to leaf tissue and this increase in chromatin interactions negatively correlated with DNA methylation. We further found that chromatin interactions correlated with gene expression. Our methodology is easy to adapt and can be used with lower input material than conventional Hi-C, providing a framework for understanding cell-type-specific nuclear organization, which remains poorly understood in plants.
MATERIAL AND METHODS
Plant material and growth conditions
To generate endosperm-specific Hi-C interactome data we made use of previously published Arabidopsis lines expressing PHE1::NTF and PHE1::BirA (lines referred as PHE1-INT hereafter) in the Col-0 accession background (NASC stock number N2107349) (32). For generating the leaf-specific Hi-C data, we used transgenic lines expressing UBQ::NTF and UBQ::BirA (lines referred to as UBQ-INT hereafter) in the Col-0 accession background (NASC stock number N68649). Seeds were surface-sterilized by incubating them for 10 min in sterilization solution (5% NaClO + 0.01% Tween 20) followed by three times washing with sterile water. Sterilized seeds were sown on MS plates containing 0.8% agar, stratified for 2–3 days at 4°C and germinated under long-day conditions (16 h light/8 h dark; 110 μmol/s/m2; 21°C; 70% humidity) at 21°C. The seedlings were transferred to soil after 10–12 days and grown under long-day conditions as specified above. For endosperm-specific Hi-C analyses, we collected siliques from INT lines at 4 days after pollination (DAP), while for leaf-specific Hi-C analyses, fully expanded rosette leaves of 4-week old UBQ-INT plants were used. Two independent biological replicates for both, endosperm and leaves were generated. For each replicate, 400 mg material was quickly frozen in liquid nitrogen and stored.
INTACT nuclei isolation and purity assessment
Frozen tissue material (both siliques and leaves) was homogenized in Honda buffer supplemented with plant Protease Inhibitor Cocktail (Sigma) using the GentleMACS dissociator as previously described (31). The homogenate was rotated for 15 min at 4°C and filtered twice through Miracloth and finally using a CellTrics strainer (30-μm size selection pore). The homogenate was centrifuged at 1500 g for 6 min at 4°C, then the supernatant was discarded and the pellet slowly resuspended in PBSB buffer (1mg/ml BSA in Phosphate Buffer Saline solution) using a fine brush. The Dynabeads M-280 Streptavidin beads (Invitrogen) were pre-blocked with PBSB buffer. Pre-blocked Streptavidin beads were added to the nuclei suspension and incubated rotating for 30 min. After incubation the beads were collected using a magnet rack and the supernatant removed. The beads were gently resuspended in PBSBt buffer (PBSB buffer containg 0.1% Triton X-100) and incubated under rotation for 15 minutes at 4°C. The tubes were placed in the DynaMag magnet rack for 5–10 min to allow the Dynabeads to bind to the tube walls. The buffer was carefully discarded by decanting the tubes and the beads slowly resuspend in 200 μl PBS Buffer. The quality of the GFP-positive nuclei was analyzed using a Leica DMI4000B Fluorescence Microscope equipped with an L5 filter for GFP. Purity of endosperm nuclei was estimated as previously described (31). In brief, before homogenization we spiked-in siliques of the Ler accession (not expressing the INTACT constructs) to the INTACT Col-0 siliques. Purity assessments were based on the amplification of two loci, the ACT7 locus common for Col-0 and Ler and the Ler specific Ta1–2 locus. Based on the ratio of the amplified products before and after INTACT purification, we estimated that the average purity of endosperm nuclei was ≈90%.
INT-Hi-C and high-throughput sequencing
INTACT nuclei (∼1 × 10⁵) were fixed for 30 min on ice in PBS supplemented with 1% formaldehyde (Sigma) by inverting the tube two to three times during incubation. The reaction was quenched by addition of 2 M Glycine to a final concentration of 125 mM and incubation was continued for 5 min on ice. The tube was inverted two to three times during incubation. After a short centrifugation, the tube was placed in a magnetic rack for 1 min and the supernatant was removed. The pellet was resuspended in 200 μl 1× NEBuffer containing 0.3% SDS and incubated at 37°C for 1 h while shaking. Then Triton X-100 (Sigma) was added to a final 2% concentration and the nuclei incubated at 37°C for 1 h. The tube was placed in the magnetic rack for 1 min, the supernatant was removed and the bead-bound nuclei were resuspended in 200 μl 1× NEBuffer. 50 U of DpnII enzyme (NEB) and 1 μl of BSA (20mg/ml) was added and the chromatin was digested overnight (14–16 h) at 37°C with rotation. DpnII was inactivated by incubation at 65°C for 20 min. After centrifugation for 5 min at 3000 g at 4°C, the tube was placed in a magnetic rack and the bead-bound intact nuclei were washed with 200 μl of 1× ligation buffer. The nuclei were resuspended in 200 μl of 1× ligation buffer (NEB) and1 μl of BSA. 20U of T4 DNA ligase (NEB) was added to the sample and incubated at 16°C for 4.5 h with 50 rpm rotation and then kept for 30 min at room temperature. 10 μg of proteinase K was added and the sample incubated at 65°C overnight for reverse cross-linking while shaking. 175 μl of lysis buffer A (MagJET Plant Genomic DNA Kit) was added and the beads removed using the magnetic rack. The MagJET Plant Genomic DNA Kit supplier protocol was followed and the DNA eluted in 50 μl of elution buffer. After estimating the DNA concentration using the Qubit system (∼40–50 ng), the DNA (∼10 ng) was amplified using the illustra GenomiPhi v2 DNA amplification kit (GE Healthcare) according to the manufacturer's instructions. After amplification, the DNA was purified using AMPure XP magnetic beads (Beckman Coulter) and quantified using the Quant-IT dsDNA HS assay kit. Sequencing libraries were constructed using the Ovation Rapid DR Multiplex System 1–8 (NuGEN) with 300–800 bp size selection according to the manufacturer's instructions. Two biological replicates for both tissues were prepared and submitted to the National Genomic Infrastructure (NGI) from SciLife Laboratory (Uppsala, Sweden) for Illumina sequencing using HiSeq2500 high output mode, paired-end 125 bp read length, v4 sequencing chemistry.
INT-Hi-C data analysis
Raw INT-Hi-C data were mapped to the Col-0 reference genome of Arabidopsis (TAIR10) with a two-step approach incorporated in the HiC-Pro software (version 2.9.0) (33). Reads were first mapped to the reference genome using Bowtie2, and the unmapped reads containing the ligation site were consecutively mapped. Uniquely mapping reads from both mapping steps were retained in a single alignment file. Multiple hits, singletons and reads pairs that did not map close to a restriction site or within the expected fragment size were discarded. Subsequently, filtering analysis was performed to remove uninformative read pairs which included invalid ligation products and PCR artifacts. The remaining valid read pairs involving two different restriction fragments were used to generate the contact maps at 100 and 200 kb genomic bin size. The raw contact matrices were normalized for biases due to GC content, mappability and effective fragment length with a sparse-based implementation of the iterative correction method embedded in HiC-Pro (34).
Validation of INT-Hi-C data
We calculated the Pearson correlation among the INT-Hi-C replicates as well as between INT-Hi-C and previously published conventional Hi-C data as previously described (3,35). The correlation between two experiments was calculated by comparing each bin in the interaction matrix from experiment A with the same bin from experiment B. The interaction frequency was generated for each pair at 100-kb bin size. As previously described, we restricted the correlation analysis to a maximum distance of 50 bins (35). Pearson correlation coefficients between different samples were calculated using R.
To analyze how interaction frequency probability depends on genomic distance, we plotted the contact probability against the genomic distance for 100 kb bin size interaction matrices. The contact probability represents the average interaction frequency between genomic bins sharing the same distance along the chromosome.
Identification of KEEs and associated TEs
To detect previously defined KEEs (36), we visualized the contact matrix of both leaves and endosperm at high resolution using 20 kb genomic bins for intrachromosomal interactions. KEE-associated TEs were defined as those TEs that are present within 150 kb flanking each side of the previously determined ‘core’ KEE position (36).
Differential interactions matrix
To determine the difference between leaf and endosperm interactions matrices we used HiCPlotter (37). For generating the differential interactions matrix, we compared the normalized interaction matrices of endosperm and leaf (generated from HiC-Pro). HiCPlotter generates log2 pair-wise matrix comparisons (endosperm/leaf) with command line –c and –p.
Identification of interacting chromatin domains
To identify interacting structural domains, we used the R package HiTC (38), which is based on a strategy previously described for human and Arabidopsis (10,36). This approach applies a principal component analysis (PCA) on the correlation matrix of the normalized intra-chromosomal contact matrix. Since the first principal component generally divides the whole chromosome into two major regions: euchromatic chromosome arms and heterochromatic pericentromeric regions, we excluded the pericentromeric regions as previously defined by Grob and colleagues (36). To identify structural domains we performed the PCA on the euchromatic arms of the chromosomes. Coordinates of chromosome arms and pericentromeric regions were as defined previously (36). We followed a similar categorization, the positive Eigenvalues represent the loose structural domains (LSD), while negative Eigenvalues represent the compacted structural domains (CSDs). The analysis was done on 100 kb genomic bins.
Reconstruction of 3D structure using 3DMax
To generate the 3D structure of chromosomes and genomes from our Hi-C data, we used 3DMax which employs a maximum likelihood algorithm for reconstructing the 3D structure (39). 3DMax automatically calculates the conversion factor (α) for converting interaction frequency to distance for restraint-based 3D structure modeling. Normalized intra-chromosomal and genome-wide contact matrices were used as input files to generate the 3D structure of chromosomes and genomes, respectively, at 200 kb resolution with the default parameters of 3DMax. The 3D structures generated by 3DMax were visualized using Jmol (http://www.jmol.org/).
Association of structural domains and genomic and epigenomic features
To test how epigenetic features are associated with either open or closed chromatin, we adopted the approach by Grob and colleagues (36) and split the genomic bins of chromosome arms into two groups based on their Eigenvalue of the first PCA component. We performed a Mann-Whitney U test to determine whether a feature's density (genomic or epigenomic) level significantly differed between open and closed chromatin in endosperm and leaves at 100 kb bins along the chromosome arms. For histone modifications and DNA methylation, we calculated the z-score or percent methylation, respectively, while for genes and TEs we calculated the density per genomic bin. Histone methylation data for leaves and endosperm were previously published (32), as well as DNA methylation data of endosperm (40), and leaf cytosine methylation data (41). Histone methylation data was processed as previously described (32) and methylation estimated using z-score transformed values. Bisulfite data was processed using Bismark (–bowtie2 –score_min L,0,-0.6) (42).
Identification of significant interactions using HOMER
Chromatin interactions were identified with the command-line software HOMER (v4.7.2) (43) with the parameter previously described (44). The uniquely mapped reads generated in HiC-pro were used as an input file for HOMER. HOMER has several inbuilt algorithms to perform quality control (fragment size estimation and distance from restriction site distribution) and filtering of uninformative reads (e.g PCR duplicates) for Hi-C analysis. The makeTagDirectory function of HOMER was used to create HOMER-style tag directories using the parameters: -genome TAIR10 -removePEbg -restrictionSite -both -removeSelfLigation -removeSpikes 10000 5. We identified significant interactions at 10kb and 2kb resolution, only interactions with a P-value<0.001 were considered for subsequent analyses as previously reported (44).
Expression analysis
Expression data for leaves and endosperm were processed as previously described (45). In brief, reads were trimmed and mapped in single-end mode to the Arabidopsis (TAIR10) genome using TopHat v2.1 (46) (parameters adjusted as -g 1 -a 10 -i 40 -I 5000 -F 0 -r 130). Gene expression was normalized to reads per kilobase per million mapped reads (RPKM) using GFOLD40 (47).
Analysis of imprinted genes
To identify imprinted genes involved in interactions, we identfied previously reported imprinted genes (48–50) in our interaction dataset at 2 kb resolution. We plotted Circos for visualization of interacting imprinted genes along the chromosomes using ClicO FS (51).
Publicly available datasets used in the analysis
Publicly available datasets used in this study can be accessed under the following accession numbers: leaf and endosperm histone modification SRR1848404, SRR1848405, SRR1848399, SRR1848402, SRR1848395, SRR1848407, SRR1848409, SRR1848398, SRR1848401, SRR1848394, SRR1848397 (32); DNA methylation data for endosperm SRR5681373, SRR5681374 (40) and leaf SRR534177 (41); endosperm RNA expression data from SRR7825982, SRR7825983 (52); leaf RNA expression data from SRR6156820, SRR6156821 (53); and Hi-C data for correlation analysis from leaf SRR2626163 (13) and SRR5155149, SRR5155151 (15).
RESULTS
INT-Hi-C revealed cell-type-specific higher-order chromatin structure
To examine the cell-type-specific spatial organization of chromatin in Arabidopsis, we established a low input Hi-C method, which we termed INT-Hi-C. This approach was based on the previously published genome-wide high-resolution in situ Hi-C method (26). Similar to the existing conventional Hi-C method, INT-Hi-C is based on proximity-dependent ligation events between cross-linked and restriction-digested chromatin fragments within nuclei. A major difference between the INT-Hi-C and the conventional Hi-C protocol is the omission of biotin labeling (Figure 1A). While biotin labeling enables enrichment of chimeric molecules, it decreases ligation efficiency (54). To generate a cell-type-specific interactome map of the endosperm, we utilized the INTACT method to isolate endosperm nuclei (30,31). INTACT is based on biotin tagging of cell-type-specific nuclei followed by purification of these tagged nuclei from the total nuclei pool using Biotin-Streptavidin pull-down, which allows isolating high-quality pure endosperm nuclei. We generated two biological replicates of the INT-Hi-C library from INTACT-endosperm nuclei (INT-Endosperm). As a control, we generated two INT-Hi-C libraries from INTACT-purified leaf nuclei (INT-Leaf) and compared them with previously published conventional Hi-C data from leaf tissue (13,15). We obtained high coverage data for both libraries. A total ∼186.4 million read pairs were obtained for the INTACT-endosperm INT-Hi-C (∼98.8 and ∼87.6 million for biological replicates 1 and 2, respectively) while ∼191 million read pairs for INTACT-leaf (∼59.1 and ∼131.9 million for biological replicates 1 and 2, respectively). Raw reads were processed using HiC-Pro for mapping, quality filtration and to generate a normalized contact map (Supplementary file 1: Table S1). Correlation plots at 100 kb resolution revealed that biological replicates of INTACT-endosperm and INTACT-leaf libraries were highly correlated (Figure 1B). Furthermore, correlation plots showed that INT-Hi-C data from INTACT-leaf accurately reiterated chromatin interaction patterns derived from conventional leaf Hi-C data (Figure 1C, Supplementary file 2: Figure S1) (13,15). We generated a 2D interactome map at 100 and 200 kb resolution using the normalized contact matrix to visualize interactions in the genome. The contact map of leaves and endosperm was largely similar; however, the intensity of interactions seemed to be higher in the endosperm than in leaves (Figure 1D). As previously shown (29,36), the intense diagonal revealed that the majority of interactions are of short distance (Figure 1D). Further, as previously reported using conventional Hi-C data, we observed that interactions within the arms were more frequent than between the arms and that there were less interactions between the centromere and the rest of the genome (10,14,55). The decay of interaction frequencies with genomic distance was slightly faster in the endosperm compared to leaves, similar to maize endosperm (Supplementary file 2: Figure S2) (19). Similar to the previously reported strong association of telomeres in leaves (36), we observed a strong telomere association in leaf and endosperm tissues (Figure 1D, Supplementary file 2: Figure S3). One prominent feature of chromatin organization in Arabidopsis leaves is the presence of the KNOT, a special chromatin structure formed by interactive heterochromatic islands defined as Knot Engaged Elements (KEEs) or Interactive Heterochromatic Islands (IHI) (14,36). Out of the ten previously identified KEEs (36), we detected signals for eight KEEs (KEEs 3 to 10) in leaves, while only four of those KEEs (KEEs 3, 4, 7 and 8) were also detectable in the endosperm (Supplementary file 2: Figure S4), suggesting a distinct chromatin organization between leaves and endosperm.
Figure 1.

Genome-wide high-resolution INT-Hi-C approach. (A) INT-Hi-C workflow to generate tissue-specific libraries in plants. (B) Scatter plots showing the comparison of chromatin interaction frequencies among the biological replicates and (C) between INT-Hi-C and publically available conventional Hi-C data (13,15) in leaf tissue. Pearson correlation coefficients are also shown. (D) 2D interaction map of Arabidopsis leaf and endosperm at 100 kb resolution. The intense yellow diagonal reflects the enrichment of interacting reads in close proximity. Each pixel represents interactions between a 100 kb locus and another 100 kb locus. Chromosomes are represented through black bars from left to right and top to bottom. The telomeres of each chromosome is represented by black circle. Color scale bar ranging from black to yellow represents lower to higher enrichment of interacting reads, respectively.
Distinct higher-order chromatin organization in leaves and endosperm
Interactions among neighboring regions are dependent on each other and interacting regions form large structural domains (SDs) (36,56,57). SDs can be identified using principal component analysis (PCA) on the correlation matrix of each chromosome arm as previously described (36). To test whether leaves and endosperm differ in their nuclear organization, we first examined the distribution of genome-wide SDs in both tissues. Loose structural domains (LSD) are defined as domains with high interaction frequencies among distal regions, while compact structural domains (CSDs) have few distal interactions but high interactions among each other. In plants, CSDs generally correspond to the pericentromeric/centromeric regions, while LSDs are located at the chromosome arms (16,18). In leaves, LSDs and CSDs were largely distinct domains that did not overlap; in contrast, this distinction was less sharp in the endosperm, where CSDs and LSDs were intermixed (Figure 2A). This is an agreement with previous cytological observations reporting that the Arabidopsis endosperm has heterochromatic foci interspersed in euchromatin (58). This data reveal that SDs differ among different tissues. The differences in SDs between endosperm and leaves should be reflected in differences in the interactome network. We therefore compared both, the endosperm and leaf contact map and plotted the differential Hi-C matrix using HiCPlotter to generate pair-wise matrix comparisons (37). We found that the endosperm had considerably higher interaction frequencies than leaf tissue (Figure 2B and C). We observed increased contact frequencies throughout the chromosome arms in the endosperm, although the frequency of interactions in close proximity was largely similar (Figure 2C). Conversely, at the centromere, the contact frequency in the endosperm was decreased compared to leaf tissue, consistent with previous observations in rice and maize endosperm (19) (Figure 2C, Supplementary file 2: Figure S5). These results are consistent with the fact that the endosperm is hypomethylated and less condensed, which likely reduces chromatin interactions in the centromeric/pericentromeric regions (32,59). In contrast, increased interactions along the chromosome arms are likely reflecting the reported invasion of heterochromatin into euchromatic regions, as previously shown on a cytological level (58) and consistent with our analysis of SDs (Figure 2A). To visualize the structural variation, we utilized our Hi-C data to generate a 3D structure of individual chromosomes and genomes for both leaves and endosperm. The 3D structure revealed that leaves and endosperm differ in their chromosome organization, with the chromosomes in leaves appearing more compact compared to endosperm chromosomes (Supplementary file 2: Figure S6). Nevertheless, the reconstructed 3D genome structures suggest that in both endosperm and leaves the chromosomes maintain their own space, indicative for the presence of chromosome territories (Figure 2D). Furthermore, the centromeres tend to be localized close to each other, while the chromosome arms are located at the periphery of the nucleus (Figure 2D, Supplementary file 3).
Figure 2.

Distinct chromatin architecture in endosperm and leaf. (A) Distribution of structural domains (SDs) on chromosome arms in leaf and endosperm. Red color denotes compact structural domains (CSDs), while blue represents loose structural domains (LSDs). Dotted black lines represent the pericentromeric regions of each chromosomes were defined previously [36]. (B) Comparison of contact map of endosperm and leaf using HiCPlotter. Upper and lower panels show normalized contact maps of chromosome 2 for leaf and endosperm, respectively. Color scale bar ranging from white to red represents the lower to higher enrichment of interacting reads. (C) Differential interactions matrix of endosperm versus leaf for chromosome 2. Red and blue colors show enrichment or depletion of interactions reads in the endosperm, respectively, while white color indicates no change between endosperm and leaf. (D) 3D structure of Arabidopsis endosperm (left panel) and leaf (right panel) genome derived from normalized genome-wide interaction matrix (color code; purple, yellow, blue, green, red and black represent chr1, chr2, chr3, chr4, chr5 and centromere, respectively).
Association of structural domains with epigenetic and genomic features
To test whether differences in chromatin organization between leaf and endosperm tissues correlate with differences in epigenetic features, we assessed the relationship between SDs and various epigenetic signatures, including cytosine methylation and histone modifications. Levels of DNA methylation (CG, CHG and CHH context), heterochromatic repressive marks (H3K9me2 and H3K27me1), and the facultative heterochromatic mark H3K27me3 were significantly higher in CSDs than LSDs (Figure 3A and B), consistent with the known presence of heterochromatic marks in compact chromatin regions (36,60). This correlation pattern between SDs and epigenetic signatures was consistent in both, endosperm and leaves. However, the level of all repressive epigenetic modifications was higher in leaf SDs (CSD and LSDs) than in the endosperm (Figure 3A and B), in agreement with previously published work (32,59) and correlating with the generally higher compactness of chromatin in leaves compared to endosperm (58,61).
Figure 3.

Distribution of epigenetic marks in CSDs and LSDs. Box plots showing the level of various (A) cytosine methylation (CG, CHG and CHH) and (B) median values of z-score-normalized histone modifications (H3K9me2, H3K27me3 and H3K27me1) in CSDs and LSDs of leaf and endosperm tissue. Red color denotes compact structural domains (CSDs), while blue represents loose structural domains (LSDs) in leaf and endosperm respectively. Significance was determined using a Mann–Whitney U test (*P< 0.005, ** P< 0.0001). (C) Box plots showing the distribution of genes (left panel) and TEs (right panel) in CSDs and LSDs of leaf and endosperm. Significance was determined using a Mann–Whitney U test (NS = Not significant, * P< 0.005, ** P< 0.0005).
Since our result revealed that leaves and endosperm differ in their chromosomal organization, we speculated that the distribution of genes and TEs in different SDs is also changed. We therefore analyzed the distribution of gene and TE density in CSDs and LSDs in endosperm and leaves. As previously reported (36), the gene density in leaves was significantly higher in LSDs compared to CSDs, while the opposite trend holds for TEs (Figure 3C). In contrast, in the endosperm, gene density was equal in CSDs and LSDs, while TE density was only slightly higher in the CSDs compared to LSDs. This variance in the distribution of genes and TEs in different SDs supports the notion that there are tissue-specific differences in chromatin organization.
To further investigate the connection between epigenetic signatures and SDs, we tested whether the change of CSDs to LSDs and vice versa was associated with epigenetic signatures in endosperm and leaf. For this, we determined the CSDs and LSDs that were stable in both tissue types (referred to as constitutive CSDs and LSDs) and those that differed between leaves and endosperm (referred to as interchangeable SDs). In general, the level of DNA methylation and repressive marks was higher in constitutive CSDs than in interchangeable CSDs, while conversely, the level was lower in the constitutive LSDs than in the interchangeable LSDs. This trend was similar in leaves and endosperm (Figure 4A and B). The level of repressive epigenetic marks on interchangeable SDs was intermediate to that of the constitutive CSDs and LSDs, revealing that tissue-specific compactness is reflected by tissue-specific epigenetic patterns. From this analysis, we concluded that DNA methylation and repressive marks are positively associated with the compactness of chromatin, but are not sufficient to define CSDs and LSDs.
Figure 4.

Relationship of SDs with epigenetic marks. Box plots showing the level of various (A) cytosine methylation (CG, CHG, and CHH) and (B) median values of z-score-normalized histone modifications (H3K9me2, H3K27me3, and H3K27me1) in constitutive (C) and interchangeable (I) CSDs and LSDs in leaf and endosperm. Domains which maintain its compact or loose status in both endosperm and leaf referred as constitutive SDs (C-CSD and C-LSD, respectively), while domains that switch from compact to loose and vice versa are referred to as interchangeable SDs (I-CSD and I-LSD). Red color denotes level of various cytosine and histone methylation in C-CSDs; pink represents level of various cytosine and histone methylation in I-CSDs; blue represents level of various cytosine and histone methylation in C-LSDs, while light blue represents level of various cytosine and histone methylation in I-LSD in leaf and endosperm. Significance was determined using a Mann–Whitney U test (NS = not significant, * P< 0.005, ** P< 0.005).
Impact of chromatin interactions on gene and TE expression
We identified statistically significant interactions at 10 kb resolution using HOMER (43). A total of 12 393 and 37 140 interactions were identified in leaves and endosperm, respectively, out of which 11 140 interactions were common between both tissue types (Figure 5A, Supplementary file 1: Table S2, Supplementary file 4). Consistent with the general feature of 3D chromatin structure, most interactions occurred within chromosomes (cis) rather than between chromosomes (trans); nevertheless, we observed a substantial increase in the number of trans interactions in the endosperm (155 versus 7414 trans interactions in leaves and endosperm, respectively) (Supplementary file 1: Table S2).
Figure 5.

Chromatin interactions and gene expression. (A) Venn diagram showing common and unique interactions identified in pooled leaf and endosperm libraries at 10 kb resolution. For common interactions significance was determined using a hypergeometric test. (B) Comparison of RNA-seq-based expression counts (RPKM- reads per kilobase per million) of genes with self-looped structures compared to control genes without self-looped structures in leaf and endosperm. Significance was determined using a Mann–Whitney U test. (C) Comparison of RNA-seq-based expression counts of genes interacting with intergenic regions in endosperm and leaf with non-interacting genes in the respective tissue Significance was determined using a Mann–Whitney U test.
In plants, the relationship of chromatin interactions with gene expression is not as well established as in animal systems, probably because of the complexity of plant tissues used in previous studies (14,62–64). To test whether chromosomal interactions are functionally relevant for gene expression, we took advantage of available endosperm-specific RNA sequencing data (52), allowing to directly relate chromatin interactions with gene expression in the same cell type. Using HOMER, we identified 31 395 and 54 162 significant chromatin interactions at 2 kb resolution in leaves and endosperm, respectively (Supplementary file 5). Previous work revealed that many Arabidopsis genes form self-loops (13). Gene-loops potentially regulate transcriptional activity by various means, such as preventing bidirectional transcription (65), intron-mediated enhancement of transcription (66), and maintaining transcriptional memory (65,67). Indeed, we observed that on a genome-wide scale, self-looped genes (10 282 genes in leaves and 11 111 in endosperm) were expressed at higher levels compared to randomly selected genes that did not form self-looped structures (Figure 5B). This applied similarly to leaves and endosperm, revealing that this regulatory effect occurs in different tissues.
We furthermore observed several genes to be interacting with intergenic regions, which was more frequent in the endosperm (4737 genes) compared to leaves (1579 genes). Such interactions could influence the transcriptional activity by bringing distal regulatory elements into the proximity of the transcriptional start site and either act as positive (enhancer) or negative (silencer) regulatory elements (68,69). To test this possibility, we identified genes that were commonly interacting with intergenic regions in leaves and endosperm (914 genes). In leaves, the expression of genes interacting with intergenic regions was similar compared to the control set of genes that were not interacting. In contrast, in the endosperm, these interacting genes had a significantly lower expression level than the same set of control genes (Figure 5C) that were higher expressed in the endosperm compared to leaves. Overall, our results suggest that there are cell-type-specific effects resulting from the interaction of genes with distant regulatory elements and that such type of interactions are more frequent in the endosperm compared to leaves.
Previous work proposed that interacting KEEs may regulate TE activity (36). Since we detected interacting KEEs in the endosperm, we investigated how KEEs affect the expression of TEs located within 150 Kb flanking the KEE centers (36). TEs present in KEEs had higher expression levels in the endosperm than in leaves; however, also TEs flanking leaf-specific KEEs were higher expressed in the endosperm. Similarly, TEs located in randomly selected genomic regions had higher expression levels in the endosperm compared to leaves (Supplementary file 2: Figure S7). Thus, our data reveal that TEs are generally higher expressed in the endosperm compared to leaves, independently of their vicinity to KEEs.
Chromatin interaction network of imprinted genes
Genomic imprinting is an epigenetic phenomenon causing preferential expression of alleles dependent on their parent-of-origin (70,71). Thus, imprinted genes can be either expressed from the maternally inherited alleles (Maternally Expressed Genes, MEGs), or from the paternally inherited alleles (Paternally Expressed Genes, PEGs). In flowering plants, genomic imprinting ensures normal endosperm development (72). Differential DNA methylation of the parental genomes is one key governing factor determining the imprinting status of a gene (70,71). DNA methylation was shown to negatively influence the chromatin interaction network (63), prompting us to analyze the interaction network of imprinted genes (PEGs and MEGs) in our data. Out of 146 and 150 analyzed MEGs and PEGs, we found 41 and 46 to be involved in cis (>10kb distance) and trans interactions, respectively, while in leaf tissue only one MEG and one PEG showed cis (>10 kb distance) and trans interactions (Figure 6A, Supplementary file 6). The number of trans interactions for MEG and PEGs was higher than expected by chance (P < 0.0256 for MEGs and P < 0.00001 for PEGs). The maternal alleles of MEGs are generally hypomethylated (70,72), providing a possible explanation for increased interactions of MEGs in the endosperm. In contrast, the maternal alleles of PEGs are silenced by the Polycomb Repressive Complex 2 (PRC2) (71). PRC2 target genes frequenly interact with each other (73,74), offering a plausible explanation for increased interaction frequencies of PEGs. Interacting MEGs and PEGs were expressed at higher levels in the endosperm compared to leaf tissues (Figure 6B); however, a similar pattern was found for non-interacting MEGs and PEGs (Figure 6B). In contrast, non-imprinted genes engaging in cis and trans interactions in the endosperm had similar expression levels in endosperm and leaf tissues. Likewise, genes not engaging in cis and trans interactions in the endosperm were similarly expressed in both tissue types. This reveals that expression differences of imprinted genes in endosperm and leaf tissues is rather a property of the different epigenetic regulation of imprinted genes in specific tissues than a consequence of their specific interactions in the endosperm.
Figure 6.
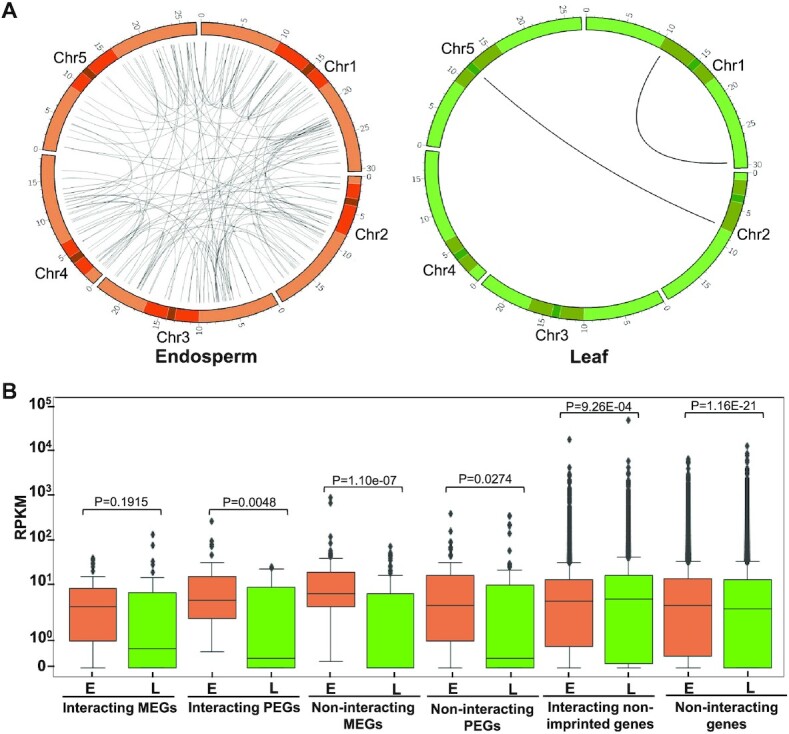
Genomic imprinting and chromatin interactions. (A) Circos plot showing cis (>10kb distance) and trans interactions of imprinted genes along the chromosomes in endosperm (upper panel) and leaf (lower panel). Small and large highlighted regions on each chromosome represent the centromeres and pericentromeres, respectively. (B) Comparison of RNA-seq-based expression counts of interacting PEGs, MEGs, interacting non-imprinted and non-interacting genes in endosperm and leaf tissue. Significance was determined using a Mann-Whitney U test.
DISCUSSION
Hi-C is a robust and versatile technique to examine genome-wide higher-order chromatin organization in the nucleus. There are several studies in plants which demonstrate the successful use of Hi-C to study chromatin organization in whole seedlings or leaf tissues (13,15,36). However, chromatin is very dynamic and the analysis of mixed cell types may not be suitable to understand the regulatory principles of chromatin structure. Single-cell Hi-C allows detection of chromatin interactions that occur concurrently in single cells (27). However, major limiting factors of this technique are the sparsity of genome coverage, low rate of successful libraries and the variability in interactome maps (27,75). These technical limitations and the requirement of computational approaches that can utilize sparse and heterogeneous single-cell Hi-C data, makes the applicability of single cell HiC still very challenging. In this study, we have established the INT-Hi-C method, which is applicable to limited amounts of starting material and allows to investigate tissue-specific higher-order chromatin organization. The previously published low input method of plant tissues starts with FACS-purified nuclei and relies on biotin incorporation and enrichment for ligated fragments, similar to conventional protocols (28). In our INT-Hi-C method, we used INTACT-purified nuclei and simplified the method by omitting biotin incorporation and enrichment for ligated fragments, similar to single-nucleus Hi-C and genome conformation capture (26,76). These simplified steps of recovering Hi-C ligation products allows this method to be adapted for even a few hundred cells. The INTACT method to purify specific cell-types has been successfully applied for different tissues and species (30,31,77,78), revealing its applicability to a wide range of tissues and organisms. Using the INT-Hi-C method, we investigated higher-order chromatin structure in the endosperm and reveal that the endosperm adopts a distinct chromatin organization compared to mixed leaf tissues. The organization of SDs and the 3D genome structure are consistent with cytological studies demonstrating reduced chromatin compaction in the Arabidopsis endosperm (Figure 2A and D, Supplementary file 2: Figure S6) (58,61). Our data show that the endosperm has increased interactions along the chromosome arms compared to leaves (Figure 1D), while decreased interactions in centromeric regions (Figure 2C, Supplementary file 2: Figure S5). Similar observations have recently been reported for rice and maize endosperm (19), suggesting that the reported differences that we observed in the Arabidopsis endosperm are conserved among different species. We propose two main reasons for the change in interaction frequency in the endosperm. First, RNA-directed DNA methylation (RdDM) was recently proposed to prevent the formation of chromosomal interactions between genes and their distant regulatory elements (63). RdDM activity is low in the early endosperm (32,79), which could thus explain increased interaction frequencies along the chromosome arms. In addition to low RdDM activity, DNA methylation levels in the endosperm are reduced as a consequence of active DNA demethylation mediated by the DEMETER glycosylase in the central cell of the female gametophyte (21), which also could impact on chromatin interaction frequency. Previous Hi-C analyses revealed that reduced DNA methylation has a strong impact on chromatin interaction patterns (14), implicating that the observed changes in endosperm chromatin structure are connected to reduced DNA methylation in the endosperm. Increased interactions of MEGs with distal chromatin regions in the endosperm support this idea, since many MEGs are hypomethylated in endosperm (80–82). Reduced DNA methylation likely causes the endosperm to be less condensed than other cell types, reduces the size of the chromocenters, while allowing heterochromatin to invade euchromatic regions (58). These cytological features correlate with reduced chromatin interactions in centromeric regions, but increased interactions in chromosome arms. Second, actively dividing cells are known to have increased chromatin interactions than mature differentiated cells (83); since the early endosperm is an actively dividing tissue, it is thus expected to have increased interactions compared to mature leaves where cell division has stopped.
The distinct chromatin structure in the endosperm was also reflected by reduced numbers of interacting KEEs in the endosperm compared to leaves. Reduced interactions between KEEs were previously reported in response to heat, correlating with increased TE expression (84). Similarly, we found increased TE expression levels in the endosperm compared to leaves, irrespective of whether TEs were located in KEE flanking regions or not, suggesting that reduced chromatin condensation and resulting increased TE expression causes reduced KEE interactions.
Consistent with the increased chromatin interactions along the chromosome arms, we detected an increased frequency of self-looping genes in the endosperm compared to leaves. Self-looping genes were higher expressed than non-self-looping genes, in agreement with previous data (4,13). Gene-looping can facilitate transcription by different mechanisms, e.g. by bringing regulatory introns into the vicinity of the transcriptional machinery, enhancing the directionality of RNA Polymerase II, or local enrichment of the transcriptional machinery (64–66,80).
We furthermore found enhanced interactions of genes with intergenic regions in the endosperm compared to leaves. Genes interacting with intergenic regions in both, endosperm and leaves, were expressed at lower levels in the endosperm compared to control genes. This suggests that intergenic regions interacting with genes in the endosperm have a repressive effect, as previously proposed for the distally located region downstream of the imprinted PHERES1 genes (85).
In addition to differences in short-range interactions between leaves and endosperm, we detected increased long-range and inter-chromosomal interactions in the endosperm (Figure 5A, Supplementary file 1: Table S2). This result is in line with data showing that extra genome copies in Arabidopsis tetraploids correlate with increased long-range and inter-chromosomal interactions compared to diploids (86). Nevertheless, it remains to be determined whether increased trans interactions in the endosperm are a consequence of the additional maternal genome copy in the endosperm or due to reduced chromatin compaction, which could facilitate trans interactions. We observed no preferential association (trans interaction) among different chromosomes, implying that each chromosome has the same likelihood to interact with other chromosomes. This conclusion is in agreement with previous work, revealing no preferential association of Arabidopsis chromosomes (36,87). In contrast, in rice and mice there is preferential association between sets of chromosomes, possibly a consequence of higher chromosome number in both organisms (4,88).
Chromatin structural domains were shown to correlate with epigenetic features (36), which we were able to confirm using our INT-Hi-C method. As previously described for leaves (36), we found that DNA methylation and heterochromatic/repressive marks were significantly higher in CSDs than in LSDs, which was similar in both, leaves and endosperm. However, the level of repressive epigenetic modifications was considerably higher in leaf SDs than in the endosperm, correlating with microscopic observations of low chromatin compaction in the endosperm (58,61). We identified interchangeable SDs that were defined as CSDs in leaves but as LSDs in the endosperm and vice versa. Such interchangeable SDs had intermediate levels of repressive epigenetic marks; they were lower than in the constitutive CSDs while higher than in the constitutive LSDs. Thus, the intermediate level of repressive epigenetic marks reflects the intermediate level of chromatin compactness, again pointing that both features are intricately linked.
In summary, our results highlight that general conclusions about chromatin structure have to be carefully interpreted if they are based on mixed tissue types. Detailed cell and tissue-specific analysis are required to unravel the structural and functional relevance of 3D architecture of chromatin in plants. Our work shows that INT-Hi-C allows to generate high resolution Hi-C profiles from limited amounts of tissues, laying the foundation for future tissue-specific chromatin structure analyses.
CONCLUSION
Hi-C is a powerful and widely used method to study the genome-wide higher-order chromatin organization. Thus far, the requirement of large number of cells limited studies on cell- and tissue type-specific chromatin organization in plants. In this work, we describe a INT-HiC protocol that is equally robust to conventional Hi-C but can be used with low amounts of starting material. Our data emphasize the existence of tissue-specific differences in higher-order chromatin organization in plants and that chromatin interactions influence transcriptional activity.
Therefore, general conclusions about chromatin structure have to be carefully interpreted if they are based on mixed tissue types. Detailed cell- and tissue-specific analyses are required to unravel the structural and functional relevance of 3D architecture of chromatin in plants. In conclusion, we have established INT-Hi-C as a suitable method to generate high-resolution Hi-C profiles of limited amounts of tissues, laying the foundation for future tissue-specific chromatin structure analyses.
DATA AVAILABILITY
Tools used in the article are hosted here:
HiC-Pro: https://github.com/nservant/HiC-Pro
HiCPlotter: https://github.com/kcakdemir/HiCPlotter
HiTC: https://github.com/bioinfo-pf-curie/HiTC
HOMER: http://homer.ucsd.edu/homer/
3DMax: https://github.com/BDM-Lab/3DMax
ClicO FS: http://clicofs.codoncloud.com/
Sequence data generated in this study have been submitted to GEO (http://www.ncbi.nlm.nih.gov/geo/) under accession number GSE145769.
Supplementary Material
ACKNOWLEDGEMENTS
Sequencing was performed by the SNP&SEQ Technology Platform, Science for Life Laboratory at Uppsala University, a national infrastructure supported by the Swedish Research Council (VRRFI) and the Knut and Alice Wallenberg Foundation.
Author's contributions: V.K.Y. executed the experimental procedures. V.K.Y., J.S.G. and C.K. analyzed the data. V.K.Y. and C.K. wrote the manuscript. All authors discussed the results and commented on the manuscript. All authors read and approved the final manuscript.
Notes
Present address: Vikash Kumar Yadav, Louvain Institute of Biomolecular Science and Technology, Université catholique de Louvain, Louvain-La-Neuve 1348, Belgium.
Contributor Information
Vikash Kumar Yadav, Department of Plant Biology, Uppsala BioCenter, Swedish University of Agricultural Sciences and Linnean Centre for Plant Biology, Uppsala 75007, Sweden.
Juan Santos-González, Department of Plant Biology, Uppsala BioCenter, Swedish University of Agricultural Sciences and Linnean Centre for Plant Biology, Uppsala 75007, Sweden.
Claudia Köhler, Department of Plant Biology, Uppsala BioCenter, Swedish University of Agricultural Sciences and Linnean Centre for Plant Biology, Uppsala 75007, Sweden.
SUPPLEMENTARY DATA
Supplementary Data are available at NAR Online.
FUNDING
Knut and Alice Wallenberg Foundation [2015.0056 to C.K.]. Funding for open access charge: SLU.
Conflict of interest statement. None declared.
REFERENCES
- 1. Schubert I., Shaw P.. Organization and dynamics of plant interphase chromosomes. Trends Plant Sci. 2011; 16:273–281. [DOI] [PubMed] [Google Scholar]
- 2. Rodriguez-Granados N.Y., Ramirez-Prado J.S., Veluchamy A., Latrasse D., Raynaud C., Crespi M., Ariel F., Benhamed M.. Put your 3D glasses on: plant chromatin is on show. J. Exp. Bot. 2016; 67:3205–3221. [DOI] [PubMed] [Google Scholar]
- 3. Dixon J.R., Selvaraj S., Yue F., Kim A., Li Y., Shen Y., Hu M., Liu J.S., Ren B.. Topological domains in mammalian genomes identified by analysis of chromatin interactions. Nature. 2012; 485:376–380. [DOI] [PMC free article] [PubMed] [Google Scholar]
- 4. Dong Q., Li N., Li X., Yuan Z., Xie D., Wang X., Li J., Yu Y., Wang J., Ding B.et al.. Genome-wide Hi-C analysis reveals extensive hierarchical chromatin interactions in rice. Plant J. 2018; 94:1141–1156. [DOI] [PubMed] [Google Scholar]
- 5. Sexton T., Yaffe E., Kenigsberg E., Bantignies F., Leblanc B., Hoichman M., Parrinello H., Tanay A., Cavalli G.. Three-dimensional folding and functional organization principles of the Drosophila genome. Cell. 2012; 148:458–472. [DOI] [PubMed] [Google Scholar]
- 6. Ramani V., Shendure J., Duan Z.. Understanding spatial genome organization: methods and insights. Genomics Proteomics Bioinformatics. 2016; 14:7–20. [DOI] [PMC free article] [PubMed] [Google Scholar]
- 7. Dekker J., Rippe K., Dekker M., Kleckner N.. Capturing chromosome conformation. Science. 2002; 295:1306–1311. [DOI] [PubMed] [Google Scholar]
- 8. Simonis M., Klous P., Splinter E., Moshkin Y., Willemsen R., de Wit E., van Steensel B., de Laat W.. Nuclear organization of active and inactive chromatin domains uncovered by chromosome conformation capture–on-chip (4C). Nat. Genet. 2006; 38:1348–1354. [DOI] [PubMed] [Google Scholar]
- 9. Dostie J., Richmond T.A., Arnaout R.A., Selzer R.R., Lee W.L., Honan T.A., Rubio E.D., Krumm A., Lamb J., Nusbaum C.et al.. Chromosome conformation capture carbon copy (5C): a massively parallel solution for mapping interactions between genomic elements. Genome Res. 2006; 16:1299–1309. [DOI] [PMC free article] [PubMed] [Google Scholar]
- 10. Lieberman-Aiden E., van Berkum N.L., Williams L., Imakaev M., Ragoczy T., Telling A., Amit I., Lajoie B.R., Sabo P.J., Dorschner M.O.et al.. Comprehensive mapping of long-range interactions reveals folding principles of the human genome. Science. 2009; 326:289–293. [DOI] [PMC free article] [PubMed] [Google Scholar]
- 11. Finn E.H., Pegoraro G., Brandão H.B., Valton A.-L., Oomen M.E., Dekker J., Mirny L., Misteli T.. Extensive heterogeneity and intrinsic variation in spatial genome organization. Cell. 2019; 176:1502–1515. [DOI] [PMC free article] [PubMed] [Google Scholar]
- 12. Zheng H., Xie W.. The role of 3D genome organization in development and cell differentiation. Nat. Rev. Mol. Cell Biol. 2019; 20:535–550. [DOI] [PubMed] [Google Scholar]
- 13. Liu C., Wang C., Wang G., Becker C., Zaidem M., Weigel D.. Genome-wide analysis of chromatin packing in Arabidopsis thaliana at single-gene resolution. Genome Res. 2016; 26:1057–1068. [DOI] [PMC free article] [PubMed] [Google Scholar]
- 14. Feng S., Cokus S.J.J., Schubert V., Zhai J., Pellegrini M., Jacobsen S.E.E.. Genome-wide Hi-C analyses in wild-type and mutants reveal high-resolution chromatin interactions in Arabidopsis. Mol. Cell. 2014; 55:694–707. [DOI] [PMC free article] [PubMed] [Google Scholar]
- 15. Zhu W., Hu B., Becker C., Doğan E.S., Berendzen K.W., Weigel D., Liu C.. Altered chromatin compaction and histone methylation drive non-additive gene expression in an interspecific Arabidopsis hybrid. Genome Biol. 2017; 18:157. [DOI] [PMC free article] [PubMed] [Google Scholar]
- 16. Liu C., Cheng Y.-J., Wang J.-W., Weigel D.. Prominent topologically associated domains differentiate global chromatin packing in rice from Arabidopsis. Nat. Plants. 2017; 3:742–748. [DOI] [PubMed] [Google Scholar]
- 17. Wang M., Tu L., Lin M., Lin Z., Wang P., Yang Q., Ye Z., Shen C., Li J., Zhang L.et al.. Asymmetric subgenome selection and cis-regulatory divergence during cotton domestication. Nat. Genet. 2017; 49:579–587. [DOI] [PubMed] [Google Scholar]
- 18. Dong P., Tu X., Chu P.-Y., Lü P., Zhu N., Grierson D., Du B., Li P., Zhong S.. 3D chromatin architecture of large plant genomes determined by local A/B compartments. Mol. Plant. 2017; 10:1497–1509. [DOI] [PubMed] [Google Scholar]
- 19. Dong P., Tu X., Li H., Zhang J., Grierson D., Li P., Zhong S.. Tissue-specific Hi-C analyses of rice, foxtail millet and maize suggest non-canonical function of plant chromatin domains. J. Integr. Plant Biol. 2020; 62:201–217. [DOI] [PubMed] [Google Scholar]
- 20. Wang P., Xia H., Zhang Y., Zhao S., Zhao C., Hou L., Li C., Li A., Ma C., Wang X.. Genome-wide high-resolution mapping of DNA methylation identifies epigenetic variation across embryo and endosperm in Maize (Zea may). BMC Genomics. 2015; 16:21. [DOI] [PMC free article] [PubMed] [Google Scholar]
- 21. Park K., Kim M.Y., Vickers M., Park J.S., Hyun Y., Okamoto T., Zilberman D., Fischer R.L., Feng X., Choi Y.et al.. DNA demethylation is initiated in the central cells of Arabidopsis and rice. Proc. Natl. Acad. Sci. USA. 2016; 113:15138–15143. [DOI] [PMC free article] [PubMed] [Google Scholar]
- 22. Hands P., Rabiger D.S., Koltunow A.. Mechanisms of endosperm initiation. Plant Reprod. 2016; 29:215–225. [DOI] [PMC free article] [PubMed] [Google Scholar]
- 23. Wang G., Köhler C.. Epigenetic processes in flowering plant reproduction. J. Exp. Bot. 2017; 68:797–807. [DOI] [PubMed] [Google Scholar]
- 24. Haig D., Westoby M.. Parent-specific gene expression and the triploid endosperm. Am. Nat. 1989; 134:147–155. [Google Scholar]
- 25. Zhou S., Jiang W., Zhao Y., Zhou D.-X.. Single-cell three-dimensional genome structures of rice gametes and unicellular zygotes. Nat. Plants. 2019; 5:795–800. [DOI] [PubMed] [Google Scholar]
- 26. Flyamer I.M., Gassler J., Imakaev M., Brandão H.B., Ulianov S. V., Abdennur N., Razin S. V., Mirny L.A., Tachibana-Konwalski K.. Single-nucleus Hi-C reveals unique chromatin reorganization at oocyte-to-zygote transition. Nature. 2017; 544:110–114. [DOI] [PMC free article] [PubMed] [Google Scholar]
- 27. Nagano T., Lubling Y., Stevens T.J., Schoenfelder S., Yaffe E., Dean W., Laue E.D., Tanay A., Fraser P.. Single-cell Hi-C reveals cell-to-cell variability in chromosome structure. Nature. 2013; 502:59–64. [DOI] [PMC free article] [PubMed] [Google Scholar]
- 28. Wang N., Liu C.. Study of cell-type-specific chromatin organization: in situ Hi-C library preparation for low-input plant materials. Methods in Molecular Biology. 2020; 2093:Humana Press Inc; 115–127. [DOI] [PubMed] [Google Scholar]
- 29. Wang C., Liu C., Roqueiro D., Grimm D., Schwab R., Becker C., Lanz C., Weigel D.. Genome-wide analysis of local chromatin packing in Arabidopsis thaliana. Genome Res. 2015; 25:246–256. [DOI] [PMC free article] [PubMed] [Google Scholar]
- 30. Deal R.B., Henikoff S.. The INTACT method for cell type–specific gene expression and chromatin profiling in Arabidopsis thaliana. Nat. Protoc. 2011; 6:56–68. [DOI] [PMC free article] [PubMed] [Google Scholar]
- 31. Moreno-Romero J., Santos-González J., Hennig L., Köhler C.. Applying the INTACT method to purify endosperm nuclei and to generate parental-specific epigenome profiles. Nat. Protoc. 2017; 12:238–254. [DOI] [PubMed] [Google Scholar]
- 32. Moreno-Romero J., Jiang H., Santos-González J., Köhler C.. Parental epigenetic asymmetry of PRC2-mediated histone modifications in the Arabidopsis endosperm. EMBO J. 2016; 35:1298–1311. [DOI] [PMC free article] [PubMed] [Google Scholar]
- 33. Servant N., Varoquaux N., Lajoie B.R., Viara E., Chen C.J., Vert J.P., Heard E., Dekker J., Barillot E.. HiC-Pro: An optimized and flexible pipeline for Hi-C data processing. Genome Biol. 2015; 16:259. [DOI] [PMC free article] [PubMed] [Google Scholar]
- 34. Imakaev M., Fudenberg G., McCord R.P., Naumova N., Goloborodko A., Lajoie B.R., Dekker J., Mirny L.A.. Iterative correction of Hi-C data reveals hallmarks of chromosome organization. Nat. Methods. 2012; 9:999–1003. [DOI] [PMC free article] [PubMed] [Google Scholar]
- 35. Du Z., Zheng H., Huang B., Ma R., Wu J., Zhang X., He J., Xiang Y., Wang Q., Li Y.et al.. Allelic reprogramming of 3D chromatin architecture during early mammalian development. Nature. 2017; 547:232–235. [DOI] [PubMed] [Google Scholar]
- 36. Grob S., Schmid M.W., Grossniklaus U.. Hi-C analysis in Arabidopsis identifies the KNOT, a structure with similarities to the flamenco locus of Drosophila. Mol. Cell. 2014; 55:678–693. [DOI] [PubMed] [Google Scholar]
- 37. Akdemir K.C., Chin L.. HiCPlotter integrates genomic data with interaction matrices. Genome Biol. 2015; 16:198. [DOI] [PMC free article] [PubMed] [Google Scholar]
- 38. Servant N., Lajoie B.R., Nora E.P., Giorgetti L., Chen C.J., Heard E., Dekker J., Barillot E.. HiTC: exploration of high-throughput ‘C’ experiments. Bioinformatics. 2012; 28:2843–2844. [DOI] [PMC free article] [PubMed] [Google Scholar]
- 39. Oluwadare O., Zhang Y., Cheng J.. A maximum likelihood algorithm for reconstructing 3D structures of human chromosomes from chromosomal contact data. BMC Genomics. 2018; 19:161. [DOI] [PMC free article] [PubMed] [Google Scholar]
- 40. Jiang H., Moreno-Romero J., Santos-González J., De Jaeger G., Gevaert K., Van De Slijke E., Köhler C.. Ectopic application of the repressive histone modification H3K9me2 establishes post-zygotic reproductive isolation in Arabidopsis thaliana. Genes Dev. 2017; 31:1272–1287. [DOI] [PMC free article] [PubMed] [Google Scholar]
- 41. Stroud H., Greenberg M.V.C., Feng S., Bernatavichute Y.V., Jacobsen S.E.. Comprehensive analysis of silencing mutants reveals complex regulation of the Arabidopsis methylome. Cell. 2013; 152:352–364. [DOI] [PMC free article] [PubMed] [Google Scholar]
- 42. Krueger F., Andrews S.R.. Bismark: a flexible aligner and methylation caller for bisulfite-Seq applications. Bioinformatics. 2011; 27:1571–1572. [DOI] [PMC free article] [PubMed] [Google Scholar]
- 43. Heinz S., Benner C., Spann N., Bertolino E., Lin Y.C., Laslo P., Cheng J.X., Murre C., Singh H., Glass C.K.. Simple combinations of lineage-determining transcription factors prime cis-regulatory elements required for macrophage and B cell identities. Mol. Cell. 2010; 38:576–589. [DOI] [PMC free article] [PubMed] [Google Scholar]
- 44. Forcato M., Nicoletti C., Pal K., Livi C.M., Ferrari F., Bicciato S.. Comparison of computational methods for Hi-C data analysis. Nat. Methods. 2017; 14:679–685. [DOI] [PMC free article] [PubMed] [Google Scholar]
- 45. Del G., León T.-D., Köhler C.. Endosperm-specific transcriptome analysis by applying the INTACT system. Plant Reprod. 2019; 32:55–61. [DOI] [PubMed] [Google Scholar]
- 46. Trapnell C., Pachter L., Salzberg S.L.. TopHat: discovering splice junctions with RNA-Seq. Bioinformatics. 2009; 25:1105–1111. [DOI] [PMC free article] [PubMed] [Google Scholar]
- 47. Feng J., Meyer C.A., Wang Q., Liu J.S., Liu X.S., Zhang Y.. GFOLD: A generalized fold change for ranking differentially expressed genes from RNA-seq data. Bioinformatics. 2012; 28:2782–2788. [DOI] [PubMed] [Google Scholar]
- 48. Pignatta D., Erdmann R.M., Scheer E., Picard C.L., Bell G.W., Gehring M.. Natural epigenetic polymorphisms lead to intraspecific variation in Arabidopsis gene imprinting. Elife. 2014; 3:e03198. [DOI] [PMC free article] [PubMed] [Google Scholar]
- 49. Wolff P., Weinhofer I., Seguin J., Roszak P., Beisel C., Donoghue M.T.A., Spillane C., Nordborg M., Rehmsmeier M., Köhler C.. High-resolution analysis of parent-of-origin allelic expression in the Arabidopsis endosperm. PLos Genet. 2011; 7:e1002126. [DOI] [PMC free article] [PubMed] [Google Scholar]
- 50. Schon M.A., Nodine M.D.. Widespread contamination of Arabidopsis embryo and endosperm transcriptome data sets. Plant Cell. 2017; 29:608–617. [DOI] [PMC free article] [PubMed] [Google Scholar]
- 51. Cheong W.H., Tan Y.C., Yap S.J., Ng K.P.. ClicO FS: an interactive web-based service of Circos. Bioinformatics. 2015; 31:3685–3687. [DOI] [PMC free article] [PubMed] [Google Scholar]
- 52. Moreno-Romero J., Del Toro-De León G., Yadav V.K., Santos-González J., Köhler C.. Epigenetic signatures associated with imprinted paternally expressed genes in the Arabidopsis endosperm. Genome Biol. 2019; 20:41. [DOI] [PMC free article] [PubMed] [Google Scholar]
- 53. Lyons D.B., Zilberman D.. DDM1 and Lsh remodelers allow methylation of DNA wrapped in nucleosomes. Elife. 2017; 6:e30674. [DOI] [PMC free article] [PubMed] [Google Scholar]
- 54. Belaghzal H., Dekker J., Gibcus J.H.. Hi-C 2.0: an optimized Hi-C procedure for high-resolution genome-wide mapping of chromosome conformation. Methods. 2017; 123:56–65. [DOI] [PMC free article] [PubMed] [Google Scholar]
- 55. Duan Z., Andronescu M., Schutz K., McIlwain S., Kim Y.J., Lee C., Shendure J., Fields S., Blau C.A., Noble W.S.. A three-dimensional model of the yeast genome. Nature. 2010; 465:363–367. [DOI] [PMC free article] [PubMed] [Google Scholar]
- 56. Dixon J.R., Gorkin D.U., Ren B.. Chromatin domains: the unit of chromosome organization. Mol. Cell. 2016; 62:668–680. [DOI] [PMC free article] [PubMed] [Google Scholar]
- 57. Rowley M.J., Corces V.G.. Organizational principles of 3D genome architecture. Nat. Rev. Genet. 2018; 19:789–800. [DOI] [PMC free article] [PubMed] [Google Scholar]
- 58. Baroux C., Pecinka A., Fuchs J., Schubert I., Grossniklaus U.. The triploid endosperm genome of Arabidopsis adopts a peculiar, parental-dosage-dependent chromatin organization. Plant Cell. 2007; 19:1782–1794. [DOI] [PMC free article] [PubMed] [Google Scholar]
- 59. Hsieh T.-F., Ibarra C.A., Silva P., Zemach A., Eshed-Williams L., Fischer R.L., Zilberman D.. Genome-wide demethylation of Arabidopsis endosperm. Science. 2009; 324:1451–1454. [DOI] [PMC free article] [PubMed] [Google Scholar]
- 60. Wang J., Jia S.T., Jia S.. New insights into the regulation of heterochromatin. Trends Genet. 2016; 32:284–294. [DOI] [PMC free article] [PubMed] [Google Scholar]
- 61. Baroux C., Pecinka A., Fuchs J., Kreth G., Schubert I., Grossniklaus U.. Non-random chromosome arrangement in triploid endosperm nuclei. Chromosoma. 2017; 126:115–124. [DOI] [PubMed] [Google Scholar]
- 62. Chepelev I., Wei G., Wangsa D., Tang Q., Zhao K.. Characterization of genome-wide enhancer-promoter interactions reveals co-expression of interacting genes and modes of higher order chromatin organization. Cell Res. 2012; 22:490–503. [DOI] [PMC free article] [PubMed] [Google Scholar]
- 63. Rowley M.J., Rothi M.H., Böhmdorfer G., Kuciński J., Wierzbicki A.T.. Long-range control of gene expression via RNA-directed DNA methylation. PLoS Genet. 2017; 13:e1006749. [DOI] [PMC free article] [PubMed] [Google Scholar]
- 64. Bartkuhn M., Renkawitz R.. Long range chromatin interactions involved in gene regulation. Biochim. Biophys. Acta - Mol. Cell Res. 2008; 1783:2161–2166. [DOI] [PubMed] [Google Scholar]
- 65. Tan-Wong S.M., Zaugg J.B., Camblong J., Xu Z., Zhang D.W., Mischo H.E., Ansari A.Z., Luscombe N.M., Steinmetz L.M., Proudfoot N.J.. Gene loops enhance transcriptional directionality. Science. 2012; 338:671–675. [DOI] [PMC free article] [PubMed] [Google Scholar]
- 66. Moabbi A.M., Agarwal N., El Kaderi B., Ansari A.. Role for gene looping in intron-mediated enhancement of transcription. Proc. Natl. Acad. Sci. U.S.A. 2012; 109:8505–8510. [DOI] [PMC free article] [PubMed] [Google Scholar]
- 67. Lainé J.-P., Singh B.N., Krishnamurthy S., Hampsey M.. A physiological role for gene loops in yeast. Genes Dev. 2009; 23:2604–2609. [DOI] [PMC free article] [PubMed] [Google Scholar]
- 68. Plank J.L., Dean A.. Enhancer function: mechanistic and genome-wide insights come together. Mol. Cell. 2014; 55:5–14. [DOI] [PMC free article] [PubMed] [Google Scholar]
- 69. Bortle K. Van, Corces V.G.. The role of chromatin insulators in nuclear architecture and genome function. Curr. Opin. Genet. Dev. 2013; 23:212–218. [DOI] [PMC free article] [PubMed] [Google Scholar]
- 70. Satyaki P.R.V., Gehring M.. DNA methylation and imprinting in plants: machinery and mechanisms. Crit. Rev. Biochem. Mol. Biol. 2017; 52:163–175. [DOI] [PubMed] [Google Scholar]
- 71. Batista R.A., Moreno-Romero J., Qiu Y., van Boven J., Santos-González J., Figueiredo D.D., Köhler C.. The mads-box transcription factor pheres1 controls imprinting in the endosperm by binding to domesticated transposons. Elife. 2019; 8:e50541. [DOI] [PMC free article] [PubMed] [Google Scholar]
- 72. Rodrigues J.A., Zilberman D.. Evolution and function of genomic imprinting in plants. Genes Dev. 2015; 29:2517–2531. [DOI] [PMC free article] [PubMed] [Google Scholar]
- 73. Tolhuis B., Blom M., Kerkhoven R.M., Pagie L., Teunissen H., Nieuwland M., Simonis M., de Laat W., van Lohuizen M., van Steensel B.. Interactions among polycomb domains are guided by chromosome architecture. PLoS Genet. 2011; 7:e1001343. [DOI] [PMC free article] [PubMed] [Google Scholar]
- 74. Entrevan M., Schuettengruber B., Cavalli G.. Regulation of genome architecture and function by polycomb proteins. Trends Cell Biol. 2016; 26:511–525. [DOI] [PubMed] [Google Scholar]
- 75. Nagano T., Lubling Y., Yaffe E., Wingett S.W., Dean W., Tanay A., Fraser P.. Single-cell Hi-C for genome-wide detection of chromatin interactions that occur simultaneously in a single cell. Nat. Protoc. 2015; 10:1986–2003. [DOI] [PubMed] [Google Scholar]
- 76. Rodley C.D.M., Bertels F., Jones B., O’Sullivan J.M.. Global identification of yeast chromosome interactions using genome conformation capture. Fungal Genet. Biol. 2009; 46:879–886. [DOI] [PubMed] [Google Scholar]
- 77. Reynoso M.A., Pauluzzi G.C., Kajala K., Cabanlit S., Velasco J., Bazin J., Deal R., Sinha N.R., Brady S.M., Bailey-Serres J.. Nuclear transcriptomes at high resolution using retooled INTACT. Plant Physiol. 2018; 176:270–281. [DOI] [PMC free article] [PubMed] [Google Scholar]
- 78. Agrawal P., Chung P., Heberlein U., Kent C.. Enabling cell-type-specific behavioral epigenetics in Drosophila: A modified high-yield INTACT method reveals the impact of social environment on the epigenetic landscape in dopaminergic neurons. BMC Biol. 2019; 17:30. [DOI] [PMC free article] [PubMed] [Google Scholar]
- 79. Jullien P.E., Susaki D., Yelagandula R., Higashiyama T., Berger F.. DNA methylation dynamics during sexual reproduction in Arabidopsis thaliana. Curr. Biol. 2012; 22:1825–1830. [DOI] [PubMed] [Google Scholar]
- 80. Hsieh T.-F., Shin J., Uzawa R., Silva P., Cohen S., Bauer M.J., Hashimoto M., Kirkbride R.C., Harada J.J., Zilberman D.et al.. Regulation of imprinted gene expression in Arabidopsis endosperm. Proc. Natl. Acad. Sci. U.S.A. 2011; 108:1755–1762. [DOI] [PMC free article] [PubMed] [Google Scholar]
- 81. Makarevich G., Villar C.B.R., Erilova A., Köhler C.. Mechanism of PHERES1 imprinting in Arabidopsis. J. Cell Sci. 2008; 121:906–912. [DOI] [PubMed] [Google Scholar]
- 82. Gehring M., Bubb K.L., Henikoff S.. Extensive demethylation of repetitive elements during seed development underlies gene imprinting. Science. 2009; 324:1447–1451. [DOI] [PMC free article] [PubMed] [Google Scholar]
- 83. Gibcus J.H., Samejima K., Goloborodko A., Samejima I., Naumova N., Nuebler J., Kanemaki M.T., Xie L., Paulson J.R., Earnshaw W.C.et al.. A pathway for mitotic chromosome formation. Science. 2018; 359:eaao6135. [DOI] [PMC free article] [PubMed] [Google Scholar]
- 84. Sun L., Jing Y., Liu X., Li Q., Xue Z., Cheng Z., Wang D., He H., Qian W.. Heat stress-induced transposon activation correlates with 3D chromatin organization rearrangement in Arabidopsis. Nat. Commun. 2020; 11:1886. [DOI] [PMC free article] [PubMed] [Google Scholar]
- 85. Villar C.B.R., Erilova A., Makarevich G., Trösch R., Köhler C.. Control of PHERES1 imprinting in Arabidopsis by direct tandem repeats. Mol. Plant. 2009; 2:654–660. [DOI] [PubMed] [Google Scholar]
- 86. Zhang H., Zheng R., Wang Y., Zhang Y., Hong P., Fang Y.Y., Li G., Fang Y.Y.. The effects of Arabidopsis genome duplication on the chromatin organization and transcriptional regulation. Nucleic Acids Res. 2019; 47:7857–7869. [DOI] [PMC free article] [PubMed] [Google Scholar]
- 87. Pecinka A., Schubert V., Meister A., Kreth G., Klatte M., Lysak M.A., Fuchs J., Schubert I.. Chromosome territory arrangement and homologous pairing in nuclei of Arabidopsis thaliana are predominantly random except for NOR-bearing chromosomes. Chromosoma. 2004; 113:258–269. [DOI] [PubMed] [Google Scholar]
- 88. Zhang Y., McCord R.P., Ho Y.-J., Lajoie B.R., Hildebrand D.G., Simon A.C., Becker M.S., Alt F.W., Dekker J.. Spatial organization of the mouse genome and its role in recurrent chromosomal translocations. Cell. 2012; 148:908–921. [DOI] [PMC free article] [PubMed] [Google Scholar]
Associated Data
This section collects any data citations, data availability statements, or supplementary materials included in this article.
Supplementary Materials
Data Availability Statement
Tools used in the article are hosted here:
HiC-Pro: https://github.com/nservant/HiC-Pro
HiCPlotter: https://github.com/kcakdemir/HiCPlotter
HiTC: https://github.com/bioinfo-pf-curie/HiTC
HOMER: http://homer.ucsd.edu/homer/
3DMax: https://github.com/BDM-Lab/3DMax
ClicO FS: http://clicofs.codoncloud.com/
Sequence data generated in this study have been submitted to GEO (http://www.ncbi.nlm.nih.gov/geo/) under accession number GSE145769.