

Abstract
Objective:
Quantitative MRI evidence of mediobasal hypothalamic (MBH) gliosis positively correlates with BMI in adults. This has not been well explored in children nor have other brain regions involved in appetitive processing been tested for evidence of gliosis.
Methods:
Multi-site cross-sectional study in children to test for differences in quantitative T2 signal (measure of gliosis) by region and to assess relationships with age and BMI. Participants underwent brain MRI using the same equipment and protocol to quantify T2 relaxation time in 6 bilateral regions of interest (ROIs): putamen, caudate, ventral striatum, amygdala, hippocampus, and MBH, and 3 control regions: white matter, motor cortex, and dorsal hypothalamus.
Results:
Thirty-one participants (61% female) were included in a combined sample from the University of Washington (N=9) and John Hopkins University (N=22). Mean age was 14±3 years, and BMI z-score was 0.7±1.1 (26% with obesity). No study site-related differences were seen in T2 relaxation time across all 9 regions (chi2(8):9.46, P=0.30). Regional differences in T2 relaxation time were present (P<0.001). MBH presented longer T2 relaxation time, suggestive of gliosis, when compared to all regions (P<0.001), including an intra-hypothalamic control. Physiological age-related declines in T2 relaxation times were found in gray matter ROIs, but not in the MBH (r=−0.14, P=0.46). MBH was the only region with a positive correlation between T2 relaxation time and BMI z-score (r=0.38, P=0.03).
Conclusions:
In a multi-site study, pilot data suggest quantitative MRI detected normal maturation-related brain variation as well as evidence that MBH gliosis is associated with increased adiposity in children.
Keywords: Pediatric obesity, Gliosis, Hypothalamus, MRI, Obesity
Introduction
Reactive gliosis is the typical inflammatory and cellular reaction to any insult in the central nervous system (CNS) 1. It is mainly characterized by the presence of activated astrocytes and microglia 2 and detected in situations like trauma, stroke, and neurodegenerative diseases 1,2. In addition, this cellular process has also been shown to affect a key brain area for the control of energy homeostasis, the mediobasal hypothalamus (MBH) 3, in rodent models 4-7. Studies with rodent models were the first to demonstrate that overnutrition, by high fat diet feeding, acutely initiates an inflammatory response in the arcuate nucleus of the MBH, which precedes the occurrence of obesity 4,8, and, with chronic high-fat feeding, results in neuronal loss 4. Furthermore, activation of astrocytes and microglia were shown to be necessary for hyperphagia 9 and excessive weight gain to occur in mice 10. This suggests that reactive gliosis might be an important player in obesity pathogenesis 11.
In humans, reactive gliosis can be studied by quantitative MRI which provides information on tissue characteristics through the measurement of T2 relaxation time 12. By combining quantitative MRI and histopathology, the measurement of T2 relaxation time was validated as a tool for the study of gliosis in brain areas, such as hippocampus, thalamus, cortex, white matter 13-17, and in the MBH in humans and rodents 5,18.
Consistent with a relationship between MBH gliosis and obesity in humans, longer T2 relaxation time in the MBH is correlated with higher BMI in adults 5,6. This finding was recently extended to a pediatric sample from Brazil 7. These initial studies, from both adults and children 5,7, focused on the MBH, as the key area for energy homeostasis. However, other brain areas that play a role in ingestive behavior and obesity 11,19, such as the striatum (reward) 20 and hippocampus (memory and learning) 21, remain uninvestigated. In rodent models of diet-induced obesity, evidence of gliosis has been reported in the hippocampus, cortex, cerebellum (review in 22) and in different nuclei of the hypothalamus, e.g. paraventricular nucleus 23. In human adults examined postmortem, histopathological findings suggest that reactive gliosis is specific to the MBH when compared to an area in the frontal cortex 24.
In order to further investigate the relationship between CNS reactive gliosis in the context of pediatric obesity, this study aimed to apply quantitative T2 MRI in a combined two-site study to: 1) test for evidence of gliosis in relation to body adiposity in the MBH and to begin evaluating other brain regions of interest involved in appetitive processing, and 2) evaluate the multi-site applicability of this quantitative imaging protocol within a pediatric population.
Methods
Children and adolescents were recruited through advertisements in the Seattle, WA and Baltimore, MD areas and through clinics at Seattle Children’s Hospital. Inclusion criteria were age between 13 and 18y, for Seattle; and 8 to 19y, for Baltimore. For Seattle and Baltimore, body weight classification, as defined by BMI-for age and sex- percentile from CDC 25, was used as additional inclusion criteria that was: BMI percentile of > 95th (with obesity) or between 15th and 84.9th (normal weight). Additionally, for Baltimore, children and adolescents with BMI percentile between 85th and 94.9th (overweight) were also recruited. Exclusion criteria applied were: any major medical disorder (including diabetes), history of bariatric surgery or eating disorder, current participation in weight-loss program, use of weight loss medication or any other medication known to alter body weight, and MRI contraindications which includes weight >330 pounds (MRI table limit). Thirty-two participants underwent the MRI protocol, N=1 was excluded due to technical difficulties.
Participants and their legal guardians provided written informed assent and consent, respectively. The study was approved by the Western Institutional Review Board (Seattle) and The Johns Hopkins University (JH) institutional review board (Baltimore).
Anthropometrics
Body weight was obtained on a calibrated electronic scale and height via stadiometer, both were measured in light clothing, without shoes. BMI z-score was calculated based on CDC growth curves 25.
Image acquisition
MRI scans were acquired on both study sites using the same model of scanner (3-Tesla Philips Achieva, software version 5.1.7, Philips Medical Systems, Best, The Netherlands) and a 32-channel head radiofrequency coil. Soft foam pads were used to reduce head movement.
Sequences included a high-resolution T1-weighted scan (voxel size of 1 mm3) and a T2 relaxometry protocol previously applied 5-7. Briefly, it is based on a quantitative multi slice/multi-echo T2-weighted sequence with 16 echoes (interecho spacing of 10 ms; TR/TE/NSA: 2500/20-170/1) and the creation of a T2 relaxation time parametric map. The slices are acquired between the optic chiasm and the mammillary bodies (slice thickness: 2.0 mm, interslice gap: 0.0 mm) by placing the T2 volume on the optic chiasm and angling the T2 volume perpendicular to it. Further alignment is performed in the coronal and axial planes for the T2 volume to be straight with the midline. Final placement is verified in the sagittal view. T2 relaxation time (ms) is calculated from the signal decay curve of the 16 echoes on a pixel-by-pixel basis (voxel size: 0.32 mm3).
Image analysis
Reproducing previous studies 5-7, the coronal slice immediately posterior to the optic chiasm was selected for the placement of the bilateral regions of interest (ROIs) representing the mediobasal hypothalamus (MBH), putamen and amygdala (Figure 1, slice 3). An expanded protocol, considering our window of acquisition and identifiable anatomical landmarks, was developed to investigate three additional gray matter regions known to participate in the control of ingestive behavior20, one white matter and one motor cortex control regions that were expected to have consistent T2 values across all participants26-28, and an intra-hypothalamic control area, which is similar in location, near the 3rd ventricle, to the MBH (Figure 1). Specifically, slice 1 was identified as two slices anterior to slice 3 (MBH slice) for placement of ROIs in the striatum (caudate and ventral striatum) and a control region in the motor cortex (primary motor cortex). A white matter (corona radiata) control region was added to slice 3. An intra-hypothalamic control region representing the dorsal hypothalamus (DH) was placed to encompass the region of the paraventricular nucleus 29. Lastly, a more posterior slice was selected where the hippocampus could be clearly located (slice 6). The placement of the MBH and DH ROIs follow anatomical landmarks for the positioning with the medial edge abutting, but not including, the 3rd ventricle. All other ROIs are placed centrally within the anatomical boundaries of each region. A single rater (LES) placed all ROIs. Bilateral T2 relaxation times were averaged for each ROI to represent a single regional T2 value.
Figure 1. Imaging protocol and selected brain regions.
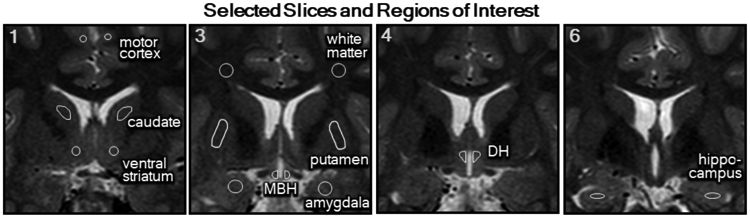
T2-weighted MRI showing the selected slices (1, 3, 4 and 6) anterior to posterior from the acquired series from the optic chiasm through the mammillary bodies and representative placement of the regions of interest (ROIs) in each slice. Slice 1 includes bilateral ROIs for the primary motor cortex, caudate and ventral striatum. Slice 3 has bilateral ROIs for a white matter control region (corona radiata), putamen, amygdala and mediobasal hypothalamus (MBH). Slice 4 contains the intra-hypothalamic control ROIs in the dorsal hypothalamus (DH) and Slice 6 shows bilateral ROIs for the hippocampus.
Statistics
Means ± standard deviations (SD) are reported unless otherwise noted. For comparison on general characteristics by study site, chi-squared tests of proportions and Student’s t-test were used for categorical and linear variables, respectively. Linear mixed models with restricted maximum likelihood estimates were utilized to evaluate regional, study site, side, and sex differences in the T2 relaxation time and adjust for covariates (e.g. age). Interactions were verified and formal post-tests were performed when a significant interaction was present. Pearson’s correlation coefficients were calculated for descriptive purposes. Simple linear regression models were applied to test associations of T2 relaxation time with age, and BMI z-score, reported with beta coefficients (β) and 95% confidence interval (95%CI). P<0.05 was considered significant for all inferential testing including regression models, with a Bonferroni-corrected significance level provided for post-test comparisons. Analyses were performed with STATA version 15.1 (StataCorp. 2017. Stata Statistical Software: Release 15. College Station, TX: StataCorp LLC) and graphing completed with GraphPad Prism version 8.0 for Windows (GraphPad Software, La Jolla, CA, USA).
Results
General characteristics
Overall, participants (N=31) were, on average, 13.8 ± 2.5 years old. Sixty-one percent female, 64.5% were classified as normal weight, 9.7% overweight and 25.8% with obesity. When comparing the two study sites (Table 1), samples did not differ on sex distribution (chi2 :0.18, P=0.68). However, the group from University of Washington (UW) was slightly older (t(29): −2.89, P=0.01), with a higher percentage of participants with obesity and higher BMI z-scores as compared to JH (chi2 (2):6.29, P=0.04 and t(29): −2.12, P=0.04, respectively). Age and BMI z-score were not significantly correlated within each study site (data not shown).
Table 1.
General Characteristics of the Study Participants.
| Total (N=31) |
UW (N=9) |
JH (N=22) |
||
|---|---|---|---|---|
| Age, years | 13.8 ± 2.5 | 15.7 ± 2.3* | 13.1 ± 2.2 | |
| Sex, % females | 61.3 | 63.6 | 55.6 | |
| BMI z-score | 0.75 ± 1.10 | 1.36 ± 1.11* | 0.49 ± 1.01 | |
| Body weight classification# | Normal weight | 64.5 | 33.3 | 77.3 |
| Overweight | 9.7 | 11.1 | 9.1 | |
| With Obesity | 25.8 | 55.6§ | 13.6 | |
| T2 Relaxation Time, ms | Putamen | 75.0 ± 2.5 | 74.1 ± 2.6 | 75.4 ± 2.4 |
| Amygdala | 95.4 ± 5.1 | 93.9 ± 6.3 | 96.0 ± 4.6 | |
| MBH | 124.9 ± 12.4 | 126.9 ± 15.2 | 124.1 ± 11.3 | |
| Dorsal Hypothalamus | 101.6 ± 5.6 | 98.3 ± 3.4 | 103.0 ± 5.8 | |
| White Matter | 77.9 ± 2.3 | 79.0 ± 2.3 | 77.5 ± 2.2 | |
| Motor Cortex | 94.8 ± 2.9 | 93.7 ± 3.0 | 92.3 ± 2.8 | |
| Caudate | 80.4 ± 2.3 | 80.2 ± 2.1 | 80.5 ± 2.4 | |
| Ventral Striatum | 86.7 ± 2.7 | 86.7 ± 2.5 | 86.8 ± 2.9 | |
| Hippocampus | 98.0 ± 2.9 | 97.7 ± 2.6 | 98.1 ± 3.0 |
UW, University of Washington; JH, Johns Hopkins University; MBH, mediobasal hypothalamus. Values are presented in mean ± SD.
Defined by BMI-for age and sex-percentile by CDC (25)
P<0.05 Student's t-test compared to JH
P=0.04 Pearson’s chi-squared test compared to JH.
Comparison of T2 relaxation time of the brain by study site
Mean ROI T2 relaxation times were consistent between the two study sites (Table 1). No significant study site*region interaction was found (chi2(8): 9.46, P=0.30), nor was there a main effect of study site (chi2(1):0.67, P=0.41, age and sex adjusted). The model remained non-significant when adjusted for BMI z-score (study site*region interaction chi2(8): 9.46, P=0.30; main effect of study site chi2(1):0.98, P=0.32). Given these findings, data from the study sites were combined in further analyses.
Comparison of T2 relaxation time among brain regions
Bilateral T2 relaxation time, of all participants together, differed across the nine ROIs examined, with a linear mixed model presenting a strongly significant main effect of region, independent of age, sex, and study site (chi2(8):2308.28, P<0.001). Post-tests confirmed MBH T2 relaxation time was longer than all other regions investigated, including the intra-hypothalamic control region (all P<0.001; Bonferroni-corrected P value <0.006).
From all ROIs, a significant region*side interaction was detected (chi2(8):167.53, P<0.001) as well as a main effect of side (chi2(1):39.27, P<0.001, adjusted for age, sex and study site). Laterality differences were confined to the hypothalamic regions of MBH [(R) 134.9 ± 14.3 vs (L) 114.9 ± 12.7 ms; z=−13.67, P<0.001] and DH [(R) 104.8 ± 7.0 vs (L) 98.4 ± 4.4 ms; z=−4.37, P<0.001].
Age and sex influences on brain T2 relaxation time
Including all participants, no significant region*sex interaction (chi2(8):1.50, P=0.99), or main effect of sex (chi2(1):0.00, P=0.95; adjusted for age) was seen on the mean bilateral T2 relaxation time. In contrast, strong negative associations between T2 relaxation time and age were found for multiple gray matter regions but not for the MBH (Figure 2; β=−0.68 ms, 95%CI: −2.55, 1.18 ms; P=0.46) or the White Matter control region (β=−0.06 ms, 95%CI: −0.41, 0.29 ms; P=0.74); negative associations in Ventral Striatum (β=−0.32 ms, 95%CI: −0.72, 0.08 ms; P=0.11), Hippocampus (β=−0.24 ms, 95%CI: −0.67, 0.18 ms; P=0.26), and the intra-hypothalamic control region in DH (β=−0.67 ms, 95%CI: −1.48, 0.15 ms; P=0.11) were less robust. In the MBH, no interaction with BMI z-score was detected for the effect of age on T2 relaxation time (β=−0.53 ms, 95%CI: −2.66, 1.59 ms; P=0.61).
Figure 2. T2 relaxation time and age.
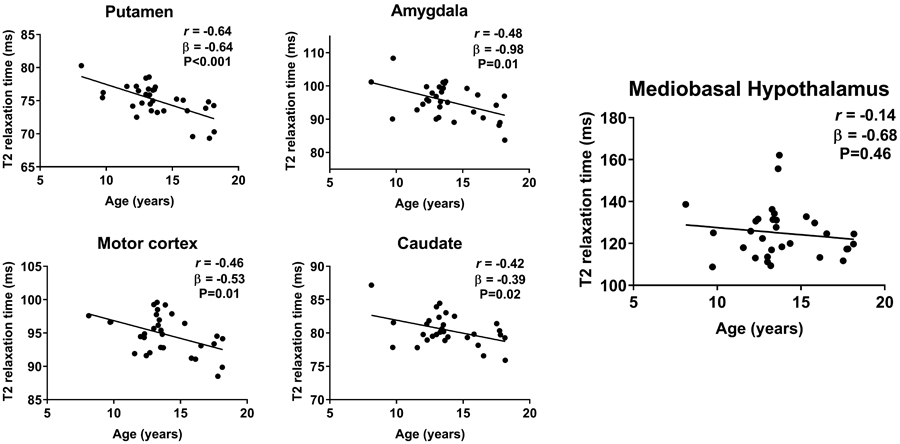
Normal negative associations of age and T2 relaxation time were present for gray matter regions [putamen (95%CI: −0.92, −0.35 ms), amygdala (95%CI: −1.67, −0.30 ms), caudate (95%CI: −0.71, −0.07 ms), and primary motor cortex (95%CI: −0.92, −0.14 ms)], but not for the mediobasal hypothalamus (MBH; 95%CI: −2.55, 1.18 ms). P-values by unadjusted linear regression, Pearson’s correlation coefficient calculated for descriptive purposes.
Association between T2 relaxation time and body adiposity across brain regions
BMI z-score was positively associated with T2 relaxation time within MBH (Figure 3). For all other regions, including the intra-hypothalamic DH control region, a negative or close to zero association was present (Figure 3, Amygdala β= 0.17 ms, 95%CI: −1.60, 1.94 ms; P=0.85; White Matter β=−0.26 ms, 95%CI: −1.05, 0.53 ms; P=0.50; Motor Cortex β=0.17 ms, 95%CI: −0.82, 1.17 ms; P=0.73; Hippocampus β=−0.24 ms, 95%CI: −1.23, 0.75 ms; P=0.62). When models were adjusted for age, results were unchanged across all brain regions (MBH β= 5.47 ms, 95%CI: 1.39, 9.54 ms; P=0.01; other brain regions data not shown). In analyses stratified by study site, positive associations were found at both sites, but did not reach statistical significance (JH: β= 3.65 ms, 95%CI: −1.28, 8.58 ms; P=0.14; and UW: β= 6.21 ms, 95%CI: −4.70, 17.13 ms; P=0.22).
Figure 3. T2 relaxation time and BMI z-score.
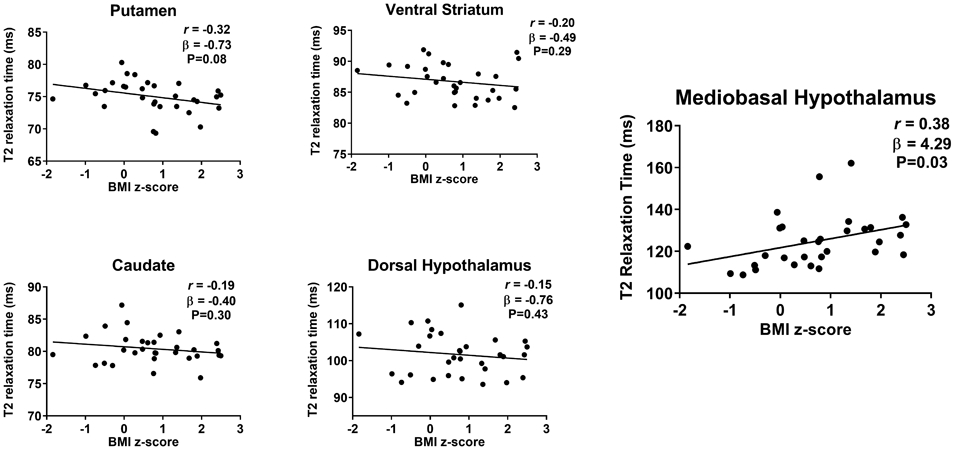
T2 relaxation time was not related to BMI z-score in gray matter regions [putamen (95%CI: −1.54, 0.08 ms), ventral striatum (95%CI: −1.42, 0.44 ms) and caudate (95%CI: −1.18, −0.38 ms)] including the intra-hypothalamic control area of the dorsal hypothalamus (95%CI: −2.68, 1.16 ms). On the contrary, a significant positive association was present between mediobasal hypothalamus (MBH) T2 relaxation time and BMI z-score (95%CI: 0.34, 8.24 ms). P-values by unadjusted linear regression, Pearson’s correlation coefficient calculated for descriptive purposes.
Since a lateralization of effect has been found previously for the association of hypothalamic gliosis with BMI in adults 4,5,30, we investigated data from right and left MBH separately. We detected in our sample that T2 relaxation time and BMI z-score were positively associated for the right MBH (β=6.12 ms, 95%CI: 1.31, 10.94 ms; P=0.02), and positive but attenuated for the left MBH (β=2.45 ms, 95%CI: −1.99, 6.89 ms; P=0.27).
Discussion
Accumulating evidence using MRI detects signs of hypothalamic gliosis in association with higher body adiposity in humans 5-7,24,30,31. As seen in adults4-6,30, a previous study with children7, and the current pilot study, the MBH was the only region to demonstrate evidence for gliosis, as measured by T2 relaxation time, in association with adiposity, distinguishing it from the 2 reference regions (amygdala and putamen) and the additional 3 brain regions involved in appetitive processing that were explored as well as the three control regions, including an intra-hypothalamic control region in the dorsal hypothalamus. These findings confirm and expand upon the prior literature in adults 4-6,30 and children 7 that examined more limited sets of brain regions. Additionally, the current data showed a negative relationship between T2 relaxation time and age across the regions examined, but not in the MBH. Finally, the findings support the feasibility of utilizing a multi-site study design to attain a better understanding of the role of hypothalamic structural changes in the development of pediatric obesity.
The correlation between the T2 relaxation time and a reliable measurement of body adiposity in the pediatric population, BMI z-score 32, has previously been investigated only for three regions in the brain: putamen, amygdala and MBH 7. In a small pediatric sample from Brazil, a positive correlation between T2 relaxation time and BMI z-score was only found for the MBH, not for amygdala or putamen 7. The current study is the first to replicate the finding in children and adolescents from the United States and expands upon that finding by including additional brain regions involved with ingestive behavior and an intra-hypothalamic control region. Only in the MBH was there a significant positive relationship between T2 relaxation time and BMI z-score, supporting previous work that may suggest that structural changes in tissue within this key regulatory center in energy homeostasis could be of critical importance to obesity pathophysiology. In adults, findings have been more robust in the left MBH 4,30. Conversely, in the current study of children, we found the positive correlation was more robust for the right MBH. Laterality for hypothalamic regulation of energy homeostasis has been suggested 33 and whether susceptibility to or the effect of MBH gliosis differs by lateral location deserves further investigation.
To advance the study of hypothalamic gliosis in relation to childhood obesity, we have tested the applicability of a multi-site study. Mean T2 relaxation values were similar despite two different samples being tested at two different study sites for all nine brain regions investigated. Indeed, the measurement of T2 relaxation time detects normal tissue variability (e.g., density of neurons vs. axons) amongst brain regions 12 as well as pathologic processes such as reactive gliosis 5,18. Adjusting for differences in age and percentage of participants with obesity between the two study sites, mean T2 relaxation time did not differ between the study sites for all brain regions evaluated. Therefore, this initial study suggests that T2 relaxation time by quantitative MRI appears reliable for multi-site studies needed to advance understanding of relationships between body adiposity and hypothalamic structural characteristics 34, including establishing prospective associations that are more informative regarding questions of cause-effect relationships between MBH gliosis and obesity in humans. In rodent models of diet-induced obesity, hypothalamic gliosis precedes weight gain 4 and is necessary for both hyperphagia and obesity 9,10. Longitudinal neuroimaging studies could provide evidence for the role structural alterations in the hypothalamus may have on predicting body adiposity change over time and future metabolic risk for children from distinct weight groups.
Sex differences in overall gray and white matter volumes in the pediatric population have been reported, but such differences are not consistently seen for microstructural measures 35,36. We observed no detectable differences between females and males across the nine ROIs tested, confirming prior results in a more limited set of regions in children 7 and adults 5. Moreover, a study by Kumar et al 28 investigated the T2 relaxation time in 36 different brain regions from 31 adolescents. No sex differences were reported in regions similar to the nine ROIs included in the current study but the authors found longer T2 relaxation times in males when compared to females in the left occipital white matter and mid pons, hypothesizing this difference to be due to the delayed white matter development in the occipital area for males and a more densely packed, lower volume structure, in the pons for females 28. Other MRI techniques, such as diffusion tensor imaging, have provided initial data indicating sex differences in microstructure and maturation trajectories 37, but suggest that sexual dimorphism in these measures is restricted to white matter.
Normal age-related declines in T2 relaxation time have been observed in gray matter regions such as the thalamus 38, putamen and amygdala across different age groups 5,7,28. In our study, we confirmed previous findings and expanded these findings by demonstrating widespread negative correlations between T2 relaxation time and age in the putamen, amygdala, caudate, and primary motor cortex, lending further support to the conclusion that the relationship reflects normal variability in tissue structure related to underlying brain maturation. Furthermore, a negative direction of correlation (even if the effect size was not significant) was detected in all other regions, with correlations close to zero in the white matter and in the MBH. The lack of correlation between age and T2 relaxation time in the MBH has been previously reported in adults 5 and in children (age 9-17y) 7. However, in the latter study’s subgroup analysis, the normal age-related decline in T2 relaxation time was observed in the MBH of participants with normal weight but not in children with obesity 7. This prior finding was not reproduced in our small sample. A study in adolescents (mean age 17.4 y), also found no relationship between whole hypothalamic T2 relaxation time and age 28. The current findings therefore suggest that quantitative T2 imaging may detect maturation-related tissue changes that occur in children during development 39, and also support the need for larger studies to determine if an alternate process is disrupting normal maturation in MBH tissue in children with obesity 7.
We did not detect evidence for gliosis in relation to obesity in our dorsal hypothalamic region that encompasses the area of the paraventricular nucleus. Data from rodent models of diet-induced obesity 23, demonstrated gliosis not only in the area corresponding to the arcuate and dorsomedial nuclei of the hypothalamus 23, as described by others 4,40, but also in the paraventricular nucleus 23. Yet, contrary to previous works on hypothalamic gliosis with rodent models that suggest gliosis is limited to the MBH 4, the work by Buckman et al 23 provided data exclusively on female mice. Additional studies are required. Particularly, multi-site, longitudinal studies with the power to investigate normative and independent influences of age, sex, and puberty on brain tissue characteristics 35,36, and the potential disruption to normal maturation processes in obesity in the MBH and other hypothalamic subregions.
The current study’s limitations include a lack of information on body composition and a relatively small sample size, particularly within the UW site, which limits the ability for stratified analyses, for example, by weight category. Additionally, pubertal status was not uniformly evaluated and may influence our findings, in a manner that is unaccounted for by the adjustments for age and sex performed. There is a strong need to better understand pubertal influences, such as age-related changes in insulin resistance, and disentangle the effects of age from puberty on brain structural data 35. We also acknowledge that, by using the same model of MRI scanners at both study sites, we are not able to extend these conclusions to other hardware. Finally, the measurement of T2 relaxation time by quantitative MRI is a sensitive but nonspecific measure of tissue characteristics 12; other pathologies, such as ischemia or edema, could lead to abnormally longer T2 relaxation times 39. However, this is less likely in our population since exclusion criteria prevented enrollment of participants with major medical issues, together with the evaluation of their high-resolution MRI, which showed no visually detectable evidence of CNS lesions. Furthermore, histopathology studies with human autopsy samples have validated in distinct brain regions 13-15, and in the MBH, that the longer T2 relaxation time correlates with the presence of reactive gliosis 5.
In conclusion, our initial study suggests the use of quantitative MRI to study signs of gliosis in human hypothalamus is applicable in a multi-site study. Additionally, similar to previous studies, evidence of gliosis in relation to greater body adiposity in a pediatric population was shown to be specific to the MBH and not present in other brain regions evaluated, even in additional appetite-processing regions not previously explored. The current study paves the way for future multi-site studies to address remaining questions on the links between hypothalamic gliosis, diet, body adiposity, and trajectories of weight gain in pediatric populations.
Supplementary Material
Acknowledgements:
This work was supported by National Institutes of Health [R00DK088360 (SC), R01DK098466 (EAS, CLR) and R01DK117623 (EAS, SJM, LES, SC and CLR)] and Sao Paulo Research Foundation (FAPESP) [2017/00657-0 (LES)]. Additional funding by Johns Hopkins Discovery Award (SC) and University of Washington Royalty Research Fund (EAS).
EAS, SC and CLR designed the study and obtained grants. JH established the MRI protocol at the Johns Hopkins site. LES, SJM and EAS developed the imaging analysis approach. AP and MFW conducted data collection. LES and SJM analyzed the data. LES, SJM and EAS performed data interpretation and wrote the manuscript. All authors have reviewed the manuscript and approved the final version. We thank Mary Rosalynn B. De Leon, Jennifer L. Rosenbaum, Suchitra Chandrasekaran and Katya B. Rubinow for their support and expertise.
Abbreviations:
- CNS
central nervous system
- MBH
mediobasal hypothalamus
- ROI
region of interest
- DH
dorsal hypothalamus
- JH
Johns Hopkins University
- UW
University of Washington
Footnotes
Conflict of interest: The authors declared no conflict of interest.
References:
- 1.Burda JE, Sofroniew MV. Reactive gliosis and the multicellular response to CNS damage and disease. Neuron. 2014;81(2):229–248. doi: 10.1016/j.neuron.2013.12.034 [DOI] [PMC free article] [PubMed] [Google Scholar]
- 2.Sofroniew MV Molecular dissection of reactive astrogliosis and glial scar formation. Trends Neurosci. 2009;32(12):638–647. doi: 10.1016/j.tins.2009.08.002 [DOI] [PMC free article] [PubMed] [Google Scholar]
- 3.Schwartz MW, Woods SC, Porte D, Seeley RJ, Baskin DG. Central nervous system control of food intake. Nature. 2000;404(6778):661–671. doi: 10.1038/35007534 [DOI] [PubMed] [Google Scholar]
- 4.Thaler JP, Yi C, Schur EA, et al. Obesity is associated with hypothalamic injury in rodents and humans. J Clin Invest. 2012;122(1):153–162. doi: 10.1172/JCI59660 [DOI] [PMC free article] [PubMed] [Google Scholar]
- 5.Schur EA, Melhorn SJ, Oh S-K, et al. Radiologic evidence that hypothalamic gliosis is associated with obesity and insulin resistance in humans. Obesity (Silver Spring). 2015;23(11):2142–2148. doi: 10.1002/oby.21248 [DOI] [PMC free article] [PubMed] [Google Scholar]
- 6.Berkseth KE, Rubinow KB, Melhorn SJ, et al. Hypothalamic Gliosis by MRI and Visceral Fat Mass Negatively Correlate with Plasma Testosterone Concentrations in Healthy Men. Obesity (Silver Spring). 2018;26(12):1898–1904. doi: 10.1002/oby.22324 [DOI] [PMC free article] [PubMed] [Google Scholar]
- 7.Sewaybricker LE, Schur EA, Melhorn SJ, et al. Initial evidence for hypothalamic gliosis in children with obesity by quantitative T2 MRI and implications for blood oxygen-level dependent response to glucose ingestion. Pediatr Obes. 2019;14(2):e12486. doi: 10.1111/ijpo.12486 [DOI] [PMC free article] [PubMed] [Google Scholar]
- 8.García-Cáceres C, Yi CX, Tschöp MH. Hypothalamic Astrocytes in Obesity. Endocrinol Metab Clin North Am. 2013;42(1):57–66. doi: 10.1016/j.ecl.2012.11.003 [DOI] [PubMed] [Google Scholar]
- 9.Valdearcos M, Douglass JD, Robblee MM, et al. Microglial Inflammatory Signaling Orchestrates the Hypothalamic Immune Response to Dietary Excess and Mediates Obesity Susceptibility. Cell Metab. 2017;26(1):185–197.e3. doi: 10.1016/j.cmet.2017.05.015 [DOI] [PMC free article] [PubMed] [Google Scholar]
- 10.Douglass JD, Dorfman MD, Fasnacht R, Shaffer LD, Thaler JP. Astrocyte IKKβ/NF-κB signaling is required for diet-induced obesity and hypothalamic inflammation. Mol Metab. 2017;6(4):366–373. doi: 10.1016/j.molmet.2017.01.010 [DOI] [PMC free article] [PubMed] [Google Scholar]
- 11.Schwartz MW, Seeley RJ, Zeltser LM, et al. Obesity Pathogenesis: An Endocrine Society Scientific Statement. Endocr Rev. 2017;38(4):267–296. doi: 10.1210/er.2017-00111 [DOI] [PMC free article] [PubMed] [Google Scholar]
- 12.Whittall KP, Mackay AL, Graeb DA, Nugent RA, Li DKB, Paty DW. In vivo measurement ofT2 distributions and water contents in normal human brain. Magn Reson Med. 1997;37(1):34–43. doi: 10.1002/mrm.1910370107 [DOI] [PubMed] [Google Scholar]
- 13.Marshall VG, Bradley WG, Marshall CE, Bhoopat T, Rhodes RH. Deep white matter infarction: correlation of MR imaging and histopathologic findings. Radiology. 1988;167(2):517–522. doi: 10.1148/radiology.167.2.3357964 [DOI] [PubMed] [Google Scholar]
- 14.Braffman BH, Zimmerman RA, Trojanowski JQ, Gonatas NK, Hickey WF, Schlaepfer WW. Brain MR: pathologic correlation with gross and histopathology. 2. Hyperintense white-matter foci in the elderly. AJR Am J Roentgenol. 1988;151(3):559–566. doi: 10.2214/ajr.151.3.559 [DOI] [PubMed] [Google Scholar]
- 15.Briellmann RS, Kalnins RM, Berkovic SF, Jackson GD. Hippocampal pathology in refractory temporal lobe epilepsy: T2-weighted signal change reflects dentate gliosis. Neurology. 2002;58:265–271. doi: 10.1212/WNL.58.2.265 [DOI] [PubMed] [Google Scholar]
- 16.Chung YL, Williams A, Ritchie D, et al. Conflicting MRI signals from gliosis and neuronal vacuolation in prion diseases. Neuroreport. 1999;10(17):3471–3477. doi: 10.1097/00001756-199911260-00002 [DOI] [PubMed] [Google Scholar]
- 17.Jackson GD, Williams SR, Weller RO, et al. Vigabatrin-induced lesions in the rat brain demonstrated by quantitative magnetic resonance imaging. Epilepsy Res. 1994;18(1):57–66. http://www.ncbi.nlm.nih.gov/pubmed/8088257. [DOI] [PubMed] [Google Scholar]
- 18.Lee D, Thaler JP, Berkseth KE, Melhorn SJ, Schwartz MW, Schur E a. Longer T(2) relaxation time is a marker of hypothalamic gliosis in mice with diet-induced obesity. Am J Physiol Endocrinol Metab. 2013;304(11):E1245–50. doi: 10.1152/ajpendo.00020.2013 [DOI] [PMC free article] [PubMed] [Google Scholar]
- 19.Myers MG, Simerly RB. The neuroendocrinology and neuroscience of energy balance. Front Neuroendocrinol. 2010;31(1):1–3. doi: 10.1016/j.yfrne.2009.10.007 [DOI] [PMC free article] [PubMed] [Google Scholar]
- 20.Rossi MA, Stuber GD. Overlapping Brain Circuits for Homeostatic and Hedonic Feeding. Cell Metab. 2018;27(1):42–56. doi: 10.1016/j.cmet.2017.09.021 [DOI] [PMC free article] [PubMed] [Google Scholar]
- 21.Kanoski SE, Grill HJ. Hippocampus Contributions to Food Intake Control: Mnemonic, Neuroanatomical, and Endocrine Mechanisms. Biol Psychiatry. 2017;81(9):748–756. doi: 10.1016/j.biopsych.2015.09.011 [DOI] [PMC free article] [PubMed] [Google Scholar]
- 22.Guillemot-Legris O, Muccioli GG. Obesity-Induced Neuroinflammation: Beyond the Hypothalamus. Trends Neurosci. 2017;40(4):237–253. doi: 10.1016/j.tins.2017.02.005 [DOI] [PubMed] [Google Scholar]
- 23.Buckman LB, Thompson MM, Moreno HN, Ellacott KLJ. Regional astrogliosis in the mouse hypothalamus in response to obesity. J Comp Neurol. 2013;521(6):1322–1333. doi: 10.1002/cne.23233 [DOI] [PMC free article] [PubMed] [Google Scholar]
- 24.Baufeld C, Osterloh A, Prokop S, Miller KR, Heppner FL. High-fat diet-induced brain region-specific phenotypic spectrum of CNS resident microglia. Acta Neuropathol. 2016;132(3):361–375. doi: 10.1007/s00401-016-1595-4 [DOI] [PMC free article] [PubMed] [Google Scholar]
- 25.Kuczmarski RJ, Ogden CL, Grummer-Strawn LM, et al. CDC growth charts: United States. Adv Data. 2000;(314):1–27. http://www.ncbi.nlm.nih.gov/pubmed/11183293. [PubMed] [Google Scholar]
- 26.Bojorquez JZ, Bricq S, Acquitter C, Brunotte F, Walker PM, Lalande A. What are normal relaxation times of tissues at 3 T? Magn Reson Imaging. 2017;35:69–80. doi: 10.1016/j.mri.2016.08.021 [DOI] [PubMed] [Google Scholar]
- 27.Vavasour IM, Clark CM, Li DKB, MacKay AL. Reproducibility and reliability of MR measurements in white matter: Clinical implications. Neuroimage. 2006;32(2):637–642. doi: 10.1016/j.neuroimage.2006.03.036 [DOI] [PubMed] [Google Scholar]
- 28.Kumar R, Delshad S, Macey PM, Woo MA, Harper RM. Development of T2-relaxation values in regional brain sites during adolescence. Magn Reson Imaging. 2011;29(2):185–193. doi: 10.1016/j.mri.2010.08.006 [DOI] [PMC free article] [PubMed] [Google Scholar]
- 29.Baroncini M, Jissendi P, Balland E, et al. MRI atlas of the human hypothalamus. Neuroimage. 2012;59(1):168–180. doi: 10.1016/j.neuroimage.2011.07.013 [DOI] [PubMed] [Google Scholar]
- 30.Kreutzer C, Peters S, Schulte DM, et al. Hypothalamic Inflammation in Human Obesity Is Mediated by Environmental and Genetic Factors. Diabetes. 2017;66(9):2407–2415. doi: 10.2337/db17-0067 [DOI] [PubMed] [Google Scholar]
- 31.van de Sande-Lee S, Melhorn SJ, Rachid B, et al. Radiologic evidence that hypothalamic gliosis is improved after bariatric surgery in obese women with type 2 diabetes. Int J Obes. 2020;44(1):178–185. doi: 10.1038/s41366-019-0399-8 [DOI] [PMC free article] [PubMed] [Google Scholar]
- 32.Maynard LM, Wisemandle W, Roche AF, Chumlea WC, Guo SS, Siervogel RM. Childhood Body Composition in Relation to Body Mass Index. Pediatrics. 2001;107(2):344–350. doi: 10.1542/peds.107.2.344 [DOI] [PubMed] [Google Scholar]
- 33.Toth I, Kiss DS, Jocsak G, et al. Estrogen- and satiety state-dependent metabolic lateralization in the hypothalamus of female rats. PLoS One. 2015;10(9):1–11. doi: 10.1371/journal.pone.0137462 [DOI] [PMC free article] [PubMed] [Google Scholar]
- 34.O’Brien PD, Hinder LM, Callaghan BC, Feldman EL. Neurological consequences of obesity. Lancet Neurol. 2017;16(6):465–477. doi: 10.1016/S1474-4422(17)30084-4 [DOI] [PMC free article] [PubMed] [Google Scholar]
- 35.Gur RE, Gur RC. Sex differences in brain and behavior in adolescence: Findings from the Philadelphia Neurodevelopmental Cohort. Neurosci Biobehav Rev. 2016;70:159–170. doi: 10.1016/j.neubiorev.2016.07.035 [DOI] [PMC free article] [PubMed] [Google Scholar]
- 36.Lenroot RK, Gogtay N, Greenstein DK, et al. Sexual dimorphism of brain developmental trajectories during childhood and adolescence. Neuroimage. 2007;36(4):1065–1073. doi: 10.1016/j.neuroimage.2007.03.053 [DOI] [PMC free article] [PubMed] [Google Scholar]
- 37.Simmonds DJ, Hallquist MN, Asato M, Luna B. Developmental stages and sex differences of white matter and behavioral development through adolescence: A longitudinal diffusion tensor imaging (DTI) study. Neuroimage. 2014;92:356–368. doi: 10.1016/j.neuroimage.2013.12.044 [DOI] [PMC free article] [PubMed] [Google Scholar]
- 38.Hasan KM, Walimuni IS, Abid H, et al. Multimodal Quantitative Magnetic Resonance Imaging of Thalamic Development and Aging across the Human Lifespan: Implications to Neurodegeneration in Multiple Sclerosis. J Neurosci. 2011;31(46):16826–16832. doi: 10.1523/JNEUROSCI.4184-11.2011 [DOI] [PMC free article] [PubMed] [Google Scholar]
- 39.Toga AW, Thompson PM, Sowell ER. Mapping brain maturation. Trends Neurosci. 2006;29(3):148–159. doi: 10.1016/j.tins.2006.01.007 [DOI] [PMC free article] [PubMed] [Google Scholar]
- 40.Hsuchou H, He Y, Kastin AJ, et al. Obesity induces functional astrocytic leptin receptors in hypothalamus. Brain. 2009;132(Pt 4):889–902. doi: 10.1093/brain/awp029 [DOI] [PMC free article] [PubMed] [Google Scholar]
Associated Data
This section collects any data citations, data availability statements, or supplementary materials included in this article.