

Abstract
Background
Mounting evidence supports the occurrence of accelerating aging among long-term survivors of childhood cancer. We aimed to investigate epigenetic age acceleration (EAA) in survivors and evaluate associations between EAA, treatment exposures, health behaviors, and chronic health conditions (CHCs).
Methods
Genome-wide methylation data were generated with Infinium EPIC BeadChip on blood-derived DNA from 2139 survivors and 282 frequency matched controls from the St Jude Lifetime Cohort Study. EAAs were estimated as residuals from a linear regression of epigenetic age (Levine’s clock) against chronological age. Adjusted least square mean (ALSM) of EAA was calculated and compared between survivors and controls, across treatment exposures and health behaviors. Associations of EAA with 20 clinically assessed CHCs were evaluated with multivariable piecewise-exponential models. All statistical tests for P values below were 2-sided.
Results
EAA was statistically significantly higher in survivors than controls (ALSM = 0.63, 95% confidence interval [CI] = 0.26 to 1.01 vs −3.61, 95% CI = −4.43 to 2.80). In a multivariable model among survivors, statistically significantly higher EAA (P < .05) was observed in those exposed to chest radiotherapy, abdomen or pelvic radiotherapy, alkylating agents, glucocorticoids, or epipodophyllotoxins. Compared with survivors with favorable health behaviors (ALSM = 0.26, 95% CI=−0.36 to 0.87), EAA was statistically significantly higher among survivors with intermediate (ALSM = 1.07, 95% CI = 0.59 to 1.54) or unfavorable health behaviors (ALSM = 1.45, 95% CI = 0.60 to 2.30). In time-to-event analyses, statistically significant associations were identified between EAA tertiles and incidence of 7 CHCs: hypertension (3rd vs 1st tertile, relative rate [RR] = 1.83, 95% CI = 1.17 to 2.83), myocardial infarction (RR = 2.91, 95% CI = 1.27 to 7.21), obesity (RR = 1.39, 95% CI = 1.17 to 1.66), obstructive pulmonary deficit (RR = 1.86, 95% CI = 0.95 to 3.77), peripheral motor neuropathy (RR = 2.89, 95% CI = 1.24 to 6.97), peripheral sensory neuropathy (RR = 2.04, 95% CI = 0.99 to 4.26), and pulmonary diffusion deficits (RR = 2.75, 95% CI = 0.95 to 7.63).
Conclusions
EAA is statistically significantly higher in survivors of childhood cancer than in noncancer controls and is associated with specific treatment exposures, unfavorable health behaviors, and presence of specific CHCs.
With progress in cancer treatment and increased life expectancy, the population of childhood cancer survivors in the United States has grown and is now estimated to include over 500 000 (1). Unfortunately, therapeutic agents and modalities used to treat childhood cancers have long-term consequences on healthy tissues and organs (2). Adult survivors of childhood cancer are at risk of treatment-related adverse health outcomes, including a broad range of chronic health conditions (CHCs) (3), hospitalizations (4), premature frailty (5), and early mortality (6). Moreover, the prevalence of physiological frailty, an aging phenotype commonly observed in older adults (7), is higher in childhood cancer survivors compared with their similarly aged siblings (8) or comparable between young adult survivors (in their 30s) and much older noncancer individuals (in their 60s) (5). As a suggestive sign of accelerated aging, risk for CHCs is threefold higher among survivors than their similarly aged siblings (9). Our recent study showed survivors had statistically significantly shorter leukocyte telomere length (LTL) than controls, where the mean LTL of 6 Kb corresponded to an age of 36.8 years in survivors compared with 48.2 years among controls, suggesting an approximately 11-year acceleration in telomere attrition among survivors (10,11). Thus, understanding modifiable risk factors associated with premature aging among childhood cancer survivors is a major priority for both prevention and remediation of CHCs.
Aging is a complex and progressive process characterized by various changes at both molecular and cellular levels, such as telomere attrition, mitochondrial dysfunction, and epigenetic alterations (12). Telomere length is generally considered as a promising aging biomarker; however, the high variability across detection methods and weak correlations with age-related outcomes limit its use as an unambiguous biomarker of aging (13,14). Recently, increasing evidence suggests that dynamic DNA methylation, the most studied durable and reversible epigenetic alteration, outperforms other aging biomarkers in its strong correlations with aging and longevity (15). Measures of epigenetic age acceleration (EAA), the discrepancy between estimated epigenetic age and chronological age, can be a good proxy for the general health status or rate of physiological aging (16). To track such age-dependent epigenetic changes, several DNA methylation-based epigenetic clocks have been proposed (16–18), among which the Levine’s clock (ie, DNA methylation phenotypic age [DNAmPhenoAge]) provides superior predictive accuracy for time to death, all-cause mortality, and health span in the general population (15). The acceleration of DNAmPhenoAge also shows strong associations with a variety of age-related CHCs across different tissues and organs, including cardiovascular diseases, dementia, and frailty (18).
To date, the potential utility of EAA as a biomarker of aging among survivors of childhood cancer has not been established. To address this knowledge gap, we conducted genome-wide methylation profiling on blood-derived DNA from participants from St Jude Lifetime Cohort Study (19). EAA was compared between survivors and noncancer controls as well as assessed for associations with cancer treatment exposures, modifiable health behaviors, and clinically ascertained CHCs.
Methods
Study Population
A total of 2421 St Jude Lifetime Cohort Study participants of European ancestry were included, consisting of 2139 childhood cancer survivors and 282 community controls with no history of cancer. Controls were frequency-matched to the survivors by age, sex, and race. For comparison of EAA between survivors and controls, the analysis was limited to 1563 survivors and 282 controls whose DNA extraction was completed with the same protocol in the Computational Biology Genomic Laboratory at St Jude Children’s Research Hospital (Supplementary Methods, available online).
Chronic Health Conditions
A modification of the Common Terminology Criteria for Adverse Events (version 4.03, National Cancer Institute) (20) was applied to clinically ascertained medical outcomes and score for severity (19). Clinical outcomes were severity graded as 0 (no problem), 1 (mild), 2 (moderate), 3 (severe or disabling), and 4 (life-threatening) (19). Twenty common (incidence ≥20) nonneoplastic CHCs graded as 3-4 were considered for statistical analyses in this study.
Treatment Exposures
Treatment exposure information was extracted from medical records using a structured protocol (21). Briefly, using radiation oncology treatment records, region-specific radiotherapy (RT) dosimetry, including brain RT, chest RT, and abdomen or pelvic RT, was estimated (22). Cumulative doses of individual chemotherapeutic agents, including alkylating agents, anthracyclines, epipodophyllotoxins, glucocorticoids, platinum, and vincristine, were abstracted from medical records. Equivalency approaches were applied for cumulative alkylating agent exposure (23) and anthracyclines exposure (24).
Health Behaviors
Five suboptimal health behaviors assessed by questionnaires were defined as follows: 1) less than 150 minutes per week of at least moderate physical activity (25), 2) not participating in resistance training (25), 3) current or former tobacco smoking defined as 5 or more packs during lifetime, 4) a Healthy Eating Index score in the lowest tertile based on the 2015 to 2020 Dietary Guideline for Americans (26), and 5) either no or risky alcohol drinking defined as 5 or more drinks for males or 4 or more drinks for females on at least 1 day in the past (26). To compare EAA by health behaviors, survivors were further grouped into 3 categories: 1) favorable (no or only 1 suboptimal health behavior), 2) intermediate (2 or 3 suboptimal health behaviors), and 3) unfavorable (4 or 5 suboptimal health behaviors) (27).
DNA Methylation Measurement
Genome-wide methylation data were generated using Illumina MethylationEPIC BeadChip array on whole blood-derived DNA. Genomic DNA (250 ng) was extracted from blood samples according to standard procedures as described previously (28). Further bisulfite treatment, array hybridization, and scanning were detailed in the Supplementary Methods (available online). The raw intensity data were analyzed with Illumina Genome Studio to calculate the β values, ranging from 0 to 1, to describe the methylation level of a specific CpG site. Detailed quality controls were described in the Supplementary Methods (available online).
Epigenetic Age and EAA
Epigenetic age, referred to as DNAmPhenoAge, was calculated for each participant as previously described (18). Briefly, phenotypic age was constructed from 10 physiological measurements including chronological age, and then elastic net regression analysis was employed with phenotypic age as the outcome and CpG sites as the predictors based on genome-wide methylation data from whole-blood DNA. Finally, the selected 513 informative CpG sites were used to calculate epigenetic age with the following formula:
where the intercept and coefficient values (β) of 513 CpG markers were obtained from Levine et al. (18). EAA was estimated as the residual value from a linear regression model of epigenetic age on chronological age (ie, age at DNA sampling).
Statistical Analyses
Pearson’s correlation coefficient (r) was used to measure the strength of the linear association between epigenetic age and chronological age among survivors or noncancer controls. Validity of the linearity assumption was checked (Supplementary Methods, available online). To compare the annual change of epigenetic age between survivors and controls, a multiple linear regression of epigenetic age against chronological age and survivor or control status was analyzed, and the difference in the slope with respect to chronological age was tested between survivors and controls by an interaction term (chronological age × survivor or control status). To evaluate the effect of cancer diagnoses on EAA, multiple linear regression of EAA was employed adjusting for sex and health behaviors, where survivor (by primary diagnosis group) or control status was the independent variable (categorical) of interest. Adjusted least square mean (ALSM) of EAA was calculated based on this model for each primary diagnosis group and controls, and their difference was tested by Dunnett-Hsu Test, a modified Dunnett’s multiple comparison test using Hsu’s approximation for coverage probability estimates (29), using the control group as the reference with which each primary diagnosis group was compared. To examine effect of cancer treatments on EAA, multiple linear regression of EAA was used for each treatment (binary) adjusting for sex; those treatments with P values less than .05 were retained in a final combined model adjusting for health behaviors and sex. Difference in the ALSM of EAA between the exposed and nonexposed groups for each treatment was tested by the 2-sample t test. To evaluate the effect of health behaviors on EAA among controls, multiple linear regression was applied adjusting for sex, where health behavior status was set as the independent variable (categorical, n = 3) and EAA was set as the dependent variable. For the survivors-only model, treatment exposures were additionally adjusted. Dunnett-Hsu test was used to compare the difference of ALSM of EAA between unfavorable or intermediate health behavior group and the favorable group. To evaluate associations between EAA and new-onset CHCs, which were defined as CHCs that occurred 180 days or more after DNA sampling, time-to-event analyses using multivariable piecewise-exponential regression were conducted (Supplementary Methods, available online). All analyses were performed with SAS 9.4 (SAS Institute, Inc, Cary, NC) and figures were generated with R 3.6.1 (30). Two-sided P less than .05 was considered as statistically significant except for the trend test (1-sided).
Results
Characteristics of Study Population
Of the 2139 survivors (Table 1), 53.0% were male and 1.1% was Hispanic. Primary diagnoses comprised leukemia (34.2%), lymphoma (21.5%), sarcoma (13.2%), central nervous system tumors (11.5%), and other solid tumors (19.6%). Among survivors, 31.3% were exposed to brain RT, 28.5% chest RT, 22.4% abdominal or pelvic RT, 59.0% alkylating agents, 59.0% anthracyclines, 35.7% epipodophyllotoxins, 48.8% glucocorticoids, 12.7% platinum, and 69.7% vincristine. Nearly one-half of survivors (44.2%) reported participating in physical activity less than 150 minutes per week, 56.6% were not participating in resistance training, 21.8% had a poor Healthy Eating Index, 36.2% were current or former tobacco smokers, and 38.5% reported no or risky drinking history. The median ages at diagnosis, DNA sampling, and last follow-up among survivors were 7.3 years (range = 0.0 to 23.6 years), 31.8 years (range = 6.0 to 66.4 years), and 35.1 years (range = 9.2 to 69.1 years), respectively.
Table 1.
Characteristics of participants included in the study
| Characteristics | Overall survivors No. (%) |
Restricted survivorsa No. (%) |
Noncancer controlsa No. (%) |
Overall survivors vs controlsP | Restricted survivors vs controls P |
|---|---|---|---|---|---|
| Total | 2139 | 1563 | 282 | ||
| Sex | |||||
| Male | 1133 (53.0) | 825 (52.8) | 137 (48.6) | .17 | .19 |
| Female | 1006 (47.0) | 738 (47.2) | 145 (51.4) | ||
| Ethnicity | |||||
| Hispanic | 24 (1.1) | 16 (1.0) | 6 (2.1) | .18 | .15 |
| Non-Hispanic | 2115 (98.9) | 1547 (99.0) | 276 (97.9) | ||
| Diagnosis | |||||
| Leukemia | 732 (34.2) | 499 (31.9) | |||
| Acute lymphoblastic leukemia | 671 (31.4) | 453 (29.0) | — | ||
| Acute myeloid leukemia | 59 (2.8) | 44 (2.8) | — | ||
| Other leukemia | 2 (0.1) | 2 (0.1) | — | ||
| Lymphoma | 460 (21.5) | 347 (22.2) | |||
| Hodgkin lymphoma | 296 (13.8) | 237 (15.2) | — | ||
| Non-Hodgkin lymphoma | 164 (7.7) | 110 (7.0) | — | ||
| Sarcoma | 283 (13.2) | 218 (13.9) | — | ||
| Ewing sarcoma | 76 (3.6) | 66 (4.2) | — | ||
| Osteosarcoma | 76 (3.6) | 62 (4.0) | |||
| Rhabdomyosarcoma | 73 (3.4) | 44 (2.8) | — | ||
| Nonrhabdomyosarcoma | 58 (2.7) | 46 (2.9) | — | ||
| CNS tumors | 245 (11.5) | 211 (13.5) | |||
| Astrocytoma or glioma | 113 (5.3) | 97 (6.2) | — | ||
| Medulloblastoma or PNET | 59 (2.8) | 53 (3.4) | — | ||
| Ependymoma | 27 (1.3) | 24 (1.5) | — | ||
| Other CNS tumors | 46 (2.2) | 37 (2.4) | — | ||
| Embryonal | 285 (13.3) | 198 (12.7) | |||
| Wilms tumor | 140 (6.5) | 94 (6.0) | — | ||
| Neuroblastoma | 109 (5.1) | 80 (5.1) | — | ||
| Germ cell tumor | 36 (1.7) | 24 (1.5) | — | ||
| Other | 134 (6.3) | 90 (5.8) | |||
| Retinoblastoma | 51 (2.4) | 33 (2.1) | — | ||
| Hepatoblastoma | 15 (0.7) | 10 (0.6) | — | ||
| Melanoma | 13 (0.6) | 10 (0.6) | — | ||
| Carcinomas | 24 (1.1) | 15 (1.0) | — | ||
| Others | 31 (1.4) | 22 (1.4) | — | ||
| Radiation | |||||
| Brain RT | 669 (31.3) | 456 (29.2) | — | ||
| Chest RT | 609 (28.5) | 482 (30.8) | — | ||
| Abdomen/pelvis RT | 480 (22.4) | 364 (23.3) | — | ||
| Chemotherapy | |||||
| Alkylating agent | 1262 (59.0) | 921 (58.9) | — | ||
| Anthracyclines | 1262 (59.0) | 943 (60.3) | — | ||
| Epipodophyllotoxins | 764 (35.7) | 554 (35.4) | — | ||
| Glucocorticoids | 1044 (48.8) | 744 (47.6) | — | ||
| Platinum | 272 (12.7) | 219 (14.0) | — | ||
| Vincristine | 1491 (69.7) | 1056 (67.6) | — | ||
| Health behaviorsb | |||||
| Physical activity | <.001 | .001 | |||
| ≥150 min/wk | 1056 (49.4) | 766 (49.0) | 171 (60.6) | ||
| <150 min/wk | 946 (44.2) | 667 (42.7) | 96 (34.0) | ||
| Unknown | 137 (6.4) | 130 (8.3) | 15 (5.3) | ||
| Strength | .005 | .01 | |||
| Normal | 777 (36.3) | 557 (35.6) | 129 (45.7) | ||
| Abnormal | 1211 (56.6) | 872 (55.8) | 139 (49.3) | ||
| Unknown | 151 (7.1) | 134 (8.6) | 14 (5.0) | ||
| Health eating index | .01 | .02 | |||
| Normal | 1496 (69.9) | 1087 (69.6) | 226 (80.1) | ||
| Abnormal | 467 (21.8) | 328 (21.0) | 46 (16.3) | ||
| Unknown | 176 (8.2) | 148 (9.5) | 10 (3.5) | ||
| Tobacco smoking status | .25 | .51 | |||
| Never smoking | 1296 (60.6) | 958 (61.3) | 178 (63.1) | ||
| Ever smoking | 775 (36.2) | 537 (34.4) | 91 (32.3) | ||
| Unknown | 68 (3.2) | 68 (4.4) | 13 (4.6) | ||
| Alcohol drinking status | .01 | .01 | |||
| Moderate drinking | 965 (45.1) | 685 (43.8) | 125 (44.3) | ||
| Not moderate drinking | 823 (38.5) | 586 (37.5) | 148 (52.5) | ||
| Unknown | 351 (16.4) | 292 (18.7) | 9 (3.2) | ||
| Median age at diagnosis (range), y | 7.3 (0.0, 23.6) | 7.8 (0.0, 22.8) | NA | ||
| Median age at DNA sampling (range), y | 31.8 (6.0, 66.4) | 31.5 (6.0 66.4) | 35.0 (18.7, 70.2) | <.001 | <.001 |
| Median age at follow-up (range), y | 35.1 (9.2, 69.1) | 34.1 (9.2, 69.1) | 35.0 (18.6, 70.2) | .59 | .26 |
Survivors with DNA extraction conducted by the same laboratory with the same protocol as noncancer controls. CNS = central nervous system; PNET = primitive neuroectodermal tumor; RT = radiotherapy.
Suboptimal health behaviors included: 1) less than 150 min/wk of at least moderate physical activity, 2) no participation in resistance training, 3) scoring in the lowest tertile on the Healthy Eating Index based on the 2015 to 2020 Dietary Guideline for Americans, 4) tobacco smoking, and 5) either no or risky alcohol drinking. Individuals with missing values for health behavior variables were dropped from analyses.
Among the 282 noncancer controls, 48.6% were male and 2.1% Hispanic. The median age at DNA sampling and last follow-up of controls was 35.0 years (range = 18.7 to 70.2 years) and 35.0 years (range = 18.6 to 70.2 years).
EAA in Survivors and Noncancer Controls
The estimated epigenetic age was highly correlated with chronological age among both survivors (r = 0.88, P < .001) and noncancer controls (r = 0.88, P < .001) (Supplementary Figure 1, available online). However, the slope of the linear regression line (ie, annual change of epigenetic age) was statistically significantly higher among survivors than controls (1.24 vs 1.08 years, P < .001) (Figure 1). In addition, EAA in survivors was statistically significantly higher overall (ALSM = 0.63 years, 95% CI= −0.26 to 1.01 years, P < .001) and across all primary diagnoses (P < .01) than noncancer controls (ALSM = −3.61, 95% CI= −4.43 to 2.80). Among survivors, those diagnosed with Hodgkin lymphoma had the largest EAA (ALSM = 4.61, 95% CI = 3.69 to 5.53), whereas survivors with central nervous system tumors had a relatively smaller EAA (ALSM = −1.27, 95% CI = −2.28 to −0.25) than survivors with other diagnoses (Figure 2; Supplementary Tables 1 and 2, available online).
Figure 1.
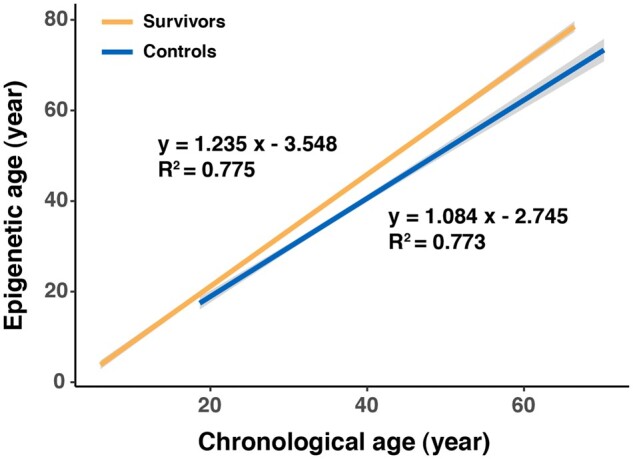
Linear regression lines of epigenetic age by age at DNA sampling for survivors and controls.
Figure 2.

Adjusted least square mean (ALSM) of epigenetic age acceleration (EAA) in controls and survivors overall and across primary cancer diagnoses. P values refer to the statistical significance of differences in ALSM of EAA between survivors (overall and by diagnosis) and controls. Detailed estimates are provided in the Supplementary Table 1 (available online). Statistical significance for pairwise comparisons of ALSM of EAA among primary cancer diagnosis groups is provided in the Supplementary Table 2 (available online). ALL = acute lymphoblastic leukemia; CNS = central nervous system; HL = Hodgkin lymphoma; NBL = neuroblastoma; NHL = non-Hodgkin lymphoma; WT = Wilms tumor.
EAA and Cancer Treatment Exposures
When comparing EAA between survivors exposed and not exposed to specific RT treatment fields or chemotherapeutic agents in univariate analyses, survivors exposed to chest RT (ALSM = 2.90 vs −1.21, P < .001) or abdomen or pelvic RT (ALSM = 2.98 vs −0.92, P < .001) had statistically significantly higher EAA than nonexposed survivors, but no association between EAA and brain RT was identified (Supplementary Table 3, available online). Survivors exposed to alkylating agents (ALSM = 1.11 vs −1.69, P < .001), anthracyclines (ALSM = 0.55 vs −0.89, P < .001), glucocorticoids (ALSM = 0.65 vs −0.70, P < .001), vincristine (ALSM = 0.55 vs −1.41, P < .001), or epipodophyllotoxins (ALSM = 0.77 vs −0.49, P < .001) also had higher EAA than those not exposed. However, no statistically significant association of EAA with platinum was observed (ALSM = 0.47 vs −0.12, P = .20) (Supplementary Table 3, available online). In addition, linear dose response for treatment and EAA associations was observed for chest RT, abdomen or pelvic RT, anthracyclines, and alkylating agents; however, risk for the highest dose group became attenuated for glucocorticoids, vincristine, and epipodophyllotoxins (Supplementary Table 4, available online). Because treatment regimens in children with cancer are often multimodal, a multivariable model including the 7 statistically significant treatments identified in the univariate model was also analyzed, showing the mutually adjusted statistical significance in chest RT (P = .001), abdomen or pelvic RT (P = .05), alkylating agents (P = .001), epipodophyllotoxins (P = .001), and glucocorticoids (P = .01) (Figure 3), whereas anthracyclines and vincristine became non-statistically significant.
Figure 3.

Adjusted least square mean (ALSM) of epigenetic age acceleration (EAA) among survivors by cancer treatments in a multivariable model. Detailed estimates are provided in the Supplementary Table 5 (available online). RT = radiotherapy.
EAA and Health Behaviors
Among controls without a childhood cancer history, favorable, intermediate and unfavorable health behaviors were endorsed in 39.0% (101 of 259), 50.6% (131 of 259), and 10.4% (27 of 259), respectively. Among survivors, the proportion in the favorable health category (30.8%, 566 of 1838) was lower than that in noncancer controls, whereas the proportions in the intermediate (54.6%, 1003 of 1838) or unfavorable (14.6%, 269 of 1838) health behavior groups were relatively higher.
Compared with survivors with favorable health behaviors (ALSM = 0.26, 95% CI = 0.36 to 0.87), EAA was statistically significantly higher among groups of survivors with intermediate (ALSM = 1.07, 95% CI = 0.59 to 1.54, P = .04) or unfavorable health behaviors (ALSM = 1.45, 95% CI = 0.60 to 2.30, P = .03) (Figure 4, A). Among noncancer controls, EAA was also statistically significantly higher among those with unfavorable health behaviors (ALSM = −1.23, SE = 1.13, P = .03) than those with favorable health behaviors (ALSM = −4.33, SE = 0.59) (Figure 4, B).
Figure 4.

Adjusted least square mean (ALSM) of epigenetic age acceleration (EAA) among survivors (A) and noncancer controls (B) by groups of health behaviors. Detailed estimated are provided in the Supplementary Table 6 (available online).
Analysis of EAA for specific health behaviors (Supplementary Figure 2, available online) showed that survivors with a history of tobacco smoking had statistically significantly higher EAA than those without (P = .04). Survivors with lower levels of physical activity (P = .09), poor diet (P = .15), or risky alcohol consumption (P = .06) also showed increased EAA, although these associations did not reach statistical significance.
EAA and CHCs
In time-to-event analyses (Supplementary Table 7, available online), we found evidence of associations between EAA and rates of 7 subsequent CHCs, including hypertension (third vs first tertile, relative rate [RR]=1.83, 95% CI = 1.17 to 2.83, Ptrend = .005), myocardial infarction (RR = 2.91, 95% CI = 1.27 to 7.21, Ptrend = .005), obesity (RR = 1.39, 95% CI = 1.17 to 1.66, Ptrend < .001), obstructive pulmonary deficit (RR = 1.86, 95% CI = 0.95 to 3.77, Ptrend = .05), peripheral motor neuropathy (RR = 2.89, 95% CI = 1.24 to 6.97, Ptrend = .008), peripheral sensory neuropathy (RR = 2.04, 95% CI = 0.99 to 4.26, Ptrend = .04), and pulmonary diffusion deficits (RR = 2.75, 95% CI = 0.95 to 7.63, Ptrend = .007) (Table 2). We also observed a borderline statistically significant association for obstructive sleep apnea with EAA (RR = 1.70, 95% CI = 0.92 to 3.02, Ptrend = .06) (Table 2).
Table 2.
Associations of EAA with incidence of subsequent CHCs with statistical significance among survivorsa
| CHC | Relative rate (95% CI) | P b |
|---|---|---|
| Hypertension | .005 | |
| First tertile | Referent | |
| Second tertile | 0.99 (0.58 to 1.61) | |
| Third tertile | 1.83 (1.17 to 2.83) | |
| Myocardial infarction | .005 | |
| First tertile | Referent | |
| Second tertile | 1.21 (0.47 to 3.38) | |
| Third tertile | 2.91 (1.27 to 7.21) | |
| Obesity | <.001 | |
| First tertile | Referent | |
| Second tertile | 1.30 (1.09 to 1.54) | |
| Third tertile | 1.39 (1.17 to 1.66) | |
| Obstructive pulmonary deficit | .05 | |
| First tertile | Referent | |
| Second tertile | 1.26 (0.63 to 2.75) | |
| Third tertile | 1.86 (0.95 to 3.77) | |
| Obstructive sleep apnea | .06 | |
| First tertile | Referent | |
| Second tertile | 0.94 (0.49 to 1.83) | |
| Third tertile | 1.70 (0.92 to 3.02) | |
| Peripheral motor neuropathy | .008 | |
| First tertile | Referent | |
| Second tertile | 1.27 (0.46 to 3.18) | |
| Third tertile | 2.89 (1.24 to 6.97) | |
| Peripheral sensory neuropathy | .04 | |
| First tertile | Referent | |
| Second tertile | 1.14 (0.51 to 2.52) | |
| Third tertile | 2.04 (0.99 to 4.26) | |
| Pulmonary diffusion deficit | .007 | |
| First tertile | Referent | |
| Second tertile | 0.65 (0.17 to 2.49) | |
| Third tertile | 2.75 (0.95 to 7.63) |
The time-to-event analysis was performed by using a multivariable piecewise-exponential regression model for each CHC. CI = confidence interval; CHC = chronic health condition; EAA = epigenetic age acceleration.
P value for testing the linear trend of association with CHC across 3 tertiles of EAA.
Discussion
Using DNA methylation-based epigenetic age among childhood cancer survivors and noncancer controls, we found that in contrast to the similar age-dependent attrition of LTL observed for both survivors and controls in our previous study (10), the annual change of epigenetic age is statistically significantly higher among survivors and persists across the entire age span, suggesting different modes of action underlying the dynamics of aging biomarkers (ie, LTL and epigenetic age) during the aging process: LTL follows an accentuated aging trajectory, whereas epigenetic age follows an accelerated aging trajectory (Figure 5). In addition, our findings provided evidence that specific cancer treatment exposures contribute to increased levels of EAA among survivors, suggesting that cellular damage and molecular alterations induced by cancer treatments contribute to accelerated epigenetic regulation of aging. Considering the findings that unfavorable health behaviors contribute to elevated levels of EAA, which is also associated with increased incidences of age-related CHCs among survivors of childhood cancer, we propose that EAA may serve as a potential biomarker for identifying groups with higher risk and evaluating the effectiveness of pharmaceutical and behavioral inventions designed to slow down EAA and hence prevent or remediate chronic diseases in this vulnerable population.
Figure 5.

Dynamics of epigenetic age and telomere length differs between individuals with no history of cancer and survivors of childhood cancer due to exposures to chemotherapy and/or radiation therapy.
DNA methylation is the most common epigenetic regulation mechanism, which is highly responsive to both internal and external insults. As genotoxic treatment modalities, ionizing radiation and chemotherapeutic agents could profoundly affect the methylation level in blood leukocytes (31–34). It is reported that the oxidative stress and chronic DNA damage caused by genotoxic agents, such as radiation (35) and alkylating agents (36), could lead to aberrant local hypermethylation or global hypomethylation and ultimately engender accelerated biological aging process (37–39). However, the mechanism of how radiation and chemotherapy pose impact on EAA is still quite poorly understood. Our findings provided novel evidence that EAA is statistically significantly accelerated among adults exposed to certain cancer treatment modalities during childhood, including chest RT, abdomen or pelvic RT, alkylating agents, glucocorticoids, and epipodophyllotoxins. However, because treatment for childhood cancer includes multiple agents, we cannot rule out entirely influences of other regimens. For example, correlations between vincristine exposure and alkylating agent or glucocorticoid exposure may have led to a non-statistically significant association between EAA and vincristine.
The age-related CHCs linked to elevated EAA in our study are consistent with previous findings. For example, positive associations of EAA with cardiovascular disease (18), hypertension (40), obesity (41), and neuropathology (18) are also reported in the general population. In addition, we provided novel evidence that links accelerated epigenetic age to pulmonary impairments among childhood cancer survivors based on the hypothesis that DNA methylation is associated with the biological process underlying lung function decline (42). Although the generation of reactive oxygen species and the increase of mitochondrial activity (43) caused by environmental exposures and suboptimal lifestyle factors (ie, smoking, poor dietary habits, excessive alcohol consumption, and inactivity) could dysregulate methylation of immune genes and increase proinflammatory responses (44) in the general population, and the chronic low-grade inflammation further fosters onset of CHCs in older individuals (45), we speculate that the process may be similar in younger childhood cancer survivors whose early treatment exposures activate this process prematurely. Thus, EAA may have utility as a biomarker that improves precision in models designed to predict CHC risk among childhood cancer survivors.
Although this study provides novel information and intriguing insights into understanding the accelerated aging among childhood cancer survivors, our findings should be interpreted in the context of some limitations. First, the low numbers of survivors with specific CHCs and matched noncancer controls affects the overall statistical power of our study. Second, because we only considered childhood cancer treatment within 5 years from initial diagnosis and additional treatment exposures during survivorship care were not considered, our results may be confounded. Third, because we had so few survivors with non-European ancestry, our analysis was restricted to those of European ancestry and cannot be generalized to survivors in other ancestry groups. Fourth, the temporal association between health behaviors and EAA is uncertain, given that we do not have exact information on lifetime exposure to alcohol, poor diet, and sedentary behavior. Thus, a longitudinal multi-time point study design is needed to evaluate duration, intensity, and patterns of health behaviors over time on EAA. Fifth, although we accounted for different DNA extraction methods with batch effect adjustment in the analysis, measurement error is possible and may have influenced the results. Finally, because survivors included in this study are quite young, with a median attained age of 36 years, the estimated associations between EAA and CHC risk may change over the course of further follow-up.
Collectively, our findings provide compelling evidence that the reversible biomarker, EAA, is higher among childhood cancer survivors and possibly mediates the causal association between modifiable risk factors and age-related chronic outcomes. There is great potential for EAA to be used as a target for mechanistic antiaging interventions and also as an intermediate outcome for interventions without the need to wait for years for the endpoint to materialize.
Funding
This research was supported by funding from the American Lebanese Syrian Associated Charities to St Jude Children’s Research Hospital and by grants (CA021765, CA195547, and CA216354) from the National Institutes of Health to St Jude Children’s Research Hospital.
Notes
Role of funder: The funders of the study had no role in the design and conduct of the study and were not involved in collection, management, analysis, and interpretation of the data; preparation, review, or approval of the manuscript; or the decision to submit the manuscript for publication.
Author contributions: Z.W., K.K.N., J.Z., and L.L.R. designed the study. M.M.H. and L.L.R. assisted in or provided support for data collection and recruitment of study participants. J.E., H.M., and C.L.W. assisted in or supervised sample collection and processing; J.E., H.M., E.P., G.N., E.W., and J.Z. supervised and/or performed DNA extraction and processing for the Infinium MethylationEPIC Array. N.Q. and Z.W. performed the methylation analysis. Y.Y., Z.W., and L.L.R. developed the statistical analysis plan. Z.L. and N.Q. performed the statistical analyses. N.Q. N.S., and Z.W. wrote the first draft of the manuscript. All authors contributed to data interpretation and writing and approved the final manuscript for publication.
Disclosures: We declare no competing interests.
Acknowledgments: The authors thank all individuals who participated in this study.
Data availability
The DNA methylation data is accessible through the St Jude Cloud (https://stjude.cloud).
Supplementary Material
References
- 1. Robison LL, Hudson MM.. Survivors of childhood and adolescent cancer: life-long risks and responsibilities. Nat Rev Cancer. 2014;14(1):61–70. [DOI] [PMC free article] [PubMed] [Google Scholar]
- 2. Phillips SM, Padgett LS, Leisenring WM, et al. Survivors of childhood cancer in the United States: prevalence and burden of morbidity. Cancer Epidemiol Biomarkers Prev. 2015;24(4):653–663. [DOI] [PMC free article] [PubMed] [Google Scholar]
- 3. Bhakta N, Liu Q, Ness KK, et al. The cumulative burden of surviving childhood cancer: an initial report from the St Jude Lifetime Cohort Study (SJLIFE). Lancet. 2017;390(10112):2569–2582. [DOI] [PMC free article] [PubMed] [Google Scholar]
- 4. Zhang Y, Lorenzi MF, Goddard K, et al. Late morbidity leading to hospitalization among 5-year survivors of young adult cancer: a report of the childhood, adolescent and young adult cancer survivors research program. Int J Cancer. 2014;134(5):1174–1182. [DOI] [PubMed] [Google Scholar]
- 5. Ness KK, Krull KR, Jones KE, et al. Physiologic frailty as a sign of accelerated aging among adult survivors of childhood cancer: a report from the St Jude Lifetime cohort study. J Clin Oncol. 2013;31(36):4496–4503. [DOI] [PMC free article] [PubMed] [Google Scholar]
- 6. Armstrong GT, Chen Y, Yasui Y, et al. Reduction in late mortality among 5-year survivors of childhood cancer. N Engl J Med. 2016;374(9):833–842. [DOI] [PMC free article] [PubMed] [Google Scholar]
- 7. Fried LP, Tangen CM, Walston J, et al. Frailty in older adults: evidence for a phenotype. J Gerontol A Biol Sci Med Sci. 2001;56(3):M146–M156. [DOI] [PubMed] [Google Scholar]
- 8. Hayek S, Gibson TM, Leisenring WM, et al. Prevalence and predictors of frailty in childhood cancer survivors and siblings: a report from the childhood cancer survivor study. J Clin Oncol. 2020;38(3):232–247. [DOI] [PMC free article] [PubMed] [Google Scholar]
- 9. Armstrong GT, Kawashima T, Leisenring W, et al. Aging and risk of severe, disabling, life-threatening, and fatal events in the childhood cancer survivor study. J Clin Oncol. 2014;32(12):1218–1227. [DOI] [PMC free article] [PubMed] [Google Scholar]
- 10. Song N, Li Z, Qin N, et al. Shortened leukocyte telomere length associates with an increased prevalence of chronic health conditions among survivors of childhood cancer: a report from the St. Jude Lifetime Cohort. Clin Cancer Res. 2020;26(10):2362–2371. [DOI] [PMC free article] [PubMed] [Google Scholar]
- 11. Walsh KM. Telomere attrition in childhood cancer survivors. Clin Cancer Res. 2020;26(10):2281–2283. [DOI] [PubMed] [Google Scholar]
- 12. Lopez-Otin C, Blasco MA, Partridge L, et al. The hallmarks of aging. Cell. 2013;153(6):1194–1217. [DOI] [PMC free article] [PubMed] [Google Scholar]
- 13. Breitling LP, Saum KU, Perna L, et al. Frailty is associated with the epigenetic clock but not with telomere length in a German cohort. Clin Epigenet. 2016;8(1):21. [DOI] [PMC free article] [PubMed] [Google Scholar]
- 14. Marioni RE, Harris SE, Shah S, et al. The epigenetic clock and telomere length are independently associated with chronological age and mortality. Int J Epidemiol. 2016;45(2):424–432. [DOI] [PMC free article] [PubMed] [Google Scholar]
- 15. Horvath S, Raj K.. DNA methylation-based biomarkers and the epigenetic clock theory of ageing. Nat Rev Genet. 2018;19(6):371–384. [DOI] [PubMed] [Google Scholar]
- 16. Horvath S. DNA methylation age of human tissues and cell types. Genome Biol. 2013;14(10):R115. [DOI] [PMC free article] [PubMed] [Google Scholar]
- 17. Hannum G, Guinney J, Zhao L, et al. Genome-wide methylation profiles reveal quantitative views of human aging rates. Mol Cell. 2013;49(2):359–367. [DOI] [PMC free article] [PubMed] [Google Scholar]
- 18. Levine ME, Lu AT, Quach A, et al. An epigenetic biomarker of aging for lifespan and healthspan. Aging (Albany NY). 2018;10(4):573–591. [DOI] [PMC free article] [PubMed] [Google Scholar]
- 19. Hudson MM, Ehrhardt MJ, Bhakta N, et al. Approach for classification and severity grading of long-term and late-onset health events among childhood cancer survivors in the St. Jude Lifetime Cohort. Cancer Epidemiol Biomarkers Prev. 2017;26(5):666–674. [DOI] [PMC free article] [PubMed] [Google Scholar]
- 20.U.S. Department of Health and Human Services. Common Terminology Criteria for Adverse Events (CTCAE) Version 4.03. 2010. Washington, DC: National Institutes of Health, National Cancer Institute. 2016. [Google Scholar]
- 21. Hudson MM, Ness KK, Nolan VG, et al. Prospective medical assessment of adults surviving childhood cancer: study design, cohort characteristics, and feasibility of the St. Jude Lifetime Cohort study. Pediatr Blood Cancer. 2011;56(5):825–836. [DOI] [PMC free article] [PubMed] [Google Scholar]
- 22. Stovall M, Donaldson SS, Weathers RE, et al. Genetic effects of radiotherapy for childhood cancer: gonadal dose reconstruction. Int J Radiat Oncol Biol Phys. 2004;60(2):542–552. [DOI] [PubMed] [Google Scholar]
- 23. Green DM, Nolan VG, Goodman PJ, et al. The cyclophosphamide equivalent dose as an approach for quantifying alkylating agent exposure: a report from the Childhood Cancer Survivor Study. Pediatr Blood Cancer. 2014;61(1):53–67. [DOI] [PMC free article] [PubMed] [Google Scholar]
- 24. Feijen EA, Leisenring WM, Stratton KL, et al. Equivalence ratio for daunorubicin to doxorubicin in relation to late heart failure in survivors of childhood cancer. J Clin Oncol. 2015;33(32):3774–3780. [DOI] [PMC free article] [PubMed] [Google Scholar]
- 25. Piercy KL, Troiano RP, Ballard RM, et al. The physical activity guidelines for Americans. JAMA. 2018;320(19):2020–2028. [DOI] [PMC free article] [PubMed] [Google Scholar]
- 26.U.S. Department of Health and Human Services and U.S. Department of Agriculture. 2015-2020 Dietary Guidelines for Americans. 8th ed. Accessed on March 18, 2020: https://health.gov/our-work/food-and-nutrition/2015-2020-dietary-guidelines/. 2015.
- 27. Khera AV, Emdin CA, Drake I, et al. Genetic risk, adherence to a healthy lifestyle, and coronary disease. N Engl J Med. 2016;375(24):2349–2358. [DOI] [PMC free article] [PubMed] [Google Scholar]
- 28. Wang Z, Wilson CL, Easton J, et al. Genetic risk for subsequent neoplasms among long-term survivors of childhood cancer. J Clin Oncol. 2018;36(20):2078–2087. [DOI] [PMC free article] [PubMed] [Google Scholar]
- 29. Hsu JC. The factor analytic approach to simultaneous inference in the general linear model. J Comput Graphical Stat. 1992;1(2):151–168. [Google Scholar]
- 30.R Core Team. R: A Language and Environment for Statistical Computing. Vienna, Austria: R Foundation for Statistical Computing; 2019. [Google Scholar]
- 31. Jones PA, Issa JP, Baylin S.. Targeting the cancer epigenome for therapy. Nat Rev Genet. 2016;17(10):630–641. [DOI] [PubMed] [Google Scholar]
- 32. Dubrova YE. Radiation-induced transgenerational instability. Oncogene. 2003;22(45):7087–7093. [DOI] [PubMed] [Google Scholar]
- 33. Pogribny I, Raiche J, Slovack M, et al. Dose-dependence, sex- and tissue-specificity, and persistence of radiation-induced genomic DNA methylation changes. Biochem Biophys Res Commun. 2004;320(4):1253–1261. [DOI] [PubMed] [Google Scholar]
- 34. Gifford G, Paul J, Vasey PA, et al. The acquisition of hMLH1 methylation in plasma DNA after chemotherapy predicts poor survival for ovarian cancer patients. Clin Cancer Res. 2004;10(13):4420–4426. [DOI] [PubMed] [Google Scholar]
- 35. Ward JF. DNA damage produced by ionizing radiation in mammalian cells: identities, mechanisms of formation, and reparability. Prog Nucleic Acid Res Mol Biol. 1988;35:95–125. [DOI] [PubMed] [Google Scholar]
- 36. Fu D, Calvo JA, Samson LD.. Balancing repair and tolerance of DNA damage caused by alkylating agents. Nat Rev Cancer. 2012;12(2):104–120. [DOI] [PMC free article] [PubMed] [Google Scholar]
- 37. O'Hagan HM, Wang W, Sen S, et al. Oxidative damage targets complexes containing DNA methyltransferases, SIRT1, and polycomb members to promoter CpG Islands. Cancer Cell. 2011;20(5):606–619. [DOI] [PMC free article] [PubMed] [Google Scholar]
- 38. O'Hagan HM, Mohammad HP, Baylin SB.. Double strand breaks can initiate gene silencing and SIRT1-dependent onset of DNA methylation in an exogenous promoter CpG island. PLoS Genet. 2008;4(8):e1000155. [DOI] [PMC free article] [PubMed] [Google Scholar]
- 39. Cuozzo C, Porcellini A, Angrisano T, et al. DNA damage, homology-directed repair, and DNA methylation. PLoS Genet. 2007;3(7):e110. [DOI] [PMC free article] [PubMed] [Google Scholar] [Retracted]
- 40. Zhao W, Ammous F, Ratliff S, et al. Education and lifestyle factors are associated with DNA methylation clocks in older African Americans. Int J Environ Res Public Health. 2019;16(17):3141. [DOI] [PMC free article] [PubMed] [Google Scholar]
- 41. Quach A, Levine ME, Tanaka T, et al. Epigenetic clock analysis of diet, exercise, education, and lifestyle factors. Aging (Albany NY ). 2017;9(2):419–446. [DOI] [PMC free article] [PubMed] [Google Scholar]
- 42. Lepeule J, Baccarelli A, Motta V, et al. Gene promoter methylation is associated with lung function in the elderly: The Normative Aging Study. Epigenetics. 2012;7(3):261–269. [DOI] [PMC free article] [PubMed] [Google Scholar]
- 43. Somers EC, Richardson BC.. Environmental exposures, epigenetic changes and the risk of lupus. Lupus. 2014;23(6):568–576. [DOI] [PMC free article] [PubMed] [Google Scholar]
- 44. Ligthart S, Marzi C, Aslibekyan S, et al. WHI-EMPC Investigators. DNA methylation signatures of chronic low-grade inflammation are associated with complex diseases. Genome Biol. 2016;17(1):255. [DOI] [PMC free article] [PubMed] [Google Scholar]
- 45. Ferrucci L, Fabbri E.. Inflammageing: chronic inflammation in ageing, cardiovascular disease, and frailty. Nat Rev Cardiol. 2018;15(9):505–522. [DOI] [PMC free article] [PubMed] [Google Scholar]
Associated Data
This section collects any data citations, data availability statements, or supplementary materials included in this article.
Supplementary Materials
Data Availability Statement
The DNA methylation data is accessible through the St Jude Cloud (https://stjude.cloud).