. 2021 Apr 6;10:e65836. doi: 10.7554/eLife.65836

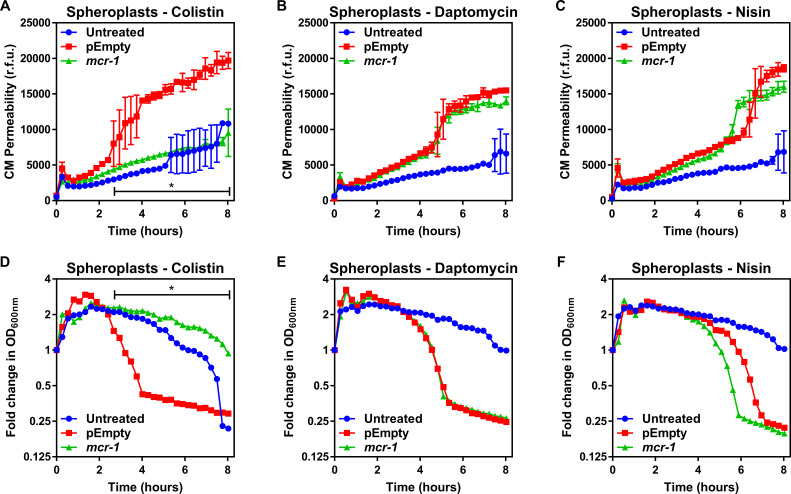
Figure 2. MCR-1 protects the cytoplasmic membrane of E. coli spheroplasts from colistin but not other cationic antimicrobial peptides.

(A–C) Permeabilisation of the CM of E. coli MC1000 spheroplasts generated from bacteria expressing mcr-1 or empty plasmid control bacteria (pEmpty) during incubation with (A) colistin (4 µg ml−1), (B) daptomycin (20 µg ml−1, with 1.25 mM Ca2+ ions), or (C) nisin (20 µg ml−1), as determined using 0.25 µM PI (n = 3, experiment performed on four independent occasions; *p<0.01 between pEmpty and mcr-1 strains). (D–F) Lysis of E. coli MC1000 spheroplasts generated from bacteria expressing mcr-1 or empty plasmid control bacteria during incubation with (D) colistin (4 µg ml−1), (E) daptomycin (20 µg ml−1, with 1.25 µM Ca2+ ions), or (F) nisin (20 µg ml−1), as measured using OD600nm readings (n = 3, experiment performed on four independent occasions; *p<0.05 between pEmpty and mcr-1 strains, error bars are omitted for clarity). Data in (A–F) were analysed by a two-way ANOVA with Dunnett’s post hoc test. Data are presented as the arithmetic mean, and error bars, where shown, represent the standard deviation of the mean. CM: cytoplasmic membrane; r.f.u.: relative fluorescence units; OD: optical density.

Figure 2.

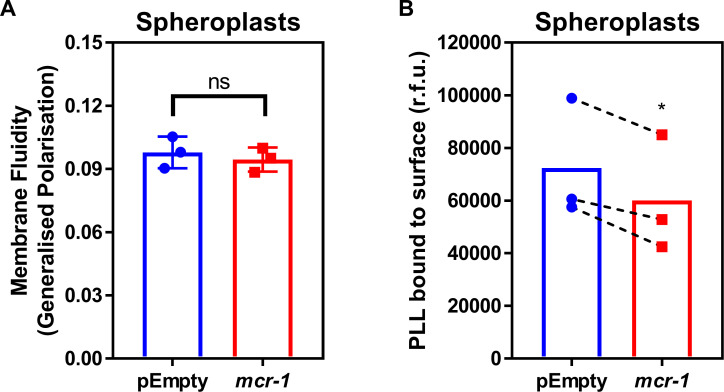
Figure 2—figure supplement 1. LPS modifications in the CM of colistin-resistant E. coli expressing mcr-1 has a small effect on membrane charge but not membrane fluidity.

Figure 2—figure supplement 1.

(A) Fluidity of the CM of E. coli MC1000 spheroplasts producing MCR-1 or an empty plasmid control strain, as determined using the fluorescent Laurdan dye (100 µM) to generate Generalised Polarisation (GP) values (n = 3 in duplicate; ns: p>0.05 compared to pEmpty). (B) Charge of the CM of E. coli MC1000 spheroplasts producing MCR-1 or an empty plasmid control strain, as determined by binding of highly positively charged FITC-labelled Poly-L-Lysine (PLL, 20 µg ml−1) to the surface of spheroplasts (n = 3; *p<0.05 compared to pEmpty). There was no difference in GP between pEmpty spheroplasts and spheroplasts expressing mcr-1, indicating that modified LPS had no effect on the fluidity of the CM (A). As expected, there was a small decrease in the amount of positively-charged PLL that could bind to the CM of spheroplasts producing MCR-1 compared to pEmpty, demonstrating that LPS modifications slightly increased the net positive charge of the CM (B). Data in (A, B) were analysed by a two-tailed paired Student’s t-test. Data are presented as the arithmetic mean, and error bars represent the standard deviation of the mean.
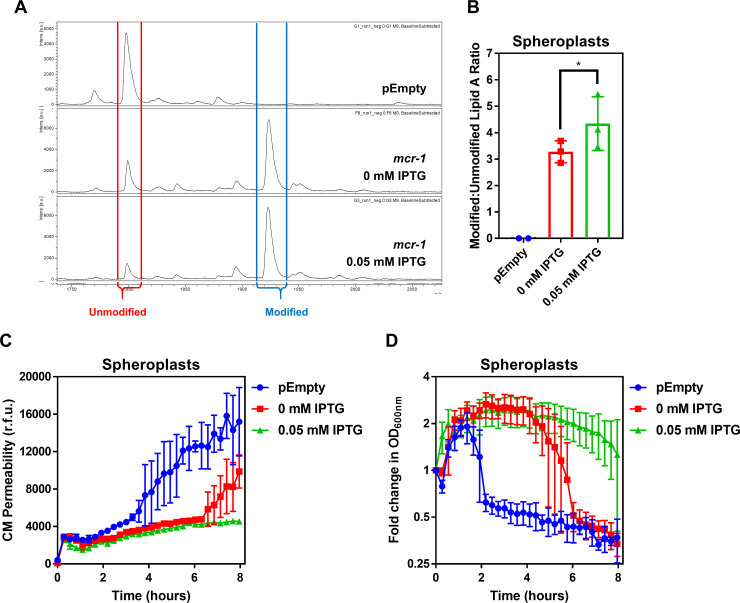
Figure 2—figure supplement 2. The amount of unmodified LPS in the CM of colistin-resistant E. coli expressing mcr-1 is proportional to the degree of susceptibility to colistin-mediated CM damage.

Figure 2—figure supplement 2.

(A) Representative mass spectra showing the presence and abundance of unmodified lipid A (red) and lipid A modified with phosphoethanolamine (blue) in MCR-1-producing spheroplasts of E. coli MC1000 either uninduced, or induced with 0.05 mM IPTG, as determined by MALDI-TOF-based lipidomics. Also shown, a spectrum from the same analysis of E. coli pEmpty (B) Quantification of LPS modified with phosphoethanolamine, expressed as the ratio of modified lipid A to unmodified lipid A, in MCR-1-producing spheroplasts of E. coli MC1000 either uninduced, or induced with 0.05 mM IPTG, as determined by MALDI-TOF-based lipidomics. (n = 3, *p<0.01 between 0 mM IPTG and 0.05 mM IPTG). (C) Permeabilisation by colistin (4 µg ml−1) of the CM of E. coli MC1000 spheroplasts generated from empty plasmid control bacteria, or from bacteria expressing mcr-1 either uninduced, or induced with 0.05 mM IPTG, as determined using 0.25 µM PI (n = 3, experiment performed on three independent occasions). (D) Lysis by colistin (4 µg ml−1) of E. coli MC1000 spheroplasts generated from empty plasmid control bacteria, or from bacteria expressing mcr-1 either uninduced, or induced with 0.05 mM IPTG, as measured using OD600nm readings (n = 3, experiment performed on three independent occasions). Spheroplasts of E. coli cells producing MCR-1 with different amounts of modified LPS in the CM were generated using the IPTG-inducible pDM1 plasmid. In the absence of IPTG induction, pETN-modified LPS was detected in the CM of E. coli spheroplasts, suggesting leakiness of the expression vector (A). Crucially, however, there was a significant increase in the proportion of pETN-modified lipid A relative to unmodified lipid A in the CM in response to 0.05 mM IPTG, in keeping with increased mcr-1 expression (A, B). The quantity of unmodified LPS in the CM of E. coli spheroplasts correlated with the extent to which the CM was susceptible to colistin-induced disruption of the CM, with spheroplasts that were not induced with IPTG displaying only a partial reduction in PI uptake in response to the polymyxin antibiotic compared to pEmpty spheroplasts (C). In keeping with this, colistin-mediated lysis of uninduced spheroplasts producing MCR-1 was delayed, but not prevented (D). By contrast, E. coli spheroplasts expressing mcr-1 which were induced with 0.05 mM IPTG and had a lower proportion of unmodified lipid A in the CM and exhibited no CM disruption in response to colistin and there was also no lysis of spheroplasts observed (C, D). This confirmed that resistance to colistin conferred by mcr-1 was directly related to the amount of unmodified LPS present in the CM. Data in B were analysed by a one-way ANOVA with Sidak’s post hoc test. Data are presented as the arithmetic mean, and error bars represent the standard deviation of the mean.