

Abstract
Background
Findings and interpretations of myocardial perfusion imaging (MPI) studies are documented in free-text MPI reports. MPI results are essential for research, but manual review is prohibitively time-consuming. This study aimed to develop and validate an automated method to abstract MPI reports.
Methods
We developed a natural language processing (NLP) algorithm to abstract MPI reports. Randomly selected reports were double-blindly reviewed by two cardiologists to validate the NLP algorithm. Secondary analyses were performed to describe patient outcomes based on abstracted-MPI results on 16,957 MPI tests from adult patients evaluated for suspected ACS.
Results
The NLP algorithm achieved high sensitivity (96.7%) and specificity (98.9%) on the MPI categorical results and had a similar degree of agreement compared to the physician reviewers. Patients with abnormal MPI results had higher rates of 30-day acute myocardial infarction or death compared to patients with normal results. We identified issues related to the quality of the reports that not only affect communication with referring physicians but also challenges for automated abstraction.
Conclusion
NLP is an accurate and efficient strategy to abstract results from the free-text MPI reports. Our findings will facilitate future research to understand the benefits of MPI studies, but requires validation in other settings.
Keywords: myocardial perfusion imaging, data abstraction, ischemia, noninvasive stress test, natural language processing, nuclear cardiology
INTRODUCTION
Myocardial perfusion imaging (MPI) is the most common noninvasive cardiac test to evaluate emergency department (ED) patients with suspected acute coronary syndrome (ACS).1 Prior studies have demonstrated a strong association of abnormal MPI studies with adverse cardiovascular events during follow-up.2,3 There is still much to learn regarding the effectiveness MPI and other noninvasive cardiac tests related to patient outcomes, care affordability and the patients most likely to benefit.4,5 Comparative effectiveness studies to assess the value of MPI or other noninvasive tests in acute care settings pose many challenges, including the high costs of large randomized trials, and the confounding factors associated with non-randomized study designs.4,6 Efficiently capturing the results of large numbers of MPI, would provide the information necessary to do large scale observational studies to answer important clinical questions about the clinical effectiveness, risks, and benefits to patients.
MPI reports document crucial details on MPI testing that are essential to downstream care. Such text-formatted reports are written in human language, which is difficult for computers to process. Natural Language Processing (NLP) is a subfield of artificial intelligence and computer science focused on the interactions between computers and natural (human) languages. With electronic health records (EHR) being more accessible, NLP has increased use in the clinical field. For clinical research, NLP enabled computers to identify and extract information that is unavailable or inaccurate in structured data.7,8 When compared with manual chart review of medical records, NLP is more efficient and produces more consistent results.9
We previously developed NLP algorithms for the extraction of cardiovascular variables, such as ejection fraction, aspirin, and warfarin usages.10–12 Recently, we demonstrated NLP’s ability to identify clinical variables from the electrocardiogram treadmill test (ETT) reports.13
In this study, we aim to derive and validate an algorithm to identify and extract MPI results from MPI reports. We applied the NLP algorithms to a large MPI cohort and described whether NLP-classified risk is associated with an increased risk of cardiac events. Our study builds on previous research,13,14 and leverages a unique data set of a substantial patient cohort with MPI testing.
METHODS
Study Setting
We performed this retrospective cohort study at Kaiser Permanente Southern California (KPSC), an integrated healthcare organization with over 7,600 physicians, 15 hospitals, 234 medical offices, and approximately 1 million annual ED visits. KPSC provides prepaid health care to over 4.7 million racially and socio-economically diverse members in KPSC-owned facilities and contracting facilities. In 2007, KPSC implemented an EHR system based on an Epic Systems platform. All KPSC ED sites use the same troponin lab assay (Beckman Coulter Access AccuTnI+3). ED physicians at KPSC can order noninvasive cardiac testing as part of the discharge and follow-up plan of patients with suspected ACS. In May 2016, KPSC implemented the HEART (History, Electrocardiogram, Age, Risk factors, Troponin) score into routine ED care allowing for a standardized risk assessment for patients with suspected ACS.15 The KPSC Institutional Review Board approved this study.
Study Population
We included all KPSC members aged 18 years or older with an ED visit with clinically suspected ACS resulting in a troponin lab order between 01/01/2015 and 11/30/2018, who underwent an MPI within 30 days of their visit. We excluded patients who were transferred from a non-KPSC hospital or passed away during the ED visit. We also excluded patients without KPSC health plan membership because our data set does not accurately capture comorbidities and patient outcomes for non-members. MPI studies were identified using Current Procedural Terminology (CPT®) codes (78451–78452) or a referral order linked to the index ED visit.
We obtained demographic information such as age, sex, and race from administrative records; smoking and family history of coronary artery disease (CAD) from self-reported fields in EHR; medications from our prescription and pharmacy systems. Body mass index (BMI) was measured from ED intake documentation or the most recently available visit. Troponin values were extracted from the lab data. HEART scores calculated at the time of the index ED visit were retrieved from the EHR. Comorbidities were defined using the International Classification of Diseases Ninth/Tenth Revision, Clinical Modification (ICD-9/10-CM) codes included in the Elixhauser score.
MPI Reports
KPSC does not have structured reporting for MPI exams. The MPI reports were dictated or written by the interpreting physicians as unstructured or free-text formats. The MPI reports were saved to the Epic Clarity system running on Oracle Exadata.
Training and Validation Datasets
The necessary size for the validation dataset was 147,16 assuming a prevalence rate of non-normal MPI findings of 13%,17–19 an expected maximum marginal error of 0.1, and NLP sensitivity and specificity of 95% compared with a reference standard.13 We created training (n=120) and validation (n=150) datasets by random sampling from the study population. Two cardiologists (M.F. and M.S.L.) independently reviewed the MPI reports in the training and validation datasets. The cardiologists were blinded to each other’s reviews and abstracted solely based on the reports. The results of physician review were compared, and discrepancies were resolved by consensus and discussion with the other physician on the research team (R.F.R.). The adjudicated results served as the reference standard against which NLP was compared. We compared the agreements between the two physician reviewers and calculated the weighted Cohen’s kappa20 and the intraclass correlation coefficient (ICC).21
NLP Algorithm Development
We developed an NLP based algorithm to extract information from the MPI reports. The basic NLP processes were described previously.9,10 First, we converted the clinical notes extracted from the EHR system into formats suitable for the NLP search. A pre-precessing step removed ill-formatted text and detected sections and sentence boundaries. We created terminologies for MPI-related information. Each report was searched at different scales: section, sentence, and its neighboring sentences. A relationship detection algorithm was applied to identify the associated clinical entities. Negation and temporal relationship algorithms were used to identify and exclude negated, uncertain, historical, and future statements. Negation algorithm handles double negations that are commonly occurred in MPI reports, e.g., ‘no significant abnormality.’ Regular expressions were used to capture the semi-structured information, e.g., left ventricular ejection fraction (EF) values. We extracted information that was commonly available in MPI reports (Figure 1). We derive the final set of variables based on the clinical logic described below. For our study, our main aim was to identify patients with evidence indicating concerns of ACS. Therefore, we categorized our MPI results as follows:
Figure 1. Diagram illustrates the NLP process on MPI reports.
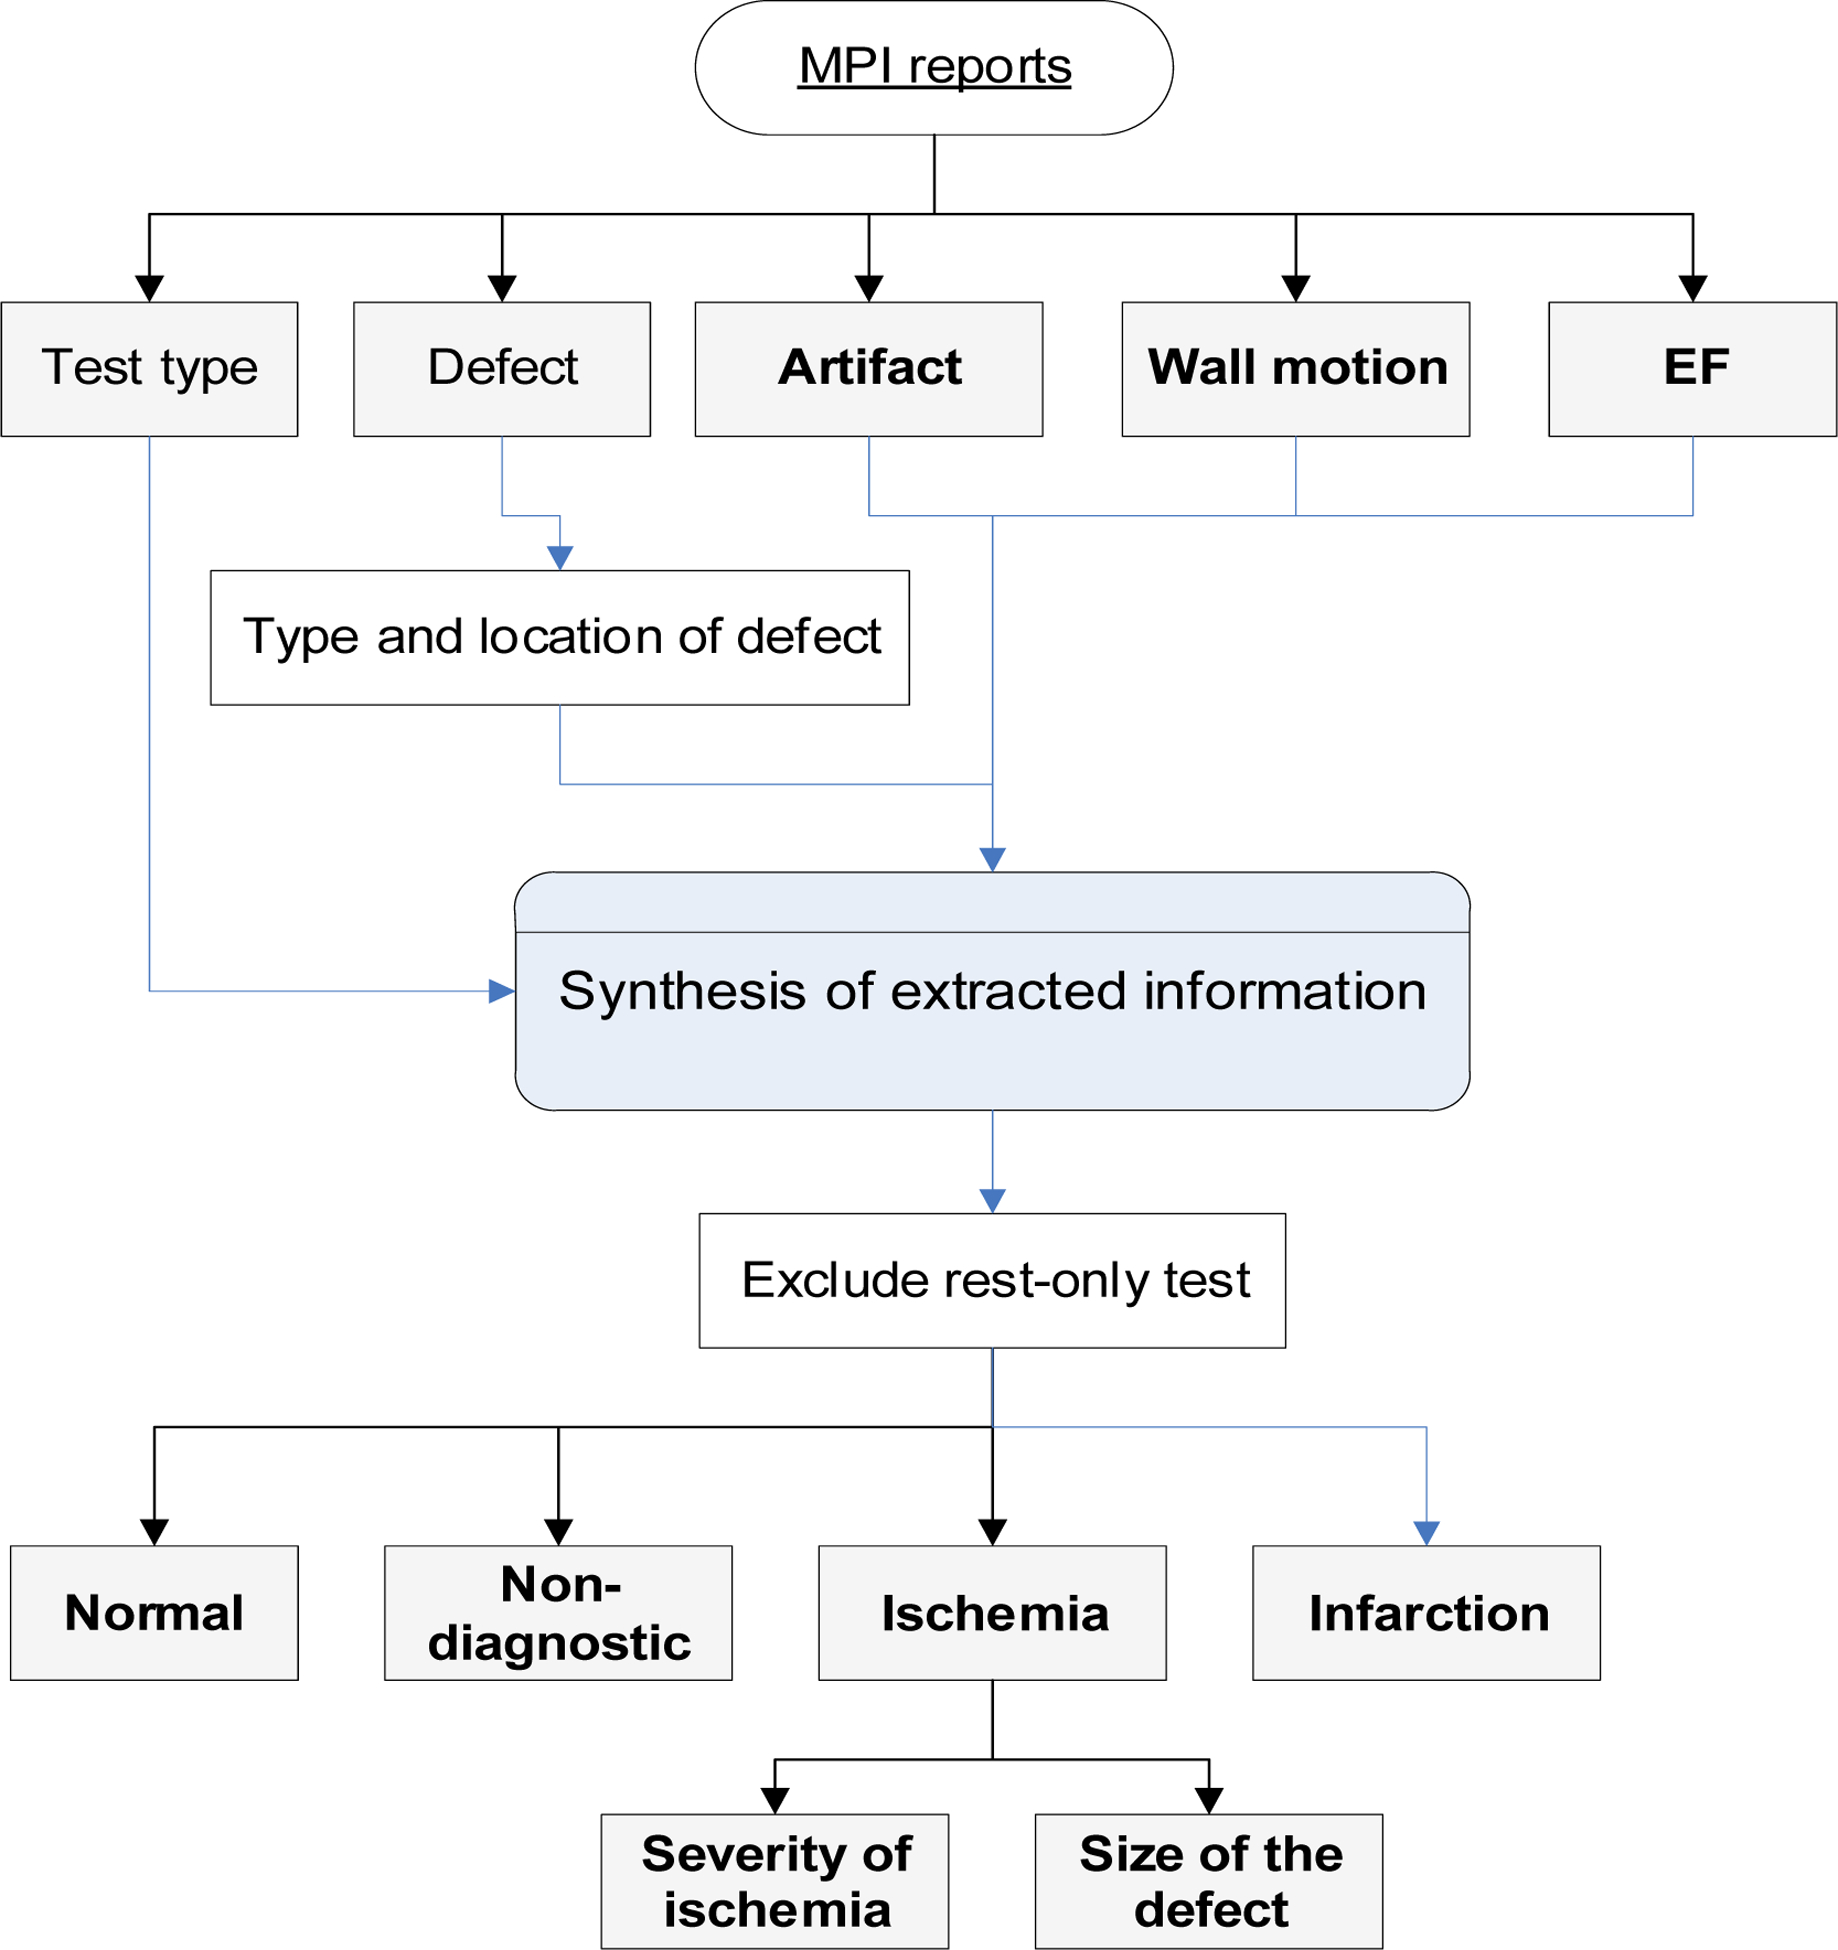
NLP extracted commonly available information from the MPI reports. The extracted information was used to derive the final set of variables based on the clinical logic.
MPI = myocardial perfusion imaging; NLP = natural language processing; EF = ejection fraction.
Ischemia: An ischemic or reversible defect was identified.
Infarction: No definitive ischemic finding, but a fixed or irreversible defect was identified.
Non-diagnostic: Ischemia or infarction cannot be ruled out due to the presence of artifacts or sub-optimal test quality.
Normal: Test quality was sufficient to rule out ischemia or infarction.
For ischemic cases, we further identified ischemic location, size, and severity. For unstated defect size, we estimated it based on the number of left ventricular segments involved. We used the 17-segments model to define the defect size as small (involving 1–2 segments), medium (3–4 segments), and large (≥5 segments).22 We dichotomized the defect size results into “Small_medium” and “Large,” and the defect severity into “Mild_moderate” and “Severe.” The EF result was categorized into abnormal (≤40%), borderline (41–49%), and normal (≥50%).
MPI reports include equivocal findings. For instance, “There is a small sized mild severity, fixed defect in the inferior wall likely due to soft tissue attenuation artifact, although scar cannot be entirely excluded.” Therefore, we built rules to provide a consistent summary interpretation. For example, we used the wall motion and EF values to differentiate defects resulting from ischemia from artifacts.23 If there was no wall motion or EF abnormality, we considered the defect to be an artifact. Since both resting and stress-test are needed to differentiate acute ischemia from old infarction, we excluded MPI tests without both resting and stress test results. The NLP algorithm was developed and iteratively improved using the training dataset. We used the programming language Python to pre-process MPI reports. In terminology development, we used word embedding techniques, which capture the underlying and context representation of words and phrases. To extract information from MPI reports, we used Linguamatics I2E. We built a post-processing step, using Python to integrate and finalize the results based on the information extracted.
Criterion Validity of NLP Algorithm
We evaluated the performance of NLP against the reference standard created by double-blinded review and consensus among cardiologist reviewers. We compared the agreements between the NLP results and the reference standard using weighted Cohen’s kappa and the ICC. For the multi-class MPI result, we dichotomized it by each class in order to calculate the counts of true positive (TP), true negative (TN), false positive (FP), and false negative (FN) for each class. Then for an individual class, we calculate its sensitivity, specificity, positive/negative predictive value (PPV/NPV). We calculate the overall performance metrics based on the sum of counts of TP, TN, FP, and FN as micro-averaged scores for the MPI result. The micro-averaged scores are the preferred performance metrics for multi-class classification with imbalanced data.24
Construct Validity of NLP Algorithm
We applied the NLP algorithms to the entire study cohort and compared the patient characteristics and comorbidities among the different MPI results. We treat the MPI result as a nominal variable rather than an ordinal variable. We included 30-day acute myocardial infarction (AMI) or all-cause mortality, from the date of MPI as a descriptive patient outcome, as well as 30-day major adverse cardiac event (MACE) rates, which was the composite of death, AMI, and any coronary revascularization procedures. We calculated p values using the Chi-square or the Fisher exact test for all the categorical variables and the Wilcoxon test for all the continuous variables. We set the significance threshold at 0.05. We used SAS version 9.4 (SAS Institute, Cary, NC, USA) for data analysis.
RESULTS
Study Population
Our study population included 16,957 patients with a mean age of 69±12 years; 53 % were women, 60% were white (Table 1). Over 45% of the study population had a smoking history, 40% were obese, 38% had a family history of CAD. The mean Elixhauser score was 5.4±3.1. The mean ± standard deviation and median (interquartile range) days from ED to MPI tests were 2.3 (5.6) and 0 (0, 1), respectively. One-third of the patients had a HEART score, and among them, 73.7% and 12.9% respectively had low and moderate-risk HEART scores. The mean troponin level was 0.1 ng/mL. The majority (97.2%) of these patients had a troponin level <0.5 ng/mL (Supplemental Table S1). These 16,957 MPI reports were written by 111 interpreting physicians.
Table 1.
Comparison of patient characteristics by NLP-identified myocardial perfusion imaging results
| Characteristic | Ischemia | Infarction | Non-diagnostics | Normal | Total |
|---|---|---|---|---|---|
| N (%) | 2729 (16.1) | 2070 (12.2) | 262 (1.5) | 11896 (70.2) | 16957 (100) |
| Days between ED and MPI | 2.1 ± 4.9 | 1.7 ± 4.1 | 3.2 (8.4) | 2.4 ± 5.9 | 2.3 ± 5.6 |
| Age | 69.4 ± 11.9 | 70.8 ± 11.5 | 69.5 ± 12.1 | 68.3 ± 12.0 | 68.8 ± 11.9 |
| Female | 1091 (40) | 762 (36.8) | 145 (55.3) | 7029 (59.1) | 9027 (53.2) |
| Hispanic | 721 (26.4) | 517 (25) | 82 (31.3) | 3609 (30.3) | 4929 (29.1) |
| Race | |||||
| White | 1685 (61.7) | 1211 (58.5) | 155 (59.2) | 7109 (59.8) | 10160 (59.9) |
| Black | 420 (15.4) | 448 (21.6) | 44 (16.8) | 1657 (13.9) | 2569 (15.2) |
| Asian | 243 (8.9) | 151 (7.3) | 26 (9.9) | 1332 (11.2) | 1752 (10.3) |
| Alaska Native/Pacific Islander | 60 (2.2) | 27 (1.3) | 5 (1.9) | 190 (1.6) | 282 (1.7) |
| Others | 321 (11.8) | 233 (11.3) | 32 (12.2) | 1608 (13.5) | 2194 (12.9) |
| Body mass index, kg/m2 † | |||||
| <18 | 27 (1) | 25 (1.2) | 4 (1.5) | 102 (0.9) | 158 (0.9) |
| ≥18 & <25 | 564 (20.7) | 521 (25.2) | 59 (22.5) | 2866 (24.1) | 4010 (23.6) |
| ≥25 & < 30 | 901 (33) | 693 (33.5) | 77 (29.4) | 4116 (34.6) | 5787 (34.1) |
| ≥30 & < 35 | 606 (22.2) | 476 (23) | 57 (21.8) | 2579 (21.7) | 3718 (21.9) |
| ≥35 | 610 (22.4) | 342 (16.5) | 63 (24) | 2133 (17.9) | 3148 (18.6) |
| Missing | 21 (0.8) | 13 (0.6) | 2 (0.8) | 100 (0.8) | 136 (0.8) |
| Smoking Behavior | |||||
| Current / Passive | 201 (7.4) | 147 (7.1) | 21 (8) | 664 (5.6) | 1033 (6.1) |
| Former | 1237 (45.3) | 985 (47.6) | 113 (43.1) | 4304 (36.2) | 6639 (39.2) |
| Never | 1284 (47.1) | 934 (45.1) | 125 (47.7) | 6859 (57.7) | 9202 (54.3) |
| Missing | 7 (0.3) | 4 (0.2) | 3 (1.1) | 69 (0.6) | 83 (0.5) |
| Family history of coronary artery disease | 1107 (40.6) | 784 (37.9) | 93 (35.5) | 4443 (37.3) | 6427 (37.9) |
| Medications ‡ | |||||
| ACEi/ARB | 1889 (69.2) | 1397 (67.5) | 150 (57.3) | 6070 (51) | 9506 (56.1) |
| Aldosterone | 159 (5.8) | 203 (9.8) | 9 (3.4) | 359 (3) | 730 (4.3) |
| Beta blocker | 2221 (81.4) | 1647 (79.6) | 170 (64.9) | 5587 (47) | 9625 (56.8) |
| Calcium channel blockers | 849 (31.1) | 565 (27.3) | 72 (27.5) | 3219 (27.1) | 4705 (27.7) |
| Diuretics | 1348 (49.4) | 1138 (55) | 122 (46.6) | 4175 (35.1) | 6783 (40) |
| Vasodilators | 285 (10.4) | 202 (9.8) | 24 (9.2) | 696 (5.9) | 1207 (7.1) |
| Troponin, ng/mL | 0.2 ± 1.3 | 0.3 ± 3.2 | 0.1 ± 0.3 | 0.0 ± 0.9 | 0.1 ± 1.4 |
| HEART score, N | 803 | 604 | 74 | 4061 | 5542 |
| 5.5 ± 1.4 | 5.6 ± 1.4 | 5.3 ± 1.4 | 4.8 ± 1.3 | 5.0 ± 1.4 | |
| HEART score (risk groups) | |||||
| Low (0–3) | 59 (2.2) | 35 (1.7) | 7 (2.7) | 616 (5.2) | 717 (4.2) |
| Moderate (4–6) | 553 (20.3) | 423 (20.4) | 57 (21.8) | 3051 (25.6) | 4084 (24.1) |
| High(≥ 7) | 191 (7) | 146 (7.1) | 10 (3.8) | 394 (3.3) | 741 (4.4) |
| Missing | 1926 (70.6) | 1466 (70.8) | 188 (71.8) | 7835 (65.9) | 11415 (67.3) |
| Elixhauser score | 6.3 ± 3.2 | 6.6 ± 3.2 | 6.0 ± 3.1 | 5.0 ± 3.0 | 5.4 ± 3.1 |
| Comorbidities | |||||
| Atrial fibrillation | 995 (36.5) | 868 (41.9) | 93 (35.5) | 3384 (28.4) | 5340 (31.5) |
| Congestive heart failure | 812 (29.8) | 909 (43.9) | 58 (22.1) | 1307 (11) | 3086 (18.2) |
| Coronary artery disease | 1632 (59.8) | 1200 (58) | 109 (41.6) | 3178 (26.7) | 6119 (36.1) |
| Diabetes | 1485 (54.4) | 1049 (50.7) | 111 (42.4) | 4603 (38.7) | 7248 (42.7) |
| Essential Hypertension | 2348 (86) | 1754 (84.7) | 211 (80.5) | 8982 (75.5) | 13295 (78.4) |
| Lipid Disorder§ | 2345 (85.9) | 1769 (85.5) | 206 (78.6) | 9275 (78) | 13595 (80.2) |
| Renal insufficiency | 1098 (40.2) | 861 (41.6) | 93 (35.5) | 2974 (25) | 5026 (29.6) |
| Stroke | 228 (8.4) | 149 (7.2) | 13 (5) | 501 (4.2) | 891 (5.3) |
Values are mean ± SD or n (%), unless otherwise indicated.
ACEi = angiotensin-converting enzyme inhibitor; ARB = Angiotensin II receptor blockers.
BMI: the last measure before the ED encounter
Medication usage in the 90 days before the ED visits
Dyslipidemia/Hyperlipidemia
We calculated the p values using the Chi-square test for categorical variables and ANOVA for numerical variables. All p values were < .001 for variables listed in this table.
Criterion Validity of NLP Algorithm
The two cardiologists had an excellent agreement on the majority of the variables, with over 90% ICC and Kappa (Supplemental Table S2). They disagreed more on ischemic severity, with 87.6% ICC and 87.3% Kappa. NLP had a similar level of agreement with the reference standard as compared to the agreement between the two cardiologist reviewers (Supplemental Table S2). NLP had a perfect match on ejection fraction, over 95% ICC and Kappa on MPI result, ischemia, and ischemic size, and over 90% ICC and Kappa on ischemic severity, infarction, and artifact.
Compared with the reference standard (n=150), NLP achieved 96.7% sensitivity and PPV, 98.9% specificity, and NPV on MPI results using micro-averaged evaluation metrics (Table 2). NLP achieved 100% sensitivity, 99.2% specificity, 96.9% PPV and 100% NPV on identifying ischemia cases. NLP had lower sensitivity (50%) for non-diagnostic cases partly due to the small number of non-diagnostic cases (n=4). NLP had a lower PPV (89.3%) for identifying infarction.
Table 2.
Comparison of NLP to the reference standard (n=150) for identifying the MPI results
| Confusion Matrix | NLP | ||||
|---|---|---|---|---|---|
| Reference standard | Normal | Non-diagnostic | Infarction | Ischemia | Total |
| Normal | 87 | 0 | 2 | 0 | 89 |
| Non-diagnostic | 1 | 2 | 1 | 0 | 4 |
| Infarction | 0 | 0 | 25 | 1 | 26 |
| Ischemia | 0 | 0 | 0 | 31 | 31 |
| Total | 88 | 2 | 28 | 32 | 150 |
| Accuracy measurements (95% CI) | ||||||||
|---|---|---|---|---|---|---|---|---|
| MPI result | TP | TN | FN | FP | Sensitivity | Specificity | PPV | NPV |
| Normal* | 87 | 60 | 2 | 1 | 97.8 (92.1–99.7) |
98.4 (91.2–100) |
97.8 (91.8–99.4) |
98.4 (89.5–99.8) |
| Non-diagnostic* | 2 | 146 | 2 | 0 | 50 (6.8–93.2) |
100 (97.5–100) |
100 | 98.7 (96.5–99.5) |
| Infarction* | 25 | 121 | 1 | 3 | 96.2 (80.4–99.9) |
97.6 (93.1–99.5) |
89.3 (73.1–96.2) |
99.2 (94.7–99.9) |
| Ischemia* | 31 | 118 | 0 | 1 | 100 (83.8–99.9) |
99.2 (96.9–100) |
96.9 (81.5–99.5) |
100 |
| Micro-averaged † | 145 | 445 | 5 | 5 | 96.7 (92.4–98.9) |
98.9 (97.4–99.6) |
96.7 (92.4–98.6) |
98.9 (97.4–99.5) |
CI = confidence interval; MPI = myocardial perfusion imaging; NLP = natural language processing; FN = false negative; FP = false positive; TN = true negative; TP = true positive; NPV = negative predictive value; PPV = positive predictive value.
For evaluation purposes, we dichotomized the MPI result in the confusion matrix to calculate the counts of TP, TN, FN, FP; and derive the performance metrics for each class.
The MPI result was evaluated using micro-averaging metrics, which were calculated based on the summarized counts of TP, TN, FN, and FP.
Construct Validity of NLP Algorithm
In the overall study population, the percentages of ischemia, infarction, non-diagnostic, and normal MPI results as identified by NLP were 16.1%, 12.2%, 1.5%, and 70.2%, respectively (Table 1). Compared with the patient group with normal MPI results, the groups with ischemia and infarction findings were more likely to be male, have smoking history, have cardiovascular-related comorbidities and medications. Patients with ischemia and non-diagnostic findings were more likely to be obese with BMI ≥35. Compare with other groups, the non-diagnostic group had the highest mean and median days (3.2 and 1) from ED to MPI test. Over 68% of our sample had an undetectable troponin (<0.02 ng/mL) at the ED encounter, and approximately 50% of the MPIs with ischemia or infarction did as well (Supplemental Table S1). Patients who underwent MPI had more cases of moderate (73.7%) and high (13.4%) HEART scores compared with our general ED patients25 (Supplemental Table S3). Among the ischemia cases, the majority had small to medium-size defects and mild to moderate severities (Supplemental Table S4).
Overall 30-day event rates for the study cohort were 4.1% for death/AMI and 5.5% for MACE (Table 3). There were associations of increasing 30-day death/AMI and MACE with MPI results from normal (1.4% and 1.6%) to infarction (7.3% and 8.1%), non-diagnostic (10.7% and 14.1%), and ischemia (12.6% and 20.0%).
Table 3.
30-day major adverse cardiac outcomes stratified by NLP identified MPI results after an emergency department visit for a suspected acute coronary syndrome
| NLP identified MPI results | ||||||
|---|---|---|---|---|---|---|
| Characteristic % | Ischemia | Infarction | Non-diagnostics | Normal | p Value* | Total N (%) |
| N (%) | 2729 (16.1) | 2070 (12.2) | 262 (1.5) | 11896 (70.2) | 16957 (100) | |
| Death or AMI | 12.6 | 7.3 | 10.7 | 1.4 | <.001 | 695 (4.1) |
| Unstable angina | 9.3 | 3.0 | 9.5 | 2.5 | <.001 | 640 (3.8) |
| MACE | 20.0 | 8.1 | 14.1 | 1.6 | <.001 | 939 (5.5) |
| AMI | 12.4 | 6.9 | 10.3 | 1.3 | <.001 | 666 (3.9) |
| Death | 0.5 | 0.6 | 0.4 | 0.1 | <.001 | 39 (0.2) |
| Revascularization | 10.8 | 1.3 | 8.4 | 0.3 | <.001 | 376 (2.2) |
| CABG | 4.5 | 0.4 | 3.8 | 0.1 | <.001 | 152 (0.9) |
| PCI | 6.5 | 0.9 | 4.6 | 0.2 | <.001 | 229 (1.4) |
AMI = acute myocardial infarction; CABG = coronary artery bypass grafting; MPI = myocardial perfusion imaging; MACE = major adverse cardiac events which include AMI, death, CABG, and coronary revascularization; PCI = Percutaneous coronary intervention.
Fisher’s Exact Test
Data was presented as % unless otherwise indicated.
Revascularization includes CABG and PCI.
DISCUSSION
Artificial intelligence (AI), including machine learning (ML) and NLP, has been increasingly adopted within cardiology.26 In cardiovascular imaging, ML has been used to extract imaging variables from raw images and predict outcomes by combining with other clinical variables.27 NLP is another AI-based tool that can identify and extract variables from unstructured text data such as clinical notes and radiology reports. However, NLP is less discussed in cardiovascular imaging, especially in nuclear cardiovascular imaging.
In this study, we developed a computer-based method to identify and extract information from the free-text MPI reports. Compared with the reference standard, the NLP algorithm accurately classified the MPI results. NLP also achieved high accuracy in extracting other clinical variables from the MPI reports, such as ischemic size, severity, artifact, and EF values. To the best of our knowledge, this is the first study to use a computer-based method for abstracting MPI reports. This approach does not depend on any particular clinical features from our institution. Therefore, it will also be applicable to other healthcare institutions.
Based on the NLP-abstracted summary results from the MPI reports, it showed that MPI had good differentiating power in identifying patients at short-term cardiac risk. There were significantly increasing 30-day cardiac event rates with worsening MPI abnormalities. For instance, the patients with ischemia had 9-fold increased 30-day death/AMI rates compared with patients with normal MPI. Compared with our previous studies, the 30-day death/AMI rates for MPI, ETT, and overall ED populations were 4.1%, 0.3%,13 and 0.6%,25 respectively. The type of stress test ordered may reflect the clinician’s perception of a patient’s risk.
Patients with non-diagnostic studies had high 30-day death/AMI rates, even above those with a previous infarct. These non-diagnostic patients were likely heterogeneous since there were a variety of reasons leading to a non-diagnostic MPI. Our results may indicate a need for special attention to patients with non-diagnostic MPI results, who may be at higher than expected risk for adverse events.
Compare with previous studies on ED patients who underwent MPI, the patients in this study were older (mean age 69 vs 52–59), had more cardiovascular-related comorbidities, and a much higher rate of abnormal MPI findings (30% vs 8–20%) (Supplemental Table S5).17–19,28–30 Conversely, the rate of abnormal findings in our study was at the low-end (30% vs 29–49%) compared to studies in non-ED settings.31–33 The differences in the patients’ characteristics of our study from other studies might be related to the integrated model in our institution. The findings in our institution might argue against the national trend of using more noninvasive imaging. For instance, while the US observed a 5-fold increase in noninvasive imaging testing from 1998 to 2008, the rate of ACS diagnosis has dropped by half.34 The decrease in abnormal findings may be attributed to testing younger and healthier patients.
Nevertheless, MPI is still an important diagnostic tool for downstream care. The clarity and completeness of MPI reports are crucial for the risk assessment by the referring providers. However, approximately half of the reports do not adhere to recommended reporting standards, and referring providers frequently misestimate the extent of the ischemia.14 Levy et al. reviewed a set of sample MPI reports from 44 sites in the Veterans Affairs system.14 They found that less than 5% of the reports had an explicit assessment of ischemic risk. However, nearly all of the reports had the data elements to assess the ischemic risk. We found similar and additional challenges in implementing the NLP method. Even in the same institution, there were substantial differences in the format and quality of the MPI reports. We listed three sample reports from this study in the Supplemental Data S1–S3. As demonstrated in the sample reports, MPI reports frequently had ambiguous and hedging words that made accurate interpretation difficult (Supplemental Data S1). Although the majority of these reports described the location of the ischemia, they often were not using the standard terms (Supplemental Data S2). For reports with abnormal findings, the ischemic size and severity were not always clearly stated. Despite these challenges, we found that NLP could provide a coherent summary interpretation by synthesizing the data elements presented in the reports. As an automated method, NLP offers low human review costs, higher efficiency, and consistency.
The MPI reports included in this study were based on conventional free-text reporting. This type of report was generated by dictation or typing with full flexibility. Over the past decades, a number of professional societies have promoted standardized and structured reporting of MPI studies.22,35 Structured reports will increase uniformity, reduce variability and improve readability compared to conventional reports. Since structured reports were still written in natural language, NLP is still necessary to process large numbers of such reports, although it is less challenging to do so. In addition, structured reporting is less likely to resolve all problems in conventional reporting. First, there are variations in structured reporting, such as templates, required components and degrees of standardization.36 Second, despite the promotion of structured reporting, some physicians still favor free-text based reporting.37 Finally, despite improved compliance, the proportion of non-compliant reports still stands at 43% in nuclear cardiology laboratories that applied for accreditation.38 Therefore, in studies performed across multiple institutions, the NLP algorithm must adapt to these heterogeneous types of reports.
Our study has some unique strengths. We validated our algorithm on a large and diverse population within an integrated care system with a comprehensive EHR. Moreover, our prepaid health plan reduced the racial-specific difference in seeking medical care. Furthermore, few studies have focused on the prognostic value of MPI in short-term cardiac events in a population referred from ED with suspected ACS. Our study was able to assess the short-term cardiac outcomes due to the large size of our study population, despite the low event rates.
Study Limitations
Our study has some limitations. MPI results were based on the reading physicians’ interpretations, rather than adjudicated by a core lab. Variations in the accuracy of the test interpretation are expected among physicians. We did not have resources to validate the written MPI reports by re-examining the MPI images. We limited our analyses using the ischemia/infarction related findings since it is often the only information used in clinical decision making by the referring providers. The other variables extracted by NLP could augment the MPI results for a better outcome prediction. Nevertheless, the NLP-extracted variables were not comprehensive. We did not include variables that the MPI reports did not consistently document. Moreover, we limited our analyses on the short-term outcomes since it was the main clinical interest in managing the ED population. Finally, the language and style of reporting can be different across institutions. Our NLP algorithm might perform differently in other testing datasets.
CONCLUSION
The conventional MPI reports documented by dictation or typing are highly variable based on physician preferences and practices complicating the interpretation of results either by referring physicians, researchers, or by automated abstraction. We developed and validated an automated NLP algorithm to abstract the conventional MPI reports with high accuracy. This computational tool could support a population-based studies of MPI results, which would be otherwise infeasible to capture due to the resources needed for manual chart review of thousands of results. Structured reporting could further assist these efforts.
NEW KNOWLEDGE GAINED
Natural language processing provides an efficient way to categorize MPI reports as well as identify and extract other variables from a large number of conventional free-text MPI reports found in electronic health records. Automated abstraction of MPI reports by NLP will facilitate future research to inform how best to manage patients with suspected ACS and to make informed clinical recommendations about which patients may benefit most from MPI.
Supplementary Material
Disclosures
This work was supported by the National Heart, Lung, and Blood Institute of the National Institutes of Health under Award Number R01HL134647. The content is solely the responsibility of the authors and does not necessarily represent the official views of the National Institutes of Health. Author, B.C.S., was a consultant for Medtronic. The remaining authors have no conflicts of interest to report.
Abbreviations
- ACS
acute coronary syndrome
- AMI
acute myocardial infarction
- EHR
electronic health record
- ETT
exercise treadmill test
- ED
emergency department
- EF
ejection fraction
- HEART
History, Electrocardiogram, Age, Risk factors, Troponin
- MACE
major adverse cardiac events
- MPI
myocardial perfusion imaging
- NLP
natural language processing
Footnotes
Publisher's Disclaimer: This Author Accepted Manuscript is a PDF file of an unedited peer-reviewed manuscript that has been accepted for publication but has not been copyedited or corrected. The official version of record that is published in the journal is kept up to date and so may therefore differ from this version.
Disclosures: Author, B.C.S., was a consultant for Medtronic. The remaining authors have no conflicts of interest to report.
References
- 1.Ladapo JA, Blecker S, Douglas PS. Physician decision making and trends in the use of cardiac stress testing in the United States: an analysis of repeated cross-sectional data. Ann Intern Med. 2014;161(7):482–490. [DOI] [PMC free article] [PubMed] [Google Scholar]
- 2.Hachamovitch R, Berman DS, Shaw LJ, et al. Incremental prognostic value of myocardial perfusion single photon emission computed tomography for the prediction of cardiac death: differential stratification for risk of cardiac death and myocardial infarction. Circulation. 1998;97(6):535–543. [DOI] [PubMed] [Google Scholar]
- 3.Metz LD, Beattie M, Hom R, Redberg RF, Grady D, Fleischmann KE. The prognostic value of normal exercise myocardial perfusion imaging and exercise echocardiography: a meta-analysis. J Am Coll Cardiol. 2007;49(2):227–237. [DOI] [PubMed] [Google Scholar]
- 4.Redberg RF. Stress testing in the emergency department: not which test but whether any test should be done. JAMA Intern Med. 2015;175(3):436. [DOI] [PubMed] [Google Scholar]
- 5.Foy AJ, Liu G, Davidson WR, Jr., Sciamanna C, Leslie DL. Comparative effectiveness of diagnostic testing strategies in emergency department patients with chest pain: an analysis of downstream testing, interventions, and outcomes. JAMA Intern Med. 2015;175(3):428–436. [DOI] [PMC free article] [PubMed] [Google Scholar]
- 6.Prasad V, Cheung M, Cifu A. Chest pain in the emergency department: the case against our current practice of routine noninvasive testing. Arch Intern Med. 2012;172(19):1506–1509. [DOI] [PubMed] [Google Scholar]
- 7.Donaldson MS, Corrigan JM, Kohn LT. To err is human: building a safer health system. Vol 6: National Academies Press; 2000. [PubMed] [Google Scholar]
- 8.Weiskopf NG, Weng C. Methods and dimensions of electronic health record data quality assessment: enabling reuse for clinical research. J Am Med Inform Assoc. 2013;20(1):144–151. [DOI] [PMC free article] [PubMed] [Google Scholar]
- 9.Zheng C, Rashid N, Wu YL, et al. Using natural language processing and machine learning to identify gout flares from electronic clinical notes. Arthritis Care Res (Hoboken). 2014;66(11):1740–1748. [DOI] [PubMed] [Google Scholar]
- 10.Zheng C, Rashid N, Koblick R, An J. Medication Extraction from Electronic Clinical Notes in an Integrated Health System: A Study on Aspirin Use in Patients with Nonvalvular Atrial Fibrillation. Clin Ther. 2015;37(9):2048–2058 e2042. [DOI] [PubMed] [Google Scholar]
- 11.Xie F, Zheng C, Yuh-Jer Shen A, Chen W. Extracting and analyzing ejection fraction values from electronic echocardiography reports in a large health maintenance organization. Health Informatics J. 2017;23(4):319–328. [DOI] [PubMed] [Google Scholar]
- 12.An J, Niu F, Zheng C, et al. Warfarin Management and Outcomes in Patients with Nonvalvular Atrial Fibrillation Within an Integrated Health Care System. J Manag Care Spec Pharm. 2017;23(6):700–712. [DOI] [PMC free article] [PubMed] [Google Scholar]
- 13.Zheng C, Sun BC, Wu YL, et al. Automated Identification and Extraction of Exercise Treadmill Test Results. Journal of the American Heart Association. 2020;9(5):e014940. [DOI] [PMC free article] [PubMed] [Google Scholar]
- 14.Levy AE, Shah NR, Matheny ME, Reeves RM, Gobbel GT, Bradley SM. Determining post-test risk in a national sample of stress nuclear myocardial perfusion imaging reports: Implications for natural language processing tools. J Nucl Cardiol. 2018. [DOI] [PMC free article] [PubMed] [Google Scholar]
- 15.Sharp AL, Wu YL, Shen E, et al. The HEART Score for Suspected Acute Coronary Syndrome in U.S. Emergency Departments. J Am Coll Cardiol. 2018;72(15):1875–1877. [DOI] [PMC free article] [PubMed] [Google Scholar]
- 16.Naing L, Winn T, Rusli B. Practical issues in calculating the sample size for prevalence studies. Archives of orofacial Sciences. 2006;1:9–14. [Google Scholar]
- 17.Hermann LK, Newman DH, Pleasant WA, et al. Yield of routine provocative cardiac testing among patients in an emergency department-based chest pain unit. JAMA Intern Med. 2013;173(12):1128–1133. [DOI] [PubMed] [Google Scholar]
- 18.Duvall WL, Wijetunga MN, Klein TM, et al. Stress-only Tc-99m myocardial perfusion imaging in an emergency department chest pain unit. J Emerg Med. 2012;42(6):642–650. [DOI] [PubMed] [Google Scholar]
- 19.Cremer PC, Khalaf S, Agarwal S, et al. Myocardial perfusion imaging in emergency department patients with negative cardiac biomarkers: yield for detecting ischemia, short-term events, and impact of downstream revascularization on mortality. Circ Cardiovasc Imaging. 2014;7(6):912–919. [DOI] [PubMed] [Google Scholar]
- 20.McHugh ML. Interrater reliability: the kappa statistic. Biochem Med (Zagreb). 2012;22(3):276–282. [PMC free article] [PubMed] [Google Scholar]
- 21.Shrout PE, Fleiss JL. Intraclass correlations: uses in assessing rater reliability. Psychol Bull. 1979;86(2):420–428. [DOI] [PubMed] [Google Scholar]
- 22.Tilkemeier PL, Bourque J, Doukky R, Sanghani R, Weinberg RL. ASNC imaging guidelines for nuclear cardiology procedures : Standardized reporting of nuclear cardiology procedures. J Nucl Cardiol. 2017;24(6):2064–2128. [DOI] [PubMed] [Google Scholar]
- 23.Kontos MC, Diercks DB, Kirk JD. Emergency department and office-based evaluation of patients with chest pain. Mayo Clin Proc. 2010;85(3):284–299. [DOI] [PMC free article] [PubMed] [Google Scholar]
- 24.Sokolova M, Lapalme G. A systematic analysis of performance measures for classification tasks. Inf Process Manag. 2009;45(4):427–437. [Google Scholar]
- 25.Sharp AL, Baecker AS, Shen E, et al. Effect of a HEART Care Pathway on Chest Pain Management Within an Integrated Health System. Ann Emerg Med. 2019;74(2):171–180. [DOI] [PMC free article] [PubMed] [Google Scholar]
- 26.Dey D, Slomka PJ, Leeson P, et al. Artificial Intelligence in Cardiovascular Imaging: JACC State-of-the-Art Review. J Am Coll Cardiol. 2019;73(11):1317–1335. [DOI] [PMC free article] [PubMed] [Google Scholar]
- 27.Al’Aref SJ, Anchouche K, Singh G, et al. Clinical applications of machine learning in cardiovascular disease and its relevance to cardiac imaging. Eur Heart J. 2019;40(24):1975–1986. [DOI] [PubMed] [Google Scholar]
- 28.Udelson JE, Beshansky JR, Ballin DS, et al. Myocardial perfusion imaging for evaluation and triage of patients with suspected acute cardiac ischemia: a randomized controlled trial. JAMA. 2002;288(21):2693–2700. [DOI] [PubMed] [Google Scholar]
- 29.Lim SH, Anantharaman V, Sundram F, et al. Stress myocardial perfusion imaging for the evaluation and triage of chest pain in the emergency department: a randomized controlled trial. J Nucl Cardiol. 2013;20(6):1002–1012. [DOI] [PubMed] [Google Scholar]
- 30.Nabi F, Chang SM, Xu J, Gigliotti E, Mahmarian JJ. Assessing risk in acute chest pain: The value of stress myocardial perfusion imaging in patients admitted through the emergency department. J Nucl Cardiol. 2012;19(2):233–243. [DOI] [PubMed] [Google Scholar]
- 31.Berman DS, Kang X, Hayes SW, et al. Adenosine myocardial perfusion single-photon emission computed tomography in women compared with men. Impact of diabetes mellitus on incremental prognostic value and effect on patient management. J Am Coll Cardiol. 2003;41(7):1125–1133. [DOI] [PubMed] [Google Scholar]
- 32.Navare SM, Mather JF, Shaw LJ, Fowler MS, Heller GV. Comparison of risk stratification with pharmacologic and exercise stress myocardial perfusion imaging: a meta-analysis. J Nucl Cardiol. 2004;11(5):551–561. [DOI] [PubMed] [Google Scholar]
- 33.Chang SM, Nabi F, Xu J, Raza U, Mahmarian JJ. Normal stress-only versus standard stress/rest myocardial perfusion imaging: similar patient mortality with reduced radiation exposure. J Am Coll Cardiol. 2010;55(3):221–230. [DOI] [PubMed] [Google Scholar]
- 34.Bhuiya FA, Pitts SR, McCaig LF. Emergency department visits for chest pain and abdominal pain: United States, 1999–2008. NCHS Data Brief. 2010(43):1–8. [PubMed] [Google Scholar]
- 35.Douglas PS, Hendel RC, Cummings JE, et al. ACCF/ACR/AHA/ASE/ASNC/HRS/NASCI/RSNA/SAIP/SCAI/SCCT/SCMR 2008 Health Policy Statement on Structured Reporting in Cardiovascular Imaging. J Am Coll Cardiol. 2009;53(1):76–90. [DOI] [PubMed] [Google Scholar]
- 36.Nobel JM, Kok EM, Robben SGF. Redefining the structure of structured reporting in radiology. Insights Imaging. 2020;11(1):10. [DOI] [PMC free article] [PubMed] [Google Scholar]
- 37.Wu E, Holly TA. Nuclear cardiology reporting: Leaving an impression. J Nucl Cardiol. 2019;26(6):1886–1887. [DOI] [PubMed] [Google Scholar]
- 38.Maddux PT, Farrell MB, Ewing JA, Tilkemeier PL. Improved compliance with reporting standards: A retrospective analysis of Intersocietal Accreditation Commission Nuclear Cardiology Laboratories. J Nucl Cardiol. 2018;25(3):986–994. [DOI] [PubMed] [Google Scholar]
Associated Data
This section collects any data citations, data availability statements, or supplementary materials included in this article.